EP1544837A1 - Method and device for reducing the effect of differences in scan line load - Google Patents
Method and device for reducing the effect of differences in scan line load Download PDFInfo
- Publication number
- EP1544837A1 EP1544837A1 EP03293194A EP03293194A EP1544837A1 EP 1544837 A1 EP1544837 A1 EP 1544837A1 EP 03293194 A EP03293194 A EP 03293194A EP 03293194 A EP03293194 A EP 03293194A EP 1544837 A1 EP1544837 A1 EP 1544837A1
- Authority
- EP
- European Patent Office
- Prior art keywords
- subfield
- load
- maximal
- sustain
- luminous elements
- Prior art date
- Legal status (The legal status is an assumption and is not a legal conclusion. Google has not performed a legal analysis and makes no representation as to the accuracy of the status listed.)
- Withdrawn
Links
- 230000000694 effects Effects 0.000 title claims abstract description 49
- 238000000034 method Methods 0.000 title claims abstract description 21
- 230000002085 persistent effect Effects 0.000 claims abstract description 9
- 238000004364 calculation method Methods 0.000 claims description 4
- 238000004458 analytical method Methods 0.000 description 7
- 238000010586 diagram Methods 0.000 description 6
- 230000007423 decrease Effects 0.000 description 5
- 238000007726 management method Methods 0.000 description 5
- 239000003086 colorant Substances 0.000 description 2
- 238000005516 engineering process Methods 0.000 description 2
- 238000001914 filtration Methods 0.000 description 2
- 230000006870 function Effects 0.000 description 2
- 230000004048 modification Effects 0.000 description 2
- 238000012986 modification Methods 0.000 description 2
- 230000009467 reduction Effects 0.000 description 2
- 229910052724 xenon Inorganic materials 0.000 description 2
- FHNFHKCVQCLJFQ-UHFFFAOYSA-N xenon atom Chemical compound [Xe] FHNFHKCVQCLJFQ-UHFFFAOYSA-N 0.000 description 2
- PEDCQBHIVMGVHV-UHFFFAOYSA-N Glycerine Chemical compound OCC(O)CO PEDCQBHIVMGVHV-UHFFFAOYSA-N 0.000 description 1
- 230000003213 activating effect Effects 0.000 description 1
- 230000008859 change Effects 0.000 description 1
- 238000001514 detection method Methods 0.000 description 1
- 230000008569 process Effects 0.000 description 1
- 238000013139 quantization Methods 0.000 description 1
- 230000004044 response Effects 0.000 description 1
- 230000002123 temporal effect Effects 0.000 description 1
- 230000000007 visual effect Effects 0.000 description 1
Images


Classifications
-
- G—PHYSICS
- G09—EDUCATION; CRYPTOGRAPHY; DISPLAY; ADVERTISING; SEALS
- G09G—ARRANGEMENTS OR CIRCUITS FOR CONTROL OF INDICATING DEVICES USING STATIC MEANS TO PRESENT VARIABLE INFORMATION
- G09G3/00—Control arrangements or circuits, of interest only in connection with visual indicators other than cathode-ray tubes
- G09G3/20—Control arrangements or circuits, of interest only in connection with visual indicators other than cathode-ray tubes for presentation of an assembly of a number of characters, e.g. a page, by composing the assembly by combination of individual elements arranged in a matrix no fixed position being assigned to or needed to be assigned to the individual characters or partial characters
- G09G3/2007—Display of intermediate tones
- G09G3/2018—Display of intermediate tones by time modulation using two or more time intervals
- G09G3/2022—Display of intermediate tones by time modulation using two or more time intervals using sub-frames
- G09G3/2029—Display of intermediate tones by time modulation using two or more time intervals using sub-frames the sub-frames having non-binary weights
-
- G—PHYSICS
- G09—EDUCATION; CRYPTOGRAPHY; DISPLAY; ADVERTISING; SEALS
- G09G—ARRANGEMENTS OR CIRCUITS FOR CONTROL OF INDICATING DEVICES USING STATIC MEANS TO PRESENT VARIABLE INFORMATION
- G09G3/00—Control arrangements or circuits, of interest only in connection with visual indicators other than cathode-ray tubes
- G09G3/20—Control arrangements or circuits, of interest only in connection with visual indicators other than cathode-ray tubes for presentation of an assembly of a number of characters, e.g. a page, by composing the assembly by combination of individual elements arranged in a matrix no fixed position being assigned to or needed to be assigned to the individual characters or partial characters
- G09G3/22—Control arrangements or circuits, of interest only in connection with visual indicators other than cathode-ray tubes for presentation of an assembly of a number of characters, e.g. a page, by composing the assembly by combination of individual elements arranged in a matrix no fixed position being assigned to or needed to be assigned to the individual characters or partial characters using controlled light sources
- G09G3/28—Control arrangements or circuits, of interest only in connection with visual indicators other than cathode-ray tubes for presentation of an assembly of a number of characters, e.g. a page, by composing the assembly by combination of individual elements arranged in a matrix no fixed position being assigned to or needed to be assigned to the individual characters or partial characters using controlled light sources using luminous gas-discharge panels, e.g. plasma panels
- G09G3/288—Control arrangements or circuits, of interest only in connection with visual indicators other than cathode-ray tubes for presentation of an assembly of a number of characters, e.g. a page, by composing the assembly by combination of individual elements arranged in a matrix no fixed position being assigned to or needed to be assigned to the individual characters or partial characters using controlled light sources using luminous gas-discharge panels, e.g. plasma panels using AC panels
- G09G3/291—Control arrangements or circuits, of interest only in connection with visual indicators other than cathode-ray tubes for presentation of an assembly of a number of characters, e.g. a page, by composing the assembly by combination of individual elements arranged in a matrix no fixed position being assigned to or needed to be assigned to the individual characters or partial characters using controlled light sources using luminous gas-discharge panels, e.g. plasma panels using AC panels controlling the gas discharge to control a cell condition, e.g. by means of specific pulse shapes
- G09G3/294—Control arrangements or circuits, of interest only in connection with visual indicators other than cathode-ray tubes for presentation of an assembly of a number of characters, e.g. a page, by composing the assembly by combination of individual elements arranged in a matrix no fixed position being assigned to or needed to be assigned to the individual characters or partial characters using controlled light sources using luminous gas-discharge panels, e.g. plasma panels using AC panels controlling the gas discharge to control a cell condition, e.g. by means of specific pulse shapes for lighting or sustain discharge
- G09G3/2946—Control arrangements or circuits, of interest only in connection with visual indicators other than cathode-ray tubes for presentation of an assembly of a number of characters, e.g. a page, by composing the assembly by combination of individual elements arranged in a matrix no fixed position being assigned to or needed to be assigned to the individual characters or partial characters using controlled light sources using luminous gas-discharge panels, e.g. plasma panels using AC panels controlling the gas discharge to control a cell condition, e.g. by means of specific pulse shapes for lighting or sustain discharge by introducing variations of the frequency of sustain pulses within a frame or non-proportional variations of the number of sustain pulses in each subfield
-
- G—PHYSICS
- G09—EDUCATION; CRYPTOGRAPHY; DISPLAY; ADVERTISING; SEALS
- G09G—ARRANGEMENTS OR CIRCUITS FOR CONTROL OF INDICATING DEVICES USING STATIC MEANS TO PRESENT VARIABLE INFORMATION
- G09G2320/00—Control of display operating conditions
- G09G2320/02—Improving the quality of display appearance
- G09G2320/0285—Improving the quality of display appearance using tables for spatial correction of display data
-
- G—PHYSICS
- G09—EDUCATION; CRYPTOGRAPHY; DISPLAY; ADVERTISING; SEALS
- G09G—ARRANGEMENTS OR CIRCUITS FOR CONTROL OF INDICATING DEVICES USING STATIC MEANS TO PRESENT VARIABLE INFORMATION
- G09G2320/00—Control of display operating conditions
- G09G2320/06—Adjustment of display parameters
- G09G2320/0626—Adjustment of display parameters for control of overall brightness
-
- G—PHYSICS
- G09—EDUCATION; CRYPTOGRAPHY; DISPLAY; ADVERTISING; SEALS
- G09G—ARRANGEMENTS OR CIRCUITS FOR CONTROL OF INDICATING DEVICES USING STATIC MEANS TO PRESENT VARIABLE INFORMATION
- G09G2330/00—Aspects of power supply; Aspects of display protection and defect management
- G09G2330/02—Details of power systems and of start or stop of display operation
- G09G2330/021—Power management, e.g. power saving
-
- G—PHYSICS
- G09—EDUCATION; CRYPTOGRAPHY; DISPLAY; ADVERTISING; SEALS
- G09G—ARRANGEMENTS OR CIRCUITS FOR CONTROL OF INDICATING DEVICES USING STATIC MEANS TO PRESENT VARIABLE INFORMATION
- G09G2360/00—Aspects of the architecture of display systems
- G09G2360/16—Calculation or use of calculated indices related to luminance levels in display data
Definitions
- the present invention relates to a method for processing data of a picture to be displayed on a display panel with persistent luminous elements in order to reduce load effect in said display means.
- High contrast is an essential factor for evaluating the picture quality of every display technologies. From this perspective, a high peak-white luminance is always required to achieve a good contrast ratio and, as a result, a good picture performance even with ambient light conditions. Otherwise, the success of a new display technology requires also a well-balanced power consumption. For every kind of active display, more peak luminance corresponds also to a higher power that flows in the electronic of the display. Therefore, if no specific management is done, the enhancement of the peak luminance for a given electronic efficacy will lead to an increase of the power consumption. So, it is common to use a power management concept to stabilize the power consumption of the display.
- figure 1 enables to avoid any overloading of the power supply as well as a maximum contrast for a given picture.
- the power management is based on a so called ABM function (Average Beamcurrent Limiter), which is implemented by analog means, and which decreases video gain as a function of average luminance, usually measured over a RC stage.
- ABM function Average Beamcurrent Limiter
- the luminance as well as the power consumption is directly linked to the number of sustain pulses (light pulses) per frame. As shown on Figure 2, the number of sustain pulses for peak white decreases as the picture load, which corresponds to the Average Power Level (APL) of the picture, increases for keeping constant the power consumption.
- APL Average Power Level
- APL Average Power Level
- a maximal number of sustain pulses is fixed for the peak white pixels for keeping constant the power consumption of the PDP. Since, only an integer number of sustain pulses can be used, there is only a limited number of available APL values. In theory, the number of sustain pulses that can be displayed for the peak white pixels can be very high. Indeed, if the picture load tends to zero, the power consumption tends also to zero, and the maximal number of sustain pulses for a constant power consumption tends to infinite. However, the maximal number of sustain pulses defining the maximal peak white (peak white for a picture load of 0%) is limited by the available time in a frame for the sustaining and by the minimum duration of a sustain pulse.
- Figure 3 illustrates the duration and the content of a frame comprising 12 subfields having different weights, each subfield comprising an addressing period for activating the cells of the panel and a sustaining period for illuminating the activated cells of the panel.
- the duration of the addressing period is identical for each subfield and the duration of the sustaining period is proportional to the weight of the subfield.
- the number of subfield is kept to a minimum ensuring an acceptable grayscale portrayal (with few false contour effects), the addressing speed is increased to a maximum keeping an acceptable panel behavior (response fidelity) and the sustain pulse duration is kept to a minimum but having an acceptable efficacy.
- the line load effect itself represents a dependence of subfield luminance towards its horizontal distribution. In that case, it does not matter to know the load of the subfield but rather to know the differences of load between two consecutive lines for the same subfield.
- the line load effect is much more critical than for video pictures which suffer mainly from a global load effect.
- the load effect is not only limited to the line load but also to a global load of the subfield in a frame. Indeed, if a subfield is globally more used than another one on the whole screen, it will have less luminance per sustain pulse due to this load effect (the losses occur in the screen and in the electronic circuitry).
- the load effect has an impact on the grayscale portrayal under the form of a kind of solarization effect which looks like a lack of gray levels.
- the right picture seems to be coded with fewer bits than the left one. This is due to the fact that some subfields are suddenly less luminous than they should be. In that case, if we consider two video levels that should have similar luminance, and if one of them is using such a subfield, its global luminance will be too low compared to the other video level introducing a disturbing effect.
- An object of the method of the invention is to reduce the line load effect that is directly linked to the capacity of a line and not the global load effect that can be compensated by other methods.
- the method of the invention can be used independently to those methods when a PC mode is selected or in addition to one of them since they are compatible.
- the invention is based on a profile analysis of the line load for each subfield to determine if this subfield is more or less critical to line load effect. If such a subfield is detected, its sustain frequency is reduced to minimize the load effect.
- the invention relates to a method and a device for reducing such a load effect in a display panel with persistent luminous elements.
- the invention concerns a method for processing data of a picture to be displayed on a display panel with persistent luminous elements during a frame comprising a plurality of subfields, each subfield comprising an addressing phase during which the luminous elements of the panel are activated or not in accordance with the picture data and a sustain phase during which the activated luminous elements are illuminated by sustain pulses. It comprises the following steps :
- the calculation of the maximal load difference is only carried out only for lines whose load is greater than a minimal load.
- This minimal load is for example equal to 10% of the amount of luminous elements in a line of the display panel.
- the maximal load difference between two consecutive lines of the display panel is calculated, for each subfield, on the current frame and a plurality of frames preceding said current frame in order to avoid changes in picture luminance when some minor modifications are happening.
- the maximal load difference used for selecting the sustain frequency is then the mean value of the maximal load differences calculated for said plurality of frames.
- the number of sustain pulses of each subfield is adjusted in accordance with the number of luminous elements to be activated for displaying the current picture and with the selected sustain frequency for said subfield.
- the invention concerns also a device for processing data of a picture to be displayed on a display panel with persistent luminous elements during a frame comprising a plurality of subfields, each subfield comprising an addressing phase during which the luminous elements of the panel are activated or not in accordance with the picture data and a sustain phase during which the activated luminous elements are illuminated by sustain pulses. It comprises :
- the invention concerns also a plasma display panel comprising a plurality of persistent luminous elements organized in rows and columns and said device for reducing load effect.
- the method of the invention is based on an analysis of the line load of each subfield in order to determine if this subfield is more or less critical to the so-called "line load effect". If such an effect is detected for a subfield, its sustain frequency is reduced to minimize the load effect.
- the frame comprises 11 subfields with the following weights :
- the first one is a video sequence not critical for line load effect and the second one is a computer sequence comprising geometrical patterns that is more critical for line-load effect.
- the video sequence shown on the left side of Figure 6 represents an "european man face".
- the global load per subfield for that sequence displayed on a WVGA screen with 852x480x3 cells (or luminous elements) is given by the histogram of the left side of the figure and by the below table.
- the load of a subfield is the amount (or number) of activated cells of the panel during said subfield.
- the subfield load is expressed as a percentage of the total amount of cells of the panel.
- Subfield Weigth Load 1 1 63.24% 2 2 74.69% 3 3 73.94% 4 5 79.73% 5 8 88.45% 6 12 77.34% 7 18 32.67% 8 27 81.26% 9 41 12.12% 10 58 3.94% 11 80 0.43%
- the subfield SF7 is less loaded than its neighbors (SF1, SF2, SF3, SF4, SF5, SF6, SF8). This introduces a so-called solarization or quantization effect since the subfield SF7 will be proportionally more luminous than the other ones.
- the distribution line by line of the global load of each subfield is represented by the figure 7.
- the horizontal axis represents the lines of the picture (480 lines in WVGA) and the vertical axis represents the number of illuminated pixels (up to 852 in WVGA) per line.
- a curve is drawn for each subfield.
- the computer picture shown at the left side of Figure 8 is a picture of a histogram with some text, notably a title "Analysis of line-load effect" on a dark area at the top of the picture and a comment "Results shows serious issues on picture quality" on a white area at the bottom of the picture.
- the global load per subfield for that sequence is given by the histogram on the right side of Figure 8 and by the below table : Subfield Weigth Load 1 1 54.66% 2 2 68.72% 3 3 62.00% 4 5 59.02% 5 8 72.33% 6 12 78.64% 7 18 58.30% 8 27 42.17% 9 41 74.87% 10 58 77.90% 11 80 73.58%
- the load of the various subfields is more homogeneous than in the case of the video sequence.
- the distribution line by line of the global load of each subfield is represented by the figure 9 to be compared with Figure 7.
- This maximal line load difference is equal to 590 for subfield SF9 and SF10. It introduces, for these subfields, a big difference of luminance from one line to the next one.
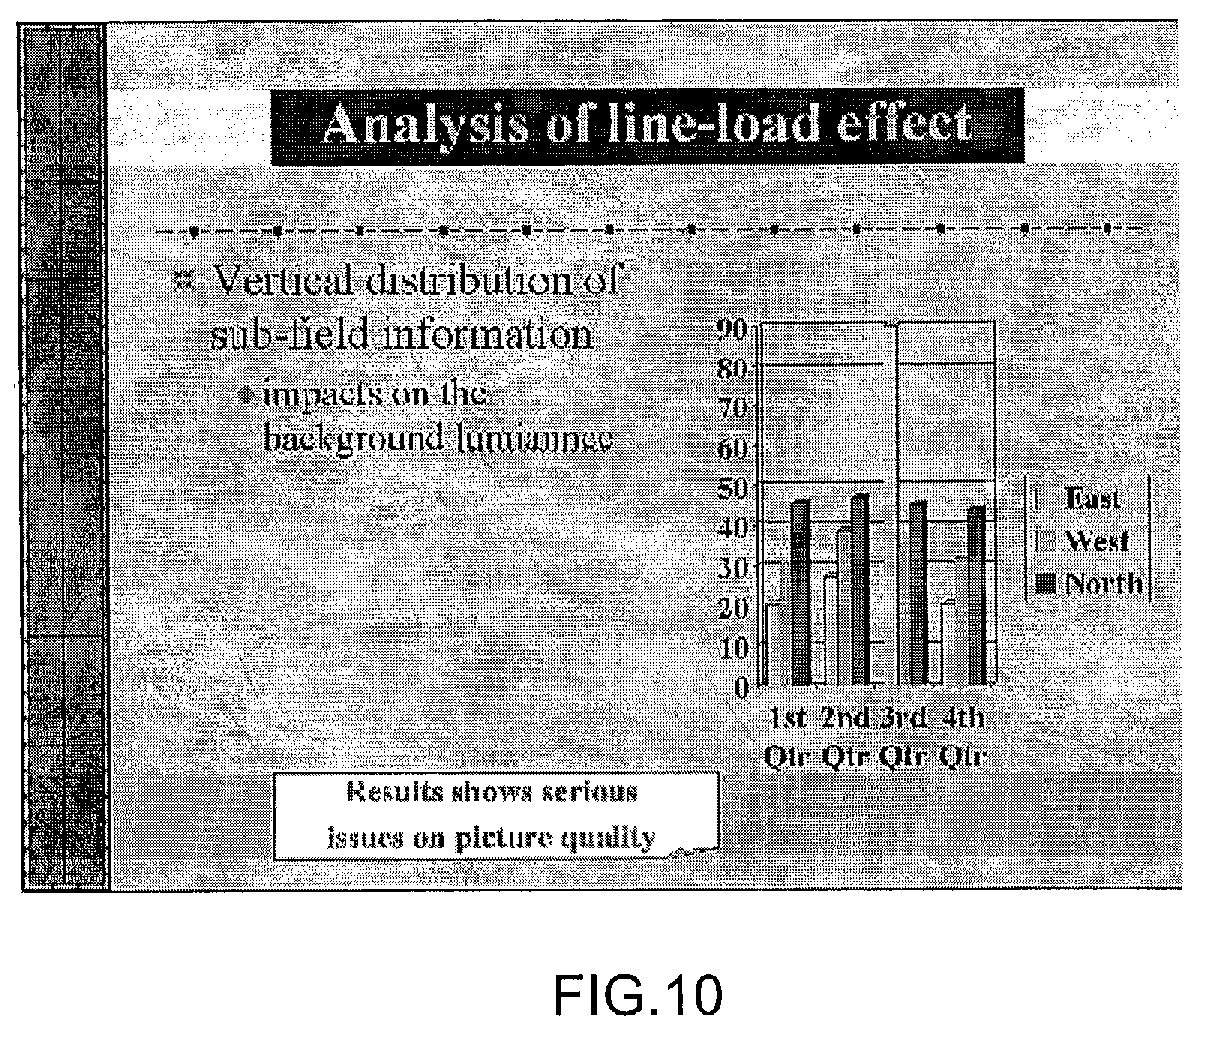
- the load effect manifests itself by an enhancement of the luminance of the background behind the dark area of the title as shown on Figure 10. At the bottom of the picture, it is the opposite.
- the white area introduces a reduction of the luminance of the background since the corresponding lines are more loaded.
- the main idea of the invention is to adjust the sustain frequency of each subfield in accordance with its load. More particularly, the line load difference between two consecutive lines is analyzed for each subfield and the sustain frequency of the subfield is selected in accordance with its maximal line load difference.
- the lines with a low load for the current subfield are not analyzed. Indeed, it makes no sense to evaluate the influence of the load of a subfield if this subfield is not enough used. Therefore, in the analysis of the difference between two consecutive lines, we limit the analysis to lines that have at least 10% of illuminated cells. This limit is referenced MinLoad.
- the line load difference Diff(L,n) between two consecutive lines L and L+1 for a subfield n is computed as following : where Load(L,n) is the load of the line L for the subfield n.
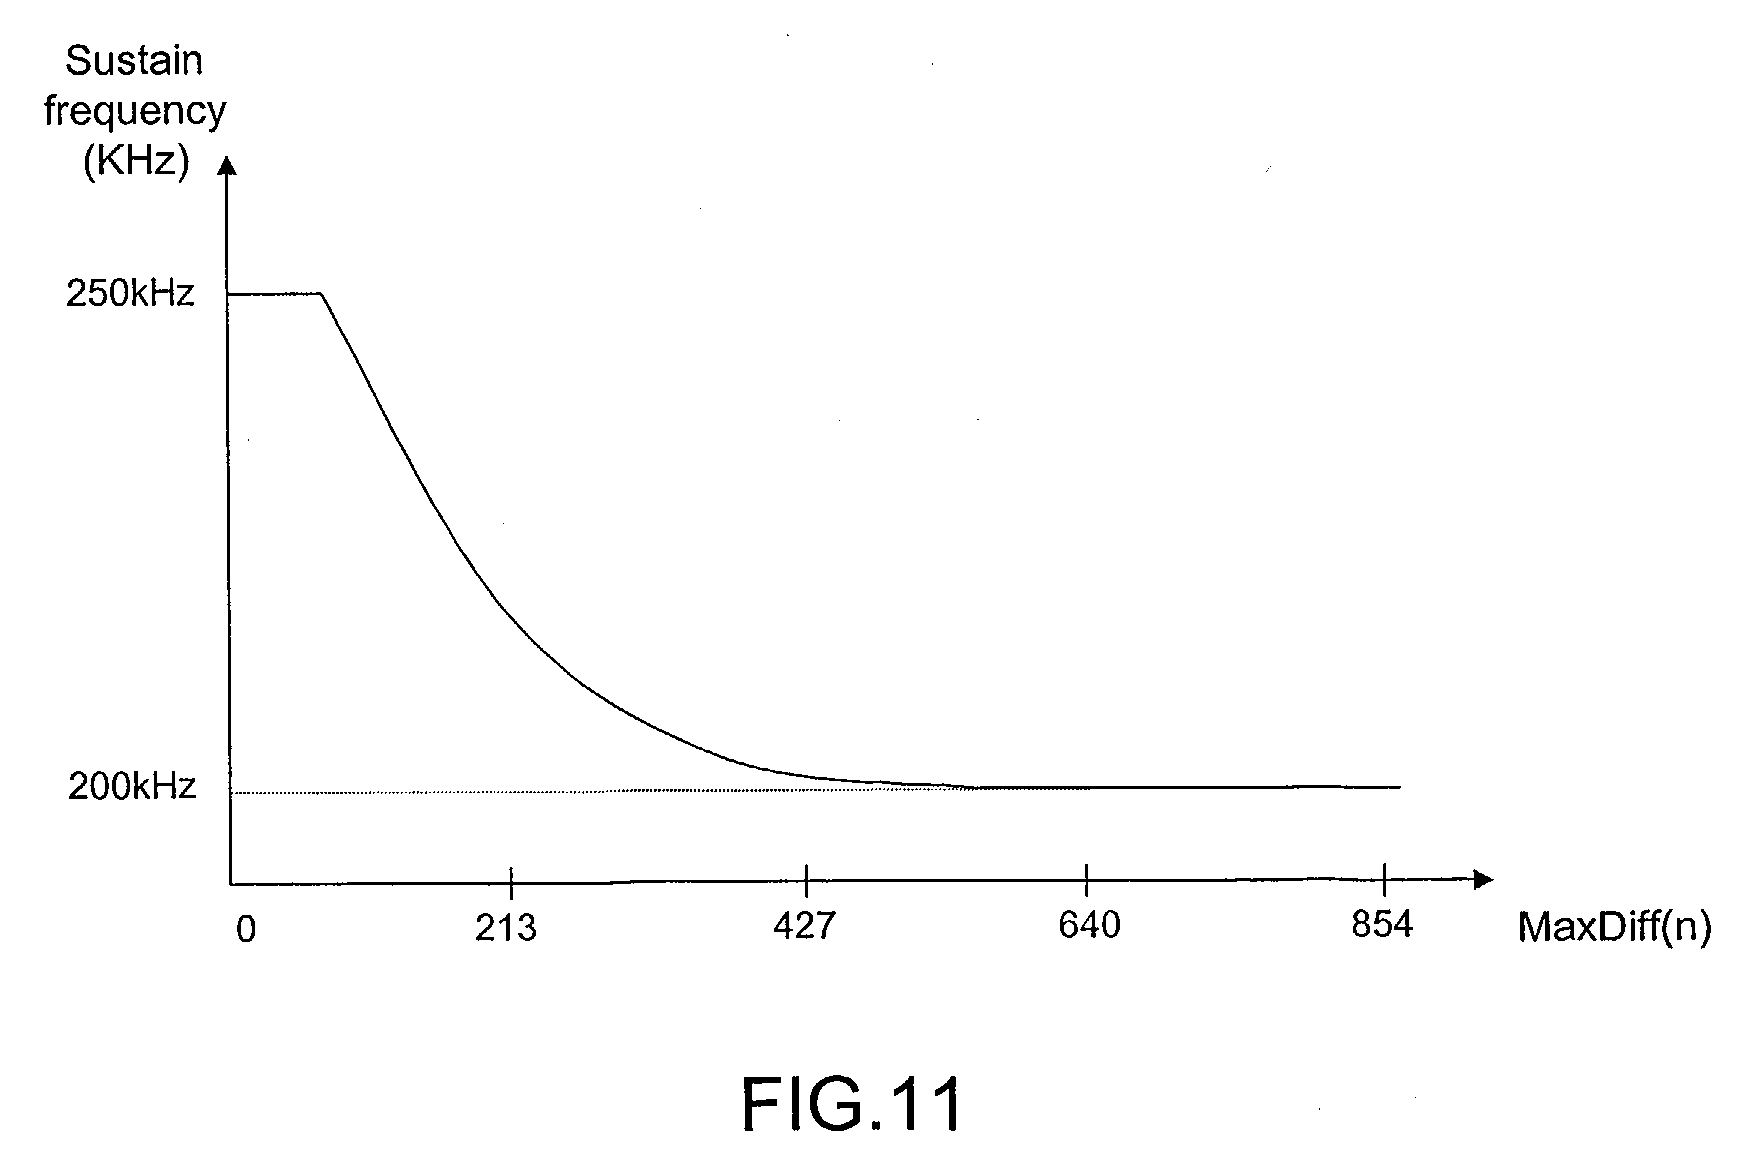
- the sustain frequency of each subfield n is then adjusted depending on the value MaxDiff(n) as indicated by the curve of Figure 11. This curve is stored in a Look up table (LUT). The sustain frequency of the subfield n decreases as MaxDiff(n) increases.
- the sustain frequency of the displayed picture is then selected according to a predetermined table.
- the line load effect is low and the sustain frequency can be high (e.g. 250kHz).
- the line load effect is high and the sustain frequency should be low (e.g. 200kHz) to minimize it. It has to be noted that the load effect is also higher when the percentage of xenon is important in the gas of the cell.
- Such an adjustment of the sustain frequency should be made cautiously to avoid any brutal change of the picture luminance when minor changes of the picture are happening. Therefore, it is preferable to reduce the load effect slowly for example by means of a temporal filter.
- the maximal load difference MaxDiff(n;t) for a subfield n and a frame t is preferably filtered on T preceding frames to deliver a value MaxDiff'(n;t) as following:
- MaxDiff(n;t) on T preceding frames and MaxDiff(n;t) is directly be taken as equal to MaxDiff(n;t).
- the method of the invention can be implemented in parallel to a power management method as described previously, by the computation of an average power level for each picture, and used for modifying the total amount of sustain pulses in the frame and consequently for modifying the amount of sustain pulses of each subfield.
- the act of optimizing the sustain frequency of each subfield modifies the available time to generate sustain pulses. Indeed, if the sustain frequency of a high weight subfield is reduced, the time to generate all its sustain pulses is longer and it can limit the peak-white value if there is not enough time to generate them. For instance, if the sustain frequency of the most significant subfield (subfield with the highest weight) is reduced from 250kHz to 200kHz, then the time required for the sustain pulses of this subfield is increased by 20%.
- Figure 14 illustrates the case where APL'(t) is greater than APL(t). In that case, the maximal peak white is reduced in order that the sustain duration for generating said reduced amount of sustain pulses be not to longer.
- Figure 15 illustrates a possible circuit implementation of the inventive method.
- the input data comprise 10bits in our example whereas the output data comprise 16 bits.
- the data are then processed by a block 12 for delivering an average power level APL(t) for each frame t with as described previously.
- the data outputted by the degamma block 10 are processed by a dithering block 11 in order to obtain 8 bits data (24 bits for the 3 colors).
- the data delivered by the dithering block 13 are then processed by an encoding block 13 that converts them by means of a LUT into subfield data (11 bits data in the present case).
- the subfield data are then stored in a frame memory 14 and converted into serial data before being displayed by the display panel.
- the circuit comprises a computation block 15 that processes the data outputted by the dithering block 11.
- the block 15 computes, for each frame t and for each subfield n, the maximal load difference MaxDiff(n;t) between two consecutive lines of the panel.
- the value MaxDiff(n;t) is then time filtered by a filter 16 in order to obtain MaxDiff(n;t). If no scene cut is detected, there is no filtering.
- MaxDiff'(n;t) is used by a first LUT 17 to deliver a sustain frequency SustainFreq(n) for each subfield n in accordance with said MaxDiff(n;t) value and as illustrated by Figure 11.
- the value SustainFreq(n) is transmitted to the control unit of the display panel.
- MaxDiff(n;t) is also used by a LUT 18 for determining an adjustment coefficient Adj(n) for each subfield n as explained before.
- a multiplier 19 is then used for multiplying this coefficient by the maximal number of sustain pulses MaxSustainNb(n;t) in a frame and the result is the value MaxSustainNb'(n;t).
- the maximal numbers of sustain pulses MaxSustainNb'(n;t) of all subfields are summed up in a block 20 as following: Based on this new total amount of sustain pulses Sum(t), an inverse APL table 21 delivers the average power level APL'(t) as explained before. The maximal value between APL(t) and APL'(t) is then selected by a block 22. This value, APL"(t), is then used by an APL table 23 for delivering for each sub-field n the total amount of sustains SustainNb(n) that should be employed by the panel to display the picture t.
Landscapes
- Engineering & Computer Science (AREA)
- Physics & Mathematics (AREA)
- Computer Hardware Design (AREA)
- General Physics & Mathematics (AREA)
- Theoretical Computer Science (AREA)
- Power Engineering (AREA)
- Plasma & Fusion (AREA)
- Control Of Indicators Other Than Cathode Ray Tubes (AREA)
Abstract
The present invention relates to a method for processing data of a
picture to be displayed on a display panel with persistent luminous elements
in order to reduce load effect in said display means. The method comprises
the following steps :
- computing, for each subfield, the amount of activated luminous elements in each line of luminous elements of the display panel, called line load,
- calculating, for each subfield, the maximal difference of line loads of two consecutive lines of the display panel, and
- selecting, for each subfield, a sustain frequency in accordance with its maximal load difference in order to reduce line load effect.
Description
- The present invention relates to a method for processing data of a picture to be displayed on a display panel with persistent luminous elements in order to reduce load effect in said display means.
- High contrast is an essential factor for evaluating the picture quality of every display technologies. From this perspective, a high peak-white luminance is always required to achieve a good contrast ratio and, as a result, a good picture performance even with ambient light conditions. Otherwise, the success of a new display technology requires also a well-balanced power consumption. For every kind of active display, more peak luminance corresponds also to a higher power that flows in the electronic of the display. Therefore, if no specific management is done, the enhancement of the peak luminance for a given electronic efficacy will lead to an increase of the power consumption. So, it is common to use a power management concept to stabilize the power consumption of the display. The main idea behind every kind of power management concept associated with peak white enhancement is based on the variation of the peak luminance depending on the picture content in order to stabilize the power consumption to a specified value as illustrated on figure 1. In this figure, the peak luminance decreases as the picture load increases. The power consumption is kept constant.
- The concept described on figure 1 enables to avoid any overloading of the power supply as well as a maximum contrast for a given picture. Such a concept suits very well to the human visual system, which is dazzled in case of full white picture (picture load=100%) whereas it is really sensitive to dynamic in case of dark picture (e.g. dark night with a moon). Therefore, in order to increase the impression of high contrast on dark picture, the peak luminance is set to very high values whereas it is reduced in case of energetic pictures (full white).
- In the case of analog displays like Cathode Ray Tubes (CRTs), the power management is based on a so called ABM function (Average Beamcurrent Limiter), which is implemented by analog means, and which decreases video gain as a function of average luminance, usually measured over a RC stage. In the case of a plasma display, the luminance as well as the power consumption is directly linked to the number of sustain pulses (light pulses) per frame. As shown on Figure 2, the number of sustain pulses for peak white decreases as the picture load, which corresponds to the Average Power Level (APL) of the picture, increases for keeping constant the power consumption.
- The computation of the Average Power Level (APL) of a picture P is for example made through the following function :where I(x,y) represents the luminance of a pixel with coordinates (x,y) in the picture P, C is the number of columns and L is the number of lines of the picture P.

- Then, for every possible APL values, a maximal number of sustain pulses is fixed for the peak white pixels for keeping constant the power consumption of the PDP. Since, only an integer number of sustain pulses can be used, there is only a limited number of available APL values. In theory, the number of sustain pulses that can be displayed for the peak white pixels can be very high. Indeed, if the picture load tends to zero, the power consumption tends also to zero, and the maximal number of sustain pulses for a constant power consumption tends to infinite. However, the maximal number of sustain pulses defining the maximal peak white (peak white for a picture load of 0%) is limited by the available time in a frame for the sustaining and by the minimum duration of a sustain pulse. Figure 3 illustrates the duration and the content of a frame comprising 12 subfields having different weights, each subfield comprising an addressing period for activating the cells of the panel and a sustaining period for illuminating the activated cells of the panel. The duration of the addressing period is identical for each subfield and the duration of the sustaining period is proportional to the weight of the subfield. When the picture load is high, the number of cells consuming energy at a given time is high; so, the duration of the sustaining period should be reduced for keeping constant the average power consumption. That is the reason why the sustaining duration for a frame is higher for a low picture load than for a high picture load.
- In addition, in order to achieve a high maximal peak white, the number of subfield is kept to a minimum ensuring an acceptable grayscale portrayal (with few false contour effects), the addressing speed is increased to a maximum keeping an acceptable panel behavior (response fidelity) and the sustain pulse duration is kept to a minimum but having an acceptable efficacy.
- But, at this stage, PDP makers are faced with another problem called load effect explained below. As previously mentioned, a high peak white requires to be able to shorten the duration of a sustain pulse. However, this increase of the sustain frequency has a strong drawback: it increases load effect, especially, when the xenon percentage in the gas of the PDP cells is high. This effect is illustrated by figure 4. It represents a white cross on a black background. Losses due to line capacity effect occur and have a strong influence on the panel luminance for a high sustain frequency. The white horizontal lines of the cross are less luminous in a high sustain frequency mode (right part of Figure 4) than in a low sustain frequency mode (left part). This example shows a line load effect.
- The line load effect itself represents a dependence of subfield luminance towards its horizontal distribution. In that case, it does not matter to know the load of the subfield but rather to know the differences of load between two consecutive lines for the same subfield.
- When the subfield distribution is "geometrical", e.g. for displaying artificial geometrical patterns, the line load effect is much more critical than for video pictures which suffer mainly from a global load effect.
- Generally the load effect is not only limited to the line load but also to a global load of the subfield in a frame. Indeed, if a subfield is globally more used than another one on the whole screen, it will have less luminance per sustain pulse due to this load effect (the losses occur in the screen and in the electronic circuitry).
- Therefore, on the one hand, a high number of sustain pulses and a high sustain frequency are required for peak white modes and, on the other hand, the panel will lose its homogeneity in case of peak white modes. This can have dramatic effects on natural scene as shown in Figure 5.
- The load effect has an impact on the grayscale portrayal under the form of a kind of solarization effect which looks like a lack of gray levels. In that case, the right picture seems to be coded with fewer bits than the left one. This is due to the fact that some subfields are suddenly less luminous than they should be. In that case, if we consider two video levels that should have similar luminance, and if one of them is using such a subfield, its global luminance will be too low compared to the other video level introducing a disturbing effect.
- An object of the method of the invention is to reduce the line load effect that is directly linked to the capacity of a line and not the global load effect that can be compensated by other methods. The method of the invention can be used independently to those methods when a PC mode is selected or in addition to one of them since they are compatible.
- Globally, the invention is based on a profile analysis of the line load for each subfield to determine if this subfield is more or less critical to line load effect. If such a subfield is detected, its sustain frequency is reduced to minimize the load effect.
- The invention relates to a method and a device for reducing such a load effect in a display panel with persistent luminous elements.
- The invention concerns a method for processing data of a picture to be displayed on a display panel with persistent luminous elements during a frame comprising a plurality of subfields, each subfield comprising an addressing phase during which the luminous elements of the panel are activated or not in accordance with the picture data and a sustain phase during which the activated luminous elements are illuminated by sustain pulses. It comprises the following steps :
- computing, for each subfield, the amount of activated luminous elements in each line of luminous elements of the display panel, called line load,
- calculating, for each subfield, the maximal difference of line loads of two consecutive lines of the display panel, and
- selecting, for each subfield, a sustain frequency in accordance with its maximal load difference in order to reduce line load effect.
- Preferably, the calculation of the maximal load difference is only carried out only for lines whose load is greater than a minimal load. This minimal load is for example equal to 10% of the amount of luminous elements in a line of the display panel.
- In a particular embodiment, the maximal load difference between two consecutive lines of the display panel is calculated, for each subfield, on the current frame and a plurality of frames preceding said current frame in order to avoid changes in picture luminance when some minor modifications are happening. The maximal load difference used for selecting the sustain frequency is then the mean value of the maximal load differences calculated for said plurality of frames.
- Preferably, the number of sustain pulses of each subfield is adjusted in accordance with the number of luminous elements to be activated for displaying the current picture and with the selected sustain frequency for said subfield.
- The invention concerns also a device for processing data of a picture to be displayed on a display panel with persistent luminous elements during a frame comprising a plurality of subfields, each subfield comprising an addressing phase during which the luminous elements of the panel are activated or not in accordance with the picture data and a sustain phase during which the activated luminous elements are illuminated by sustain pulses. It comprises :
- means for computing, for each subfield, the amount of activated luminous elements in each line of luminous elements of the display panel, called line load, and for calculating, for each subfield, the maximal difference of line loads of two consecutive lines of the display panel, and
- means for selecting, for each subfield, a sustain frequency in accordance with its maximal load difference in order to reduce line load effect.
- The invention concerns also a plasma display panel comprising a plurality of persistent luminous elements organized in rows and columns and said device for reducing load effect.
- Exemplary embodiments of the invention are illustrated in the drawings and are explained in more detail in the following description, the drawings showing in :
- Fig.1
- a diagram representing the peak luminance and the power consumption according to the picture load in a classical plasma display panel;
- Fig.2
- a diagram representing the number of sustain pulses for peak white according to the picture load in a classical plasma display panel;
- Fig.3
- the time duration of a frame according to picture load in a classical plasma display panel;
- Fig.4
- the load effect in a classical plasma display panel when the sustain frequency is high;
- Fig.5
- the solarization effect on a natural scene due to load effect;
- Fig.6
- a video picture and the associated histogram showing the load per subfield of that picture;
- Fig.7
- a diagram showing the line load for each subfield for displaying the video picture of the figure 6;
- Fig.8
- a computer picture and the associated histogram showing the load per subfield of that picture;
- Fig.9
- a diagram showing the line load for each subfield for displaying the video picture of the figure 8;
- Fig. 10
- the computer picture of Figure 8 wherein the line load effect is shown;
- Fig.11
- a curve showing the sustain frequency to be selected for a subfield in accordance with the maximal load difference between two consecutive lines of the panel for the corresponding subfield;
- Fig. 12
- a block diagram showing the generation of a number of sustain pulses for each subfield adapted to its sustain frequency;
- Fig.13
- a curve showing the number of sustain pulses in a frame in accordance with the picture load;
- Fig 14
- two curves illustrating the reduction of sustain pulses for peak white due the modification of the sustain frequency, and
- Fig.15
- a block diagram of a circuit implementation of a plasma display device according to the invention.
- The method of the invention is based on an analysis of the line load of each subfield in order to determine if this subfield is more or less critical to the so-called "line load effect". If such an effect is detected for a subfield, its sustain frequency is reduced to minimize the load effect.
- In the presented embodiments, the frame comprises 11 subfields with the following weights :
- 1 - 2 - 3 - 5 - 8 - 12 - 18 - 27 - 41 - 58 - 80 (∑=255)
-
- In order to better understand the type of picture sequence sensitive to line load effect, two picture sequences are analyzed below. The first one is a video sequence not critical for line load effect and the second one is a computer sequence comprising geometrical patterns that is more critical for line-load effect.
- The video sequence shown on the left side of Figure 6 represents an "european man face". The global load per subfield for that sequence displayed on a WVGA screen with 852x480x3 cells (or luminous elements) is given by the histogram of the left side of the figure and by the below table. The load of a subfield is the amount (or number) of activated cells of the panel during said subfield. In the below table, the subfield load is expressed as a percentage of the total amount of cells of the panel.
Subfield Weigth Load 1 1 63.24% 2 2 74.69% 3 3 73.94% 4 5 79.73% 5 8 88.45% 6 12 77.34% 7 18 32.67% 8 27 81.26% 9 41 12.12% 10 58 3.94% 11 80 0.43% - There is a big difference in the global load of the subfields : the subfield SF7 is less loaded than its neighbors (SF1, SF2, SF3, SF4, SF5, SF6, SF8). This introduces a so-called solarization or quantization effect since the subfield SF7 will be proportionally more luminous than the other ones.
- The distribution line by line of the global load of each subfield is represented by the figure 7. The horizontal axis represents the lines of the picture (480 lines in WVGA) and the vertical axis represents the number of illuminated pixels (up to 852 in WVGA) per line. A curve is drawn for each subfield.
- From this figure, it can be seen that the line loads for the subfields SF0, SF1, SF2, SF3, SF4, SF5 and SF7 are quite stable whereas there are more variations for the other ones. In any case, the maximal difference between two consecutive lines is 105. In that case, the load difference of luminance of one subfield between two consecutive lines is not very high and not a big problem. Therefore, in case of such pictures, the line load effect is not annoying.
- The computer picture shown at the left side of Figure 8 is a picture of a histogram with some text, notably a title "Analysis of line-load effect" on a dark area at the top of the picture and a comment "Results shows serious issues on picture quality" on a white area at the bottom of the picture. The global load per subfield for that sequence is given by the histogram on the right side of Figure 8 and by the below table :
Subfield Weigth Load 1 1 54.66% 2 2 68.72% 3 3 62.00% 4 5 59.02% 5 8 72.33% 6 12 78.64% 7 18 58.30% 8 27 42.17% 9 41 74.87% 10 58 77.90% 11 80 73.58% - In that sequence, the load of the various subfields is more homogeneous than in the case of the video sequence. The distribution line by line of the global load of each subfield is represented by the figure 9 to be compared with Figure 7. There are strong discontinuities in the line load of each subfield and the maximal line load difference between two consecutive lines is much more high. This maximal line load difference is equal to 590 for subfield SF9 and SF10. It introduces, for these subfields, a big difference of luminance from one line to the next one.
- In that sequence, the load effect manifests itself by an enhancement of the luminance of the background behind the dark area of the title as shown on Figure 10. At the bottom of the picture, it is the opposite. The white area, introduces a reduction of the luminance of the background since the corresponding lines are more loaded.
- The main idea of the invention is to adjust the sustain frequency of each subfield in accordance with its load. More particularly, the line load difference between two consecutive lines is analyzed for each subfield and the sustain frequency of the subfield is selected in accordance with its maximal line load difference.
- Preferably, the lines with a low load for the current subfield are not analyzed. Indeed, it makes no sense to evaluate the influence of the load of a subfield if this subfield is not enough used. Therefore, in the analysis of the difference between two consecutive lines, we limit the analysis to lines that have at least 10% of illuminated cells. This limit is referenced MinLoad.
- Then, for each subfield, the line load difference Diff(L,n) between two consecutive lines L and L+1 for a subfield n is computed as following :where Load(L,n) is the load of the line L for the subfield n.

The maximal line load difference for a subfield n, referenced MaxDiff(n), is then calculated : MaxDiff(n)=MAXfor allL(Diff(L;n)). - The maximal line load difference of each subfield n for the computer picture of Figure 8 is given by the below table:
Subfield n MaxDiff(n) 0 391 1 465 2 462 3 414 4 489 5 567 6 337 7 278 8 575 9 590 10 590 - The sustain frequency of each subfield n is then adjusted depending on the value MaxDiff(n) as indicated by the curve of Figure 11. This curve is stored in a Look up table (LUT). The sustain frequency of the subfield n decreases as MaxDiff(n) increases.
- Depending on these values, the sustain frequency of the displayed picture is then selected according to a predetermined table. When the maximal load difference is low, the line load effect is low and the sustain frequency can be high (e.g. 250kHz). At the opposite, when the maximal load difference is high, the line load effect is high and the sustain frequency should be low (e.g. 200kHz) to minimize it. It has to be noted that the load effect is also higher when the percentage of xenon is important in the gas of the cell.
- In the invention, with a judicious choice of the sustain frequency, it is possible to reduce by a factor of two the load effect.
- Such an adjustment of the sustain frequency should be made cautiously to avoid any brutal change of the picture luminance when minor changes of the picture are happening. Therefore, it is preferable to reduce the load effect slowly for example by means of a temporal filter.
- Consequently, the maximal load difference MaxDiff(n;t) for a subfield n and a frame t is preferably filtered on T preceding frames to deliver a value MaxDiff'(n;t) as following:

- When a new scene is detected, for example by a scene cut detection means, the value MaxDiff(n;t) on T preceding frames and MaxDiff(n;t) is directly be taken as equal to MaxDiff(n;t).
- The method of the invention can be implemented in parallel to a power management method as described previously, by the computation of an average power level for each picture, and used for modifying the total amount of sustain pulses in the frame and consequently for modifying the amount of sustain pulses of each subfield.
- The act of optimizing the sustain frequency of each subfield modifies the available time to generate sustain pulses. Indeed, if the sustain frequency of a high weight subfield is reduced, the time to generate all its sustain pulses is longer and it can limit the peak-white value if there is not enough time to generate them. For instance, if the sustain frequency of the most significant subfield (subfield with the highest weight) is reduced from 250kHz to 200kHz, then the time required for the sustain pulses of this subfield is increased by 20%.
- Therefore, it is necessary to modify the number of sustain pulses of each subfield in accordance with the selected sustain frequencies in order to have enough time to perform all the sustain pulses.
- To this end, the operations illustrated by Figure 12 are carried out :
- the maximal load difference MaxDiff(n;t), or MaxDiff(n;t) if filtering, is used for selecting an adjustment coefficient Adj(n;t) for adjusting the number of sustain pulses of the subfield n; this coefficient corresponds to the reduced number of sustain pulses that is obtained by reducing the frequency from the maximal frequency (for example 250kHz) to the selected frequency; for instance, if MaxDiff'(n;t)=640, then the selected sustain frequency is 200kHz (-20%) and then the coefficient value is 0.8 (20% less time).
- in parallel, an average power level APL(t) is calculated for the picture corresponding to the frame t by summing the video levels of all the pixels of the picture t,
- the coefficient Adj(n;t) is multiplied by the maximal number of sustain pulses for the subfield n, referenced MaxSustainNb(n) in order to obtain a new maximal number of sustain pulses MaxSustainNb'(n). The maximal number of sustain pulses MaxSustainNb(n) corresponds to the number of sustain pulses for a zero picture load (APL=0).
- the new maximal numbers of sustain pulses for all the subfields are
summed up to give the total amount of sustain pulses after adjustment,
referenced Sum(t) :

- the value Sum(t) is converted in an average power level APL'(t) by an inverse APL table. This table delivers for each total amount of sustain pulses after adjustment, Sum(t), the nearest APL corresponding to that value of sustain pulses. The values stored in this table follow the inverse of the curve of Figure 13. For instance, if Sum(t) is equal to 800, APL'(t) is equal to 16%.
- the two values APL(t) and APL'(t) are compared and the maximal value referenced APL"(t) is selected; for instance, if APL(t)=20% and APL'(t)=16%, APL"(t)=20%.
- the value APL"(t) is then converted by an APL table in a number of sustain pulses for each subfield n, referenced SustainNb(n). The values stored in this table follow the curve of Figure 13. According to this curve, the total amount of sustain pulses in a frame decreases as the picture load APL increases.
- Figure 14 illustrates the case where APL'(t) is greater than APL(t). In that case, the maximal peak white is reduced in order that the sustain duration for generating said reduced amount of sustain pulses be not to longer.
- Figure 15 illustrates a possible circuit implementation of the inventive method. The input picture data Din for the three colors RGB are forwarded to a
degamma block 10 where the following operation is applied to the data : Dout = 65535 × ( Din / 1023)γ where y =2.2. The input data comprise 10bits in our example whereas the output data comprise 16 bits. The data are then processed by ablock 12 for delivering an average power level APL(t) for each frame t withas described previously.
- In parallel, the data outputted by the
degamma block 10 are processed by a ditheringblock 11 in order to obtain 8 bits data (24 bits for the 3 colors). The data delivered by the ditheringblock 13 are then processed by anencoding block 13 that converts them by means of a LUT into subfield data (11 bits data in the present case). The subfield data are then stored in aframe memory 14 and converted into serial data before being displayed by the display panel. - For implementing the method of the invention, the circuit comprises a
computation block 15 that processes the data outputted by the ditheringblock 11. Theblock 15 computes, for each frame t and for each subfield n, the maximal load difference MaxDiff(n;t) between two consecutive lines of the panel. The value MaxDiff(n;t) is then time filtered by afilter 16 in order to obtain MaxDiff(n;t). If no scene cut is detected, there is no filtering. - The value MaxDiff'(n;t) is used by a
first LUT 17 to deliver a sustain frequency SustainFreq(n) for each subfield n in accordance with said MaxDiff(n;t) value and as illustrated by Figure 11. The value SustainFreq(n) is transmitted to the control unit of the display panel. - The value MaxDiff(n;t) is also used by a
LUT 18 for determining an adjustment coefficient Adj(n) for each subfield n as explained before. Amultiplier 19 is then used for multiplying this coefficient by the maximal number of sustain pulses MaxSustainNb(n;t) in a frame and the result is the value MaxSustainNb'(n;t). - The maximal numbers of sustain pulses MaxSustainNb'(n;t) of all subfields are summed up in a
block 20 as following:Based on this new total amount of sustain pulses Sum(t), an inverse APL table 21 delivers the average power level APL'(t) as explained before. The maximal value between APL(t) and APL'(t) is then selected by a
block 22. This value, APL"(t), is then used by an APL table 23 for delivering for each sub-field n the total amount of sustains SustainNb(n) that should be employed by the panel to display the picture t.
Claims (13)
- Method for processing data of a picture to be displayed on a display panel with persistent luminous elements during a frame comprising a plurality of subfields, each subfield comprising an addressing phase during which the luminous elements of the panel are activated or not in accordance with the picture data and a sustain phase during which the activated luminous elements are illuminated by sustain pulses, characterized in that it comprises the following steps :computing, for each subfield, the amount of activated luminous elements in each line of luminous elements of the display panel, called line load,calculating, for each subfield, the maximal difference of line loads of two consecutive lines of the display panel, andselecting, for each subfield, a sustain frequency in accordance with its maximal load difference in order to reduce line load effect.
- Method according to claim 1, characterized in that the calculation of the maximal load difference is only carried out only for lines whose load is greater than a minimal load.
- Method according to claim 2, characterized in that the minimal load for a line is equal to 10% of the amount of luminous elements in a line of the display panel.
- Method according to one of claims 1 to 3, characterized in that the maximal load difference between two consecutive lines of the display panel is calculated, for each subfield, on the current frame and a plurality of frames (T-1) preceding said current frame and in that the maximal load difference used for selecting the sustain frequency is the mean value of the maximal load differences calculated for said plurality of frames.
- Method according to one of claims 1 to 4, characterized in that the number of sustain pulses of each subfield is adjusted in accordance with the number of luminous elements to be activated for displaying the current picture and with the selected sustain frequency for said subfield.
- Method according to claim 5, characterized in that, for adjusting the number of sustain pulses of each subfield in accordance with the number of luminous elements to be activated for displaying the current picture and with the selected sustain frequency for said subfield, it comprises the following steps :measuring a first average power level (APL(t)) representative of the number of luminous elements to be activated for displaying the current picture,calculating, for each subfield, an adjustment coefficient (Adj(n)) corresponding to the ratio between the selected sustain frequency and a standard sustain frequency,calculating a total amount of sustain pulses (Sum(t)) in a frame, said total amount corresponding to the sum of elementary amounts of sustain pulses, each elementary amount of sustain pulses being relative to a subfield and being the product of a maximal amount of sustain pulses for said subfield with the adjustment coefficient of said subfield,computing a second average power level (APL'(t)) representative of said total amount of sustain pulses (Sum(t)) in a frame, andselecting, for each subfield, a number of sustain pulses in accordance with the maximal value of said first and second average power levels (APL(t),APL'(t)).
- Device for processing data of a picture to be displayed on a display panel with persistent luminous elements during a frame comprising a plurality of subfields, each subfield comprising an addressing phase during which the luminous elements of the panel are activated or not in accordance with the picture data and a sustain phase during which the activated luminous elements are illuminated by sustain pulses, characterized in that it comprisesmeans (15) for computing, for each subfield, the amount of activated luminous elements in each line of luminous elements of the display panel, called line load, and for calculating, for each subfield, the maximal difference of line loads of two consecutive lines of the display panel, andmeans (17) for selecting, for each subfield, a sustain frequency in accordance with its maximal load difference in order to reduce line load effect.
- Device according to claim 7, characterized in that the calculation of the maximal load difference is only carried out only for lines whose load is greater than a minimal load.
- Device according to claim 8, characterized in that the minimal load for a line is equal to 10% of the amount of luminous elements in a line of the display panel.
- Device according to one of claims 7 to 9, characterized in that it comprises further a time filter (16) for calculating, for each subfield, the mean value of maximal load differences between two consecutive lines calculated for the current frame and a plurality of frames (T-1) preceding said current frame, said mean value being used by the selecting means (17) for selecting the sustain frequency.
- Device according to one of claims 7 to 10, characterized in that the number of sustain pulses of each subfield is adjusted in accordance with the number of luminous elements to be activated for displaying the current picture and with the selected sustain frequency for said subfield.
- Device according to claim 11, characterized in that it comprises :a calculation means (12) for calculating a first average power level (APL(t)) representative of the power needed by the display panel for displaying the current picture with a reference sustain frequency,a first look up table (18) for delivering, for each subfield, an adjustment coefficient (Adj(n)) in accordance with the corresponding maximal difference of line loads, said adjustment coefficient (Adj(n)) corresponding to the ratio between the selected sustain frequency for said subfield and a standard sustain frequency,a multiplier (19) for multiplying, for each subfield, said adjustment coefficient with a maximal amount of sustain pulses and delivering an adjusted maximal amount of sustain pulses for each subfield,an adder (20) for summing the adjusted maximal amount of sustain pulses of all subfields of the frame,a second look up table (21) for converting said sum of adjusted maximal amount of sustain pulses into a second average power level (APL'(t)),a means (22) for selecting the maximal level (APL"(t)) between the first and second average power levels (APL(t), APL'(t)), anda third look up table (23) for converting said maximal level (APL"(t)) into an amount of sustain pulses for each subfield.
- Plasma display panel comprising a plurality of persistent luminous elements organized in lines and columns, characterized in that it comprises a device according to one of the claims 7 to 12 for reducing line load effect.
Priority Applications (9)
| Application Number | Priority Date | Filing Date | Title |
|---|---|---|---|
| EP03293194A EP1544837A1 (en) | 2003-12-17 | 2003-12-17 | Method and device for reducing the effect of differences in scan line load |
| KR1020067010004A KR101021861B1 (en) | 2003-12-17 | 2004-12-14 | Method and device for processing data in an image, and plasma display panel comprising such device |
| EP04804800A EP1695328B1 (en) | 2003-12-17 | 2004-12-14 | Method and device for reducing line load effect |
| DE602004015148T DE602004015148D1 (en) | 2003-12-17 | 2004-12-14 | METHOD AND DEVICE FOR REDUCING THE LINE LOAD EFFECT |
| PCT/EP2004/053440 WO2005059879A1 (en) | 2003-12-17 | 2004-12-14 | Method and device for reducing line load effect |
| US10/583,533 US8441415B2 (en) | 2003-12-17 | 2004-12-14 | Method and device for reducing line load effect |
| JP2006544426A JP5128818B2 (en) | 2003-12-17 | 2004-12-14 | Method and apparatus for reducing row load effect |
| CNB2004800380594A CN100458887C (en) | 2003-12-17 | 2004-12-14 | Method, device and plasma display panel for reducing line loading effect |
| TW093139250A TW200532618A (en) | 2003-12-17 | 2004-12-17 | Method and device for reducing load effect |
Applications Claiming Priority (1)
| Application Number | Priority Date | Filing Date | Title |
|---|---|---|---|
| EP03293194A EP1544837A1 (en) | 2003-12-17 | 2003-12-17 | Method and device for reducing the effect of differences in scan line load |
Publications (1)
| Publication Number | Publication Date |
|---|---|
| EP1544837A1 true EP1544837A1 (en) | 2005-06-22 |
Family
ID=34486481
Family Applications (1)
| Application Number | Title | Priority Date | Filing Date |
|---|---|---|---|
| EP03293194A Withdrawn EP1544837A1 (en) | 2003-12-17 | 2003-12-17 | Method and device for reducing the effect of differences in scan line load |
Country Status (2)
| Country | Link |
|---|---|
| EP (1) | EP1544837A1 (en) |
| CN (1) | CN100458887C (en) |
Cited By (3)
| Publication number | Priority date | Publication date | Assignee | Title |
|---|---|---|---|---|
| CN1937712A (en) * | 2005-09-22 | 2007-03-28 | 汤姆森许可贸易公司 | Method and device for encoding luminance values into subfield code words in a display device |
| CN106095356A (en) * | 2011-12-06 | 2016-11-09 | 杜比实验室特许公司 | Improve apparatus and method based on the exchange of perceived illumination intensity nonlinear view data between different display capabilities |
| US10621952B2 (en) | 2011-12-06 | 2020-04-14 | Dolby Laboratories Licensing Corporation | Perceptual luminance nonlinearity-based image data exchange across different display capabilities |
Families Citing this family (1)
| Publication number | Priority date | Publication date | Assignee | Title |
|---|---|---|---|---|
| KR20050075216A (en) | 2004-01-16 | 2005-07-20 | 엘지전자 주식회사 | Device and method for removing load effect in plasma display panel |
Citations (1)
| Publication number | Priority date | Publication date | Assignee | Title |
|---|---|---|---|---|
| US6559816B1 (en) * | 1999-07-07 | 2003-05-06 | Lg Electronics Inc. | Method and apparatus for erasing line in plasma display panel |
Family Cites Families (6)
| Publication number | Priority date | Publication date | Assignee | Title |
|---|---|---|---|---|
| JPH0535205A (en) * | 1991-07-29 | 1993-02-12 | Nec Corp | System for driving plasma display |
| JP2856241B2 (en) * | 1993-11-17 | 1999-02-10 | 富士通株式会社 | Gradation control method for plasma display device |
| US6100859A (en) * | 1995-09-01 | 2000-08-08 | Fujitsu Limited | Panel display adjusting number of sustaining discharge pulses according to the quantity of display data |
| JP2900997B2 (en) * | 1996-11-06 | 1999-06-02 | 富士通株式会社 | Method and apparatus for controlling power consumption of a display unit, a display system including the same, and a storage medium storing a program for realizing the same |
| AU2002220981A1 (en) * | 2000-12-20 | 2002-07-01 | Koninklijke Philips Electronics N.V. | Matrix display device and method of driving the same |
| JP4308488B2 (en) * | 2002-03-12 | 2009-08-05 | 日立プラズマディスプレイ株式会社 | Plasma display device |
-
2003
- 2003-12-17 EP EP03293194A patent/EP1544837A1/en not_active Withdrawn
-
2004
- 2004-12-14 CN CNB2004800380594A patent/CN100458887C/en not_active Expired - Fee Related
Patent Citations (1)
| Publication number | Priority date | Publication date | Assignee | Title |
|---|---|---|---|---|
| US6559816B1 (en) * | 1999-07-07 | 2003-05-06 | Lg Electronics Inc. | Method and apparatus for erasing line in plasma display panel |
Cited By (10)
| Publication number | Priority date | Publication date | Assignee | Title |
|---|---|---|---|---|
| CN1937712A (en) * | 2005-09-22 | 2007-03-28 | 汤姆森许可贸易公司 | Method and device for encoding luminance values into subfield code words in a display device |
| CN1937712B (en) * | 2005-09-22 | 2013-09-25 | 汤姆森许可贸易公司 | Method and device for encoding luminance values into subfield code words in a display device |
| CN106095356A (en) * | 2011-12-06 | 2016-11-09 | 杜比实验室特许公司 | Improve apparatus and method based on the exchange of perceived illumination intensity nonlinear view data between different display capabilities |
| CN106095356B (en) * | 2011-12-06 | 2019-05-14 | 杜比实验室特许公司 | Apparatus and method for improving image data exchange based on perceptual illumination nonlinearity between different display capabilities |
| US10621952B2 (en) | 2011-12-06 | 2020-04-14 | Dolby Laboratories Licensing Corporation | Perceptual luminance nonlinearity-based image data exchange across different display capabilities |
| US10957283B2 (en) | 2011-12-06 | 2021-03-23 | Dolby Laboratories Licensing Corporation | Perceptual luminance nonlinearity-based image data exchange across different display capabilities |
| US11587529B2 (en) | 2011-12-06 | 2023-02-21 | Dolby Laboratories Licensing Corporation | Perceptual luminance nonlinearity-based image data exchange across different display capabilities |
| US11600244B2 (en) | 2011-12-06 | 2023-03-07 | Dolby Laboratories Licensing Corporation | Perceptual luminance nonlinearity-based image data exchange across different display capabilities |
| US11887560B2 (en) | 2011-12-06 | 2024-01-30 | Dolby Laboratories Licensing Corporation | Perceptual luminance nonlinearity-based image data exchange across different display capabilities |
| US12217724B2 (en) | 2011-12-06 | 2025-02-04 | Dolby Laboratories Licensing Corporation | Perceptual luminance nonlinearity-based image data exchange across different display capabilities |
Also Published As
| Publication number | Publication date |
|---|---|
| CN1898716A (en) | 2007-01-17 |
| CN100458887C (en) | 2009-02-04 |
Similar Documents
| Publication | Publication Date | Title |
|---|---|---|
| EP1162594B1 (en) | PDP display drive pulse controller | |
| US7420576B2 (en) | Display apparatus and display driving method for effectively eliminating the occurrence of a moving image false contour | |
| JP4064268B2 (en) | Display device and display method using subfield method | |
| KR100670986B1 (en) | Display drive method | |
| EP1881476A2 (en) | Driving device of plasma display panel and method of driving the same | |
| KR101248872B1 (en) | Image display device and high definition providing method | |
| US7515120B2 (en) | Apparatus for removing load effect in plasma display panel | |
| EP1577868A2 (en) | Display Apparatus | |
| CN100485751C (en) | Plasma display device and control method thereof | |
| EP1695328B1 (en) | Method and device for reducing line load effect | |
| CN100458887C (en) | Method, device and plasma display panel for reducing line loading effect | |
| JP2002006794A (en) | Display device | |
| JP3414161B2 (en) | Pseudo halftone image display device | |
| JP3327058B2 (en) | Pseudo pattern processing circuit | |
| JP3521591B2 (en) | Error diffusion processing device for display device | |
| EP1544838A1 (en) | Method and device for compensating effect of differences in subfield load | |
| JP3484895B2 (en) | Error diffusion circuit of display device | |
| JPH11327497A (en) | Video signal processing device and display device | |
| JPH08106279A (en) | Error diffusion processing device for display device | |
| JP3521592B2 (en) | Error diffusion processing device for display device | |
| JP3334401B2 (en) | Error diffusion processing device for display device | |
| KR100610494B1 (en) | Noise Reduction Device and Method in Plasma Display Panel | |
| KR101431620B1 (en) | Inverse gamma correction method of plasma display panel | |
| JPH09244577A (en) | Error diffusion processing device for display device | |
| JPH0934404A (en) | Display device drive circuit |
Legal Events
| Date | Code | Title | Description |
|---|---|---|---|
| PUAI | Public reference made under article 153(3) epc to a published international application that has entered the european phase |
Free format text: ORIGINAL CODE: 0009012 |
|
| AK | Designated contracting states |
Kind code of ref document: A1 Designated state(s): AT BE BG CH CY CZ DE DK EE ES FI FR GB GR HU IE IT LI LU MC NL PT RO SE SI SK TR |
|
| AX | Request for extension of the european patent |
Extension state: AL LT LV MK |
|
| AKX | Designation fees paid | ||
| REG | Reference to a national code |
Ref country code: DE Ref legal event code: 8566 |
|
| STAA | Information on the status of an ep patent application or granted ep patent |
Free format text: STATUS: THE APPLICATION IS DEEMED TO BE WITHDRAWN |
|
| 18D | Application deemed to be withdrawn |
Effective date: 20051223 |