Background of the Invention
The present invention relates to an
information playback method and apparatus which play
back a signal recorded on an information recording
medium and, more particularly, to an information
playback method and apparatus which play back a recorded
signal by using partial response equalization and
Viterbi decoding.
As a technique of increasing the recording
density by signal processing, the PRML (Partial Response
Maximum Likelihood) technique including Viterbi decoding
processing is generally known. According to the PRML
scheme, a playback signal is equalized to a PR (Partial
Response) waveform having intentionally given symbol
interference, and data is discriminated by a Viterbi
detector using the multilevel transition caused by
intersymbol interference.
Fig. 13 shows the playback circuit unit of a
conventional information playback apparatus which
discriminates data by the PRML scheme. After an analog
playback signal obtained from an information recording
medium 110 is input to a low-pass filter 111, the output
from the low-pass filter 111 is digitized by an AD
converter 112. The output from the AD converter 112 is
input to a PLL (Phased Locked Loop) circuit 113 to
obtain a time-series playback data string Yd (d is an
integer of one or more) sampled at a clock period. The
time-series playback data string Yd is input to an FIR
(Finite Impulse Response) filter 114 to be equalized to
a predetermined partial response waveform Ht (t is an
integer satisfying 1 ≦ t < d) by convolution
computation with a tap coefficient Ws (s is an integer
satisfying 1 ≦ s < d) of the FIR filter 114. The
playback data after partial response equalization is
input to a Viterbi detector 118, which in turn outputs
identification data Ad. The identification data Ad is
input to an FIR filter 115 to calculate an ideal signal
(target waveform) by convolution computation with the
partial response waveform Ht. This ideal signal is
input to a coefficient calculator 119. The equalized
playback data is also input from the FIR filter 114 to
the coefficient calculator 119.
Techniques for partial response equalization
include several techniques such as a zero force method
and MMSE (Minimum Mean Square Error) method. In
general, the MMSE method is often used. As disclosed in
Japanese Patent Laid-Open No. 2000-123487 (reference 1),
the MMSE method is a technique of determining a tap
coefficient W
s so as to minimize the mean square value
of d of an equalization error v
d defined by
More specifically, therefore, the tap
coefficient W
s is determined to minimize ε' expressed
by
where E[ ] represents the operation of
obtaining the mean value of d in the expression in [ ],
and the expression in [ ] represents the square of the
equalization error v
d defined by equation (1), i.e., the
square of the difference between the equalized playback
data and the ideal signal. Referring to Fig. 13, the
coefficient calculator 119 receives the equalized
playback data string from the
FIR filter 114 and the
data string of the ideal signal from the
FIR filter 115,
and determines the tap coefficient W
s for the
FIR filter
114 so as to minimize the mean square value of d of the
equalization error v
d, i.e., ε'.
More specifically, techniques of obtaining a
condition for minimizing ε' or a quasi-condition for
the minimization include, for example, a technique of
obtaining a condition (equation) for nullifying the
deviation of the tap coefficient Ws by matrix
calculation, and a technique of repeatedly updating and
obtaining the tap coefficient Ws starting from a proper
initial value of the tap coefficient Ws. The latter
technique is disclosed in Japanese Patent Laid-Open
No. 2001-189053 (reference 2) and the like.
As disclosed in Japanese Patent Laid-Open
No. 2003-303417 (reference 3) and the like, a technique
of calculating the partial response waveform Ht by using
the least squares method based on a playback waveform
from a disk is known.
The present inventors, however, have found
that equalization based on the MMSE method does not
necessarily minimize the data detection error (bit error
rate: to be referred to as "bER" hereinafter).
This is because the decoding performance of
the Viterbi detector 118 varies depending on whether the
noise characteristic of a signal input to the Viterbi
detector 118 is chromatic or white. A general
definition about whether noise is white or chromatic
will be described below by using the above equalization
error vd. Assume that with respect to the noise
component (equalization error) vd, an autocorrelation Rf
defined by Rf = E[vd x vd+f] takes a non-zero finite
value only for R0, and takes 0 for all values other than
R0. In this case, this noise is white. If there are
noise components which take non-zero finite values for
values other than R0, e.g., R1 and R2, the noise is
chromatic. If the noise characteristic of data input to
the Viterbi detector 118 is white, the Viterbi detector
118 can exhibit optimal detection performance. In
general, however, since the noise characteristic of a
playback signal obtained from the information recording
medium 110 is chromatic, the bER cannot be generally
minimized by equalization based on the MMSE method.
Summary of the Invention
The present invention has been made in
consideration of the above problems, and has as its
object to determine a tap coefficient under the
condition that the detection performance is optimized,
i.e., the bER is minimized, regardless of the noise
characteristic of a signal input to a Viterbi detector.
In order to achieve the above object,
according to the present invention, there is provided an
information playback apparatus comprising a first FIR
filter which generates an equalized waveform by
equalizing, to a partial response waveform, a playback
data string obtained by playing back a signal recorded
on an information recording medium, target waveform
generating means for generating a target waveform
serving as an equalization target, weighted equalization
error calculation means for calculating a data string by
performing convolution computation for an equalization
error which is a difference between the equalized
waveform and the target waveform, on the basis of one of
the playback data string and the equalized waveform
input from the first FIR filter and the target waveform
input from the target waveform generating means, and
coefficient calculation means for calculating a tap
coefficient for the first FIR filter on the basis of the
data string input from the weighted equalization error
calculation means, and outputting the tap coefficient to
the first FIR filter.
In addition, according to the present
invention, there is provided an information playback
method comprising the steps of generating a playback
data string by playing back a signal recorded on an
information recording medium, generating an equalized
waveform by equalizing the playback data string to a
partial response waveform using an FIR filter,
generating a target waveform serving as an equalization
target, calculating a data string by performing
convolution computation for an equalization error which
is a difference between the equalized waveform and the
target waveform, on the basis of the target waveform and
one of the playback data string and the equalized
waveform, and determining a tap coefficient for the
first FIR filter on the basis of a data string obtained
by performing convolution computation for the
equalization error.
Brief Description of the Drawings
Fig. 1 is a block diagram showing the main
part of the playback unit of an information playback
apparatus according to the present invention;
Fig. 2 is a flowchart showing the flow of
processing in the playback unit shown in Fig. 1;
Fig. 3 is a flowchart showing an example of
the flow of processing in weighted equalization error
calculation;
Fig. 4 is a flowchart showing another example
of the flow of processing in weighted equalization error
calculation;
Fig. 5 is a block diagram showing the
arrangement of an information playback apparatus
according to the first embodiment of the present
invention;
Fig. 6 is a block diagram showing the
arrangement of an FIR filter in Fig. 5;
Fig. 7 is a block diagram showing the
arrangement of an information playback apparatus
according to the second embodiment of the present
invention;
Fig. 8 is a block diagram showing the
arrangement of an information playback apparatus
according to the third embodiment of the present
invention;
Fig. 9 is a block diagram showing the
arrangement of an information playback apparatus
according to the fourth embodiment of the present
invention;
Fig. 10 is a graph showing bER/recording power
characteristics in the first embodiment;
Fig. 11 is a graph showing bER/tilt angle
characteristics in the use of a phase change optical
disk;
Fig. 12 is a graph showing bER/tilt angle
characteristics in the use of a playback-only optical
disk; and
Fig. 13 is a block diagram showing the
arrangement of the playback unit of a conventional
information playback apparatus.
Description of the Preferred Embodiments
The embodiments of the present invention will
be described next with reference to the accompanying
drawings.
Fig. 1 shows the main part of the playback
unit of an information playback apparatus according to
the present invention.
According to a conventional equalization
method such as the MMSE method, an equalization error
which is the difference between an equalized waveform
and a target waveform as an equalization target is
calculated and directly input to the coefficient
calculator. The coefficient calculator then calculates
a tap coefficient for the FIR filter so as to almost
minimize the mean square of the input equalization
error.
In contrast to this, in the present invention,
an equalization error is subjected to predetermined
convolution computation before it is input to a
coefficient calculator 4. This will be described in
detail with reference to Figs. 1 and 2.
First of all, an FIR filter 1 equalizes a
playback signal to a partial response waveform (step
S1). An ideal signal generator 2 generates an ideal
signal (target waveform) (step S2). The equalized
playback signal (equalized waveform) and ideal signal
are input to a weighted equalization error calculator 3,
which in turn calculates a weighted equalization error
by performing convolution computation for the
equalization error which is the difference between the
two signals (step S3). This weighted equalization error
is input to the coefficient calculator 4, which in turn
calculates a tap coefficient used in the FIR filter 1
(step S4). The weighted equalization error calculator 3
performs convolution computation to reflect the
chromaticity of the equalization error in the
determination of a tap coefficient.
Note that since convolution computation is
linear computation, the computational sequence is not
specifically limited. That is, as shown in Fig. 3,
convolution computation may be performed first for the
equalized playback signal and ideal signal each (steps
S31 and S32), and then a weighted equalization error may
be calculated from the difference between the two
resultant signals (step S33). Alternatively, as shown
in Fig. 4, an equalization error is calculated first
from the difference between the equalized playback
signal and the ideal signal (step S34), and then a
weighted equalization error may be calculated by
performing convolution computation for the equalization
error (step S35). It suffices if the data string of an
equalization error in which the chromaticity is
reflected is input to the coefficient calculator 4 in
the end.
Note that "equalization" means conversion of
an input signal into a predetermined waveform different
from its original waveform.
A more detailed arrangement for the
calculation of a weighted equalization error and its
operation will be described in detail with reference to
the accompanying drawings.
First Embodiment
Fig. 5 shows an information playback apparatus
according to the first embodiment of the present
invention. As shown in Fig. 5, the playback apparatus
according to this embodiment includes a low-pass filter
11, AD converter 12, PLL circuit 13, FIR filters 14, 15,
16, and 17, Viterbi detector 18, coefficient calculator
19, and subtracter 20. The weighted equalization error
calculator 3 is comprised of the FIR filters 16 and 17
and subtracter 20.
Referring to Fig. 5, a playback analog signal
read out from an information recording medium 10 such as
an optical disk is input to the low-pass filter 11
having a function of suppressing noise, and is then
digitized by the AD converter 12, thus taking a
discretized (quantized) value. The digitized playback
signal is input to the PLL circuit 13. The PLL circuit
13 extracts a clock signal from the input playback
digital signal, and outputs time-series waveform data yk
of the playback signal sampled at a clock period. In
this case, k is an integer satisfying 1 ≦ k ≦ n where
n is the number of samples obtained at a clock period,
which is an integer of one or more.
The time-series waveform data y
k is input to
the
FIR filter 14. As shown in Fig. 6, the
FIR filter
14 forms a transversal filter including I (I is an
integer satisfying 1 ≦ I < k) cascaded
delay elements
51
1, 51
2, ... , 51
i, ..., 51
I (i is an integer satisfying 1
≦ i ≦ I), I multipliers 52
1, 52
2, ... , 52
i,..., 52
I
respectively having tap coefficients w
1, w
2, ..., w
i,...,
w
I, and an
adder 53. The
delay elements 51
1 to 51
I are
formed from, for example, D flip-flops. Every time one
pulse of a clock signal is input to the clock terminal
of each element, the playback waveform data y
k is
delayed by 1T for each element. In this case, T
represents the period of a clock signal. Playback
waveform data y
x-1, y
k-2,..., y
k-i,..., y
k-I sequentially
passing through the cascaded
delay elements 51
1 to 51
I
pass through the
multipliers 52
1 to 52
I respectively
connected to the
delay elements 51
1 to 51
I to be
multiplied by the tap coefficients w
1, w
2, ... , w
i,...,
w
I. These data are then added by the
adder 53. The
resultant data is output as time-series data x
k.
The output xk from the FIR filter 14 is the
computation result obtained by convolution computation
for the time-series playback waveform data yk and the
tap coefficient wi of the FIR filter 14.
The playback waveform data yk is equalized to
a predetermined partial response waveform hj (j is an
integer satisfying 1 ≦ j ≦ J; J is the number of
partial response waveform data and an integer satisfying
1 ≦ J < k) by convolution computation with the tap
coefficient wi of the FIR filter 14. A tap count (= the
number of multipliers) I of the FIR filter 14 is
generally set to about 7 to 20. Referring to Fig. 6,
one multiplier 52i is provided for each delay element
51i. However, one multiplier may be provided for a
plurality of delay elements depending on the frequency
characteristics of the playback waveform data yk.
As shown in Fig. 5, the time-series output
waveform x
k having undergone equalization by the
FIR
filter 14 is input to the
Viterbi detector 18. The
Viterbi detector 18 estimates the value of the recorded
signal recorded on the
information recording medium 10,
and generates tentative time-series binary
identification data a
k. The time-series identification
data a
k is input to the
FIR filter 15. The
FIR filter
15 forms a transversal filter like the
FIR filter 14,
and performs convolution computation for the
identification data a
k and the partial response waveform
h
j. Time-series output data ν
k from the
FIR filter 15
is given by
The output signals from the FIR filters 14 and
15 are respectively input to the FIR filters 17 and 16
to be subjected to convolution computation. The
resultant data are input to the subtracter 20. The
equalization error calculated by the subtracter 20 is
then input to the coefficient calculator 19.
According to the conventional equalization
technique, in the absence of the FIR filters 16 and 17,
the outputs from the FIR filters 114 and 115 are input
to the coefficient calculator 119, which in turn
determines the tap coefficient Ws for the FIR filter 114
so as to minimize ε' of equation (2). The waveform
equalized by the finally determined tap coefficient Ws
is input to the Viterbi detector 118, and the final
time-series identification data Ad is output.
Referring to Fig. 13, the detection
performance of the Viterbi detector 118 can be
calculated by the ratio between the minimum value of a
Euclidean distance dE between the ideal signal of the
correct identification data Ad and the ideal signal of
the erroneous identification data Ad and the minimum
value of mean square ε' = E[(ΣYd-s x Ws -ΣAd-t x Ht)2].
In this case, an ideal signal is defined as the result
of convolution computation for the identification data
Ad and a partial response waveform Ht. If, for example,
a partial response waveform is represented by (1, 2, 2,
1) and the correct identification data Ad detected by
the Viterbi detector 118 is represented by [0001111],
the corresponding ideal signal is represented by
[0001356]. In this case, considering the erroneous
identification data Ad as [0000111], since the ideal
signal is [0000135], the Euclidean distance dE between
the two ideal signals is given by dE 2 = (1 - 0)2 +
(3 - 1)2 + (5 -3)2 + (6 - 5)2 = 10. As the Euclidean
distance dE increases, the probability that the
identification data Ad is erroneously detected as the
erroneous identification data Ad decreases. As the
minimum value of the Euclidean distance between the
ideal signal of the correct identification data Ad and
the ideal signal of the erroneous identification data Ad
increases, the probability that the identification data
Ad is erroneously detected decreases. Note that the
Euclidean distance dE is the amount determined by the
partial response waveform Ht and correct identification
data (= recorded data) Ad. If the correct
identification data Ad is [0001111], the erroneous
identification data Ad which provides the minimum
Euclidean distance dE is [0000111], and the square of
the minimum Euclidean distance dE is 10.
In the general MMS method, the tap coefficient
Ws is determined under that condition that ε' = E[Vd 2]
given by equation (2) is minimized. Assume that a noise
characteristic is white, i.e., that when an
autocorrelation Rf is defined as Rf = E[Vd x vd+f], all
values Rf. other than R0 = ε' = E[vd 2] are 0. In this
case, optimal detection performance can be obtained with
the tap coefficient Ws determined by the general MMSE
method. However, the noise characteristic of a playback
signal obtained from the information recording medium 10
is generally chromatic, and values Rf other than R0 do
not become 0. In this case, the mean square of an
equalization error must be calculated in consideration
of the contribution of Rf other than R0 as well. The
FIR filters 16 and 17 in Fig. 5 are added for the
consideration of the contribution of Rf other than R0.
Tap coefficients rm (m is an integer satisfying 1 ≦ m ≦
M; M is a tap count and an integer satisfying 1 ≦ M <
k) are determined depending on a partial response
waveform.
A reference for setting the tap coefficient rm
for each of the FIR filters 16 and 17 will be described
in detail in correspondence with an actual partial
response waveform.
Letting hj be a partial response waveform and
eL (eL is one of values of -1, 0, and 1) be an error
data string, it suffices to obtain rm and eL which
minimize A defined by A = Σrm 2 (Σ represents the sum of
m) and rm = Σhm-L x eL (Σ represents the sum of L).
Reducing A increases the effect of suppressing the
occurrence of erroneous detection between the
identification data ak with the small Euclidean distance
dE. In Viterbi detection, erroneous detection tends to
occur between identification data ak with the small
Euclidean distance dE. Assume that the partial response
waveform hj is represented by PR(1, 2, 2, 1), i.e., h1 =
1, h2 = 2, h3 = 2, h4 = 1, and hJ = 0 (J is an integer of
five or more). In this case, if e1 = 1 and other values
eL are 0, A = 10 becomes the minimum value when r1 = 1,
r2 = 2, r3 = 2, r4 = 1, and rM = 0 (M is an integer of
five or more). Assume that the partial response
waveform hj is represented by PR(1, 2, 2, 2, 1), i.e.,
h1 = 1, h2 = 2, h3 = 2, h4 = 2, h5 = 1, and hJ = 0 (J is
an integer of six or more). In this case, if e1 = 1, e2
= 0, e3 = -1, e4 = 0, and e5 = 1 and other values eL are
0 [can also be expressed as eL (1, 0, -1, 0, 1)], A = 12
becomes the minimum value when r1 = 1, r2 = 2, r3 = 1, r4
= 0, r5 = 0, r6 = 0, r7 = 1, r8 = 2, r9 = 1, and rM = 0 (M
is an integer of 10 or more) [can also be expressed as
rm = (1, 2, 1, 0, 0, 0, 1, 2, 1)]. Note that in the
case of PR(1, 2, 2, 2, 1), when eL = (1, 0, -1) or eL =
(1, 0, -1, 0, 1, 0, -1), A = 12. It was, however,
experimentally confirmed that the bER can be improved
most effectively by minimizing the mean square of an
equalization error with respect to eL = (1, 0, -1, 0, 1)
[rm = (1, 2, 1, 0, 0, 0, 1, 2, 1)] in consideration of
chromaticity. However, by applying this embodiment to
eL = (1, 0, -1) [rm = (1, 2, 1, 0, -1, -2, -1)] or eL =
(1, 0, -1, 0, 1, 0, -1) [rm = (1, 2, 1, 0, 0, 0, 0,
0, -1, -2, -1)], the bER is improved as compared with
the conventional technique of minimizing equation (2)
without any consideration of chromaticity. Even if,
therefore, these values are set as rm, a bER improving
effect can be obtained. In addition, all value rm other
than these values which can improve the bER can be used.
However, setting rm = (1, 2, 1, 0, 0, 0, 1, 2, 1)
provides the best bER improving effect.
In summary of the above, in this embodiment,
as shown in Fig. 5, it suffices to obtain the tap
coefficient w
i for the
FIR filter 14 under the condition
that E given by the following equation is minimized or
a quasi-condition for the minimization, in addition to
the FIR filters 16 and 17.
where E[ ] represents the mean of k in the
expression in [ ].
In this case, if the partial response waveform
hj is determined, rm can be obtained in the above
manner. If a plurality of rm candidates exist as in the
case of PR(1, 2, 2, 2, 1), the minimum value of ε is
calculated for each rm, and rm which provides the
smallest minimum value may be selected as rm which
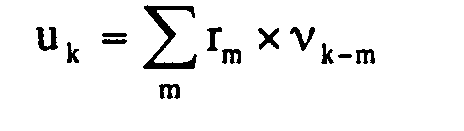
should be obtained. The value νk given by equation (8)
is the result of convolution computation for the final
identification data (= recorded data) ak and the partial
response waveform hj, i.e., the output from the FIR
filter 15. The value uk given by equation (7) is the
result of convolution computation for the output νk
from the FIR filter 15 and the tap coefficient rm of the
FIR filter 16.
Σwi x zk-i in equation (5) can be rewritten
into Σrm x xk-m (Σ is the sum of m) if xk = Σwi x yk-i (Σ
is the sum of i). Note that xk is the result of
convolution computation for the tap coefficient wi of
the FIR filter 14 and the playback waveform data yk,
i.e., the output from the FIR filter 14. Therefore,
Σrm x xk-m, i.e., Σwi x zk-i, is the result of
convolution computation for the tap coefficient rm of
the FIR filter 17 and the output xk from the FIR filter
14, i.e., the output from the FIR filter 17. Therefore,
referring to Fig. 5, minimizing ε of equation (5)
indicates that the coefficient calculator 19 receives
outputs from the FIR filters 16 and 17 and calculates
the tap coefficient wi for the FIR filter 14 so as to
minimize the mean square value of an equalization error,
which is the difference between the outputs, in
consideration of chromaticity.
The coefficient calculator 19 which calculates
the tap coefficient wi may have a function of solving
simultaneous equations with multiple variables of δ E =
0 obtained by calculating the deviation δ ε with respect
to wi in ε of equation (5) or a function of adaptively
performing iterative convergence calculation starting
from the proper initial value of the tap coefficient wi.
When simultaneous equations with multiple variables are
to solved as in the former case, the playback waveform
data yk may be directly input to the FIR filter 17
without being through the FIR filter 14 in Fig. 15.
Although the technique of calculating the tap
coefficient wi by convergence calculation as in the
latter case does not coincide with the condition that E
is minimized and may just satisfy a quasi-condition for
the minimization, the circuit arrangement can be made
more simply.
In this embodiment, equalization is performed
under the condition that the mean square of an
equalization error is minimized, so as to reduce the
error between data strings with the small Euclidean
distance dE between ideal signals in consideration of
the chromaticity of the equalization error.
Combinations of specific data patterns which reduce the
Euclidean distance dE between ideal signals may be set
in advance, and the tap coefficient wi may be determined
by this embodiment only when one of the data patterns is
detected. With respect to other data patterns, wi may
be determined by the conventional technique. This
technique, however, additionally requires a table for
the registration of these data patterns and a circuit
for discriminating the data patterns. Therefore,
determining wi without selecting such a data pattern is
more convenient.
Second Embodiment
Fig. 7 shows the playback unit of a
recording/playback apparatus for a rewritable optical
disk. The same reference numerals as in Fig. 5 denote
the same constituent elements in Fig. 7, and a
repetitive description will be avoided as appropriate.
In the recording/playback apparatus for a
rewritable optical disk, known data ak is recorded on a
disk 10a to allow adjustment of a tap coefficient wi.
In this case, since the recorded data ak is known in
advance, an output from a Viterbi detector 18 need not
be input to an FIR filter 15. That is, it suffices to
input the known recorded data ak to the FIR filter 15.
The Viterbi detector 18 only outputs the recorded
signal. In this embodiment, since the final
identification data ak in the first embodiment is input
to the FIR filter 15 from the beginning, the tap
coefficient wi can be determined faster.
Third Embodiment
Fig. 8 shows an information playback apparatus
according to the third embodiment of the present
invention. The same reference numerals as in Fig. 5
denote the same constituent elements in Fig. 8, and a
repetitive description will be avoided as appropriate.
A function similar to that of the playback
apparatus according to the first embodiment shown in
Fig. 5 is realized by the playback apparatus according
to the third embodiment shown in Fig. 8. This
embodiment is configured to make a subtracter 20
calculate an equalization error which is the difference
between an output signal (target waveform) from an FIR
filter 15 and a playback data string or the output data
string obtained by inputting the playback data string to
an FIR filter 14 and input the equalization error to an
FIR filter 21 having a tap coefficient rm instead of
inputting the playback data string and the output signal
(target waveform) from the FIR filter 15 to the FIR
filters 16 and 17 and inputting the outputs from the FIR
filters to the subtracter 20. A tap coefficient wi for
the FIR filter 14 is then obtained under the condition
that ε given by equations (5) to (8) is minimized or
quasi-condition for the minimization.
Note that in this embodiment, an equalization
error calculator 3 is comprised of the subtracter 20 and
FIR filter 21.
In this embodiment, the tap coefficient wi may
be adjusted by using known recorded data ak as in the
second embodiment.
Fourth Embodiment
Fig. 9 shows an information playback apparatus
according to the fourth embodiment of the present
invention. The same reference numerals as in Figs. 5
and 8 denote the same constituent elements in Fig. 9,
and a repetitive description will be avoided as
appropriate.
In the first to third embodiments, a
predetermined data string is used as the data string hj
defining a partial response waveform. However, hj can
be determined from a playback waveform data string.
If, for example, the tangent tilt of a disk
greatly deviates from the normal state, the playback
waveform obtained from the disk exhibits large
asymmetry. This is because the difference between the
target partial response waveform and the actual playback
waveform increases, and the waveform cannot be equalized
to the target partial response waveform without
increasing noise. In this case, the detection
performance can be improved more by obtaining hj from
the actual waveform than by using the predetermined hj.
In this embodiment, therefore, as shown in
Fig. 9, playback waveform data xk obtained by
convolution computation and output from an FIR filter 14
and identification data ak output from a Viterbi
detector 18 are input to a pulse response calculator
(partial response waveform calculation means) 22, which
in turn calculates a data string hj and tap coefficient
rm. The calculated data string hj and tap coefficient rm
are respectively input FIR filters 15 and 21. In this
case, the branch metric value of the Viterbi detector 18
must be changed in accordance with the obtained data hj.
In addition, the pulse response calculator 22
may be provided for the information playback apparatus
according to the first embodiment shown in Fig. 5, and
the calculated data string hj and tap coefficient rm may
be input to the FIR filter 15 and FIR filters 16 and 17.
Experiment 1
The effects of the above embodiments were
checked by using a phase change optical disk as the
information recording medium 10.
The data obtained by recording random data
modulated on the basis of the (1 - 7) modulation scheme
at a linear density of 130 nm/bit with a recording power
as a parameter by using an optical head with a
wavelength of 405 nm and numeral aperture NA = 0.65 was
played back by the information playback information
shown in Fig. 5, and a bER was measured. More
specifically, time-series playback data sampled at a
clock period is equalized to PR(1, 2, 2, 2, 1) and
identified (binarized) by the Viterbi detector 18, and a
bER was measured by comparing the original data [the
random data modulated on the basis of the (1 - 7)
modulation scheme]. The tap count of the FIR filter 14
was set to 9, and the tap coefficient of each of the FIR
filters 16 and 17 was set to rm = (1, 2, 1, 0, 0, 0, 1,
2, 1).
Fig. 10 shows the measurement result on a bER
as a function of recording power. Fig. 10 also shows
the result obtained by measuring a bER upon playing back
data by using the conventional information playback
apparatus without the FIR filters 16 and 17. A curve A
represents the bER measured by the arrangement according
to the first embodiment, and a curve B represents the
bER measured by the conventional arrangement. It is
obvious that the bER is improved at any recording power
by the first embodiment as compared with the prior art.
Experiment 2
Data identical to that in Experiment 1 was
recorded on a phase change optical disk identical to
that in Experiment 1 at the same linear density by using
the information playback apparatus in Fig. 5 which had
the same specifications as those in Experiment 1. After
data was recorded at one recording power under optimal
conditions, the tilt angle of the disk was changed, and
a bER was measured in the arrangement of the first
embodiment and in the conventional arrangement in the
same manner as in Experiment 1. A partial response
waveform and the arrangements of the FIR filters 14, 16,
and 17 are the same as those in Experiment 1.
As is obvious from Fig. 11, the bER (curve C)
measured by the arrangement of the first embodiment is
greatly improved at any tilt angle as compared with the
bER (curve D) measured by the conventional arrangement.
Experiment 3
The effects of the above embodiments were
checked by using a playback-only optical disk as the
information recording medium 10.
Pit strings with a depth of about 100 nm were
formed in the playback-only optical disk by recording
random data modulated on the basis of the (1 - 7)
modulation scheme at a linear density of 210 nm/bit. A
playback signal was played back from these pit strings
by using an optical head with a wavelength of 660 nm and
numerical aperture NA = 0.6 while the tilt angle of the
disk was changed. As in Experiment 2, a bER was
measured in the arrangement according to the first
embodiment and in the conventional arrangement. In this
experiment, however, PR(1, 2, 2, 1) was selected as a
partial response waveform, the tap count of the FIR
filter 14 was set to 7, and the tap coefficient of each
of the FIR filters 16 and 17 was set to rm = (1, 2, 2,
1).
As is obvious from Fig. 12, the bER (curve E)
measured by the arrangement according to the first
embodiment was greatly improved at any tilt angle as
compared with the bER (curve F) measured by the
conventional arrangement as in the case of the phase
change optical disk in Experiment 2 shown in Fig. 11.
Experiment 4
A data string hj defining a partial response
waveform was obtained by using the information playback
apparatus according to the fourth embodiment shown in
Fig. 9. With this operation, even if the tangent tilt
of the disk greatly deviates from the normal state and
the asymmetry of the playback waveform obtained from the
disk increases, since the partial response waveform
itself which is an equalization target is set to an
asymmetrical waveform, the difference between the
partial response waveform and the actual playback
waveform can be reduced, and an increase in noise in
partial response equalization can be suppressed.
More specifically, even if PR(1, 2, 2, 2, 1)
is selected as the target partial response waveform hj,
when the tangent tilt is large, the waveform cannot be
equalized to (1, 2, 2, 2, 1). For example, as in the
case of h1 = 1.0, h2 = 1.8, h3 = 2, h4 = 1.9, and h5 =
1.1, an symmetrical waveform represented by h1 ≠ h4 and
h2 ≠ h5 appears. In this case, A = Σrm 2 (E is the sum
of m) described in the first embodiment takes the
minimum value represented by A = 10.9 with respect to
error data string eL = (1, 0, -1, 0, 1), and the tap
coefficient rm is defined by rm = (1, 1.8, 1,
0.1, -0.1, -0.1, -0.9, 1.9, 1.1).
In this manner, rm can be determined on the
basis of a playback waveform from a disk as well as from
) a predetermined coefficient.
In order to calculate hj on the basis of a
playback waveform from a disk, the pulse response
calculator 22 of the information playback apparatus
shown in Fig. 9 may use the least squares method
disclosed in, for example, reference 3. In this case,
hj can be calculated from the equalized waveform data
string and the identification data output from the
Viterbi detector 18 or the data string recorded on the
disk.
In the circuit arrangement shown in Fig. 9,
the first equalization is performed by the MMSE method
as in the prior art with, for example, (1, 2, 2, 2, 1)
being set a target. Then, hj is derived from the
equalized waveform and the identification data or the
data string recorded on the disk by the least squares
method. After hj is derived, equalization is performed
with hj being set as a target in consideration of the
chromaticity of noise, which is a characteristic feature
of the above embodiment, more specifically, through the
FIR filter 21 having the tap coefficient rm.
Equalization is then performed by the FIR filter 14 with
the tap coefficient wi calculated from the equalized
waveform, thereby outputting final discrimination data
by Viterbi detection.
When the tangent tilt was as large as 0.4°,
bERs were compared under the following three conditions:
(1) equalization was performed by the conventional
method (MMSE), (2) equalization was performed by using
(1, 2, 2, 2, 1) as h
j in consideration of the
chromaticity of noise, and (3) h
j was derived from the
actual playback waveform and equalization was performed
in consideration of the chromaticity of noise. Table 1
shows the result.
| (1) | (2) | (3) |
| 1.0 x 10⁻³ | 5.0 x 10⁻⁴ | 2.0 x 10⁻⁴ |
As described above, in the above embodiments,
when the playback data string yk obtained by playing
back the recorded signal recorded on each of the
information recording media 10 and 10a is to be
equalized to the partial response waveform hj by the FIR
filter 14, convolution computation is performed for the
playback waveform data yk or the output data string from
the FIR filter 14 and the data string obtained by
convolution computation for the identification data
string ak and the partial response waveform hj, and the
tap coefficient wi for the FIR filter 14 is determined
on the basis of the obtained data string. With this
operation, the tap coefficient wi for the FIR filter 14
is calculated on the basis of the autocorrelation of the
noise component (equalization error) vd of the playback
waveform data yk equalized to the partial response
waveform hj. As a consequence, the detection
performance of the Viterbi detector 18 is optimized, and
hence the bER is improved. In addition, the playback
margins of the tilt, defocus, and the like of each of
the information recording media 10 and 10a are
increased.