EP1429157B1 - Verfahren und Vorrichtung zur verbesserten Tiefenanpassung von Bohrlochbildern oder Probenbildern - Google Patents
Verfahren und Vorrichtung zur verbesserten Tiefenanpassung von Bohrlochbildern oder Probenbildern Download PDFInfo
- Publication number
- EP1429157B1 EP1429157B1 EP02293082A EP02293082A EP1429157B1 EP 1429157 B1 EP1429157 B1 EP 1429157B1 EP 02293082 A EP02293082 A EP 02293082A EP 02293082 A EP02293082 A EP 02293082A EP 1429157 B1 EP1429157 B1 EP 1429157B1
- Authority
- EP
- European Patent Office
- Prior art keywords
- depth
- sensors
- borehole
- dimensional
- data sets
- Prior art date
- Legal status (The legal status is an assumption and is not a legal conclusion. Google has not performed a legal analysis and makes no representation as to the accuracy of the status listed.)
- Expired - Lifetime
Links
- 238000000034 method Methods 0.000 title claims abstract description 58
- 230000015572 biosynthetic process Effects 0.000 claims description 24
- 238000005755 formation reaction Methods 0.000 claims description 24
- 238000012545 processing Methods 0.000 claims description 8
- 238000003860 storage Methods 0.000 claims description 6
- 238000012935 Averaging Methods 0.000 claims description 3
- 230000001131 transforming effect Effects 0.000 claims 1
- 230000008569 process Effects 0.000 abstract description 6
- 238000006073 displacement reaction Methods 0.000 description 19
- 238000005259 measurement Methods 0.000 description 14
- 230000002596 correlated effect Effects 0.000 description 8
- 238000005314 correlation function Methods 0.000 description 8
- 238000007598 dipping method Methods 0.000 description 7
- 238000004422 calculation algorithm Methods 0.000 description 6
- 239000011435 rock Substances 0.000 description 5
- 230000000875 corresponding effect Effects 0.000 description 4
- 238000010586 diagram Methods 0.000 description 4
- 238000007619 statistical method Methods 0.000 description 3
- 206010017076 Fracture Diseases 0.000 description 2
- 238000010420 art technique Methods 0.000 description 2
- 238000004364 calculation method Methods 0.000 description 2
- 230000007246 mechanism Effects 0.000 description 2
- BVKZGUZCCUSVTD-UHFFFAOYSA-L Carbonate Chemical compound [O-]C([O-])=O BVKZGUZCCUSVTD-UHFFFAOYSA-L 0.000 description 1
- 208000006670 Multiple fractures Diseases 0.000 description 1
- 230000002238 attenuated effect Effects 0.000 description 1
- 230000008859 change Effects 0.000 description 1
- 239000004020 conductor Substances 0.000 description 1
- 230000001276 controlling effect Effects 0.000 description 1
- 238000013016 damping Methods 0.000 description 1
- 230000001419 dependent effect Effects 0.000 description 1
- 230000001627 detrimental effect Effects 0.000 description 1
- 238000011161 development Methods 0.000 description 1
- 230000000694 effects Effects 0.000 description 1
- 230000001747 exhibiting effect Effects 0.000 description 1
- 238000003384 imaging method Methods 0.000 description 1
- 238000011065 in-situ storage Methods 0.000 description 1
- 230000001788 irregular Effects 0.000 description 1
- 239000000463 material Substances 0.000 description 1
- 239000003129 oil well Substances 0.000 description 1
- 230000010355 oscillation Effects 0.000 description 1
- 230000002093 peripheral effect Effects 0.000 description 1
- 238000005070 sampling Methods 0.000 description 1
- 239000007787 solid Substances 0.000 description 1
- 230000000007 visual effect Effects 0.000 description 1
Images


Classifications
-
- G—PHYSICS
- G01—MEASURING; TESTING
- G01V—GEOPHYSICS; GRAVITATIONAL MEASUREMENTS; DETECTING MASSES OR OBJECTS; TAGS
- G01V11/00—Prospecting or detecting by methods combining techniques covered by two or more of main groups G01V1/00 - G01V9/00
-
- G—PHYSICS
- G01—MEASURING; TESTING
- G01V—GEOPHYSICS; GRAVITATIONAL MEASUREMENTS; DETECTING MASSES OR OBJECTS; TAGS
- G01V3/00—Electric or magnetic prospecting or detecting; Measuring magnetic field characteristics of the earth, e.g. declination, deviation
- G01V3/18—Electric or magnetic prospecting or detecting; Measuring magnetic field characteristics of the earth, e.g. declination, deviation specially adapted for well-logging
- G01V3/20—Electric or magnetic prospecting or detecting; Measuring magnetic field characteristics of the earth, e.g. declination, deviation specially adapted for well-logging operating with propagation of electric current
-
- G—PHYSICS
- G01—MEASURING; TESTING
- G01V—GEOPHYSICS; GRAVITATIONAL MEASUREMENTS; DETECTING MASSES OR OBJECTS; TAGS
- G01V3/00—Electric or magnetic prospecting or detecting; Measuring magnetic field characteristics of the earth, e.g. declination, deviation
- G01V3/38—Processing data, e.g. for analysis, for interpretation, for correction
Definitions
- This invention relates to logging of boreholes. More specifically, the invention relates to methods for improving correlation of core images, borehole images and well logging data derived from sensors located on a well logging tool as it passes through a borehole, and to corresponding well logging tools.
- a string of well logging tools having multiple sensors for measuring characteristics of the earth formation along the wall of a borehole is lowered via a cable to the bottom of the borehole.
- Geophysical data is recorded by way of the sensors as the cable is wound in using a precision winch.
- the depth in the earth at which the sensors on the logging tools are positioned as data is logged is determined by measuring the logging speed and cable depth.
- Devices such as a depth wheel measurement instrument and an axial accelerometer may be utilized.
- measurements taken along the length of a borehole by logging tools are intended to provide indications of oil-bearing or gas-bearing strata in the earth.
- measurements of various characteristics or parameters of earth formations are usually obtained by combining measurements (data logs) taken by way of multiple sensors during a single pass through the borehole, or taken during different passes through the same borehole. When combining such measurements it is necessary that they be accurately correlated in depth with one another to be useful.
- the non-uniform motion may be caused by such thing as: (a) damped longitudinal oscillations of the logging tool on the cable, (b) sticking and slipping of the logging tool against the sides of a borehole or the wall of casing in the borehole, and (c) irregular motion of the sensors that are mounted on mechanical arms that have independent motion with respect to the logging tool itself.
- data collected by a particular sensor on the logging tool at any specific depth in the borehole may not show as being recorded at the specific depth but at a different depth.
- data from different sensors of the same tool may not show as having been recorded at the same depth for all those sensors.
- the FMS system uses a tool having wall-engaging pads each carrying an array of electrical sensors distributed in the circumferential direction with respect to the axis of the borehole. Signal voltages generated by the sensors are sampled as the well logging tool moves along the borehole. The signals are processed and rendered visible, by photographic or other printout, or by cathode-ray tube display as a two-dimensional visible image is formed over logged segments of the borehole walls. In such images, bed boundaries can be visually identified from sharp visible contrasts in the images, which reflect sharp changes in resistivity at boundaries of the beds. The images thus obtained may exhibit a resolution on the order of 0.5 cm, allowing very fine details of the formation to be distinguished due to the number of sensors in the circumferential direction, and the high rate of sampling in the longitudinal direction.
- U.S. Patent No. 4,251,773, issued Feb. 17, 1981 to Michel Cailliau and Philippe Vincent teaches the use of signals from sensors to determine dip (inclination) and azimuth (strike) of bed boundaries. More specifically, this patent teaches a logging tool that has four substantially identical pads with sensors angularly distributed about the axis of the logging tool in a side-by-side relationship and adapted to engage the borehole wall at ninety-degree intervals. The sensors provide resistivity measurements of the respective sectors of the borehole wall engaged by the pads. As the logging tool is moved along the borehole wall, the sensors continuously provide signals measuring the resistivity of the adjacent earth formation. Sharp variations in resistivity indicate boundaries between different beds in the earth formation. The signals produced by the sensors at different angular positions of the pads are processed to provide information about the dip of bed boundaries, i.e., the orientations of the bed boundaries with respect to a terrestrial reference, and the azimuth of the dip.
- a step of determining the normalized correlation function is repeated for a number of overlapping groups of well log data samples to produce a number of overlapping correlation functions. At least some of these overlapping correlation functions are combined to produce an improved correlation function that is used to depth correlate the well log data to a common, accurate depth level.
- the document US 4,517, 835 describes a method for determining formation dip.
- a plurality of formation resistivity logging data sets is generated along a borehole. From the data formation dip values are preliminarily determined at different elevations along the borehole. The dip values are combined for each borehole elevation of interest in a functional relationship utilizing a variable scatter parameter related to dip direction and magnitude variations whereby the resulting dip value at each elevation is taken as the corrected value.
- the variable scatter parameter may be selectively varied to produce variable representations as desired of formation dip, including visual representations. These variable representations may range from those excluding dip data points inconsistent with prevailing geological interpretation patterns and thereby exhibiting progressively less scatter to those representations including more available and possible dip values with scatter to be interpreted.
- depth match and “depth matching” used hereinafter mean correlating sets of data taken by different vertically spaced sensors belonging to different levels of sensors, such as sensors S1a - S1d and S2a - S2d in Figure 1A , during a single pass of a logging tool through a borehole, or during different passes through a borehole.
- the vertical offset between different levels of sensors causes signals coming from sensors in a first level of a logging tool to be generated at a slightly different time than the signals coming from sensors in a second level. The difference in these times is also dependent on logging speed variations.
- the effects of the time-offset need to be compensated to "depth match" the signals coming from the sensors at both levels.
- individual traces from the sensors of any first specific level of sensors on a logging tool are converted into one signal representing those traces.
- the one signal represents all the traces (averaged log signal) and includes an average borehole-crossing signal.
- the averaged log signal is generated by performing a prior art computation of bedding dips or flowlines (angle and azimuth) on the traces from each sensor and an average or median computation is applied to all the samples from sub-sensors that comprise each sensor aligned along the pre-determined dip. This is repeated for a second specific level of sensors vertically offset from the first specific level of sensors and a second averaged signal is obtained.
- the Hough transform is utilized to generate three-dimensional images from well log signals.
- the three dimensional images are used to create two-dimensional extremum curves that are in turn used to calculate an offset.
- the offset is used to depth match the well log signals obtained from vertically spaced sensors on a well logging tool, or signals obtained during different logging passes through the same borehole.
- the detrimental effects of partial and non-overlapping sensor coverage of a borehole wall are reduced, if not eliminated, because of the characteristics of the Hough image transform, and because depth matching is finally applied to the two dimensional extremum curves derived from the three-dimensional images.
- a depth matching offset is calculated directly from two dimensional extremum curves derived from the Hough three-dimensional images without the need for calculating dip and azimuth of bed boundaries in an earth formation and compensating for it before the depth matching may be performed.
- the teaching of the present invention may be utilized with records, no matter how obtained or made.
- the records may be a large number of azimuthally oriented traces obtained either from sensors applied to a borehole wall, from sensors scanning a borehole azimuthally, from sensors scanning azimuthally the cylindrical surface of a whole core, or from sensors probing an azimuthally oriented core section cut, by stacking the pixels/measures along the apparent dip directions seen on the core section cut.
- FIG. 1 there is shown an investigating tool 10 in a borehole 11 for investigating subsurface earth formations.
- Investigating tool 10 is supported in borehole 11 on an end of a cable 12.
- Cable 12 passes over a sheave wheel 13 and is secured to a drum and winch mechanism 14.
- the drum and winch mechanism 14 includes a suitable brush and slip ring arrangement for providing electrical connections between the cable conductors and a control panel 15.
- the control panel 15 operates to supply power and control signals to investigating tool 10, and includes suitable electronic circuitry for receiving well logging signals from sensors on the investigating tool.
- the well logging signals may be stored on a digital tape recorder 16.
- Tape recorder 16 converts analog signals received from control panel 15 into digital signals and is stepped as a function of depth by a driving wheel 17 that engages cable 12. The digital signals are then either transmitted or carried to a computer system 18 for processing.
- Computer system 18 comprises a processor, display and plotter for processing and displaying well logging data.
- Investigating tool 10 has a reference point 20 that constitutes the center or recording point of tool 10. Because of long elastic cable 12, investigating tool 10 is subject to displacement arising from cable stretch thus causing the true depth level to be different from the depth level registered by a depth recorder 19 derived from driving wheel 17. The depth level registered by depth recorder 19, which is identical with that registered by the tape recorder 16, is designated "Z". When attempting to depth match well log data produced by different sensors of investigating tool 10 there is a distinct possibility that the well logs recorded at the same depth level will not be referenced to the same depth level.
- sensors are located on two vertically spaced levels L1 and L2 as shown, and their positions are described in greater detail starting in the next paragraph. These sensors produce the well logging signals that are received by control panel 15.
- Figure 1A is a simplified representation of a portion of tool 10 about reference point 20 showing the layout of sensors thereon. Sensors are usually mounted on pads that engage the wall of a borehole or casing in a borehole, although the pads are not shown in Figure 1A . In the highly simplified arrangement described herein there is only one sensor on each pad. In Figure 1A the sensors are represented by boxes with an "x" therein and are designated S1a - S1d in level L1 and S2a - S2d in level L2. In Figure 2 there is shown a more detailed representation of an investigating tool 10.
- Figure 1A shows two levels L1 and L2 of sensors positioned in two parallel planes.
- Level L1 has four sensors S1a- S1d spaced ninety degrees apart
- level L2 has four sensors S2a - S2d spaced ninety degrees apart.
- the level L2 sensors are rotated or offset forty-five degrees with respect to the level L1 sensors. The spacing of the sensors in each of levels L1 and L2, and the rotational offset between the two planes, results in the orientation of all the sensors around a borehole as represented on the circle at the top of Figure 1A .
- An example of a sensor that may be used on tool 10 is one that measures resistivity or conductivity to detect and measure boundary layers in a borehole.
- Such a sensor is taught in U.S. Patent 4,786,874 issued November 22, 1988 to Donald S. Grosso and Allen Duckworth .
- the patented device utilizes electrical conductivity or resistivity to detect and measure boundary layers.
- Figure 2 is a picture of an actual well logging tool 10 with its arms 52a - 52d, pads 53a - 53d, and sensors S1a - S1d thereon.
- Arms 52a - 52d move independently as tool 10 moves through a borehole to account for irregularities in the wall of the borehole. These arms also move perpendicularly to the axis of a borehole to keep sensors on the pads in contact with the wall of the borehole.
- Pads 53a - 53d are respectively connected to arms 52a - 52d and move therewith.
- sensors S1a - S1d On the surface of pads 53a - 53d are mounted sensors S1a - S1d. Each of the sensors S1a - S1d may include a number of smaller sub-sensors.
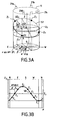
- a bedding plane or fault intersects a borehole 11 at an angle relative to the axis of the borehole, it is inclined or dipping and creates a "dipping event" and the intersection is represented by an ellipse 57 as shown in Fig. 3a .
- Fig. 3A are representatively shown four traces 21a - 21d taken by the four sensors S1a - S1d in level L1 of Fig. 1A as the tool moves through the borehole.
- the traces are not shown extending longitudinally along the periphery of borehole 11 to avoid cluttering up Fig. 3A .
- the four traces intersect ellipse 57 at four points Z 1 - Z 4 . These four points represent the different times at which the four sensors S1a - S1d will generate a signal representing the same dipping event as the sensors in level L1 are passed through borehole 11.
- Fig. 3B When the portion of the wall of borehole 11 represented in Figure 3A is unrolled to a flat position, the ellipse 57 appears as a sinusoid 58 as shown in Fig. 3B .
- the location of trace-intersect points Z 1 - Z 4 are shown on sinusoid 58.
- traces 22a - 22d in level L2 of Fig. 1B were shown plotted on Fig. 3A , which they are not since they are not in level L1, they would appear in Fig. 3B as the four intersect points Z 5 - Z 8 and are interspaced between points Z 1 - Z 4 on sinusoid 58 as shown.
- Fig. 3B With all eight intersect points shown in Fig. 3B it can be seen how a dipping event is represented as a sinusoid 58.
- the vertical displacement distance ⁇ Z 0 from point Z 0 to each of points Z 1 - Z 4 in level L1 may be calculated.
- r( ⁇ , Z 0 + ⁇ Z 0 ) for round cylindrical boreholes is constant and the borehole intersection is an ellipse.
- the pattern seen is a sinusoid.
- the amplitude of this sinusoid is a function of the dip angle, and its phase is a function of the orientation of the surface with respect to north (strike angle or azimuth).
- the intersection is not an ellipse and the pattern is a distorted sinusoid. Obviously, the amount of distortion depends upon the degree of departure of the borehole from a perfect cylinder.
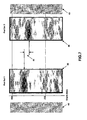
- Fig. 4 shows displays 21 and 22 with traces 21a - 21d and 22a - 22d respectively.
- the set of traces 21a - 21d is from the four sensors S1a - S1d in level L1
- the set of traces 22a - 22d is from sensors S2a - S2d in level L2 as seen in Figure 1A .
- the traces are obtained during logging of borehole 11.
- Each sensor may include at least one row of smaller sub-sensors.
- each sub-sensor generates a signal, and the side-by-side combination of such signals from the sub-sensors generates the eight traces 21a - 21d and 22a - 22d.
- sensor S1a produces trace 21a at an arbitrarily assigned azimuth of 0 degrees.
- sensor S1b produces trace 21b at an arbitrary azimuth of 90 degrees
- sensor S1c produces trace 21c at an arbitrary azimuth of 180 degrees
- sensor S1d produces trace 21d at an arbitrary azimuth of 270 degrees.
- the four level L2 sensors S2a - S2d that produce traces 22a - 22d have the same azimuthal spacing with respect to one another as the level L1 sensors, i.e., the level L2 sensors are spaced apart at ninety degrees among themselves. However, as shown in Fig.
- these sensors are oriented at a forty-five degree offset relative to the level L1 sensors as explained with reference to Figure 1A . Accordingly, trace 22a is at forty-five degrees, trace 22b is at one-hundred thirty five degrees and so on.
- logging tool 10 As logging tool 10 moves along borehole 11, it may rotate horizontally a small amount and its azimuth orientation may change. This creates the horizontal image skewing of the four traces shown in each of displays 21 and 22. The skewing is shown as the traces not being in a vertical, straight line.
- Superimposed on display 21 are drawn two sinusoidal waveforms 26 and 27 that reflect common borehole crossing features shown in traces 21a - 21d.
- "Borehole crossing features” designate rock features that are going across the borehole as opposed to smaller localized rock features that may be seen by fewer than all the pads of a level of sensors.
- superimposed on display 22 are two sinusoidal waveforms 28 and 29 that reflect common borehole crossing features shown in traces 22a - 22d.
- sinusoidal waveforms 26 - 29 always reflect a "dip" in a bedding plane or fault that intersects borehole 11.
- the amplitude of the waveforms indicates the degree or angle of dip, and the location of the peaks of the waveforms (phase) indicates the direction or azimuth of the dip.
- traces 21a - 21d and 22a - 22d of displays 21 and 22 are generated from sensor signals taken in the same borehole, they generally would look alike except for a vertical displacement 30, reflecting the spacing between the level L1 and L2 sensors, and the azimuth offset between the level L1 and L2 sensors.
- the vertical displacement of the traces in images 21 and 22 reflects the fact that sensors S1a - S1d are physically located above sensors S2a - S2d on logging tool 10 as shown on Fig. 1A .
- some vertical displacement may be caused by other factors such as stretching of cable 12 as previously described.
- Fig. 4 also shows single borehole crossing traces 23 and 24 that are obtained from the individual traces 21a-d and 22 a-d shown in this Figure.
- Each single trace 23 and 24 respectively represents one set of traces 21a - 21d and 22a - 22d, each set being converted into single traces 23 and 24 respectively.
- traces 23 and 24 are obtained by performing an average or median operation among each corresponding set of traces 21a - 21d and 22a - 22d, each trace 23 and 24 representing the average value of a specific earth (rock) feature crossing the borehole.
- Each of the average traces 23 and 24 is generated by first performing a prior art computation of bedding dips or flowlines on the individual traces from each sensor of a specific level. As a result, sinusoidal waveforms, such as 26 are obtained. Then, an average or median computation is applied to all the sample images (responses from sub-sensors) located along the sinusoid waveform 26 (bedding dip) obtained.
- an average or median computation is applied to all the sample images (responses from sub-sensors) located along the sinusoid waveform 26 (bedding dip) obtained.
- the determination of a sinusoidal waveform relies on the dip and azimuth of each bed boundary.
- the dip and azimuth of a bed boundary as a function of depth in a borehole may be determined from traces of the borehole by using prior art techniques such as the Hough transform described in the background of the invention.
- the averaged traces 23 and 24 may be determined mathematically as follows.
- the intersection between a bedding plane and the borehole at a given depth Z 0 may be expressed mathematically as follows.
- the Greek symbols ⁇ and Z are the coordinate system of the borehole image space
- A(Z 0 ) and ⁇ 0 (Z 0 ) are the amplitude and azimuth of the bedding plane at the depth Z 0 .
- the average signal trace at depth Z 0 , S(Z 0 ), is then calculated as follows.
- I( ⁇ , Z) be the pixel values of the traces comprising a borehole image.
- S Z 0 ⁇ ⁇ ( I ( ⁇ , Z 0 + A Z 0 ⁇ cos ⁇ - ⁇ 0 Z 0 / N V ; with N v being the number of valid pixels (non-absent) along a sinusoid at depth Z 0 .
- Depth values Z 0 may be obtained by way of the teaching set forth in the references cited in the background of the invention (apparatus and methods for determining the required accurate depth measurements).
- the prior art teaches using such things as cables on a precision winch, a depth wheel measurement instrument, and sometimes an axial accelerometer whose output is integrated to help overcome the known problems inherent in precisely measuring how deep a well logging tool is in a borehole. These depth measurements are shown as the 100 depth unit and 110 depth unit measurements on the graphs in Figs. 4 and 5 .
- two well logs A and B such as from levels L1 and L2, to be correlated are initially considered to be depth matched in accordance with the depth indicia on magnetic tape on which the log data is recorded, such as the depth from depth recorder 19 on recorder 16 in Fig. 1 .
- a first assumed value of the depth displacement is computed between the B log and the A log at each selected depth level from Z a to Z b in increments of ⁇ y .
- the A log is considered to be the base log and the displacement for the B log relative to the A log is computed.
- the B log is effectively shifted one step ⁇ z at a time and a correlation function C K is computed at each such step using equation (1) shown in col. 4 of the Tinch et al patent.
- this depth displacement is not computed unless C K (max) is equal to or greater than C K (lim). This prevents weak correlation quantities from causing depth displacements. If C K (max) is greater than C K (lim), the displacement SH(Z) is computed and entered into the history file for statistical analysis. This computed value SH(Z) is only a first assumption of the depth displacement which may be changed by the statistical analysis.
- This statistical analysis takes the form of declaring a depth displacement only when a consecutive number of identical depth displacements have been computed. By so doing, an occasional erroneous depth displacement caused by noise, for example, will not cause log B to be depth displaced.
- the process is basically the same as described above for two sets of data.
- one set of data (from the sensors at one depth) is used as a reference set of data and the offset therefrom to each of the other data sets is determined.
- the offset calculated for each of the other data sets is then applied to the other data sets to depth match to the reference data set.
- FIG. 6 is shown a block diagram of the steps involved in performing depth correlation of different sets of signal traces in accordance with the teaching of the first embodiment of the invention.
- borehole images represented by the traces 21a-21d from sensors S1a - S1d are obtained and oriented azimuthally.
- borehole images represented by the traces 22a - 22d from sensors S2a - S2d are obtained and oriented azimuthally.
- the two sets of traces 21a - 21d and 22a - 22d reflect dip of bedding layers in the borehole and also reflect the azimuths of the dips.
- the dip indicated by each of these sets of images is calculated using a prior art dip calculation technique such as the one applying the Hough transform described in the patent mentioned in the background of the invention in connection with the Hough transform.
- the calculated dip for traces 21a - 21d is used along with the traces themselves to generate a single trace 23.
- the calculated dip for the traces 22a - 22d is used along with the traces themselves to generate a single trace 24.
- a prior art single log trace depth matching technique such as taught in the above cited and described Tinch et al patent, is applied to traces 23 and 24 to determine the optimum depth offset necessary for precisely matching the borehole traces 22a - 22d to traces 21a - 21d.
- the traces 22a - 22d are shifted relative to traces 21a - 21d to depth match them.
- two-dimensional well log traces 21a - 21d and 22a - 22d of Fig. 4 are transformed into three dimensional Hough space using the Hough transform to get three dimensional images of which only one representative slice 39 and 40 are shown in Figure 7 .
- the Hough transform is well known and used in the prior art to transform two-dimensional well logs into three-dimensional Hough space images from which dip and azimuth is determined.
- the Hough transform as used herein transforms a sinusoidal waveform into a point in a three dimensional space and a plurality of sinusoidal waveforms making up the two-dimensional space into the three dimensional Hough space images. These images are made up of a plurality of image slices 39 and 40.
- Slice 39 is one of the slices of the three-dimensional image produced by the Hough transform from well log traces 21a - 21d.
- Slice 40 is one of the slices of the three-dimensional image produced by the Hough transform from well log traces 22a - 22d.
- Depth matching is accurately and automatically accomplished using the three-dimensional images created by the Hough transform from well logging traces 21a - 21d and 22a - 22d.
- the three-dimensional Hough images have properties that make them suitable for depth matching of well logging images. Those properties are: (1) insensitivity to gaps (missing data) in the original well logging images (the gaps in the original well logging images are the spaces between traces 21a - 21d and between 22a - 22d in Figs. 4 and 5 ), (2) insensitivity to rotation and orientation of the pads, and (3) dip in the well logging images does not have to be calculated before depth matching of the well logging images is performed.
- extremum curves 42 and 43 representing traces 21a - 21d and 22a - 22d respectively, are produced from the three-dimensional Hough images.
- the extremum curves 42 and 43 reflect certain rock features in the earth, and represent peak values in the three dimensional space at a given depth.
- the image signal peaks (local maxima) in the three dimensional Hough images 39 and 40 appear as peaks in the extremum curves 42 and 43.
- Hough Transform can transform images from a defined coordinate system to a different coordinate system is more fully explained in an article entitled " Use of the Hough Transform to Detect Lines and Curves in Pictures", Duda, R. P. and Hart, P. E., ACM, vol. 15, no. 1 pp. 11-15 .
- the Hough transform technique was initially developed to detect straight lines in binary images. However, due to its simplicity, the technique was extended to detect other types of simple analytic shapes like circles and ellipses and is used today to recognize patterns even when they do not have an analytic description.
- the Hough transform makes it possible to determine, from an image, the specific parameters characterizing a geometrical shape such as a straight line, a circle, an ellipse, or a sinusoid curve, such as curves 26 - 29 in Fig. 4 .
- the Hough transform projects points of these shapes into three dimensional parameter space referred to as Hough space. More specifically, when the Hough Transform is used to process data points on a two-dimensional line or curve they are, mathematically speaking, transformed into three dimensional parameter space where the dip and strike angles are dimensions within the parameter space.
- every sinusoid is a two-dimensional curve that may be mathematically expressed as follows.
- An abscissa ⁇ , and an ordinate Z where Z can be expressed as: Z Z 0 + A cos ( ⁇ - ⁇ 0 ).
- Z Z 0 + A cos ⁇ 0 cos ⁇ + A sin ⁇ 0 sin ⁇ .
- A is the amplitude of a dip indicated by the two dimensional sinusoid in a well log image
- ⁇ 0 is the offset (phase) of azimuth of the dip
- Z 0 is the zero crossing depth of the sinusoid.
- the Greek symbols ⁇ and Z are the coordinate system of the logging image space
- X 0 , Y 0 and Z 0 are the coordinate system of the three dimensional Hough image space.
- a value may be obtained and associated to a point (X 0 , Y 0 , Z 0 ) in the Hough space.
- the value obtained is high if the sinusoid associated to a point in the Hough space lies on a sinusoidal feature having a high pixel value in a well logging image.
- the obtained value is low if the sinusoid associated with a point lies on a sinusoidal feature having a low pixel value in a well logging image.
- a medium background measurement is obtained.
- H(X 0 , Y 0 , Z 0 ) be a 3D array of the Hough transform.
- Figure 8 is shown a block diagram of the steps involved in translating signals taken from the two sets of sensors S1a - S1d and S2a - S2d into three dimensional Hough space ( Fig. 7 ) to determine a depth matching offset to be used to match traces 21a - 22d and 22a - 22d in accordance with the teaching of the second embodiment of the invention.
- traces 21a - 21d in level L1 are obtained, and at block 45 traces 22a - 22d in level L2 are obtained, both using prior art apparatus and techniques as described in the background of the invention.
- traces 21a - 21d in Level L1 are processed using the Hough transform to produce the three-dimensional Hough image of which one slice is shown as image 39 in Figure 7 .
- traces 22a - 22d in Level L2 are processed using the Hough transform to produce the three-dimensional Hough image of which one slice is shown as image 40 in Figure 7 .
- the three-dimensional Hough image produced in block 46 is used to compute a two-dimensional extremum curve
- the three-dimensional Hough image produced in block 49 is used to compute a two-dimensional extremum curve.
- a depth shift offset is calculated using the two extremum curves.
- extremum curves 42 and 43 are created from the three-dimensional Hough images 39 and 40.
- An automatic depth matching calculation is performed directly on the extremum curves, without the need for calculating dip and azimuth of bed boundaries in an earth formation, to calculate a depth match offset.
- the calculated depth match offset calculated from the extremum curves is then used to depth match traces 21a - 21d and 22a - 22d as shown in Fig. 5 .
- the overlaid, depth matched traces now show combined data every forty-five degrees around the borehole as represented in Fig. 1A .
- the process is basically the same as described for two sets of data.
- one set of data (from the sensors at one depth) is used as a reference set of data and.
- the vertical offset therefrom to each of the other plurality of data sets is determined and then applied to the other data sets to depth match to the reference data set.
- the Hough transform a plurality of two-dimensional well log traces are each transformed into three-dimensional Hough space using the Hough transform to get three dimensional images. Extremum curves are then derived from each of the three-dimensional Hough images. Automatic depth matching is then performed directly on the extremum curves, as previously described.
- a prior art depth matching algorithm is then used to compare the extremum curves representing the reference data set with the extremum curves representing each of the plurality of other data sets to thereby determine a depth shift offset that will correlate them to the reference set.
- the depth shift offset that is determined using each set of extremum curves is then applied to the corresponding data set to depth match it to the reference data set.
- the above description describes two embodiments of a system wherein borehole logging data is collected by sensors on a logging tool passing through a borehole.
- the sensor signals representing the data are transmitted via a cable to the earth surface, as shown in Fig. 1 , to be stored and processed.
- computer processor and storage capability may be added to the logging tool and depth match processing of the data from the sensors is done in real time in-situ.
- the depth matched data is then either extracted from storage after the logging tool is extracted from the borehole, or the real time depth matched data is transmitted to the surface of the earth over cables that transmit data from sensors to above ground equipment as shown in Fig. 1 .
- the depth matched data from the processor at the logging tool may be transferred from the logging tool to the surface using remote telemetry capability.
- a transmitter with the logging tool transmits the depth matched data determined by the receiver downhole to a receiver on the surface of the earth without the need for a physical connection between the downhole logging tool and the receiver. Once the depth matched data is received by the receiver it may be transmitted to a location from the borehole for analysis or other processing.
- images of borehole walls and borehole core irrespective of the measured parameter which forms the images such as, for example, rock conductivity, resistivity, magnetic susceptibility, photoelectric factor, density of the formation, amplitude of acoustic reflections, photographic brightness, etc.
- an image from one logging run in a borehole may be compared to an image from another logging run in the same borehole, and an image from a borehole may be compared to an image of a core from the borehole.
- images obtained from a cased borehole may be depth matched using the teaching of the present invention.
- the present invention may be used to depth match logs obtained by a logging tool from a borehole during coring as taught in U.S. Patent 6,003,620 issued December 21, 1999 to Mukul M. Sharma, Roger T. Bonnecaze and Bernard Zemel .
- pads and sensors on two levels each level having four pads spaced ninety degrees apart, and there being one sensor on each pad.
- the pads in one level are rotated forty five degrees with respect to the pads in the other level.
- data or images from any type of transducer, sensor, scanner or camera may be processed and depth matched using the teaching of the present invention in both of its embodiments.
Claims (16)
- Verfahren zur Tiefenanpassung mehrerer Datenmengen von Bohrlöchern oder von Kernabschnitten, wobei die Datenmengen, die von Sensoren (S1a-S1d, S2a-S2d) erhalten werden (44, 45), zweidimensionale Datenmengen sind und eine Erdformation, eine Grenze oder eine Grenzfläche von Erdformationen sowie eine Neigung in der Umgebung des Bohrlochs (11) angeben, wobei das Verfahren zur Tiefenanpassung dadurch gekennzeichnet ist, dass:(a) die zweidimensionalen Datenmengen unter Verwendung einer Hough-Transformation in dreidimensionale Bilder transformiert werden (46, 47);(b) aus den dreidimensionalen Bildern zweidimensionale Extremwert-Kurven abgeleitet werden (48, 49); und(c) aus den zweidimensionalen Kurven ein Versatz abgeleitet wird (50), um ihn auf die zweidimensionalen Datenmengen anzuwenden, um sie in Bezug auf die Tiefe einander anzupassen.
- Verfahren nach Anspruch 1, wobei das Verfahren ferner dadurch gekennzeichnet ist, dass die zweidimensionalen Kurven Peaks haben, die Neigungsereignisse in der Umgebung des Bohrlochs angeben.
- Verfahren nach Anspruch 1, wobei das Verfahren ferner dadurch gekennzeichnet ist, dass die zweidimensionalen Datenmengen Lücken in den Daten haben und die dreidimensionalen Bilder, die unter Verwendung der Hough-Transformation erzeugt werden, frei von den Lücken sind.
- Verfahren nach Anspruch 1, wobei das Verfahren ferner dadurch gekennzeichnet ist, dass zweidimensionale Kurven für zweidimensionale Datenmengen von Sensoren, die in Längsrichtung des Bohrlochs vertikal voneinander beabstandet sind, verarbeitet werden, um einen Versatz zu bestimmen, der die zweidimensionalen Kurven einander anpasst.
- Verfahren nach Anspruch 4, wobei das Verfahren ferner dadurch gekennzeichnet ist, dass der bestimmte Versatz auf die zweidimensionalen Datenmengen von den vertikal beabstandeten Sensoren angewendet werden, um für die zweidimensionalen Datenmengen eine gegenseitige Tiefenanpassung vorzunehmen.
- Verfahren zur Tiefenanpassung mehrerer Datenmengen von Bohrlöchern oder Kernabschnitten, wobei die Datenmengen, die von Sensoren (S1a-S1d, S2a-S2d) erhalten werden (31, 32), zweidimensionale Datenmengen sind und eine Grenze, eine Grenzfläche von Erdformationen sowie eine Neigung in der Umgebung des Bohrlochs angeben, wobei das Verfahren zur Tiefenanpassung umfasst:(a) für jede zweidimensionale Datenmenge der mehreren Datenmengen Kombinieren (35, 36) einzelner Signale, die die jeweilige zweidimensionale Datenmenge aufbauen, um ein gemitteltes Signal zu erzeugen;(b) Verarbeiten (37) gemittelter Signale, wovon jedes einer zweidimensionalen Datenmenge entspricht, um einen Versatz zu berechnen, der die gemittelten Signale korreliert; und(c) Anwenden (38) des berechneten Versatzes auf die zweidimensionalen Datenmengen, um sie bezüglich der Tiefe einander anzupassen,dadurch gekennzeichnet, dass das gemittelte Signal durch Bestimmen eines Durchschnitts der Sensorsignale längs der Schichtungsneigung für eine gegebene Tiefe im Bohrloch erhalten wird.
- Verfahren nach Anspruch 6, wobei die Berechnung von Schichtungsneigungen für die Sensorsignale mittels der Hough-Transformation ausgeführt wird.
- Verfahren nach den Ansprüchen 1 oder 6, wobei das Verfahren ferner dadurch gekennzeichnet ist, dass zweidimensionale Datenmengen, die bezüglich der Tiefe einander angepasst werden sollen, gleichzeitig durch Sensoren, die in Längsrichtung des Bohrlochs vertikal voneinander beabstandet sind, erhalten werden.
- Verfahren nach den Ansprüchen 1 oder 6, wobei das Verfahren ferner dadurch gekennzeichnet ist, dass zweidimensionale Datenmengen, die bezüglich der Tiefe einander angepasst werden sollen, zu verschiedenen Zeiten für dasselbe Bohrloch erhalten werden.
- Verfahren nach den Ansprüchen 1 oder 6, wobei das Verfahren ferner dadurch gekennzeichnet ist, dass eine zweidimensionale Datenmenge, die bezüglich der Tiefe angepasst werden soll, von einem Kernabschnitt erhalten wird.
- Verfahren nach den Ansprüchen 1 oder 6, wobei jedes der Sensorsignale von einem von mehreren Sensoren (S1a-S1d, S2a-S2d) erhalten wird.
- Verfahren nach Anspruch 11, wobei jeder Sensor (S1a-S1d, S2a-S2d) mehrere Untersensoren enthält.
- Verfahren nach Anspruch 12, wobei jedes Signal eine Spur (21a-21d, 22a-22d) enthält, wobei die Spur eine Seite-an-Seite-Kombination von Signalen von den mehreren Untersensoren ist.
- Verfahren nach den Ansprüchen 1 oder 6, wobei das Verfahren ferner dadurch gekennzeichnet ist, dass es auf eine Echtzeit-Tiefenanpassung von zweidimensionalen Datenmengen von Sensoren, die in Längsrichtung des Bohrlochs vertikal voneinander beabstandet sind, anwendbar ist.
- Bohrloch-Protokollierungswerkzeug, das mehrere Sensoren (S1a-S1d, S2a-S2d), einen Prozessor (18), Speichermittel (16) und eine Tiefenaufzeichnungseinrichtung (19), die dazwischengeschaltet ist, umfasst, wobei die mehreren Sensoren (S1a-S1d, S2a-S2d) dazu ausgelegt sind, Datenmengen zu erzeugen, die eine Erdformation, eine Grenze oder eine Grenzfläche von Erdformationen sowie eine Neigung in der Umgebung des Bohrlochs angeben, wobei die Datenmengen an den Prozessor (18) übertragen und in den Speichermitteln (16) gespeichert werden, dadurch gekennzeichnet, dass der Prozessor (18) dazu ausgelegt ist, eine Tiefenanpassung mehrerer Datenmengen von Bohrlöchern oder von Kernabschnitten auszuführen, wobei er umfasst:Mittel, um die zweidimensionalen Daten (46, 47) unter Verwendung der Hough-Transformation in dreidimensionale Daten zu transformieren;Mittel, um aus den dreidimensionalen Bildern die zweidimensionalen Extremwert-Kurven (48, 49) abzuleiten; undMittel, um aus den zweidimensionalen Kurven einen Versatz (50) abzuleiten, um ihn auf die zweidimensionalen Datenmengen anzuwenden, um sie bezüglich der Tiefe einander anzupassen.
- Bohrloch-Protokollierungswerkzeug, das mehrere Sensoren (S1a-S1d, S2a-S2d), einen Prozessor (18), Speichermittel (16) und eine Tiefenaufzeichnungseinrichtung (19), die dazwischengeschaltet ist, umfasst, wobei die mehreren Sensoren (S1a-S1d, S2a-S2d) dazu ausgelegt sind, Datenmengen zu erzeugen, die eine Erdformation, eine Grenze oder eine Grenzfläche von Erdformationen sowie eine Neigung in der Umgebung des Bohrlochs angeben, wobei die Datenmengen an den Prozessor (18) übertragen und in den Speichermitteln (16) gespeichert werden, wobei der Prozessor (18) dazu ausgelegt ist, eine Tiefenanpassung mehrerer Datenmengen von Bohrlöchern oder Kernabschnitten auszuführen, das umfasst:Mittel, um für jede zweidimensionale Datenmenge der mehreren Datenmengen einzelne Signale, die die jeweilige zweidimensionale Datenmenge aufbauen, zu kombinieren, um ein gemitteltes Signal zu erzeugen;Mittel, um gemittelte Signale zu verarbeiten, wovon jedes einer zweidimensionalen Datenmenge entspricht, um einen Versatz zu berechnen, der die gemittelten Signale korreliert;Mittel, um den berechneten Versatz auf die zweidimensionalen Datenmengen anzuwenden, um sie bezüglich der Tiefe einander anzupassen, unddadurch gekennzeichnet, dass der Prozessor umfasst:Mittelungsmittel, um das gemittelte Signal durch Bestimmen eines Durchschnitts der Sensorsignale längs der Schichtungsneigung für eine gegebene Tiefe im Bohrloch zu erhalten.
Priority Applications (7)
| Application Number | Priority Date | Filing Date | Title |
|---|---|---|---|
| AT02293082T ATE445855T1 (de) | 2002-12-13 | 2002-12-13 | Verfahren und vorrichtung zur verbesserten tiefenanpassung von bohrlochbildern oder probenbildern |
| DE60234040T DE60234040D1 (de) | 2002-12-13 | 2002-12-13 | Verfahren und Vorrichtung zur verbesserten Tiefenanpassung von Bohrlochbildern oder Probenbildern |
| EP02293082A EP1429157B1 (de) | 2002-12-13 | 2002-12-13 | Verfahren und Vorrichtung zur verbesserten Tiefenanpassung von Bohrlochbildern oder Probenbildern |
| MXPA05006055A MXPA05006055A (es) | 2002-12-13 | 2003-10-27 | Metodo y aparato para la adaptacion de la profundidad de las imagenes de pozos de sondeo o imagenes del nucleo. |
| AU2003302943A AU2003302943A1 (en) | 2002-12-13 | 2003-10-27 | Method and apparatus for improved depth matching of borehole images or core images |
| US10/537,893 US7346454B2 (en) | 2002-12-13 | 2003-10-27 | Method and apparatus for improved depth matching of borehole images or core images |
| PCT/EP2003/012205 WO2004055551A1 (en) | 2002-12-13 | 2003-10-27 | Method and apparatus for improved depth matching of borehole images or core images |
Applications Claiming Priority (1)
| Application Number | Priority Date | Filing Date | Title |
|---|---|---|---|
| EP02293082A EP1429157B1 (de) | 2002-12-13 | 2002-12-13 | Verfahren und Vorrichtung zur verbesserten Tiefenanpassung von Bohrlochbildern oder Probenbildern |
Publications (2)
| Publication Number | Publication Date |
|---|---|
| EP1429157A1 EP1429157A1 (de) | 2004-06-16 |
| EP1429157B1 true EP1429157B1 (de) | 2009-10-14 |
Family
ID=32319693
Family Applications (1)
| Application Number | Title | Priority Date | Filing Date |
|---|---|---|---|
| EP02293082A Expired - Lifetime EP1429157B1 (de) | 2002-12-13 | 2002-12-13 | Verfahren und Vorrichtung zur verbesserten Tiefenanpassung von Bohrlochbildern oder Probenbildern |
Country Status (7)
| Country | Link |
|---|---|
| US (1) | US7346454B2 (de) |
| EP (1) | EP1429157B1 (de) |
| AT (1) | ATE445855T1 (de) |
| AU (1) | AU2003302943A1 (de) |
| DE (1) | DE60234040D1 (de) |
| MX (1) | MXPA05006055A (de) |
| WO (1) | WO2004055551A1 (de) |
Cited By (1)
| Publication number | Priority date | Publication date | Assignee | Title |
|---|---|---|---|---|
| US10970814B2 (en) | 2018-08-30 | 2021-04-06 | Halliburton Energy Services, Inc. | Subsurface formation imaging |
Families Citing this family (41)
| Publication number | Priority date | Publication date | Assignee | Title |
|---|---|---|---|---|
| US6724916B1 (en) * | 2000-01-05 | 2004-04-20 | The United States Of America As Represented By The Secretary Of The Navy | Composite hough transform for multitarget multisensor tracking |
| US7492664B2 (en) * | 2005-10-31 | 2009-02-17 | Baker Hughes Incorporated | Method for processing acoustic reflections in array data to image near-borehole geological structure |
| US20070213935A1 (en) * | 2005-12-29 | 2007-09-13 | Schlumberger Technology Corporation | Method and System to Display Well Properties Information |
| US7933166B2 (en) * | 2007-04-09 | 2011-04-26 | Schlumberger Technology Corporation | Autonomous depth control for wellbore equipment |
| GB2462711B (en) * | 2007-04-09 | 2010-04-14 | Schlumberger Holdings | Autonomous depth control for wellbore equipment |
| EP2160631B1 (de) | 2007-06-07 | 2017-03-01 | Paradigm Sciences Ltd. | Einrichtung und verfahren zum anzeigen von vollazimutwinkel-domänenbilddaten |
| US8826173B2 (en) * | 2007-09-26 | 2014-09-02 | Siemens Aktiengesellschaft | Graphical interface for the management of sequential medical data |
| KR100918862B1 (ko) * | 2007-10-19 | 2009-09-28 | 광주과학기술원 | 참조영상을 이용한 깊이영상 생성방법 및 그 장치, 생성된깊이영상을 부호화/복호화하는 방법 및 이를 위한인코더/디코더, 그리고 상기 방법에 따라 생성되는 영상을기록하는 기록매체 |
| GB2467464B (en) * | 2007-11-29 | 2012-10-24 | Schlumberger Holdings | Analyzing borehole by automatically evaluating predicted borehole failure image |
| US20090141943A1 (en) * | 2007-11-29 | 2009-06-04 | Schlumberger Technology Corporation | Analyzing borehole by automatically evaluating predicted borehole failure image |
| US8784701B2 (en) * | 2007-11-30 | 2014-07-22 | Nanoco Technologies Ltd. | Preparation of nanoparticle material |
| US8635025B2 (en) * | 2007-12-27 | 2014-01-21 | Schlumberger Technology Corporation | Method and system for transmitting borehole image data |
| US8818728B2 (en) * | 2007-12-27 | 2014-08-26 | Schlumberger Technology Corporation | Method and system for transmitting borehole image data |
| US8116532B2 (en) * | 2008-08-15 | 2012-02-14 | Baker Hughes Incorporated | Extraction of processed borehole image elements to create a combined image |
| US7878274B2 (en) * | 2008-09-26 | 2011-02-01 | Baker Hughes Incorporated | Steel tooth disk with hardfacing |
| US7866417B2 (en) | 2008-09-26 | 2011-01-11 | Baker Hughes Incorporated | Self sharpening steel tooth cutting structure |
| US7980333B2 (en) | 2008-09-26 | 2011-07-19 | Baker Hughes Incorporated | Bar trimmers on disk bit |
| US8228758B2 (en) * | 2009-01-21 | 2012-07-24 | Schlumberger Technology Corporation | Image generation of a wellbore |
| US8600708B1 (en) | 2009-06-01 | 2013-12-03 | Paradigm Sciences Ltd. | Systems and processes for building multiple equiprobable coherent geometrical models of the subsurface |
| US8743115B1 (en) | 2009-10-23 | 2014-06-03 | Paradigm Sciences Ltd. | Systems and methods for coordinated editing of seismic data in dual model |
| US9482775B2 (en) * | 2010-01-22 | 2016-11-01 | Schlumberger Technology Corporation | Real-time formation anisotropy and dip evaluation using tri-axial induction measurements |
| WO2013112466A1 (en) * | 2012-01-23 | 2013-08-01 | Schlumberger Canada Limited | Method to characterize heterogeneous anisotropic media |
| GB2503010B (en) * | 2012-06-14 | 2018-04-18 | Reeves Wireline Tech Ltd | A method of processing geological log data |
| US10753202B2 (en) | 2012-06-14 | 2020-08-25 | Reeves Wireline Technologies Limited | Geological log data processing methods and apparatuses |
| WO2014003786A1 (en) | 2012-06-29 | 2014-01-03 | Halliburton Energy Services, Inc. | Multi - axial induction borehole imager |
| MX343007B (es) | 2012-06-29 | 2016-10-21 | Halliburton Energy Services Inc | Imagenologia de microimpedancias de tensor total. |
| GB2511744B (en) * | 2013-03-11 | 2020-05-20 | Reeves Wireline Tech Ltd | Methods of and apparatuses for identifying geological characteristics in boreholes |
| RU2596080C2 (ru) * | 2013-07-18 | 2016-08-27 | Хэллибертон Энерджи Сервисиз, Инк. | Обнаружение положения границ многочисленных подземных слоев |
| EP3033485A1 (de) * | 2013-12-27 | 2016-06-22 | Halliburton Energy Services, Inc. | Dielektrischer mehrfrequenz-bohrlochbildgeber |
| US9483871B2 (en) * | 2014-03-25 | 2016-11-01 | Saudi Arabian Oil Company | 360-degree core photo image integration and interpretation in a 3D petrophysical modeling environment |
| CA2967804C (en) | 2014-11-14 | 2023-05-02 | Schlumberger Canada Limited | Image feature alignment |
| US10578758B2 (en) * | 2015-03-19 | 2020-03-03 | Exxonmobil Upstream Research Company | Sequence pattern characterization |
| AU2016282904B2 (en) * | 2015-06-26 | 2019-07-11 | Shell Internationale Research Maatschappij B.V. | Method of calibrating depths of a seismic receiver array |
| US10739489B2 (en) * | 2016-01-15 | 2020-08-11 | Baker Hughes, A Ge Company, Llc | Low gradient magnetic resonance logging for measurement of light hydrocarbon reservoirs |
| US10466388B2 (en) | 2016-09-07 | 2019-11-05 | Emerson Paradigm Holding Llc | System and method for editing geological models by switching between volume-based models and surface-based structural models augmented with stratigraphic fiber bundles |
| CN109804273B (zh) * | 2016-10-06 | 2022-01-11 | 国际壳牌研究有限公司 | 使用地震波进行井眼时移监测的方法 |
| US11604301B2 (en) | 2017-10-24 | 2023-03-14 | Schlumberger Technology Corporation | Methods and systems for automated sonic imaging |
| US11474271B2 (en) | 2017-10-24 | 2022-10-18 | Schlumberger Technology Corporation | Methods and systems for automated sonic imaging |
| WO2020131012A1 (en) * | 2018-12-17 | 2020-06-25 | Halliburton Energy Services, Inc. | Dip correction for non-circular borehole and off-center logging |
| US10520644B1 (en) | 2019-01-10 | 2019-12-31 | Emerson Paradigm Holding Llc | Imaging a subsurface geological model at a past intermediate restoration time |
| US11156744B2 (en) | 2019-01-10 | 2021-10-26 | Emerson Paradigm Holding Llc | Imaging a subsurface geological model at a past intermediate restoration time |
Family Cites Families (12)
| Publication number | Priority date | Publication date | Assignee | Title |
|---|---|---|---|---|
| US4357660A (en) * | 1973-05-01 | 1982-11-02 | Schlumberger Technology Corporation | Formation dip and azimuth processing technique |
| US4320469A (en) * | 1973-05-09 | 1982-03-16 | Schlumberger Technology Corporation | Well logging: depth correlation of logs |
| US4303975A (en) * | 1974-12-30 | 1981-12-01 | Schlumberger Technology Corporation | Dipmeter displacement qualifying technique |
| US4453219A (en) * | 1974-12-30 | 1984-06-05 | Schlumberger Technology Corporation | Dipmeter displacement processing technique |
| FR2319112A1 (fr) * | 1975-07-22 | 1977-02-18 | Schlumberger Prospection | Procede et dispositif pour mesurer la profondeur d'un outil descendu dans un forage au moyen d'un cable |
| US4414656A (en) * | 1980-04-15 | 1983-11-08 | Schlumberger Technology Corporation | Well logging system for mapping structural and sedimentary dips of underground earth formations |
| US4440020A (en) * | 1982-04-01 | 1984-04-03 | Schlumberger Technology Corporation | Well log depth zoning |
| US4517835A (en) * | 1983-09-19 | 1985-05-21 | Dresser Industries, Inc. | Method for determining formation dip |
| US5581024A (en) * | 1994-10-20 | 1996-12-03 | Baker Hughes Incorporated | Downhole depth correlation and computation apparatus and methods for combining multiple borehole measurements |
| US5960371A (en) * | 1997-09-04 | 1999-09-28 | Schlumberger Technology Corporation | Method of determining dips and azimuths of fractures from borehole images |
| MY123577A (en) * | 2000-05-02 | 2006-05-31 | Shell Int Research | Borehole imaging |
| US6633816B2 (en) * | 2000-07-20 | 2003-10-14 | Schlumberger Technology Corporation | Borehole survey method utilizing continuous measurements |
-
2002
- 2002-12-13 EP EP02293082A patent/EP1429157B1/de not_active Expired - Lifetime
- 2002-12-13 DE DE60234040T patent/DE60234040D1/de not_active Expired - Fee Related
- 2002-12-13 AT AT02293082T patent/ATE445855T1/de not_active IP Right Cessation
-
2003
- 2003-10-27 AU AU2003302943A patent/AU2003302943A1/en not_active Abandoned
- 2003-10-27 MX MXPA05006055A patent/MXPA05006055A/es active IP Right Grant
- 2003-10-27 WO PCT/EP2003/012205 patent/WO2004055551A1/en not_active Application Discontinuation
- 2003-10-27 US US10/537,893 patent/US7346454B2/en not_active Expired - Lifetime
Cited By (2)
| Publication number | Priority date | Publication date | Assignee | Title |
|---|---|---|---|---|
| US10970814B2 (en) | 2018-08-30 | 2021-04-06 | Halliburton Energy Services, Inc. | Subsurface formation imaging |
| US11593912B2 (en) | 2018-08-30 | 2023-02-28 | Halliburton Energy Services, Inc. | Subsurface formation imaging |
Also Published As
| Publication number | Publication date |
|---|---|
| US20060031017A1 (en) | 2006-02-09 |
| EP1429157A1 (de) | 2004-06-16 |
| MXPA05006055A (es) | 2005-12-14 |
| US7346454B2 (en) | 2008-03-18 |
| WO2004055551A1 (en) | 2004-07-01 |
| ATE445855T1 (de) | 2009-10-15 |
| AU2003302943A1 (en) | 2004-07-09 |
| DE60234040D1 (de) | 2009-11-26 |
Similar Documents
| Publication | Publication Date | Title |
|---|---|---|
| EP1429157B1 (de) | Verfahren und Vorrichtung zur verbesserten Tiefenanpassung von Bohrlochbildern oder Probenbildern | |
| US4567759A (en) | Method and apparatus for producing an image log of a wall of a borehole penetrating an earth formation | |
| CN105359004B (zh) | 用于井筒电阻率测井校准的方法和系统 | |
| US6984983B2 (en) | System and method for evaluation of thinly laminated earth formations | |
| US8271199B2 (en) | Binning method for borehole imaging | |
| US10451765B2 (en) | Post-well reservoir characterization using image-constrained inversion | |
| US7565244B2 (en) | Method and system for removing effects of conductive casings and wellbore and surface heterogeneity in electromagnetic imaging surveys | |
| US20050083063A1 (en) | Electromagnetic method for determining dip angles independent of mud type and borehole environment | |
| US7991553B2 (en) | Method and system for removing effects of conductive casings and wellbore and surface heterogeneity in electromagnetic imaging surveys | |
| US20110254552A1 (en) | Method and apparatus for determining geological structural dip using multiaxial induction measurements | |
| US11768306B2 (en) | Enhanced anisotropy analysis with multicomponent dipole sonic data | |
| US6377050B1 (en) | LWD resistivity device with inner transmitters and outer receivers, and azimuthal sensitivity | |
| EP0110750B1 (de) | Verfahren und Vorrichtung zur Herstellung eines Bildes von der Wand eines die Bodenschichten durchschlagenden Bohrlochs | |
| Cheung et al. | Field test results of a new oil-base mud formation imager tool | |
| US10371851B2 (en) | Method for formation fracture characterization in highly inclined wells using multiaxial induction well logging instruments | |
| US9568636B2 (en) | Systems and methods for investigating a formation surrounding a borehole | |
| Fulda et al. | High resolution electrical imaging while drilling | |
| Hurley | AAPG Methods in Exploration, No. 16, Chapter 9: Borehole Images | |
| Cheung | Microresistivity and ultrasonic imagers: tool operations and processing principles with reference to commonly encountered image artefacts | |
| Carpenter et al. | Applications and interpretation of azimuthally sensitive density measurements acquired while drilling | |
| Rosthal et al. | Near-bit resistivity tool calculates dip real-time | |
| Yin et al. | A Case Study Of A Strange Induction Log: Modeling Array-Induction Log Response To Sand Injection | |
| Gautama et al. | Ultrasonic Images-New Applications: Examples From Kalimantan | |
| Rosthal et al. | 1. Home Near-bit resistivity tool calculates dip real time April 6, 1998 Formation dip can now be estimated real time using a specially designed logging-while-drilling (LWD), near-bit resistivity tool. The tool is designed to screw directly into the bit, but can be run anywhere in the drillstring. As the tool rotates, a pair of magnetometers measures tool orientation relative to the earth's magnetic field, allowing properly orientated resistivity images and gamma ray measurements to be recorded. |
Legal Events
| Date | Code | Title | Description |
|---|---|---|---|
| PUAI | Public reference made under article 153(3) epc to a published international application that has entered the european phase |
Free format text: ORIGINAL CODE: 0009012 |
|
| AK | Designated contracting states |
Kind code of ref document: A1 Designated state(s): AT BE BG CH CY CZ DE DK EE ES FI FR GB GR IE IT LI LU MC NL PT SE SI SK TR |
|
| AX | Request for extension of the european patent |
Extension state: AL LT LV MK RO |
|
| 17P | Request for examination filed |
Effective date: 20041022 |
|
| AKX | Designation fees paid |
Designated state(s): AT BE BG CH CY CZ DE DK EE ES FI FR GB GR IE IT LI LU MC NL PT SE SI SK TR |
|
| 17Q | First examination report despatched |
Effective date: 20051213 |
|
| GRAP | Despatch of communication of intention to grant a patent |
Free format text: ORIGINAL CODE: EPIDOSNIGR1 |
|
| GRAS | Grant fee paid |
Free format text: ORIGINAL CODE: EPIDOSNIGR3 |
|
| GRAA | (expected) grant |
Free format text: ORIGINAL CODE: 0009210 |
|
| AK | Designated contracting states |
Kind code of ref document: B1 Designated state(s): AT BE BG CH CY CZ DE DK EE ES FI FR GB GR IE IT LI LU MC NL PT SE SI SK TR |
|
| REG | Reference to a national code |
Ref country code: GB Ref legal event code: FG4D |
|
| REG | Reference to a national code |
Ref country code: CH Ref legal event code: EP |
|
| REG | Reference to a national code |
Ref country code: IE Ref legal event code: FG4D |
|
| REF | Corresponds to: |
Ref document number: 60234040 Country of ref document: DE Date of ref document: 20091126 Kind code of ref document: P |
|
| NLV1 | Nl: lapsed or annulled due to failure to fulfill the requirements of art. 29p and 29m of the patents act | ||
| PG25 | Lapsed in a contracting state [announced via postgrant information from national office to epo] |
Ref country code: SE Free format text: LAPSE BECAUSE OF FAILURE TO SUBMIT A TRANSLATION OF THE DESCRIPTION OR TO PAY THE FEE WITHIN THE PRESCRIBED TIME-LIMIT Effective date: 20091014 Ref country code: FI Free format text: LAPSE BECAUSE OF FAILURE TO SUBMIT A TRANSLATION OF THE DESCRIPTION OR TO PAY THE FEE WITHIN THE PRESCRIBED TIME-LIMIT Effective date: 20091014 Ref country code: PT Free format text: LAPSE BECAUSE OF FAILURE TO SUBMIT A TRANSLATION OF THE DESCRIPTION OR TO PAY THE FEE WITHIN THE PRESCRIBED TIME-LIMIT Effective date: 20100215 Ref country code: ES Free format text: LAPSE BECAUSE OF FAILURE TO SUBMIT A TRANSLATION OF THE DESCRIPTION OR TO PAY THE FEE WITHIN THE PRESCRIBED TIME-LIMIT Effective date: 20100125 |
|
| PG25 | Lapsed in a contracting state [announced via postgrant information from national office to epo] |
Ref country code: SI Free format text: LAPSE BECAUSE OF FAILURE TO SUBMIT A TRANSLATION OF THE DESCRIPTION OR TO PAY THE FEE WITHIN THE PRESCRIBED TIME-LIMIT Effective date: 20091014 |
|
| PG25 | Lapsed in a contracting state [announced via postgrant information from national office to epo] |
Ref country code: AT Free format text: LAPSE BECAUSE OF FAILURE TO SUBMIT A TRANSLATION OF THE DESCRIPTION OR TO PAY THE FEE WITHIN THE PRESCRIBED TIME-LIMIT Effective date: 20091014 Ref country code: BE Free format text: LAPSE BECAUSE OF FAILURE TO SUBMIT A TRANSLATION OF THE DESCRIPTION OR TO PAY THE FEE WITHIN THE PRESCRIBED TIME-LIMIT Effective date: 20091014 |
|
| PG25 | Lapsed in a contracting state [announced via postgrant information from national office to epo] |
Ref country code: BG Free format text: LAPSE BECAUSE OF FAILURE TO SUBMIT A TRANSLATION OF THE DESCRIPTION OR TO PAY THE FEE WITHIN THE PRESCRIBED TIME-LIMIT Effective date: 20100114 Ref country code: MC Free format text: LAPSE BECAUSE OF NON-PAYMENT OF DUE FEES Effective date: 20100701 Ref country code: DK Free format text: LAPSE BECAUSE OF FAILURE TO SUBMIT A TRANSLATION OF THE DESCRIPTION OR TO PAY THE FEE WITHIN THE PRESCRIBED TIME-LIMIT Effective date: 20091014 Ref country code: EE Free format text: LAPSE BECAUSE OF FAILURE TO SUBMIT A TRANSLATION OF THE DESCRIPTION OR TO PAY THE FEE WITHIN THE PRESCRIBED TIME-LIMIT Effective date: 20091014 |
|
| REG | Reference to a national code |
Ref country code: CH Ref legal event code: PL |
|
| PLBE | No opposition filed within time limit |
Free format text: ORIGINAL CODE: 0009261 |
|
| STAA | Information on the status of an ep patent application or granted ep patent |
Free format text: STATUS: NO OPPOSITION FILED WITHIN TIME LIMIT |
|
| PG25 | Lapsed in a contracting state [announced via postgrant information from national office to epo] |
Ref country code: CZ Free format text: LAPSE BECAUSE OF FAILURE TO SUBMIT A TRANSLATION OF THE DESCRIPTION OR TO PAY THE FEE WITHIN THE PRESCRIBED TIME-LIMIT Effective date: 20091014 Ref country code: SK Free format text: LAPSE BECAUSE OF FAILURE TO SUBMIT A TRANSLATION OF THE DESCRIPTION OR TO PAY THE FEE WITHIN THE PRESCRIBED TIME-LIMIT Effective date: 20091014 |
|
| 26N | No opposition filed |
Effective date: 20100715 |
|
| PG25 | Lapsed in a contracting state [announced via postgrant information from national office to epo] |
Ref country code: CH Free format text: LAPSE BECAUSE OF NON-PAYMENT OF DUE FEES Effective date: 20091231 Ref country code: GR Free format text: LAPSE BECAUSE OF FAILURE TO SUBMIT A TRANSLATION OF THE DESCRIPTION OR TO PAY THE FEE WITHIN THE PRESCRIBED TIME-LIMIT Effective date: 20100115 Ref country code: LI Free format text: LAPSE BECAUSE OF NON-PAYMENT OF DUE FEES Effective date: 20091231 Ref country code: IE Free format text: LAPSE BECAUSE OF NON-PAYMENT OF DUE FEES Effective date: 20091213 |
|
| PG25 | Lapsed in a contracting state [announced via postgrant information from national office to epo] |
Ref country code: DE Free format text: LAPSE BECAUSE OF NON-PAYMENT OF DUE FEES Effective date: 20100701 |
|
| PG25 | Lapsed in a contracting state [announced via postgrant information from national office to epo] |
Ref country code: IT Free format text: LAPSE BECAUSE OF FAILURE TO SUBMIT A TRANSLATION OF THE DESCRIPTION OR TO PAY THE FEE WITHIN THE PRESCRIBED TIME-LIMIT Effective date: 20091014 |
|
| PG25 | Lapsed in a contracting state [announced via postgrant information from national office to epo] |
Ref country code: LU Free format text: LAPSE BECAUSE OF NON-PAYMENT OF DUE FEES Effective date: 20091213 |
|
| PG25 | Lapsed in a contracting state [announced via postgrant information from national office to epo] |
Ref country code: TR Free format text: LAPSE BECAUSE OF FAILURE TO SUBMIT A TRANSLATION OF THE DESCRIPTION OR TO PAY THE FEE WITHIN THE PRESCRIBED TIME-LIMIT Effective date: 20091014 |
|
| PG25 | Lapsed in a contracting state [announced via postgrant information from national office to epo] |
Ref country code: CY Free format text: LAPSE BECAUSE OF FAILURE TO SUBMIT A TRANSLATION OF THE DESCRIPTION OR TO PAY THE FEE WITHIN THE PRESCRIBED TIME-LIMIT Effective date: 20091014 |
|
| PG25 | Lapsed in a contracting state [announced via postgrant information from national office to epo] |
Ref country code: NL Free format text: LAPSE BECAUSE OF FAILURE TO SUBMIT A TRANSLATION OF THE DESCRIPTION OR TO PAY THE FEE WITHIN THE PRESCRIBED TIME-LIMIT Effective date: 20091014 |
|
| PGFP | Annual fee paid to national office [announced via postgrant information from national office to epo] |
Ref country code: FR Payment date: 20141208 Year of fee payment: 13 |
|
| REG | Reference to a national code |
Ref country code: FR Ref legal event code: ST Effective date: 20160831 |
|
| PG25 | Lapsed in a contracting state [announced via postgrant information from national office to epo] |
Ref country code: FR Free format text: LAPSE BECAUSE OF NON-PAYMENT OF DUE FEES Effective date: 20151231 |
|
| PGFP | Annual fee paid to national office [announced via postgrant information from national office to epo] |
Ref country code: GB Payment date: 20161207 Year of fee payment: 15 |
|
| GBPC | Gb: european patent ceased through non-payment of renewal fee |
Effective date: 20171213 |
|
| PG25 | Lapsed in a contracting state [announced via postgrant information from national office to epo] |
Ref country code: GB Free format text: LAPSE BECAUSE OF NON-PAYMENT OF DUE FEES Effective date: 20171213 |
|
| P01 | Opt-out of the competence of the unified patent court (upc) registered |
Effective date: 20231208 |