EP1312304A2 - Biomagnetic field measuring apparatus - Google Patents
Biomagnetic field measuring apparatus Download PDFInfo
- Publication number
- EP1312304A2 EP1312304A2 EP20020022202 EP02022202A EP1312304A2 EP 1312304 A2 EP1312304 A2 EP 1312304A2 EP 20020022202 EP20020022202 EP 20020022202 EP 02022202 A EP02022202 A EP 02022202A EP 1312304 A2 EP1312304 A2 EP 1312304A2
- Authority
- EP
- European Patent Office
- Prior art keywords
- data
- tested person
- measuring apparatus
- magnetic field
- biomagnetic field
- Prior art date
- Legal status (The legal status is an assumption and is not a legal conclusion. Google has not performed a legal analysis and makes no representation as to the accuracy of the status listed.)
- Granted
Links
Images












Classifications
-
- A—HUMAN NECESSITIES
- A61—MEDICAL OR VETERINARY SCIENCE; HYGIENE
- A61B—DIAGNOSIS; SURGERY; IDENTIFICATION
- A61B5/00—Measuring for diagnostic purposes; Identification of persons
- A61B5/24—Detecting, measuring or recording bioelectric or biomagnetic signals of the body or parts thereof
- A61B5/242—Detecting biomagnetic fields, e.g. magnetic fields produced by bioelectric currents
- A61B5/243—Detecting biomagnetic fields, e.g. magnetic fields produced by bioelectric currents specially adapted for magnetocardiographic [MCG] signals
Definitions
- This invention relates to a biomagnetic field measuring apparatus for measuring the magnetic field of a living body that is generated by an electric current flowing in the living body, such as neural activity of the brain or myocardial activity of the heart of a living body.
- the invention relates to a biomagnetic field measuring apparatus equipped with a diagnosis support function with which a doctor diagnoses the brain disease and cardiac disease.
- a multi-channel biomagnetic imaging apparatus has been developed by using a superconducting quantum interference device (SQUID) which is a magnetic sensor in order to measure the distribution of very weak magnetic fields generated by the living body, to estimate the positions of active currents in the living body from the measured result and to image the distribution.
- SQUID superconducting quantum interference device
- Technologies related to the biomagnetic imaging apparatus have been disclosed in, for example, Japanese Patents Nos. 3140731 and 3140732.
- the above related arts are concerned with the methods of efficiently and explicitly displaying the principle of operation of the device for displaying biomagnetic field diagram and the measured data, and are referring to the display of waveforms, display of magnetic field-strength diagram and display of magnetic field time-integration diagram.
- Diagnosing the cardiac disease relying only upon these displays requires a high degree of knowledge related to the cardiac function and cardiac disease as well as knowledge concerning the principle of operation of cardiomagnetic measurement and a method of reconstituting the data. Therefore, medical doctors, in general, find it difficult to use the apparatus. Further, since a tremendous amount of data are obtained by the measurement, the display conditions for the diagnosis must be selected and set requiring extended periods of time.
- this invention is constituted as described below.
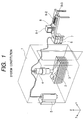
- Fig. 1 is a view schematically illustrating the constitution of a biomagnetic field measuring apparatus according to an embodiment of the invention.
- the biomagnetic field measuring apparatus is installed in a magnetical shielded room 1.
- a to-be-tested person 2 who is a living body is measured while lying on a bed 3 facing upward.
- the surface of the living body of the to-be-tested person (in the case of the chest, in general, the surface in parallel with the wall of chest) is nearly in parallel with the surface of the bed 3.
- This surface is in parallel with the plane x-y of the Cartesian coordinates system (x, y, z).
- the chest of the to-be-tested person is curved and is inclined but is, here, regarded to be nearly in parallel for simple explanation.
- a dewar 4 filled with liquid helium which is a coolant.
- the dewar contains a plurality of magnetic sensors that include superconducting quantum interference devices (SQUIDs) and detection coils connected to the SQUIDs. Liquid helium is continuously replenished from the automatic replenishing device 5 placed outside the magnetical shielded room 1.
- SQUIDs superconducting quantum interference devices
- the output of the magnetic sensor is a voltage having a particular relationship to the intensity of the biomagnetic field (can be regarded to be a magnetic flux density) generated from the to-be-tested person 2 and is detected by the detection coil, and is input to an FLL (flux locked loop) circuit 6.
- the FLL circuit 6 cancels the change in the biomagnetic field (biomagnetism) input to the SQUID through a feedback coil (this is called magnetic field lock).
- a feedback coil this is called magnetic field lock
- the output voltage is input to an amplifier/filter/amplifier (AFA) 7, and its output is sampled, subjected to the A/D conversion, and is received by a computer 8.
- AFA amplifier/filter/amplifier
- the computer 8 is a personal computer, wherein 8-1 is a display unit, 8-2 is a keyboard, and 8-3 is a mouse.
- the mouse 8-3 is used for moving a cursor on the screen to select an object that is to be treated. This operation can also be done by operating the keyboard.
- the AFA 7 can be adjusted for its input gain (Igain) and output gain (Ogain).
- the AFA 7, further, includes a low-pass filter (LPF) for passing frequency signals of lower than a first reference frequency, a high-pass filter (HPF) for passing frequency signals of higher than a second reference frequency but is lower than the first reference frequency, and a notch filter or Band Eliminator Filter (BEF) for cutting the commercial power source frequency.
- LPF low-pass filter
- HPF high-pass filter
- BEF Band Eliminator Filter
- a DC SQUID As the SQUID, for example, there is used a DC SQUID.
- a DC bias current (Ibias) is supplied to the SQUID so as to produce a voltage (V) corresponding thereto when an external magnetic field is given to the SQUID.
- V a characteristics curve of V for ⁇ is given by a periodic function, i.e., a ⁇ -V characteristics curve is given by a periodic function.
- the offset voltage (VOFF) of the FLL circuit 6 Prior to taking the measurement, the offset voltage (VOFF) of the FLL circuit 6 is adjusted to bring the DC voltage in the ⁇ -V characteristics curve to the zero level. Further, the offset voltage (AOFF) of the AFA 7 is so adjusted that the output of the AFA 7 becomes zero when the input to the AFA 7 is zero.
- the magnetic field is trapped by the SQUID to hamper its normal operation. That is, observation of the time-waveform of the measured signals indicates that the base line of the signals is changing on the steps and that the noise is becoming extremely great. Further, observation of the ⁇ -V characteristics of the SQUID sensor indicates that the characteristics curve of during the normal operation appears to be a periodic curve having a constant phase with respect to the scanning of ⁇ . If the magnetic flux is trapped, however, the phase changes, and the amplitude of the characteristics curve becomes smaller than that of during the normal operation, from which it is allowed to detect the occurrence of the magnetic flux trapping. In this case, the SQUID is heated to once render it to be normally conducting. Thereafter, the heating is discontinued to remove the trapped magnetic field. The operation of heating the SQUID in this case is called heat flushing.
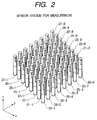
- Fig. 2 illustrates the arrangement of magnetic sensors.
- the detection coils of the magnetic sensors include those coils for detecting the tangential component of the biomagnetic field (component nearly in parallel with the plane of the living body, i.e., nearly in parallel with the plane x-y) and those coils for detecting the normal component of the biomagnetic field (coil intersecting the plane of the living body, i.e., intersecting the plane x-y at right angles).
- the coils for detecting the tangential component of the biomagnetic field there are used two coils having coil planes facing the x-direction and the y-direction.
- a coil for detecting the normal component in the biomagnetic field there is used a coil having a coil plane facing the z-direction.
- a plurality of magnetic sensors 20-1 to 20-8, 21-1 to 21-8, 22-1 to 22-8, 23-1 to 23-8, 24-1 to 24-8, 25-1 to 25-8, 26-1 to 26-8 and 27-1 to 27-8 are arranged like a matrix on a plane nearly in parallel with the plane of the living body, i.e., nearly in parallel with the plane x-y.
- each magnetic sensor is so disposed that the lengthwise direction thereof is in agreement with a direction (z-direction) which is perpendicular to the plane of the living body, i.e., perpendicular to the plane x-y.
- the bed surface is in parallel with the plane X-Y of the sensor.
- Fig. 3 illustrates the constitution of the sensor for detecting the normal component Bz in the biomagnetic field among the magnetic sensors, and wherein a coil formed of a superconducting wire (Ni-Ti wire) has a coil plane which is faced in the z-direction.
- the coil consists of a combination of two coils 10 and 11 facing in the directions opposite to each other, the coil 10 closer to the to-be-tested person 2 serving as a detection coil and the coil 11 on the remote side serving as a reference coil for detecting the external noise magnetic field.
- the external magnetic field noise is generated from a signal source farther than the to-be-tested person and, hence, the noise signal is detected by both the detection coil 10 and the reference coil 11.
- the magnetic field signal from the to-be-tested person is so weak that the biomagnetic field signal is detected by the detection coil 10 but the reference coil 11 does not almost respond to the biomagnetic field signal.
- the detection coil 10 detects the biomagnetic field signal and the external noise field signal
- the reference coil 11 detects the external noise field signal.
- the tangential components Bx, By of the biomagnetism can be detected by facing the detection coil plane and the reference coil plane in the x-direction or in the y-direction (not shown).
- a value obtained by partially differentiating the normal component Bz concerning x and y may be used as a tangential component.
- both the tangential components Bx, By and the normal component Bz can be detected and measured by one magnetic sensor.
- Fig. 4 illustrates a positional relationship between the magnetic sensors and the chest portion 30 which is a portion to be measured of the to-be-tested person 2. Dots represent points where the rows meet the columns on the matrix shown in Fig. 2, i.e., represent measuring points or measuring positions of the to-be-tested person 2. These measuring positions are also called channels.
- the direction of height of the to-be-tested person 2 is regarded to be the y-direction and the transverse direction of the to-be-tested person 2 is regarded to be the x-direction.
- Fig. 5 shows a magnetocardiogram of a normal component Bz of a healthy person.
- the magnetocardiogram comprises P-waves due to an excited atrium, QRS-waves due to the step of excitation in the ventricle of the heart, and T-waves due to the step of recovery from the excitation in the venticle of the heat. It is considered that the signal due to excitation of the heart is nearly zero (0) between the P-wave and the Q-wave, and between the S-wave and the T-wave. The signal level among them is called base line.
- the time zones T1 in which the ventricle of the heat is depolarized i.e., the times of peaks in the QRS waves in the contraction period, are represented as t Q , t R and t S .
- the time zone of the T-waves during the step of re-polarization of the heat is represented as T2.
- Such time waveforms are simultaneously measured by 64 sensors.
- a magnetic field-strength diagram representing the signals (magnetic field intensities) measured by the sensors at a given moment in a two-dimensional manner, therefore, it is allowed to obtain a magnetic field distribution at that moment.
- the positions corresponding to the sensor positions are marked with arrows.
- This direction represents the direction of magnetic field found from the magnetic field data in a artificial-tangential direction obtained by partially differentiating, in the X- and Y-directions, the magnetic field data measured in the tangential direction or the magnetic field data in the normal direction.
- the direction is turned by 90 degrees counterclockwise so as to be brought into agreement with the direction of the current for generating the magnetic field.
- the length of arrow represents the intensity of the magnetic field. Therefore, the arrow map in which the arrows are synthesized on the magnetic field-strength diagram in the tangential direction, represents the distribution of magnetic field depending upon the density of color and size of arrows, and the directions of currents are indicated by the directions of arrows.
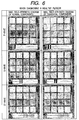
- Fig. 6 is an arrow map based on the magnetic fields in the normal direction and in the tangential direction at every event of P-wave, peak (R) of QRS-wave and T-wave of a typical healthy person (37 years old, male).
- Figs. 6(a) and 6(b) illustrate the results of examining the changes in the magnetic field distribution at every event of P-wave, QRS-wave, and ST-T wave with the passage of time.
- These magnetic field-strength diagrams represent contour lines obtained by connecting the points of the same magnetic field intensities by lines.
- the arrows represent electric currents equivalent to the magnetic fields at the sensors.
- the current dipole is initially estimated in the right lower direction. This direction soon changes into the left lower direction, and a large magnetic field is detected. After exhibited a maximum value in this direction, the magnetic field gradually attenuates. In the last period, the direction changes to the right upper direction and the magnetic field increases and, then, attenuates permitting QRS to terminate. If they are viewed as tangential components, the excited portion is at the center of the screen, and the current flows in the right lower direction. In the R-wave, the direction sharply changes, and the current starts flowing in the left lower direction. The current increases with the time and reaches the peak of the R-wave and, then, gradually attenuates.
- the current flows in the right upper direction and extinguishes. If these excitations are considered at the portions of the heart, it is estimated that the initial current of QRS is corresponding to the excitation which starts at the septum in the ventricle of the heart and moves to the right ventricle of the heart. In the R-wave, further, it is considered that the excitation shifts to the left ventricle, and the excitation appears very greatly from the magnitude of the cardiac muscle. The excitation that ends in the left ventricle then shifts toward the flow-out passage, and the step of depolarization in the ventricle ends.
- the ventricle In the ST-T wave, the ventricle is re-polarized, the excitation continues entirely toward the apex of the heart and, then, the intensity increases and, then, gradually attenuates. During this period, the direction does not almost change but the intensity only changes. This change can similarly be read from the normal components and the tangential components.
- Fig. 7 is a magnetic field-strength diagram in the QRS wave of a male patient of 57 years old suffering from old myocardial infarction.
- the initial vector is directed leftward and is strong, and is considered to be corresponding to abnormal Q-wave in the electrocardiogram. Even in the T-wave, the directivity is different from that of a healthy person.
- the exciting portion is divided into two places, and the multi-dipole property is appearing conspicuously. Ischemiac cardiac disease can be diagnosed from the direction of current, change in the time and multi-dipole property on the magnetic field-strength diagram.
- Fig. 8 is a magnetic field-strength diagram of a male patient of 22 years old suffering from WPW syndrome.
- the WPW syndrome is an abnormal condition in which there exists an abnormal sub-conduction passage in addition to the normal loculus conduction passage and the excitation from the atrium is quickly transmitted to the ventricle of the heart.
- it is allowed to obtain electric physiological data in the heart, which cannot be learned from the time-waveforms.
- feature parameters representing the features of the disease are automatically picked up from the magnetic field-strength diagram and the time-waveform by using a personal computer in order to discriminate whether the to-be-tested person is healthy or is suffering from some diseases relying upon the MTS system (Mahalanobis-Taguchi system).
- MTS system Mohalanobis-Taguchi system
- the MTS system has been closely disclosed in a literature "Quality Engineering for Developing Technology", Nippon Standard Association, but is briefly described below.
- a Mahalanobis distance D 2 defined by the following formula is found concerning the standardized feature parameter Y i .
- D 2 1/k x ( ⁇ a ij Y i Y j ) where a ij is a value of a component a ij in an inverse matrix of a correlation matrix, and Y 1 , Y 2 , ---, Y k are values of items of a number of k of an individual person who is normalized.
- the Mahalanobis distance D 2 becomes 1.0 in average.
- the MTS system builds up a reference space based upon the multi-dimensional data obtained by adding personal data such as sex, age, number of cigarettes smoked, number of years of smoking habit, amount of liquors drunk, number of years of drinking habit and degree of obesity to the results of urine testing and blood testing obtained in, for example, a group health examination.
- the MTS system calculates the Mahalanobis distance for each of the to-be-tested persons.
- a scale is formed for featuring a group of healthy persons, it is allowed to discriminate if the individual to-be-tested persons are healthy or are suffering from some diseases relying upon the Mahalanobis distance.
- This invention was accomplished in an attempt to apply the MTS to the biomagnetic field measuring method.
- the biomagnetic field measurement simply obtains signals representing the magnetic field intensities obtained through plural magnetic sensors. How the obtained signal data be processed and used for the diagnosis has now been studied, and no definite processing method has not been proposed yet.
- a plurality of feature parameters are calculated from the signal data of plural magnetic sensors, and a reference space is built up based on the feature parameters to thereby calculate the Mahalanobis distance. Relying upon the Mahalanobis distance, it is first determined/discriminated whether the to-be-tested person is a healthy person or a person who may be ill.
- the disease is estimated relying upon the feature parameters of the to-be-tested person.
- several disease candidates are quoted. Probabilities of diseases can be represented by quantitative numerical figures.
- the doctor conducts close examination relying upon the methods other than the one for measuring the biomagnetic field, and renders a final diagnosis. Therefore, even a doctor who is not familiar with the measurement of biomagnetic field is allowed to effectively use the biomagnetic field measuring apparatus.
- the results of biomagnetic field measurement of the to-be-tested person can be managed by a database which can be commonly used not only in one hospital but also throughout the city, the prefecture or the country.
- the Mahalanobis distance that serves as a reference for discriminating whether the person is healthy may differ depending upon the sex, age and the region where the to-be-tested person is living.
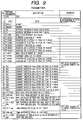
- Fig. 9 illustrates feature parameters in the invention.
- the Mahalanobis distance was calculated by using the above 34 parameters. It was found that the direction of current (Ap1) 10 ms after the peak of R-wave was too strongly correlated to the direction of current (R - pt(Ap)) in the R-wave, and the time integrated value (ST - Tsum) of the ST - T wave was too strongly correlated to the maximum magnetic field intensity (ST - Tmax) in the ST - T wave, and the inverse matrix A of the correlation matrix could not be calculated, and were not, hence, used.
- the SN ratio in the larger-the-better characteristics was too improved when the age was used as a feature parameter due to that the ages used for forming the reference space were deviated to the twenties to the thirties. Therefore, they were not used for the evaluation. Accordingly, the Mahalanobis distance based on 31 items were used as a scale for the diagnosis.
- a reference space was formed from 48 healthy persons by using the above feature parameters, and the Mahalanobis distance D 2 was calculated for a patient 42 suffering from ischemiac cardiac disease.
- the Mahalanobis distances were not larger than 2.0 for all healthy persons but were all D 2 > 2.0 for the patients suffering from the cardiac disease.
- 81% of data possessed the Mahalanobis distances of not smaller than 10.0 and were not within the display range of the graph. Therefore, the drawing states "out of class, 81%".
- the Mahalanobis distance gradually increases from the range of the healthy persons as the cardiac disease proceeds.
- the Mahalanobis distance D 2 is effective in the diagnosis of cardiac disease if there are used suitable feature parameters and a homogeneous set of healthy persons.
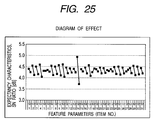
- Fig. 25 is a diagram of effect of feature parameters shown in Fig. 9.
- the ordinate of the diagram of effect represents the SN ratio [dB] in the expectancy characteristics.
- the abscissa represents parameter numbers of from 1 to 31, and the numerals 1, 2 on the upper stage represent a first level and a second level. The first level is when the feature parameter is used, and the second level is when it is not used. Most parameters are descending toward the right. This demonstrates that use of the feature parameters makes it possible to discriminate the healthy persons from the patients maintaining good precision, and it can be said that the larger the degree of descend toward the right, the more effective the parameter is.
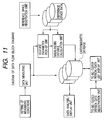
- Fig. 11 is a block diagram of a software for discriminating whether the to-be-tested person is a healthy person or a patient suffering from cardiac disease relying upon the Mahalanobis distance, and illustrates the connection of functional units of a program mounted on a computer 8.
- a to-be-tested person/data list display unit displays a list of data and to-be-tested persons who are to be measured and whose data are to be processed, and receives a selection from the operator.
- the data of the selected to-be-tested person or the data thereof are sent to a data measuring unit and to a data analysis/display unit.
- the data of the to-be-tested person who is to be measured have not been registered in the cardiomagnetic database, the data of the to-be-tested person are registered to a data registration unit.
- the data measuring unit controls the FLL control circuit and the AFA circuit to measure the cardiomagnetic signals from the to-be-tested person.
- the data of the to-be-tested person are sent from the to-be-tested person/data list display unit, and the measuring conditions are sent from the measuring condition-setting unit.
- the data measured in the data measuring unit are stored in the cardiomagnetic database and, at the same time, feature parameters of 31 items are calculated therefrom by the feature parameter pick-up unit, and the Mahalanobis distance is calculated by a Mahalanobis distance calculation unit.
- the Mahalanobis distance calculation unit makes a reference to the Mahalanobis space data. This is because, the registration and updating are accomplished by the reference space registration unit.
- the reference space can be calculated by using, as feature parameters, even such data related to the attribute of the to-be-tested person, such as, age, sex, occupation, race, etc.
- the healthy persons may be classified by using the attribute data of the to-be-testedpersons, and reference spaces corresponding thereto may be separately registered.
- the data analysis/display unit calls the data of the to-be-tested person selected by the to-be-tested person/data list display unit as well as the measured data stored in the cardiomagnetic database, and forms a variety of analytical diagrams used for the diagnosis through GUI.
- a series of operations from the registration of the to-be-tested person through measuring the data of the registered to-be-tested person up to the analysis of the measured data, are carried out while looking at a screen displayed on the display 8-1.
- a screen displayed on the display 8-1 Prior to describing the series of operations, therefore, described below, first, is the layout of the displayed screen.
- Fig. 12 illustrates a basic layout of the display screen displayed on the display 8-1 of Fig. 1.
- the upper part of the display screen is occupied by a title bar portion 801, a menu bar portion 802 and a tool bar portion 803 where icons are arranged, that are successively arranged from the upper side.
- the above portions can be considered to be display regions or areas. These arrangements are displayed in common on the display screen even for other processings, such as registering and reading the to-be-tested person, measuring the magnetic field, and processing for the analysis of measured data. This facilitates the use and makes it possible to shorten the time for measurement and processing.
- the central portion of the display screen is occupied by a to-be-tested person data portion 804-1, a data portion 804-2 concerned to the analytical data, an analytical data portion 805-1 for displaying analytical data such as diagrams or waveforms, a reference waveform portion 805-2, and an operation region 806, which are arranged in order from the left toward the right.
- the data portion 804-2 is displayed on the data portion 804-2, there are displayed, at all times, the data list of a to-be-tested person selected on the screen, and there are displayed the data on which the cursor 92 is placed on the data list.
- the analytical data such as diagrams or waveforms are displayed on the analytical data portion (Figs. 21 to 24), there are displayed, at all times, the analytical data as displayed. This makes it possible to clearly know the data such as time and conditions for measuring the analytical data as displayed.
- the to-be-tested person data portion 804-1 and the data portion 804-2 are displayed at predetermined positions (left side) of the display screen at all times like the menu bar portion 802. Therefore, the user does not have to search the data area of the to-be-tested person after every change of the display screen, but is allowed to know the data area at all times by looking at a predetermined position (left side) of the display screen.
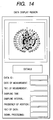
- Fig. 14 illustrates the data display portion.
- the Mahalanobis distance D 2 is the attribute of the measured data and is displayed on the data portion 804-2.
- the radar chart shows the values of the feature parameters. This makes it possible to know any disease or a rough cause thereof (feature parameter having a peculiar value).
- a detailed radar chart of Fig. 20 is displayed.
- the title bar portion displays the name of the frame or, concretely, the name "Multi-Channel MCG System”.
- Fig. 13 illustrates the operation menu.
- the menu bar portion is the one for selecting the operation menu, and is capable of using such menus as "File (F)", “List of To-Be-Tested Persons (L)”, “Data Measurement (Q)”, and "Analysis (A)".
- the contents of operation menu of Fig. 13 are displayed as a pull-down menu upon clicking the menu buttons corresponding to the contents of the menu.
- the operation menu is not required, therefore, only those keywords for calling the menu are displayed in a compact manner on the menu bar portion, making it possible to widely set the display area needed for the operations, such as the analytical data portion, operation region and the like.
- the keywords arranged according to the procedure of operation are selected from the menu bar portion and are displayed to instruct the operation.
- the keywords have been arranged in compliance with the letter arrangement (from the left to the right), and the operation can be instructed in a natural form.
- the pull-down menu of "File (F)” includes an item “End of Cardiomagnetic System (X)” to end the multi-channel MCG system.
- the pull-down menu of the "List of To-Be-Tested Persons (L)” includes such items as "Open the List of the To-Be-Tested Persons (O)", “Register the To-Be-Tested Person (R)", “Delete the To-Be-Tested Person (D)", and “Delete the Data (E)”.
- O Open the List of the To-Be-Tested Persons
- R Registered the To-Be-Tested Person
- D To-Be-Tested Person
- E Delete the Data
- the pull-down menu of "Data Measurement (Q)" in the privileged user mode includes such items as “Open the Measurement Monitor Screen (O)” and “Start the Measurement (M)".
- “Open the Measurement Monitor Screen (O)” is clicked, the display on the display unit 8-1 is changed over to the measurement monitor screen shown in Fig. 21.
- “Start the Measurement (M)” is clicked, the sensor state is automatically adjusted, the magnetic field is locked for all SQUID sensors, and the data are taken in under the specified conditions. After the measurement is finished, the measured data are stored in the cardiomagnetic database. At the same time, the feature parameters are picked up from the measured data and from which the Mahalanobis distance is calculated and is stored in the cardiomagnetic database as the measured data.
- the pull-down menu of "Data Analysis (A)” includes “Display the Time-Waveforms (W)", “Magnetic Field-Strength Diagram (B)", “Time-Integral Diagram (T)", “Display the Summary (S)”, “Re-calculation of Mahalanobis Distance (M)”, “Baseline Correction (C)” and “Set the Reference Space (N)”.
- buttons related to those which are highly frequently used among those items in the pull-down menu in the operation menu are arranged.
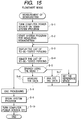
- Fig. 15 illustrates an operation flow related to the whole biomagnetic field measuring apparatus according to the embodiment.
- the operation system rises, and a starter icon of a program that can be used in the computer is displayed on the display unit 8-1 (S-2).
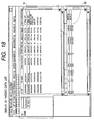
- the icon of the program of multi-channel MCG system is clicked among the icons, the list of the to-be-tested persons shown in Fig. 18 is displayed as the initial screen of the rising system (S-3).
- the screen of list of the to-be-tested persons shown in Fig. 18 will now be described.
- the left upper portion is occupied by the to-be-tested person data portion 804, and the left lower portion is occupied by the data portion 805.
- the list of the to-be-tested persons is displayed on the upper part and the list of data is displayed on the lower part on the whole right side.
- the to-be-tested person data portion displays the data of the to-be-tested person on which the cursor 91 is placed on the list of the to-be-tested persons. As the cursor 91 is moved, the displayed content is updated corresponding thereto.
- the list of the to-be-tested persons include ID (ID number of the to-be-tested person), name, date of registration (date on which data is registered), Mahalanobis distance D 2 , date of birth, age, height, weight and comments (concerning the to-be-tested person.).
- ID ID number of the to-be-tested person
- name name
- date of registration date on which data is registered
- Mahalanobis distance D 2 date of birth
- age height
- weight and comments concerning the to-be-tested person.
- the list of the to-be-tested persons can be scrolled by using the longitudinal scroll bar, and the items of the list of the to-be-tested persons can be scrolled by using the horizontal (transverse) scroll bar.
- the row of the to-be-tested person who is selected is displayed in an emphasized manner.
- a list of measured data is displayed in the lower half of the screen of the list of to-be-tested persons of Fig. 18, thereby to display data attributes such as ID of data, Mahalanobis distance D 2 , date of measurement and the like.
- the list of magnetic field-strength diagrams displays the data for forming the magnetic field-strength diagrams from the measured data.
- the Mahalanobis distance D 2 is displayed on both the list of the to-be-tested persons and the list of the measured data, the former one displaying the greatest one among the Mahalanobis distances D 2 in all of the measured data.
- a row of a desired to-be-tested person is selected out of the list of the to-be-tested persons on the screen of the list of to-be-tested persons at step S-4.
- the flow, thereafter, is branched into four by menu (S-5).
- menu (S-5) there is selected a sub-menu "End of Cardiomagnetic System (X)" in the menu "File (F)".
- the end processing is conducted such as closing the window (S-8) and, then, the system is shut down (S-9). Then, the power source of the computer 8 is turned off (S-10), and everything ends.
- the measurement of data can be executed by selecting a sub-menu "Open the Measurement Monitor Screen (O)” in the menu “Measurement of Data (Q)".
- the analysis of data can be executed by selecting any one of the sub-menus “Display Time-Waveforms (W)", “Magnetic Field-Strength Diagram (B)”, “Time-Integral Diagram (T)” and “Display the Summary (S)” in the menu "Analysis of Data (A)”.
- step S-6, S-7 and S-71 the routine returns back to step S-3 to display the screen for selecting the list of the to-be-tested persons.
- step S-4, measurement of data of step S-6 and analysis of data of step S-7 will be described below in further detail in connection with Figs. 16 and 17.
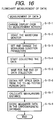
- Fig. 16 is a flowchart illustrating, in detail, the measurement of data at step S-6 in Fig. 15.
- the waveform monitor receives and displays the data in a periodic time (e.g., 1 second) that has been set in advance, and repeats it until the measurement button is depressed.
- the measurement condition parameters such as sampling time and sampling interval are set or changed, and the "Measurement" button in the operation region is depressed to start the measurement (S-15-4).
- sampling time measuring time
- the interval a pull-down menu of numerals that can be selected is opened by clicking a corresponding text box marked with an inverse triangular mark, and a desired numeral can be selected out of it.
- the numerals that can be selected are, for example, 1 sec, 5 sec, 10 sec, 30 sec, 1 min and 2 min in the case of the time, and are, for example, 0.1 msec, 0.5 msec, 1.0 msec, 2.0 msec, 4.0 msec, 5.0 msec and 10.0 msec in the case of the interval.
- the time may be selected from about 1 sec to about 24 hours, as required.
- the "time" in the "scale” box is a time scale in a unit of milliseconds, i.e., a scale in the horizontal direction. Like selecting the sampling time and interval, any desired numeral can be selected out of the pull-down menu that is opened upon clicking the corresponding text box.
- the FLL control circuit 6 and for the amplifier/filter 7 collect the data until the specified measurement ends.
- the computer 8-1 is interrupted and is informed of the collection of data.
- the control of data measurement waits for the end of collection of data (S-15-5).
- the measured data reads the reference space data (S-15-6), and the feature parameters defined by the reference space data are automatically taken out from the measured data (S-15-7) to calculate the Mahalanobis distance (S-15-8).
- the to-be-tested person data, measuring conditions, measured data and Mahalanobis distance are related to one another and are stored in the cardiomagnetic data base.
- Fig. 17 is a flowchart of data analysis at step S-14 of Fig. 15.
- the data analysis is to display waveforms and diagrams of various kinds to obtain data necessary for the diagnosis, and is capable of selectively displaying the screens of various kinds of waveforms and diagrams upon selecting the menu of Fig. 13. That is, upon selecting the "Display the Time-Waveform (W)" of "Data Analysis (A)", the screen of time-waveform is displayed at step S-14-4. Its layout is the same as that of the time-waveform monitor shown in Fig. 21 except the operation region, and is not diagramed here. Upon selecting the "Magnetic Field-Strength diagram (B)" of "Data Analysis (A)", the magnetic field-strength diagram shown in Fig.
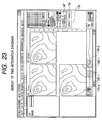
- step S-14-5 Upon selecting the "Time-Integration Diagram (T)" of "Data Analysis (A)", the screens of time-integration diagrams shown in Fig. 23 are displayed at step S-14-6. Upon selecting the “Display of Summary (S)” of “Data Analysis (A)”, the screens of display the summary shown in Fig. 24 are displayed at step S-14-7.
- T Time-Integration Diagram
- S Display of Summary
- the icon button (808-1 to 808-15) in the tool bar is clicked, the screen of the waveform or diagram specified by the click is displayed in its place.
- the branching portion is "branched by using a menu or an icon button" (S-14-1) instead of "branched by using the menu”. According to this embodiment, therefore, a variety of analytical data are obtained by simply clicking the radio button in the operation region without selecting the menu of Fig. 13. Therefore, the operation time can be shortened, erroneous operation can be decreased, and operability is improved.
- the updating button 135 and the cancel button 134 are activated when the data-analyzing parameter is changed and when there is no correspondence between the content represented by the data-analyzing parameter and the content displayed on the analytical data portion 805-1.
- the updating button 135 is depressed by the operator, the calculation is conducted again according to the updated data-analyzing parameter to update the display of the analytical data portion 805-1.
- the cancel button 134 is depressed, further, the data-analyzing parameter is returned back to before being changed, so that the content of the data-analyzing parameter comes into agreement with the content of the analytical data portion 805-1.
- the updating button 135 and the cancel button 134 are in an inactivated state while the content of the data-analyzing parameter is corresponded to the content displayed on the analytical data portion, and are activated when there is no correspondence between them. Therefore, when there is no correspondence between the data-analyzing parameter and the content displayed on the analytical data portion 805-1, explicit distinction is obtained depending upon the state of the updating button and the cancel button, and the analytical data are little likely to be incorrectly interpreted.
- a vertically extending narrow magnetic field strength index box 310 is arranged at the right end of the analytical data portion.
- the magnetic field strength index box is divided into sections of different colors. This is to distinguish the strength ranges of magnetic field represented by fringe patterns on the magnetic field-strength diagram relying upon the kinds of colors to improve visible (chromatic) recognition. That is, the central position 311 of the magnetic field strength index box 310 in the lengthwise direction is the one where the magnetic field strength is zero, and the sections over the central position are called first to sixth segments in order from the central position.
- the first section corresponds to a magnetic field strength range of 0 to 2 pT
- the second section corresponds to a magnetic field strength range of 2 to 4 pT
- the third section corresponds to a magnetic field strength range of 4 to 6 pT
- the fourth section corresponds to a magnetic field strength range of 6 to 8 pT
- the fifth section corresponds to a magnetic field strength range of 8 to 10 pT
- the sixth section corresponds to a magnetic field strength range of 10 to 12 pT, respectively.
- the sections under the central position represent the magnetic field strengths in the plus direction and the sections under the central position represent the magnetic field strengths in the minus direction.
- the magnetic field-strength diagrams shown in Fig. 22 are displayed by different colors depending upon the magnetic field strengths in compliance with a predetermined corresponding relationship between the magnetic field strength ranges in the magnetic field strength index boxes 310 and the colors.
- the plus side of the magnetic field strengths may be represented by hot colors
- the minus side may be represented by cold colors
- the central portion may be represented by yellow. This makes it possible to chromatically recognize the strengths of the magnetic field and, hence, to improve the visibility.
- the magnetic field strength index box 310 is provided near the analytical data portion, making it possible to confirm the color of the object to be compared, i.e., to confirm the color imparted to the map in comparison with a predetermined color of the magnetic field strength index box 310 without greatly moving the eyes and, hence, to clearly judge the relationship between the levels of strength of the magnetic field and the colors.
- “Number of Maps” in the box of "Re-constituted Parameter” represents the number of the magnetic field-strength diagrams that are displayed
- “Maximum Value” represents the magnetic field strength corresponding to both ends of the magnetic field strength index box 310
- “Interval” represents the range of magnetic field corresponding to the length of the sections in the magnetic field strength index box 310. The values thereof can be selected by clicking a triangular button or an inversely triangular button of the corresponding text box.
- cursor lines 140 set as the waveform of the reference channel and as the number of maps, and are corresponding to 16 sheets of magnetic field-strength diagrams.
- the cursors are arranged maintaining an equal interval at a predetermined time. Means for setting the interval may be provided on the screen, or there may be provided means for setting the cursor lines corresponding to the plurality of magnetic field-strength diagrams one by one at irregular intervals. The positions of the cursor lines are dragged by a mouse so as to be moved toward the right and left.
- a time for forming a first sheet of magnetic field-strength diagram may be specified by using the text box.
- Fig. 22 there are displayed the magnetic field-strength diagrams of a number of 16 which are those at a moment when the cursor line is positioned on the waveform. There are further displayed the times for indicating at which moment the map is formed.
- the operator is allowed to know which range of the analytical time (width of reference waveform) is occupied by the map now displayed on the analytical data portion and to grasp at a glance which range in the analytical time is represented by the map. Therefore, the visibility is improved. Further, the range represented by the map can be easily set by simply moving the two cursors by using the mouse. If the gap among the dividing lines can be freely set, then, a dubious portion is densely indicated and other portions are coarsely indicated, making it possible to offer a variety of analytical environments to the operator.
- a contour diagram by the time-integrated values in 100 to 140 milliseconds a contour diagram by the time-integrated values in 180 to 240 milliseconds
- a contour diagram due to a difference in the two time-integrated values The time zone of 100 to 140 milliseconds is the one in which the P-wave is generating, and the time zone of 180 to 240 milliseconds is the one in which the QRS wave is generating.
- the time zones are shown by the belt-like cursor in the waveform of the reference channel. In many cases, it is a practice to find the time-integration diagrams and the difference in the time-integration values in the QRS-wave and in the T-wave.
- the diagram of displaying the summary of Fig. 24 is the one displaying magnetic field-strength diagrams near the peak of P-wave, near QRS-wave and near the peak of T-wave, which are considered to be important particularly for the diagnosis of cardiac disease. Displayed here are the magnetic field-strength diagrams of the peaks of P-wave, R-wave and T-wave as well as those thereof preceding and succeeding the peaks. They contain much data among the feature parameters shown in Fig. 7.
- Fig. 26 shows effective parameters for each of the patients.
- the patients diagnosed as suffering from cardiac disease through other tests are classified for each of the names of the patients, and the diagrams of factors and effects are formed for each of the patients to clarify the feature parameters that have peculiar values. Though the number of the cases is very small, the effective parameters are remarkable for each of the patients. If relations between the diseases and the effective feature parameters are stored as data, the name of disease can be estimated from the feature parameters having peculiar values in case a large Mahalanobis distance is obtained from the data measured from the to-be-tested person.
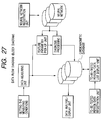
- Fig. 27 is a block diagram of when a neutral network is used. As compared to the block diagram (Fig. 11) of the case of the Mahalanobis distance, the Mahalanobis distance calculation unit is replaced by a diagnosis processing unit, the reference space data is replaced by a neural network, and the reference space registration unit is replaced by a neural network registration unit.
- the neural network is a simulation of the data processing system of brain by using a computer.
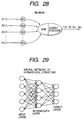
- Fig. 27 illustrates a model of neurons (nerve cells) which are the data processing units
- Fig. 28 illustrates a hierarchical neural network as an example of the neural network which is a set of neurons.
- the inputs X j assume values of from 0 to 1.
- the weighed inputs fed to the neuron are, first, added up, and are converted into a single scalar quantity (X 1 *W 1 + X 2 *W 2 + X 3 *W 3 + --- + X n *W n ). This sum is input, and the output of the neuron is determined depending upon the output function f thereof.
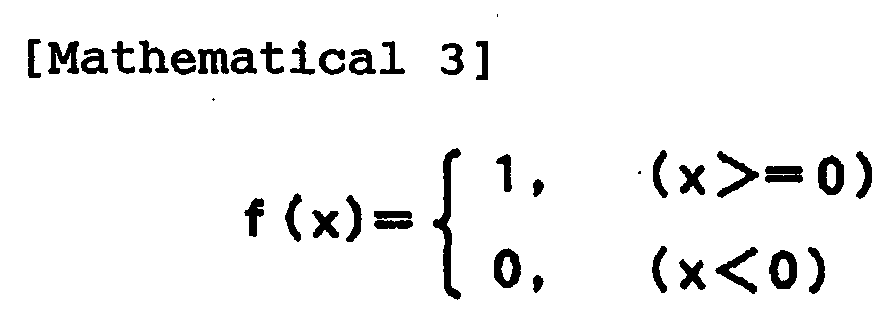
- the output function there are widely used the following threshold value function, Sigmoid function or linear function, all of which are monotonously increasing functions. A value of a range of 0 to 1 is returned back to the region of the weighed sums. By taking noise into consideration, further, the input values are often varied for the functions.
- the cardiac disease can be diagnosed by the neural network shown in Fig. 29, which is a combination of the neurons.
- the feature parameters e.g., the ones shown in Fig. 9 picked from the signal data measured by using the cardiomagnetism measuring apparatus may be assigned to the neurons of the input layer.
- the feature parameters have been normalized between 0 and 1. It is further presumed that probable results of diagnosis are assigned to the output layer. For example, if a healthy person and a patient suffering from cardiac disease are to be distinguished from one another, there simply exist two neurons, i.e., the neuron of the healthy person and the neuron of the patient suffering from cardiac disease. As a result of processing the diagnosis, either one of the two neurons is fired (i.e., assumes 1).
- the neuron in the output layer includes those neurons that represent the healthy person, and the names of diseases such as myocardial infarction, stricture of the heart, WPW syndrome and the like.
- the intermediate layer consists of neurons for holding the interim results of the process of diagnosis. There may be provided a suitable number of intermediate layers as required.
- a method of measuring biomagnetic field which can be easily operated to favorably measure the magnetic field strengths at a plurality of measuring positions.
Landscapes
- Health & Medical Sciences (AREA)
- Life Sciences & Earth Sciences (AREA)
- Heart & Thoracic Surgery (AREA)
- Surgery (AREA)
- Biophysics (AREA)
- Pathology (AREA)
- Engineering & Computer Science (AREA)
- Biomedical Technology (AREA)
- Cardiology (AREA)
- Medical Informatics (AREA)
- Molecular Biology (AREA)
- Physics & Mathematics (AREA)
- Animal Behavior & Ethology (AREA)
- General Health & Medical Sciences (AREA)
- Public Health (AREA)
- Veterinary Medicine (AREA)
- Measurement And Recording Of Electrical Phenomena And Electrical Characteristics Of The Living Body (AREA)
- Measuring Magnetic Variables (AREA)
- Medical Treatment And Welfare Office Work (AREA)
Abstract
Description
Claims (18)
- A biomagnetic field measuring apparatus for measuring a magnetic field generated from the living body of a to-be-tested person at a plurality of positions, comprising:reference database storage means storing a reference database involving measured signal data obtained from a group of healthy persons;measured signal data storage means for storing signal data that are newly measured;feature parameter operation means for operating a plurality of feature parameters from the signal data stored in said measured signal data storage means;comparator means for comparing feature parameter operated by said operation means with feature parameters of the group of healthy persons based upon the reference database stored in said reference database storage means; anddiscrimination data calculation means for calculating discrimination data in order to discriminate whether the to-be-tested person is healthy relying upon the result of comparison by said comparator means.
- A biomagnetic field measuring apparatus for measuring a magnetic field generated from the living body of a to-be-tested person at a plurality of positions, comprising:storage means for storing the measured signal data;feature parameter operation means for operating a plurality of feature parameters from the signal data stored in said storage means;comparison/collation means for comparing and collating feature parameters operated by said operation means with a predetermined rule; anddiscrimination data calculation means for calculating discrimination data in order to discriminate whether the to-be-tested person is healthy relying upon the result of comparison and collation by said comparison/collation means.
- A biomagnetic field measuring apparatus according to claim 1 or 2, wherein the magnetic field generated from the living body of a to-be-tested person is the one generated chiefly from the heart, and feature parameters calculated by said feature parameter operation means from the signal data include a current direction near an R-wave peak at regular intervals.
- A biomagnetic field measuring apparatus according to claim 1 or 2, wherein the magnetic field generated from the living body of a to-be-tested person is the one generated chiefly from the heart, and feature parameters calculated by said feature parameter operation means from the signal data include a parameter picked up from a magnetic field-strength diagram at a representative moment which is the one at which the amplitude becomes the greatest in the magnetic field intensity that is measured.
- A biomagnetic field measuring apparatus for measuring a magnetic field generated from the living body of a to-be-tested person at a plurality of positions, comprising:storage means for storing the measured signal data;feature parameter operation means for calculating a plurality of feature parameters from the signal data stored in said storage means;Mahalanobis space-building means for building Mahalanobis space based upon the feature parameters calculated by said operation means;Mahalanobis distance calculation means for calculating, relying upon a plurality of feature parameters, the Mahalanobis distance of the to-be-tested person in the Mahalanobis space built up by said Mahalanobis space building means; anddiscrimination data calculation means for calculating discrimination data in order to discriminate whether the to-be-tested person is healthy relying upon the data of Mahalonobis distance obtained by said Mahalanobis distance calculation means.
- A biomagnetic field measuring apparatus according to any one of claims 1, 2 or 5, further comprising discrimination means which compares the discrimination data calculated by said discrimination data calculation means with the reference discrimination data that have been stored in advance for discriminating weather the to-be-tested person is healthy, and discriminates whether the to-be-tested person is healthy.
- A biomagnetic field measuring apparatus according to claim 6, wherein said reference discrimination data are arbitrarily set by the operator.
- A biomagnetic field measuring apparatus according to claim 6, further comprising a disease estimation function for selecting a candidate of disease based upon said plurality of feature parameters when it is discriminated by said discrimination means that the to-be-tested person is not healthy.
- A biomagnetic field measuring apparatus according to any one of claims 5 to 8, further comprising:storage means for storing said feature parameters and Mahalanobis distances for each of the plurality of to-be-tested persons; anda function for displaying at least one feature parameter and Mahalanobis distance of a to-be-tested person who is selected.
- A biomagnetic field measuring apparatus according to any one of claims 5 to 8, further comprising:storage means for storing said feature parameters and Mahalanobis distances for each of the plurality of to-be-tested persons; anda function for simultaneously displaying at least one feature parameter and Mahalanobis distance of a to-be-tested person who is selected, and Mahalanobis distances and feature parameters in said Mahalanobis space that is built up.
- A biomagnetic field measuring apparatus according to claim 9 or 10, further comprising a function for displaying feature parameters of the to-be-tested person who is selected, an average value in a group of healthy persons defining the Mahalanobis space of the parameters, and a standard deviation thereof.
- A biomagnetic field measuring apparatus according to claim 9 or 10, further comprising a function for describing feature parameters of the to-be-tested person who is selected and the standardized feature parameter.
- A biomagnetic field measuring apparatus according to claim 9 or 10, further comprising a function for displaying, in an emphasized manner, the data of the to-be-tested person who has data of which the Mahalanobis distance is greater than that of the reference discrimination data that have been stored in advance in order to discriminate whether the to-be-tested person is healthy.
- A biomagnetic field measuring apparatus according to claim 9 or 10, further comprising a function for displaying, in an emphasized manner, the feature parameter of which the standardized feature parameter is greater than a predetermined value when the Mahalanobis distance is greater than that of the reference discrimination data that have been stored in advance for discriminating whether the to-be-tested person is healthy.
- A biomagnetic field measuring apparatus according to claim 9 or 10, further comprising a function for rearranging the data of the plurality of to-be-tested persons that are stored in order of increasing Mahalanobis distances or decreasing Mahalanobis distances.
- A biomagnetic field measuring apparatus according to claim 5, further comprising:storage means for storing a plurality of Mahalanobis space data; anda function for selecting the space data that is used depending upon the data of the to-be-tested person.
- A biomagnetic field measuring apparatus according to claim 16, further comprising a function for defining feature parameters for each of said space data.
- A biomagnetic field measuring apparatus according to any one of claims 1 to 5, wherein the magnetic field generated from the living body of the to-be-tested person is a cardiomagnetic field generated chiefly from the heart, and wherein there is further provided a function for displaying, on a screen, magnetic field-strength diagrams near P-waves, QRS-waves and T-waves among the cardiomagnetic field signal data.
Applications Claiming Priority (2)
| Application Number | Priority Date | Filing Date | Title |
|---|---|---|---|
| JP2001350920 | 2001-11-16 | ||
| JP2001350920A JP3944383B2 (en) | 2001-11-16 | 2001-11-16 | Cardiac magnetic field measuring device |
Publications (3)
| Publication Number | Publication Date |
|---|---|
| EP1312304A2 true EP1312304A2 (en) | 2003-05-21 |
| EP1312304A3 EP1312304A3 (en) | 2004-01-14 |
| EP1312304B1 EP1312304B1 (en) | 2008-09-03 |
Family
ID=19163316
Family Applications (1)
| Application Number | Title | Priority Date | Filing Date |
|---|---|---|---|
| EP02022202A Expired - Lifetime EP1312304B1 (en) | 2001-11-16 | 2002-10-01 | Biomagnetic field measuring apparatus |
Country Status (4)
| Country | Link |
|---|---|
| US (1) | US20030097056A1 (en) |
| EP (1) | EP1312304B1 (en) |
| JP (1) | JP3944383B2 (en) |
| DE (1) | DE60228670D1 (en) |
Cited By (2)
| Publication number | Priority date | Publication date | Assignee | Title |
|---|---|---|---|---|
| CN111149143A (en) * | 2017-09-28 | 2020-05-12 | 株式会社耐奥飞特 | Nail plate training method and program thereof |
| US10772520B2 (en) | 2015-06-25 | 2020-09-15 | DePuy Synthes Products, Inc. | Intraoperative magnetometry monitoring system |
Families Citing this family (36)
| Publication number | Priority date | Publication date | Assignee | Title |
|---|---|---|---|---|
| US6473518B1 (en) * | 1997-10-02 | 2002-10-29 | Hitachi, Ltd. | Method of measuring a biomagnetic field, method of analyzing a measured biomagnetic field, method of displaying biomagnetic field data, and apparatus therefor |
| JP3518502B2 (en) * | 2000-10-19 | 2004-04-12 | 株式会社日立製作所 | Biomagnetic field measurement device |
| AU2003211517A1 (en) * | 2002-03-05 | 2003-09-16 | Dainippon Pharmaceutical Co., Ltd. | Electrocardiography chart apparatus and method thereof |
| JP3736640B2 (en) * | 2004-01-19 | 2006-01-18 | 株式会社エイティング | Personal monitoring system |
| JP2005285001A (en) | 2004-03-30 | 2005-10-13 | Sunstar Inc | Health support method and its system |
| JP4922564B2 (en) * | 2005-03-16 | 2012-04-25 | 株式会社リコー | Abnormality determination apparatus and image forming apparatus |
| JP4641492B2 (en) * | 2005-11-16 | 2011-03-02 | 日本電信電話株式会社 | Singular image detection device, singular image detection method and program |
| EP1818651A1 (en) * | 2006-02-10 | 2007-08-15 | Rijksuniversiteit Groningen | System and a method for determining one or more parameters of a source of a potential-energy field |
| JP4972443B2 (en) * | 2007-03-30 | 2012-07-11 | 株式会社日立ハイテクノロジーズ | Biomagnetic field measurement device |
| CN100594839C (en) * | 2007-05-17 | 2010-03-24 | 大连现代高技术发展有限公司 | Real-time tracking and positioning device |
| US20090118632A1 (en) * | 2007-11-05 | 2009-05-07 | Goepp Julius G | Effort-Independent, Portable, User-Operated Capnograph Devices And Related Methods |
| KR100980331B1 (en) * | 2008-05-28 | 2010-09-06 | 한국표준과학연구원 | Myocardial Infarction Diagnosis Using Combination of Cardiac Parameters |
| JP5611546B2 (en) * | 2009-06-30 | 2014-10-22 | 株式会社東芝 | Automatic diagnosis support apparatus, ultrasonic diagnosis apparatus, and automatic diagnosis support program |
| JP5746480B2 (en) * | 2010-05-13 | 2015-07-08 | 横河電機株式会社 | Analysis result display device and analysis result display method |
| US9015093B1 (en) | 2010-10-26 | 2015-04-21 | Michael Lamport Commons | Intelligent control with hierarchical stacked neural networks |
| US8775341B1 (en) | 2010-10-26 | 2014-07-08 | Michael Lamport Commons | Intelligent control with hierarchical stacked neural networks |
| UA104073C2 (en) * | 2012-07-13 | 2013-12-25 | Илья Анатольевич Чайковский | Method for diagnosing degree of ischemic lesions of myocardium based on analysis of temporal changes in current density |
| US9500464B2 (en) * | 2013-03-12 | 2016-11-22 | Adidas Ag | Methods of determining performance information for individuals and sports objects |
| US9684069B2 (en) * | 2014-01-10 | 2017-06-20 | Raytheon Company | High angular resolution low frequency radar with small antenna and high resolution low frequency ground penetrating radar |
| US11191506B2 (en) * | 2016-07-08 | 2021-12-07 | Ricoh Company, Ltd. | Diagnosis support system, diagnosis support apparatus, and recording medium |
| JP6890448B2 (en) * | 2017-03-30 | 2021-06-18 | 株式会社日立ハイテク | Magnetic field data processing system |
| JP7393947B2 (en) | 2017-05-22 | 2023-12-07 | ジェネテシス エルエルシー | Mechanical identification of anomalies in bioelectromagnetic fields |
| US12642469B2 (en) | 2017-08-09 | 2026-06-02 | SB Technology, Inc. | Biomagnetic detection |
| US11134877B2 (en) | 2017-08-09 | 2021-10-05 | Genetesis, Inc. | Biomagnetic detection |
| US12262997B2 (en) | 2017-08-09 | 2025-04-01 | Genetesis, Inc. | Biomagnetic detection |
| WO2020138170A1 (en) | 2018-12-26 | 2020-07-02 | 旭化成エレクトロニクス株式会社 | Magnetic field measuring device |
| US11585869B2 (en) | 2019-02-08 | 2023-02-21 | Genetesis, Inc. | Biomagnetic field sensor systems and methods for diagnostic evaluation of cardiac conditions |
| JP2021060378A (en) * | 2019-10-02 | 2021-04-15 | 株式会社リコー | Magnetic field measuring device |
| WO2021106948A1 (en) * | 2019-11-26 | 2021-06-03 | Ricoh Company, Ltd. | Biometric information display apparatus, method, and program |
| JP7525297B2 (en) | 2020-05-08 | 2024-07-30 | 旭化成エレクトロニクス株式会社 | Magnetic field measurement device, magnetic field measurement method, and magnetic field measurement program |
| CN122537018A (en) | 2020-05-27 | 2026-08-11 | Sb科技公司 | Systems and devices for detecting coronary artery disease using magnetography. |
| CA3209292A1 (en) * | 2021-02-22 | 2022-08-25 | Genetesis, Inc. | Biomagnetic field sensor systems and methods for diagnostic evaluation of cardiac conditions |
| JP7717485B2 (en) | 2021-04-26 | 2025-08-04 | Tdk株式会社 | Biosignal processing system and biosignal measurement system |
| US12682520B2 (en) * | 2021-10-11 | 2026-07-14 | GE Precision Healthcare LLC | Medical devices and methods for presenting cardiac information for a patient |
| CN114690084B (en) * | 2022-02-21 | 2025-06-27 | 中国科学院地质与地球物理研究所 | A fluxgate anti-interference method and device based on waveform feature classification |
| EP4622549A1 (en) * | 2022-11-23 | 2025-10-01 | Charité - Universitätsmedizin Berlin | Method, computer program and system for characterizing a heartbeat cycle using magnetocardiography as well as method for treatment of inflammatory cardiomyopathy |
Family Cites Families (13)
| Publication number | Priority date | Publication date | Assignee | Title |
|---|---|---|---|---|
| US4974598A (en) * | 1988-04-22 | 1990-12-04 | Heart Map, Inc. | EKG system and method using statistical analysis of heartbeats and topographic mapping of body surface potentials |
| US4951674A (en) * | 1989-03-20 | 1990-08-28 | Zanakis Michael F | Biomagnetic analytical system using fiber-optic magnetic sensors |
| US4977896A (en) * | 1989-05-26 | 1990-12-18 | Biomagnetic Technologies, Inc. | Analysis of biological signals using data from arrays of sensors |
| JPH0767440B2 (en) * | 1990-09-30 | 1995-07-26 | 工業技術院長 | Reference part detection method for magnetocardiogram synchronization detection, magnetocardiogram synchronization addition method, magnetocardiogram synchronization detection device and magnetocardiogram synchronization addition device |
| JPH0542119A (en) * | 1991-08-12 | 1993-02-23 | Fujitsu Ltd | Biomagnetism measuring instrument |
| JPH063427A (en) * | 1992-06-23 | 1994-01-11 | Fujitsu Ltd | Magnetic detector |
| JP4208275B2 (en) * | 1997-10-30 | 2009-01-14 | 株式会社東芝 | Diagnostic device for intracardiac electrical phenomenon and method for displaying the phenomenon |
| US6195576B1 (en) * | 1998-03-09 | 2001-02-27 | New York University | Quantitative magnetoencephalogram system and method |
| US6217525B1 (en) * | 1998-04-30 | 2001-04-17 | Medtronic Physio-Control Manufacturing Corp. | Reduced lead set device and method for detecting acute cardiac ischemic conditions |
| US6275719B1 (en) * | 1998-09-09 | 2001-08-14 | Hitachi, Ltd. | Biomagnetic field measurement apparatus |
| WO2000037917A2 (en) * | 1998-12-23 | 2000-06-29 | Medispectra, Inc. | Systems and methods for optical examination of samples |
| JP3712348B2 (en) * | 2000-07-18 | 2005-11-02 | 独立行政法人科学技術振興機構 | Cardiac magnetic field diagnostic apparatus for atrial flutter and atrial fibrillation and method for operating the same |
| US7106057B2 (en) * | 2004-03-17 | 2006-09-12 | University Of Maryland | High frequency scanning SQUID microscope and method of measuring high frequency magnetic fields |
-
2001
- 2001-11-16 JP JP2001350920A patent/JP3944383B2/en not_active Expired - Lifetime
-
2002
- 2002-09-26 US US10/255,037 patent/US20030097056A1/en not_active Abandoned
- 2002-10-01 DE DE60228670T patent/DE60228670D1/en not_active Expired - Lifetime
- 2002-10-01 EP EP02022202A patent/EP1312304B1/en not_active Expired - Lifetime
Cited By (3)
| Publication number | Priority date | Publication date | Assignee | Title |
|---|---|---|---|---|
| US10772520B2 (en) | 2015-06-25 | 2020-09-15 | DePuy Synthes Products, Inc. | Intraoperative magnetometry monitoring system |
| US12011270B2 (en) | 2015-06-25 | 2024-06-18 | DePuy Synthes Products, Inc. | Intraoperative magnetometry monitoring system |
| CN111149143A (en) * | 2017-09-28 | 2020-05-12 | 株式会社耐奥飞特 | Nail plate training method and program thereof |
Also Published As
| Publication number | Publication date |
|---|---|
| US20030097056A1 (en) | 2003-05-22 |
| JP3944383B2 (en) | 2007-07-11 |
| EP1312304A3 (en) | 2004-01-14 |
| JP2003144406A (en) | 2003-05-20 |
| EP1312304B1 (en) | 2008-09-03 |
| DE60228670D1 (en) | 2008-10-16 |
Similar Documents
| Publication | Publication Date | Title |
|---|---|---|
| EP1312304B1 (en) | Biomagnetic field measuring apparatus | |
| US7194121B2 (en) | Method of measuring a biomagnetic field, method of analyzing a measured biomagnetic field, method of displaying biomagnetic field data, and an apparatus therefor | |
| US6961605B2 (en) | Method for processing biomagnetic field data, magnetic field contour mapping, forming their waveforms and a biomagnetic instrument using the same | |
| WO2006025504A1 (en) | Sensitive state judging method | |
| JP3595660B2 (en) | Measuring device for biological magnetic field | |
| JP2008200331A (en) | Biomagnetic field measurement device | |
| JP3228702B2 (en) | Measurement method of magnetic field of living body and magnetic field map display | |
| JP2004249124A (en) | Biomagnetic field measurement device | |
| JP3228703B2 (en) | Method and apparatus for processing measurement data of magnetic field generated by living body | |
| JP2004358278A (en) | Display method of magnetic field measurement device | |
| JP3720960B2 (en) | Processing method of measurement data of magnetic field generated by living body | |
| JP2004216184A (en) | Biomagnetic field measurement device | |
| JP3140733B2 (en) | Biological magnetic field map display | |
| JP3058619B2 (en) | Biological magnetic field map generator | |
| JP3140734B2 (en) | Biological magnetic field map display | |
| JP3140731B2 (en) | Biological magnetic field map display | |
| JP3768178B2 (en) | Magnetic field diagram display method | |
| JP3140732B2 (en) | Biological magnetic field map display | |
| JP2004089724A (en) | Biomagnetic field measurement device | |
| JP3140735B2 (en) | How to display the magnetic field map of a living body | |
| JP3714346B2 (en) | Biomagnetic field measurement device | |
| JP2004041789A (en) | Biomagnetic field measurement device | |
| JP2004041788A (en) | Biomagnetic field measurement device | |
| JP2004358279A (en) | Display method of magnetic field measurement device | |
| JP2004154601A (en) | Measurement method of magnetic field of living body |
Legal Events
| Date | Code | Title | Description |
|---|---|---|---|
| PUAI | Public reference made under article 153(3) epc to a published international application that has entered the european phase |
Free format text: ORIGINAL CODE: 0009012 |
|
| AK | Designated contracting states |
Designated state(s): AT BE BG CH CY CZ DE DK EE ES FI FR GB GR IE IT LI LU MC NL PT SE SK TR |
|
| AX | Request for extension of the european patent |
Extension state: AL LT LV MK RO SI |
|
| PUAL | Search report despatched |
Free format text: ORIGINAL CODE: 0009013 |
|
| AK | Designated contracting states |
Kind code of ref document: A3 Designated state(s): AT BE BG CH CY CZ DE DK EE ES FI FR GB GR IE IT LI LU MC NL PT SE SK TR |
|
| AX | Request for extension of the european patent |
Extension state: AL LT LV MK RO SI |
|
| 17P | Request for examination filed |
Effective date: 20040709 |
|
| AKX | Designation fees paid |
Designated state(s): DE FR GB |
|
| 17Q | First examination report despatched |
Effective date: 20050517 |
|
| GRAP | Despatch of communication of intention to grant a patent |
Free format text: ORIGINAL CODE: EPIDOSNIGR1 |
|
| GRAS | Grant fee paid |
Free format text: ORIGINAL CODE: EPIDOSNIGR3 |
|
| GRAA | (expected) grant |
Free format text: ORIGINAL CODE: 0009210 |
|
| AK | Designated contracting states |
Kind code of ref document: B1 Designated state(s): DE FR GB |
|
| REG | Reference to a national code |
Ref country code: GB Ref legal event code: FG4D |
|
| REF | Corresponds to: |
Ref document number: 60228670 Country of ref document: DE Date of ref document: 20081016 Kind code of ref document: P |
|
| PLBE | No opposition filed within time limit |
Free format text: ORIGINAL CODE: 0009261 |
|
| STAA | Information on the status of an ep patent application or granted ep patent |
Free format text: STATUS: NO OPPOSITION FILED WITHIN TIME LIMIT |
|
| 26N | No opposition filed |
Effective date: 20090604 |
|
| GBPC | Gb: european patent ceased through non-payment of renewal fee |
Effective date: 20081203 |
|
| PG25 | Lapsed in a contracting state [announced via postgrant information from national office to epo] |
Ref country code: GB Free format text: LAPSE BECAUSE OF NON-PAYMENT OF DUE FEES Effective date: 20081203 |
|
| REG | Reference to a national code |
Ref country code: FR Ref legal event code: PLFP Year of fee payment: 15 |
|
| PGFP | Annual fee paid to national office [announced via postgrant information from national office to epo] |
Ref country code: FR Payment date: 20160919 Year of fee payment: 15 |
|
| REG | Reference to a national code |
Ref country code: FR Ref legal event code: ST Effective date: 20180629 |
|
| PG25 | Lapsed in a contracting state [announced via postgrant information from national office to epo] |
Ref country code: FR Free format text: LAPSE BECAUSE OF NON-PAYMENT OF DUE FEES Effective date: 20171031 |
|
| PGFP | Annual fee paid to national office [announced via postgrant information from national office to epo] |
Ref country code: DE Payment date: 20180918 Year of fee payment: 17 |
|
| REG | Reference to a national code |
Ref country code: DE Ref legal event code: R119 Ref document number: 60228670 Country of ref document: DE |
|
| PG25 | Lapsed in a contracting state [announced via postgrant information from national office to epo] |
Ref country code: DE Free format text: LAPSE BECAUSE OF NON-PAYMENT OF DUE FEES Effective date: 20200501 |