EP1306998A2 - Verfahren und Gerät zur Augenmustermessung - Google Patents
Verfahren und Gerät zur Augenmustermessung Download PDFInfo
- Publication number
- EP1306998A2 EP1306998A2 EP02256963A EP02256963A EP1306998A2 EP 1306998 A2 EP1306998 A2 EP 1306998A2 EP 02256963 A EP02256963 A EP 02256963A EP 02256963 A EP02256963 A EP 02256963A EP 1306998 A2 EP1306998 A2 EP 1306998A2
- Authority
- EP
- European Patent Office
- Prior art keywords
- data signal
- data
- signal
- clock signal
- eye diagram
- Prior art date
- Legal status (The legal status is an assumption and is not a legal conclusion. Google has not performed a legal analysis and makes no representation as to the accuracy of the status listed.)
- Withdrawn
Links
- 238000010586 diagram Methods 0.000 title claims abstract description 79
- 238000000034 method Methods 0.000 title claims abstract description 20
- 238000005259 measurement Methods 0.000 title abstract description 27
- 230000003111 delayed effect Effects 0.000 claims abstract description 32
- 230000001934 delay Effects 0.000 claims abstract description 8
- 230000007704 transition Effects 0.000 claims description 11
- 230000004044 response Effects 0.000 claims description 3
- 238000001514 detection method Methods 0.000 claims description 2
- 230000008569 process Effects 0.000 abstract description 8
- 230000000694 effects Effects 0.000 description 6
- 238000005070 sampling Methods 0.000 description 6
- 238000009877 rendering Methods 0.000 description 5
- 101000911753 Homo sapiens Protein FAM107B Proteins 0.000 description 4
- 102100026983 Protein FAM107B Human genes 0.000 description 4
- 239000000872 buffer Substances 0.000 description 4
- 230000008859 change Effects 0.000 description 4
- 238000009826 distribution Methods 0.000 description 4
- 230000006870 function Effects 0.000 description 4
- 238000012545 processing Methods 0.000 description 3
- 238000013481 data capture Methods 0.000 description 2
- 238000004519 manufacturing process Methods 0.000 description 2
- 230000003252 repetitive effect Effects 0.000 description 2
- 238000012360 testing method Methods 0.000 description 2
- 238000004458 analytical method Methods 0.000 description 1
- 230000000712 assembly Effects 0.000 description 1
- 238000000429 assembly Methods 0.000 description 1
- 230000008901 benefit Effects 0.000 description 1
- 230000005540 biological transmission Effects 0.000 description 1
- 230000003139 buffering effect Effects 0.000 description 1
- 238000012512 characterization method Methods 0.000 description 1
- 239000002131 composite material Substances 0.000 description 1
- 238000013479 data entry Methods 0.000 description 1
- 238000013500 data storage Methods 0.000 description 1
- 238000005516 engineering process Methods 0.000 description 1
- 238000011835 investigation Methods 0.000 description 1
- 230000000737 periodic effect Effects 0.000 description 1
- 230000002688 persistence Effects 0.000 description 1
- 230000036316 preload Effects 0.000 description 1
- 238000003860 storage Methods 0.000 description 1
- 239000000126 substance Substances 0.000 description 1
- 230000001360 synchronised effect Effects 0.000 description 1
- 230000008719 thickening Effects 0.000 description 1
- 238000011144 upstream manufacturing Methods 0.000 description 1
Images


Classifications
-
- H—ELECTRICITY
- H04—ELECTRIC COMMUNICATION TECHNIQUE
- H04L—TRANSMISSION OF DIGITAL INFORMATION, e.g. TELEGRAPHIC COMMUNICATION
- H04L1/00—Arrangements for detecting or preventing errors in the information received
- H04L1/24—Testing correct operation
Definitions
- the subject matter of the present Application includes a transition detection circuit usable in a logic analyzer adapted to perform eye diagram measurements, or in a stand-alone circuit for that purpose. And although we disclose herein the general nature of such a detector in sufficient detail to allow a complete understanding of the invention, the actual circuit has complexity beyond what is needed here and is capable of performing additional functions. That actual circuit is the subject matter of a US Patent Application entitled System and Method for Adjusting a Sampling Time in a Logic Analyzer, of S/N 09/3 75,307, filed on 16 August 1999 by Richard A. Nygaard et. al and assigned to Agilent Technologies, Inc. Because the subject matter of that Application is of interest to that of the present invention, and for the sake of brevity herein, "System and Method for Adjusting a Sampling Time in a Logic Analyzer" is hereby expressly incorporated herein by reference.
- Eye diagrams are a conventional format for representing parametric information about signals, and especially digital signals.
- 'Scopes and BERTs each have their own types of circuit architecture that they use to measure eye diagrams, and thus belong to the class of Eye Diagram Testers.
- the method and circuit apparatus to be disclosed herein is different than that used in 'scopes and BERTs, and is especially suitable for use within a logic analyzer.
- EDA Eye Diagram Analyzer
- FIG. 1 An example eye diagram for a digital signal and composed of traces 3 and 4 is illustrated as part of Figure 1. It is a composite of many (probably at least thousands, easily millions, and perhaps orders of magnitude more) measurements taken upon separate instances of a signal occurring on a channel of interest. To borrow an idea from the world of oscilloscopes, it is as though an infinite persistence continuous time domain trace were cut apart into lengths corresponding to one, five or ten clock times, and then stacked on top of each other. The vertical axis is voltage, and the horizontal axis represents the difference in time (i.e., an offset) between some reference event 2 and an event of interest.
- the time axis in the example of Figure 1 has enough length to depict one complete eye centered about the reference 2, with perhaps an additional one half an eye before and after. In general, the number of cycles shown depends upon how the measurement is set up, and could be a large number.
- the reference 2 represents the expected point in time when the value of an applied data signal would be captured by some receiving circuit in an SUT (System Under Test), and is derived from an application of the SUT's clock to the Eye Diagram Analyzer.
- the traces 3 and 4 are the substance of the eye diagram, and represent various combinations of circumstances that occurred in the data signal being characterized (which data signal is also applied to the EDA). For example, consider the circular region 5 about trace 4. That region loosely represents the combination of a specified voltage at such and such a time relative to the SUT's clock signal, and which might suggest to us that a signal of interest is achieving a proper voltage at a proper time.
- the trace 4 does indeed transit the circle 5 (note that the circle is merely an annotation or legend within the figure, and not part of any actual eye diagram), which indicates that there actually were times when the data signal had fully (or almost) transitioned at the time indicated relative to when the clock signal finished its transition from one value to the other (which in this case is about a half-cycle ahead of the clock).
- another region, say 8 is not transited by the trace, which if that were indeed to happen, would presumably be an indication of trouble.
- Thickening of the traces 3 and 4 are indicative of jitter, and illuminated pixels detached from the trace, or, line segments that go through the otherwise empty middle of the eye, are generally indications of unfavorable conditions.
- An eye diagram cannot reveal which isolated instance of the signal caused an exception, as other types of measurements might, but it does provide timely valid information about how a system is operating.
- Digital oscilloscopes are presently often used to generate eye diagrams.
- Digital oscilloscopes operate in various ways with regard to when they decide to sample an input voltage and then measure the voltage at the time of the sample (high speed sequential sampling of solitary events, regular repetitive sampling of periodic signals, random repetitive sampling, etc.) In whatever way it is done, the result is many individual points expressed as pairs of numbers (time, voltage) that must be stored in some sort of acquisition memory and then later interpreted to produce an eye diagram.
- BERTs have also been used to generate eye diagrams.
- a BERT does not have the digitizing ability of the digital oscilloscope. It can determine whether an input signal and a known good reference signal have each crossed a threshold V T at various times along a sweep for a delayed clock, and if the resulting logical values are in agreement or not. The value for V T is also swept. They thus accumulate numbers of data errors on single points that are transitions of V T at swept points in time, which can then be interpreted to create an eye diagram.
- Logic Analyzers have heretofore not been capable of generating eye diagrams, as the internal architecture of a conventional logic analyzer does not immediately lend itself to that task. As the popularity of eye diagrams increases, however, it has become increasingly desirable that logic analyzers be equipped to perform this task. The question becomes how to do so economically and take maximum advantage of the resources already present for logic analysis purposes. It would also be desirable if there were a low cost technique for implementing a stand-alone eye diagram analyzer. What to do?
- a logic analyzer can be equipped to perform eye diagram measurements by equipping each SUT clock signal input and each SUT data signal input channel with individually variable delays in their respective signal paths. If the range of signal delay is, say, n-many SUT clock cycles, then the SUT clock signal delay might be set at about n/2.
- the SUT clock signal delay might be set at about n/2.
- For each data channel that is to undergo eye diagram measurement there is specified some combination of a point in time relative to an instance of the delayed clock signal (data signal delay) and a voltage threshold.
- the specified combination (data signal delay, threshold) is essentially a location on an eye diagram, although the trace may or may not ever go through that location. There is also specified how many times this specified combination will be watched before another such combination is invoked. As the SUT runs, a particular specified combination will occur always, sometimes or never.
- a counter counts the number of SUT clock cycles used as instances of the reference for the eye diagram, and another counter counts the number of times the specified combination of conditions was met (hereinafter called "hits").
- hits After watching a specified combination for the requisite length of time or number of events, the number of SUT clock cycles involved and the associated number of hits are stored in memory using a data structure indexed by the components of the specified combination (data signal delay, threshold and which channel). Next, a new combination of data signal delay and threshold is specified and a measurement taken and recorded in the data structure. The process is repeated until all possible combinations within a stated range of data signal delay and threshold voltage (using specified resolution/step sizes for delay and voltage) have been investigated.
- the range of data signal delay might be a large as from zero to n-many SUT clock cycles (which would be n/2 before and after the delayed reference), or it could be some lesser amount.
- firmware within the logic analyzer, other firmware can be examining the data structure and generating a partial eye diagram visible on a display, and that will be complete soon after the measurement itself is finished. This technique can also be used to implement a stand alone eye diagram analyzer.
- FIG. 1 wherein is shown, for some SUT data signal (not shown), an eye diagram 1 composed of traces 3 and 4 presented in relation to a reference time 2.
- the reference time indicates when, in relation to an SUT clock signal 6, data is captured.
- the three vertically stacked horizontal lines 7 play an explanatory part in describing how the eye diagram of Figure 1 is measured and produced.
- the vertical distance between the horizontal lines 7 represents a change between successive threshold voltages V T for the comparator to which the input data signal is applied.
- change in threshold voltage ⁇ V T It will be noted that the horizontal line segments 7 have horizontal length. That length represents a time interval, or dt.
- the duration of the time interval dt can be specified, as can when it starts relative to the data capture reference 2.
- a "hit” occurs when it is noticed that, for a particular value of V T in place at the moment, a data signal input voltage comparator has changed its indicated comparison sometime during the time interval dt.
- a hit increments a counter.
- a measurement for an eye diagram is a series of runs.
- V T in use and the offset for dt is varied between runs, until conditions at all possible combinations of V T and offset dt have been examined. For example, one might sweep V T linearly from one extreme to another by ⁇ V T with a given offset for dt. (In terms of the figure, this would mean that there would be many more than just three stacked horizontal lines 7, but an entire column, instead. We didn't draw it that way for simplicity and clarity, but that is how it generally is.) At the conclusion of the column we pick another offset and sweep through another column of V T values. (Again, in terms of the figure, this would be shown as adjacent columns covering the entire horizontal extent of the eye diagram. If we had drawn it that way, the traces 3 and 4 would be effectively obscured, so we didn't.)
- the data structure contains information that can be used to create an eye diagram.
- starting production for the displayed eye diagram need not necessarily wait until the entire data structure is filled, and that as far as the completed data structure is concerned, it really does not matter in what order its elements were filled.
- This last property of the eye diagram analyzer is not trivial. Other techniques can sometimes take a very long time (much more than for a cup of coffee! to produce useful indications in the display.
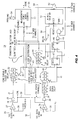
- FIG 2 is a simplified block diagram 9 of an eye diagram analyzer, which may be either a stand-alone unit or incorporated into a logic analyzer (additional details for which are not shown).
- EYE DIAGRAM ACQUISITION HARDWARE 10 At the core of the block diagram 1 is some EYE DIAGRAM ACQUISITION HARDWARE 10, which receives an SUT clock signal 18 and one to n-many SUT data signals (19) for which eye diagram measurements are desired.
- EYE DIAGRAM ACQUISITION HARDWARE 10 receives an SUT clock signal 18 and one to n-many SUT data signals (19) for which eye diagram measurements are desired.
- the EYE DIAGRAM ACQUISITION HARDWARE is configured for each run by H/W DRIVERS 11 that are essentially firmware routines executing on some processor (not shown). This configuration principally involves some calibration or other zero time offset characterization (to combat the effects of temperature induced drift), specifying a dt and its offset (the offset often changes from run to run -- dt usually stays fixed at some selected value), and a value for V T . Additional things to be specified can include a count associated with some condition or activity, such that if the count is reached (or exhausted by counting down) the end of the run is indicated.
- PROCESSING ALGORITHMS 16 Also coupled to the DISPLAY SYSTEM 14 is a collection of PROCESSING ALGORITHMS 16 executing in firmware and that is coupled to receive data from a collection of H/W UNLOAD DRIVERS 17. Their job is to get the values ofthe various counters and the indications of run completion out of the hardware elements (registers, counters, etc.) and into the PROCESSING ALGORITHMS for entry into the data structure, and from whence the results, formatted as an eye diagram, are conveyed to the DISPLAY SYSTEM 14 for presentation on the CRT 15.
- FIG. 3 wherein is depicted a diagram 20 showing various relationships of interest.
- region 21 It is a sample space for an SUT signal of interest. It dimensions are a span of time in the horizontal direction and voltage in the vertical direction.
- the sample space 21 corresponds to the earlier mentioned data structure that is indexed by V T and the time offset.
- the vertical direction corresponds to the various possible values that V T can take, and might have an extent of four volts, or so.
- the horizontal direction might represent five nanoseconds of activity for the highest permitted SUT clock speeds of 1,500 megacycles per second, or eight nanoseconds at 800 mc.
- the sample space has a maximum size, based on the amount of memory available to form the data structure.
- memory available to form the data structure.
- the sample space 21 is populated with values (numbers of hits, number of clock cycles measured) by performing runs. Note the horizontal lines 7. These correspond to those shown as part of Figure 1.
- each line a "measurement region" that represents a value for V T , with adjacent lines being ⁇ V T apart.
- the length of each line (measurement region) represents the duration dt during which a transition of the input signal through V T will be recorded as a hit.
- each such line segment represents a combination of V T and dt at some time offset from a reference.
- the location of one end of the line segment for such a combination is a time offset from the data capture reference 2, which reference 2 we now designate as T 0 .
- the offset itself we designate as T SAMP .
- ⁇ T SAMP is the step size of T SAMP , and that it is not the same as dt.
- the parameter dt is a duration for which we are sensitive to a transition through V T . Where dt is we call T SAMP . Where the next dt starts does not have to be a full dt away from where it used to be, or it might be so exactly, or it might be a lot further away. These changes in position of dt ( ⁇ T SAMP ) are not related to the size of dt. We provide much more flexibility in specifying ⁇ T SAMP than we do dt, the wisdom of which will be appreciated upon reflection.
- the parameters ⁇ V T originate with selections made by the operator, who is presented choices by the USER INTERFACE 12 that are stated in terms of the desired resolution for the eye diagram itself. That is, the operator is asked to specify a "resolution rectangle" 23, that may be thought of as a template to be used in mosaic style to impose a grid onto the sample space, within which events are quantized and regarded as indistinguishable.
- a "resolution rectangle” 23 may be thought of as a template to be used in mosaic style to impose a grid onto the sample space, within which events are quantized and regarded as indistinguishable.
- the range oftimes for the resolution rectangle is 10-100 psec, while the range for voltage is 1-100 mv.
- the USER INTERFACE 12 makes the most rational correspondence between the selections made for the resolution rectangle 23 and values for ⁇ T SAMP and ⁇ V T that are actually supported by the EYE DIAGRAM ACQUISITION HARDWARE 10. Once ⁇ T SAMP , ⁇ V T and the limits for V T and T SAMP are known, the correspondence to the memory of the data structure is thus determined, and the "real" units for the sample space 21 are likewise thus determined. The operator also gets to select one of four values for dt, and the length of the run in terms of a number of SUT clock cycles. At this point the runs to populate the data structure can begin when desired.
- the size and resolution afforded by the sample space and the data structure exceed the information capacity needed to produce a particular eye diagram of interest, but that after a measurement is complete, the location of interest within the sample space may change, or the size of the area of interest may change.
- the operator would like to zoom and pan amongst the acquired data. To accommodate this, the operator is invited to specify a field of view 22 of selectable size.
- the field of view 22 is rather like a clip window in a graphics system for a graphics workstation.
- One of the main tasks of the PROCESSING ALGORITHMS 16 is to render as an eye diagram that portion of the data structure that corresponds to the field of view 22, according to the specified resolution rectangle.
- the rendering process involves the following ideas. Just as the field of view 22 is a window into the sample space/data structure, a certain portion of the displayable collection of pixels (on the CRT screen, page of printer paper, etc..) have been allocated for display of the eye diagram. A supervisory process internal to the EDA, operating in cahoots with the operator, makes this choice. Clearly, if eye diagrams for five channels are to displayed in a given (X, Y) region of the display's raster, less space is available for each eye diagram than if there are only two channels, instead.
- the correspondence can be one-to-one, or many-to-one in either direction. Also, the nature of the correspondence need not be integral.
- the rendering process examines all these correspondences to determine which pixels in the displayed eye diagram are to be illuminated. Places in the eye diagram that have different numbers of hits may be illuminated differently than those that have just a few. It may be the case, for example, that a solitary hit or small number of hits is very important hard-to-find information, and should be prominently displayed.
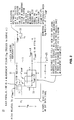
- FIG 4 is a simplified block diagram 24 of the measurement hardware associated with each SUT data signal that can be the subject of an eye diagram measurement. What is shown in the figure is one SUT clock section above dotted line 56 and one SUT data signal section below dotted line 56. This would accommodate a single channel measurement. It will be appreciated that for additional channels there would remain the single SUT clock section, while additional corresponding data signal sections would be added, one for each channel. In connection with this, we have shown certain signals (a RESET, DONE, CAL and a delayed clock) that are sent to any additional data signal channels.
- the SUT clock input 25 is applied, along with a clock threshold voltage 26, to the inputs of a comparator 27.
- the nature of the comparator is that it produces an output 28 whenever the SUT clock input 25 is greater than or equal to the clock threshold voltage 26.
- the operator can specify the clock threshold voltage.
- the SUT data signal input 34 is applied, along with a (possibly channel specific) data threshold voltage V T 35, to the inputs of a comparator 36.
- the nature of the comparator is that it produces an output 37 whenever the SUT data signal input 34 is greater than or equal to the threshold voltage V T 35.
- the operator can specify the threshold voltage V T .
- all this circuitry is implemented within an IC.
- the effective values of the thresholds, as well as those of the various to delays to be encountered, are somewhat a function of temperature and other causes of drift.
- To minimize the mischief caused by such drifts we prefer to frequently adjust one of the variable delays (to be discussed below) to produce an indication of simultaneity (zero relative delay) under an imposed controlled condition. That controlled condition is that comparator output signals 28 and 37 transition at the same time. Rather that disturb the circuitry of the comparator (which is practical) we show OR gates 30 and 38 that allow a CAL signal 29 to accomplish the same effect.
- OR gate 30 the output of OR gate 30 is signal 31, which is applied to a CONFIGURABLE CLOCK TRIM DELAY circuit 32.
- this circuit 32 was a cascaded series (say, one thousand twenty-three in number) of non-inverting buffers whose input and series of successive outputs are selected by a switch (as in a MUX) to become a variably delayed version 33 of the input.
- Each buffer has the same delay, which is somewhere in the ten to twelve picosecond range. Let us call the delayed output a partially delayed clock signal.
- the series of cascaded non-inverting buffers is a good way of achieving the needed functionality, which is that of an electrically variable delay line.
- a digital signal it mimics the ability of an actual analog delay line to impart phase delay to an entire waveform, which is the basis for our being able to position dt at a location many cycles away from T 0 .
- a cascaded series of buffers is not infinitely variable, however, and the quantizing of the delay according to a stage of buffering limits the ultimate bandwidth. No matter, we can live with both effects, since we are dealing with clocked digital signals in what ought to be a synchronous environment. The extra "continuity" that a genuine delay line (e.g., a long transmission line) would afford is not a necessity in making our eye diagram measurements.
- the output 33 from the CONFIGURABLE CLOCK TRIM DELAY circuit 32 must be distributed to the vicinity of the data signal hardware (the stuff below line 56) for those however many channels, some of which may be in different ICs or on different printed circuit assemblies. The significance of this is that there are different delays in getting the partially delayed clock signal 33 to where its needed within each channel.
- the output of box 43 (there is no lumped delay there -- the lumped delay is an equivalent to the distributed delay that is real, but awkward to show) might be termed the real delayed clock signal.
- OR gate 38 is applied to another tapped delay line (DATA SIGNAL DELAY) 40 that is of the same nature as the CONFIGURABLE CLOCK TRIM DELAY circuit 32. Its output 41 is applied to the D input of a latch 47 that is clocked by that channel's real delayed clock signal 46.
- DATA SIGNAL DELAY tapped delay line
- each channel further delays its copy of the real delayed clock signal 46 to produce a doubly delayed clock signal 45.
- a dt delay circuit 44 of, say, four tapped delays of 70 ps, 120 ps, 170 ps and 220 ps .
- the doubly delayed clock signal 45 clocks a latch 48 whose D input is also the (same) delayed data signal applied to latch 47.
- the idea is that if the two latches 47 and 48 have different values (detected by XOR gate 49) after both have been clocked, then the SUT DATA INPUT SIGNAL 34 must have transitioned through V T sometime during the interval between when latch 47 was clocked and latch 48 was clocked.
- time interval dt in connection with Figures 1 and 3.
- the value of dt is the delay provided by the dt delay circuit 44.
- T 0 is the CAL condition we set out above (zero relative delay between the signals 41 and 46), and that by varying the tap of the DATA SIGNAL DELAY circuit 40 in both directions we create signed amounts of the offset T SAMP (i.e., we invoke values of ⁇ T SAMP ).
- the output of XOR gate 49 is applied, through AND gate 50, to an ENABLE input of a # OF HITS COUNTER 51, which may be reset at the beginning of each run.
- the # OF HITS COUNTER 51 is clocked (made to count if enabled) by a signal 58 that is a delayed (by delay 57) version of the doubly delayed clock signal 45.
- the extra delay 57 allows latch 48, XOR gate 49 and AND gate 50 to get set up (which, if it happens, enables the counter to count).
- the value 52 accumulated in the # OF HITS COUNTER 51 is stored by the EDA system in the indexed location ofthe data structure, along with any other information deemed useful, such as the value 54 of the pre-load for counter 53.
- the block diagram 24 suggests that this happens in an instance by instance manner. It will also be appreciated, however, that while the block diagram give the proper functionality to be obtained, it is often desirable for performance reasons to employ additional techniques such as pipelines, parallelism and MUX'ing of cached results to 'get things to run faster than they really do'.
- V T and T SAMP After each run a new combination of V T and T SAMP are instituted, and another run conducted, until there have been as many runs as needed, or the operator manually indicates that the measurement should be terminated.
Landscapes
- Engineering & Computer Science (AREA)
- Computer Networks & Wireless Communication (AREA)
- Signal Processing (AREA)
- Dc Digital Transmission (AREA)
- Eye Examination Apparatus (AREA)
Applications Claiming Priority (2)
| Application Number | Priority Date | Filing Date | Title |
|---|---|---|---|
| US20673 | 2001-10-29 | ||
| US10/020,673 US6785622B2 (en) | 2001-10-29 | 2001-10-29 | Method and apparatus for performing eye diagram measurements |
Publications (2)
| Publication Number | Publication Date |
|---|---|
| EP1306998A2 true EP1306998A2 (de) | 2003-05-02 |
| EP1306998A3 EP1306998A3 (de) | 2005-07-13 |
Family
ID=21799915
Family Applications (1)
| Application Number | Title | Priority Date | Filing Date |
|---|---|---|---|
| EP02256963A Withdrawn EP1306998A3 (de) | 2001-10-29 | 2002-10-08 | Verfahren und Gerät zur Augenmustermessung |
Country Status (3)
| Country | Link |
|---|---|
| US (2) | US6785622B2 (de) |
| EP (1) | EP1306998A3 (de) |
| CA (1) | CA2386501A1 (de) |
Cited By (2)
| Publication number | Priority date | Publication date | Assignee | Title |
|---|---|---|---|---|
| EP1359699A3 (de) * | 2002-04-25 | 2005-07-13 | Agilent Technologies, Inc. | Augenmusteranalysator |
| GB2413641A (en) * | 2004-04-28 | 2005-11-02 | Agilent Technologies Inc | Detecting signal behaviour in eye diagram analysis |
Families Citing this family (28)
| Publication number | Priority date | Publication date | Assignee | Title |
|---|---|---|---|---|
| WO2002071701A2 (en) * | 2001-03-02 | 2002-09-12 | Meriton Networks Inc. | Data path architecture for a light layer 1 oeo switch |
| US7076401B2 (en) * | 2002-04-30 | 2006-07-11 | Intel Corporation | Method and apparatus for measuring data timing using unity time-voltage sawtooth ramps |
| US6934647B2 (en) * | 2002-10-22 | 2005-08-23 | Agilent Technologies, Inc. | Efficient sampling of digital waveforms for eye diagram analysis |
| US7154944B2 (en) * | 2002-10-31 | 2006-12-26 | Agilent Technologies, Inc. | Mask compliance testing using bit error ratio measurements |
| US6804633B2 (en) * | 2003-01-31 | 2004-10-12 | Agilent Technologies, Inc. | Fast eye diagram analyzer uses nearest neighbor transverse to quickly discover basic eye diagrams |
| US6901339B2 (en) * | 2003-07-29 | 2005-05-31 | Agilent Technologies, Inc. | Eye diagram analyzer correctly samples low dv/dt voltages |
| US6973407B1 (en) * | 2004-05-13 | 2005-12-06 | Lsi Logic Corporation | Method and system for capturing data to create Serial ATA eye diagram |
| US20060031031A1 (en) * | 2004-08-06 | 2006-02-09 | Cohn Robert C | Method and apparatus for processing eye diagram data |
| US7362836B2 (en) * | 2005-04-27 | 2008-04-22 | Agilent Technologies, Inc. | Method for selecting optimum sampling parameters for a plurality of data receivers having at least one sampling parameter in common |
| US20060274873A1 (en) * | 2005-06-02 | 2006-12-07 | Abramovitch Daniel Y | Rapid data point selection for generating eye diagrams |
| US7623581B2 (en) * | 2005-09-15 | 2009-11-24 | Tektronix, Inc. | Reference clock recovery for “eye” measurements |
| US8327204B2 (en) * | 2005-10-27 | 2012-12-04 | Dft Microsystems, Inc. | High-speed transceiver tester incorporating jitter injection |
| US7286947B1 (en) | 2006-04-13 | 2007-10-23 | International Business Machines Corporation | Method and apparatus for determining jitter and pulse width from clock signal comparisons |
| US7684478B2 (en) * | 2006-06-30 | 2010-03-23 | International Business Machines Corporation | Generating an eye diagram of integrated circuit transmitted signals |
| US7389192B2 (en) * | 2006-06-30 | 2008-06-17 | International Business Machines Corporation | Determining data signal jitter via asynchronous sampling |
| US7383160B1 (en) * | 2006-06-30 | 2008-06-03 | International Business Machines Corporation | Method and apparatus for constructing a synchronous signal diagram from asynchronously sampled data |
| US7813297B2 (en) * | 2006-07-14 | 2010-10-12 | Dft Microsystems, Inc. | High-speed signal testing system having oscilloscope functionality |
| US7681091B2 (en) * | 2006-07-14 | 2010-03-16 | Dft Microsystems, Inc. | Signal integrity measurement systems and methods using a predominantly digital time-base generator |
| EP2115940A2 (de) * | 2007-02-09 | 2009-11-11 | DFT Microsystems, Inc. | System und verfahren zur testung der physischen schicht serieller hochgeschwindigkeitsverbindungen in deren einsatzumgebungen |
| US7917319B2 (en) * | 2008-02-06 | 2011-03-29 | Dft Microsystems Inc. | Systems and methods for testing and diagnosing delay faults and for parametric testing in digital circuits |
| US8249207B1 (en) | 2008-02-29 | 2012-08-21 | Pmc-Sierra, Inc. | Clock and data recovery sampler calibration |
| US8364033B2 (en) * | 2009-12-08 | 2013-01-29 | Telcordia Technologies, Inc. | Differential eye diagrams |
| US8995514B1 (en) * | 2012-09-28 | 2015-03-31 | Xilinx, Inc. | Methods of and circuits for analyzing a phase of a clock signal for receiving data |
| KR102373270B1 (ko) * | 2015-05-22 | 2022-03-14 | 삼성디스플레이 주식회사 | 표시장치 및 그 구동 방법 |
| US9568548B1 (en) | 2015-10-14 | 2017-02-14 | International Business Machines Corporation | Measurement of signal delays in microprocessor integrated circuits with sub-picosecond accuracy using frequency stepping |
| KR102548857B1 (ko) * | 2016-11-30 | 2023-06-29 | 삼성디스플레이 주식회사 | 표시 장치 및 이를 이용한 표시 패널의 구동 방법 |
| CN107569218A (zh) * | 2017-09-19 | 2018-01-12 | 上海青研科技有限公司 | 一种戒毒效果检测装置 |
| CN113063977B (zh) * | 2021-03-19 | 2023-09-29 | 合肥京东方显示技术有限公司 | 模拟测试方法、装置及计算机可读存储介质 |
Family Cites Families (10)
| Publication number | Priority date | Publication date | Assignee | Title |
|---|---|---|---|---|
| US4445192A (en) * | 1980-11-25 | 1984-04-24 | Hewlett-Packard Company | Logic state analyzer with time and event count measurement between states |
| US5210712A (en) * | 1990-09-29 | 1993-05-11 | Anritsu Corporation | Waveform shaping circuit and digital signal analyzing apparatus using the same |
| US5162723A (en) * | 1991-02-11 | 1992-11-10 | Hewlett-Packard Company | Sampling signal analyzer |
| CA2056679C (en) * | 1991-11-29 | 2002-02-12 | Timothy Joseph Nohara | Automatic monitoring of digital communication channel conditions using eye patterns |
| US5247544A (en) * | 1992-03-26 | 1993-09-21 | Motorola, Inc. | Phase adjustment method and apparatus for use in a clock recovery circuit |
| US5400370A (en) * | 1993-02-24 | 1995-03-21 | Advanced Micro Devices Inc. | All digital high speed algorithmic data recovery method and apparatus using locally generated compensated broad band time rulers and data edge position averaging |
| JP3462937B2 (ja) * | 1994-09-27 | 2003-11-05 | 富士通株式会社 | 自動振幅等化器 |
| EP0912020A3 (de) * | 1997-10-25 | 2002-07-03 | Alcatel | Entscheidungsverfahren mit adaptiven Schwellwerten |
| US6377642B1 (en) * | 1999-02-26 | 2002-04-23 | Cisco Technologies, Inc. | System for clock recovery |
| US6728311B1 (en) * | 2000-04-04 | 2004-04-27 | Thomas Eugene Waschura | Apparatus and method for creating eye diagram |
-
2001
- 2001-10-29 US US10/020,673 patent/US6785622B2/en not_active Expired - Lifetime
-
2002
- 2002-05-14 CA CA002386501A patent/CA2386501A1/en not_active Abandoned
- 2002-10-08 EP EP02256963A patent/EP1306998A3/de not_active Withdrawn
-
2004
- 2004-04-15 US US10/824,680 patent/US6871152B2/en not_active Expired - Fee Related
Non-Patent Citations (1)
| Title |
|---|
| None |
Cited By (2)
| Publication number | Priority date | Publication date | Assignee | Title |
|---|---|---|---|---|
| EP1359699A3 (de) * | 2002-04-25 | 2005-07-13 | Agilent Technologies, Inc. | Augenmusteranalysator |
| GB2413641A (en) * | 2004-04-28 | 2005-11-02 | Agilent Technologies Inc | Detecting signal behaviour in eye diagram analysis |
Also Published As
| Publication number | Publication date |
|---|---|
| EP1306998A3 (de) | 2005-07-13 |
| US6785622B2 (en) | 2004-08-31 |
| CA2386501A1 (en) | 2003-04-29 |
| US20040225460A1 (en) | 2004-11-11 |
| US20030083833A1 (en) | 2003-05-01 |
| US6871152B2 (en) | 2005-03-22 |
Similar Documents
| Publication | Publication Date | Title |
|---|---|---|
| US6785622B2 (en) | Method and apparatus for performing eye diagram measurements | |
| JP2733746B2 (ja) | ロジック信号表示方法 | |
| JP4532848B2 (ja) | デジタル・ストレージ・オシロスコープ用取込み装置 | |
| CN1230683C (zh) | 初级测量值与导出参数的同时显示 | |
| US6807496B2 (en) | Acquisition system for a long record length digital storage oscilloscope | |
| US6748335B2 (en) | Acquisition system for a multi-channel relatively long record length digital storage oscilloscope | |
| US6609077B1 (en) | ATE timing measurement unit and method | |
| US4425643A (en) | Multi-speed logic analyzer | |
| JP4986136B2 (ja) | ロジック信号波形表示装置 | |
| JP2819007B2 (ja) | ロジックアナライザ | |
| US20110137594A1 (en) | High Waveform Throughput with a Large Acquisition Memory | |
| US6847905B2 (en) | Architecture providing increased information display for long acquisitions or constrained memory bandwidth | |
| EP2930518B1 (de) | Prüf- und messinstrument mit erweiterter auslösefähigkeit | |
| US9874587B1 (en) | One-pass trigger jitter reduction for digital instruments | |
| US6901339B2 (en) | Eye diagram analyzer correctly samples low dv/dt voltages | |
| US5731984A (en) | Vector-based waveform acquisition and display | |
| US6804633B2 (en) | Fast eye diagram analyzer uses nearest neighbor transverse to quickly discover basic eye diagrams | |
| US6768703B2 (en) | Eye diagram analyzer with fixed data channel delays and swept clock channel delay | |
| US7143323B2 (en) | High speed capture and averaging of serial data by asynchronous periodic sampling | |
| US4884020A (en) | Phase detection system | |
| US9886419B2 (en) | System for improving probability of transient event detection | |
| US20230055303A1 (en) | Parallel trigger paths in a test and measurement instrument | |
| Rush et al. | Two ways to catch a wave (oscilloscopes) | |
| JPH07274217A (ja) | ビデオ信号検査方法および装置 |
Legal Events
| Date | Code | Title | Description |
|---|---|---|---|
| PUAI | Public reference made under article 153(3) epc to a published international application that has entered the european phase |
Free format text: ORIGINAL CODE: 0009012 |
|
| AK | Designated contracting states |
Designated state(s): AT BE BG CH CY CZ DE DK EE ES FI FR GB GR IE IT LI LU MC NL PT SE SK TR |
|
| AX | Request for extension of the european patent |
Extension state: AL LT LV MK RO SI |
|
| PUAL | Search report despatched |
Free format text: ORIGINAL CODE: 0009013 |
|
| AK | Designated contracting states |
Kind code of ref document: A3 Designated state(s): AT BE BG CH CY CZ DE DK EE ES FI FR GB GR IE IT LI LU MC NL PT SE SK TR |
|
| AX | Request for extension of the european patent |
Extension state: AL LT LV MK RO SI |
|
| RIC1 | Information provided on ipc code assigned before grant |
Ipc: 7H 04B 3/46 B Ipc: 7H 04L 1/24 A |
|
| 17P | Request for examination filed |
Effective date: 20051025 |
|
| AKX | Designation fees paid |
Designated state(s): DE FI GB SE |
|
| RAP1 | Party data changed (applicant data changed or rights of an application transferred) |
Owner name: AGILENT TECHNOLOGIES, INC. |
|
| 17Q | First examination report despatched |
Effective date: 20080613 |
|
| STAA | Information on the status of an ep patent application or granted ep patent |
Free format text: STATUS: THE APPLICATION IS DEEMED TO BE WITHDRAWN |
|
| 18D | Application deemed to be withdrawn |
Effective date: 20080503 |