EP1306322A1 - Damage status analysis method, damage status analysis system, damage status input terminal, recording medium and computer program product - Google Patents
Damage status analysis method, damage status analysis system, damage status input terminal, recording medium and computer program product Download PDFInfo
- Publication number
- EP1306322A1 EP1306322A1 EP00962965A EP00962965A EP1306322A1 EP 1306322 A1 EP1306322 A1 EP 1306322A1 EP 00962965 A EP00962965 A EP 00962965A EP 00962965 A EP00962965 A EP 00962965A EP 1306322 A1 EP1306322 A1 EP 1306322A1
- Authority
- EP
- European Patent Office
- Prior art keywords
- damage
- status
- information
- product
- analyzing
- Prior art date
- Legal status (The legal status is an assumption and is not a legal conclusion. Google has not performed a legal analysis and makes no representation as to the accuracy of the status listed.)
- Granted
Links
Images













Classifications
-
- G—PHYSICS
- G06—COMPUTING OR CALCULATING; COUNTING
- G06Q—INFORMATION AND COMMUNICATION TECHNOLOGY [ICT] SPECIALLY ADAPTED FOR ADMINISTRATIVE, COMMERCIAL, FINANCIAL, MANAGERIAL OR SUPERVISORY PURPOSES; SYSTEMS OR METHODS SPECIALLY ADAPTED FOR ADMINISTRATIVE, COMMERCIAL, FINANCIAL, MANAGERIAL OR SUPERVISORY PURPOSES, NOT OTHERWISE PROVIDED FOR
- G06Q10/00—Administration; Management
- G06Q10/10—Office automation; Time management
Definitions
- the present invention relates to a method and system for analyzing damage to products in a distribution process.
- An important object of distribution operations is to "promptly" transport products while maintaining the “high quality” thereof. If any product is damaged during a distribution process, the cause of the damage must be found as early as possible, and appropriate measures must be promptly taken therefor.
- Information on damage to products in a conventional distribution process has been analyzed by recording damage information on a sheet or a magnetic medium at a check point provided in the middle of or at the terminal of the distribution process and sending the recorded damage information to an analysis section.
- All data processed by statistical operations is figures for the quantity of damaged products, the number of occurrences, and the like as well as classification items generally representing damaged areas.
- a computer is used to classify, extract, and total data, but visual statistical analysis of the tendency of damage positions, which is very effective in analyzing the cause of the damage, must depend on manual classification and input of data. Accordingly, the visual statistical analysis requires a relatively large amount of work time and loads.
- Corrective measures must be promptly taken for damage to products during a distribution process if it involves a particular problem. If such measures are not taken, the problem may spread immediately because a large amount of products are distributed everyday.
- a damage status analyzing method is characterized in that product damage information including at least damaged position information is stored together with distribution attributes obtained during transportation so that a damage status is analyzed for each distribution attribute on the basis of damage information.
- the damaged position information is preferably indicated as planar two-dimensional position coordinates by, for example, schematically representing products on a two-dimensional drawing such as a development.
- a damage status analyzing system identifies a particular damaged position indicated by an X and Y coordinates instead of a roughly determined position such as a door of a car.
- damage information such as the type and level of damage and distribution attribute information obtained during transportation are accumulated.
- the damage status analyzing system enables such matters to be determined promptly and adequately.
- the distribution attributes are various factors constituting a distribution process and include those which are identified by, for example, the time when the damage check was conducted, the type of products to be transported, for example, if cars are transported, the particular type of the cars or their grade within an arbitrary type, and the location where the damage check was conducted and determination information for each transportation means, each transportation route, each transporter, each transportation facility, and each harbor cargo handler.
- product damage information including at least damaged position information is stored together with distribution attributes obtained during transportation so that the status of the damage is analyzed for each distribution attribute on the basis of the damage information.
- the results of the analysis are presented to an analysis operator, thereby facilitating analysis of the cause of the damage to the product.
- damaged position information represented by the two-dimensional position coordinates of damage to a product is presented together with distribution attribute information such as time series information, check point information, and transporter information. If for example, cars are transported and if it is determined that most of the damage occurs in the neighborhood of the movable root of a front door during transportation, then it can be estimated that any transportation instrument may strike against this area to cause damage, thereby enabling the causes to be analyzed. Consequently, the tendency and characteristic of the damage such as the status and position thereof in distribution processes can be examined and analyzed promptly and adequately.
- product damage information including at least damaged position information is stored in accordance with time series so that during analysis, a variation in each damage along the time series is clarified to temporally analyze the occurrence of the damage.
- damage information is stored together with an item indicating the type of a product so that the status of damage to a particular area is analyzed for each product type on the basis of the damage information.
- damage information is accumulated for each car type or each grade of a particular car type so that the damaged area and the type of the damage are analyzed for each car type or each grade, thereby enabling the causes and tendency of the damage to be analyzed.
- damage information is stored together with an item indicating a point (location) where the product was checked for damage so that the status of damage to a particular area is analyzed for each check location on the basis of the damage information. For example, if it is determined at a particular check point that a particular type of damage occurs in a particular area of a particular product, then it is determined that there is a problem with a particular product transporting method used before the check point is reached or the transporter's handling method.
- product damage information including at least damaged position information is stored together with at least one of the distribution attributes including transportation means, a transportation route, and a transporter so that the status of damage to a particular area is analyzed for each distribution attribute on the basis of the damage information.
- the cause of damage to a product can be easily analyzed on the basis of the damage information. For example, if it is determined that with a particular transportation means, a particular type of damage tends to occur in a particular area of a particular product, then this transportation means is the cause of the damage, and occurrence of damage can be controlled by properly changing this transportation means.
- the cause of the damage can be more precisely analyzed. For example, even if it is determined at the same check point that damage has occurred at the same position of products, the cause of the damage may vary depending on the type or level of the damage. Furthermore, determining the type and level of damage enables the determination of whether to take drastic or simple measures.
- damage information such as the type and level of damage and distribution attribute information obtained during transportation are accumulated in connection with the damaged position information.
- This enables prompt and adequate analysis of the tendency and characteristic of damage such as the status and position thereof in distribution processes, for which visually more precise determinations are important.
- visual determination of which part of the product is damaged often allows the cause of the damage to be found.
- An eighth to fourteenth arrangements relate to a system executing the above method.
- the eighth arrangement corresponds to the first method, and the damage status analyzing system is characterized by comprising storage means for storing product damage information including at least damaged position information, together with distribution attributes obtained during transportation, damage status analyzing means for analyzing the status of the damage for each distribution attribute on the basis of the damage information, and presentation means for presenting results of the analysis.
- the tendency of the damage can be estimated by combining one or more distribution attribute items, analyzing the damage status of the product, counting the number of products undergoing a particular type of damage, and analyzing the level of the damage.
- An analysis method including such an estimation method as a rule is preferably provided in the damage status analyzing means.
- the damage status analyzing means provided with such an analysis means analyses the damage status by using the analysis method to check damage information having damaged position information focusing on a particular position together with the corresponding distribution attributes.
- the cause of the damage can be determined more promptly and precisely than before. If the damage status analyzing means is provided with the analysis method as a rule, analysis of the cause of the damage, which has relied on a particular person's intuition, is carried out promptly and adequately.
- the ninth arrangement corresponds to the second method, and the damage status analyzing system is characterized by comprising storage means for storing product damage information including at least damaged position information, in a time series manner, damage status analyzing means for clarifying a variation in each damage along the time series to temporally analyze the occurrence of the damage, and presentation means for presenting results of the analysis.
- the tenth arrangement corresponds to the third method, and the damage status analyzing system is characterized by comprising storage means for storing product damage information including at least damaged position information, together with an item indicating the type of a product, damage status analyzing means for analyzing the status of damage for each product type on the basis of the damage information, and presentation means for presenting results of the analysis.
- the eleventh arrangement corresponds to the fourth method, and the damage status analyzing system is characterized by comprising storage means for storing product damage information including at least damaged position information, together with an item indicating a location where the product was checked for damage, damage status analyzing means for analyzing the status of damage for each check location on the basis of the damage information, and presentation means for presenting results of the analysis.
- the eleventh arrangement corresponds to the fourth method, and the damage status analyzing system is characterized by comprising storage means for storing product damage information including at least damaged position information, together with an item indicating at least one of the distribution attributes including transportation means, a transportation route, and a transporter, damage status analyzing means for analyzing the status of damage for each distribution attribute on the basis of the damage information, and presentation means for presenting results of the analysis.
- the thirteenth arrangement corresponds to the sixth method and is characterized in that the damage information includes the type and level of damage.
- the fourteenth arrangement corresponds to the seventh method and is characterized in that the damaged position information is indicated by planar two-dimensional position coordinates.
- any of the eighth to fourteenth damage status analyzing systems include a damage status input terminal that transfers the product damage information.
- a specific construction is characterized by further comprising an information transferring apparatus that transfers product damage information including at least damaged position information, together with distribution attributes obtained during transportation.
- a sixteenth to twenty-third arrangements relate to a recording medium storing a program that can be executed by a computer in order to allow the computer to operate any of the eighth to fifteenth arrangements. That is, an arrangement that attains the above object is a recording medium storing a program that can be loaded and executed by a computer to implement the above described means using the computer.
- the computer may be a general-purpose computer including a central processing unit or a dedicated machine used for particular processes, and is not limited as long as it includes a central processing unit.
- a specific sixteenth arrangement is a computer-readable recording medium having a program recorded thereon, the program allowing the computer to function as storage means for storing product damage information including at least damaged position information, together with distribution attributes obtained during transportation, damage status analyzing means for analyzing a the status of the damage for each distribution attribute on the basis of the damage information, and presentation means for presenting results of the analysis .
- a specific seventeenth arrangement is a computer-readable recording medium having a program recorded thereon, the program allowing the computer to function as storage means for storing product damage information including at least damaged position information, in a time series manner, damage status analyzing means for clarifying a variation in each damage along the time series to temporally analyze the occurrence of the damage, and presentation means for presenting results of the analysis.
- a specific eighteenth arrangement is a computer-readable recording medium having a program recorded thereon, the program allowing the computer to function as storage means for storing product damage information including at least damaged position information, together with an item indicating the type of a product, damage status analyzing means for analyzing the status of damage for each product type on the basis of the damage information, and presentation means for presenting results of the analysis.
- a specific nineteenth arrangement is a computer-readable recording medium having a program recorded thereon, the program allowing the computer to function as storage means for storing product damage information including at least damaged position information, together with an item indicating a location where the product was checked for damage, damage status analyzing means for analyzing the status of damage for each check location on the basis of the damage information, and presentation means for presenting results of the analysis.
- a specific twentieth arrangement is a computer-readable recording medium having a program recorded thereon, the program allowing the computer to function as storage means for storing product damage information including at least damaged position information, together with an item indicating at least one of the distribution attributes including transportation means, a transportation route, and a transporter, damage status analyzing means for analyzing the status of damage for each distribution attribute on the basis of the damage information, and presentation means for presenting results of the analysis.
- a specific twenty-first arrangement is characterized in that the damage information includes the type and level of damage.
- a specific twenty-second arrangement is characterized in that the damaged position information is indicated by planar two-dimensional position coordinates.
- a computer-readable recording medium which has a program recorded thereon, the program functioning as a damage status input terminal when executed by the computer. Its specific arrangement is a computer-readable recording medium having a program recorded thereon, the program allowing the computer to function as a damage status input terminal comprising an information transferring apparatus that transfers product damage information including at least damaged position information, together with distribution attributes obtained during transportation.
- These recording media can be distributed as software products. Further, by operating any of the software products using existing hardware resources, the present invention can be easily executed on the existing hardware as a new application. It should be appreciated that in addition to these recording media, internal storage devices such as a RAM and a ROM and external storage devices such as a hard disk may be included in the recording medium defined by the present invention as long as they can have the program recorded thereon.
- Some of the functions of the means of the sixteenth to twenty-third arrangements may be incorporated in the computer as hardware or may be implemented by an operating system or another application program incorporated in the computer.
- the program recorded on the recording medium may contain commands that invokes functions executed by the computer or causes such functions to be linked.
- Some of the means defined in the eighth to fifteenth arrangements may be replaced with corresponding ones of the functions executed, for example, by the operating system. That is, the recording medium does not have programs or modules directly recorded thereon which implement these functions, but substantially the same effects can be produced by invoking the corresponding functions of the operating system, which can achieve these functions, or causing the functions to be linked.
- a specific twenty-fourth arrangement is a computer program product allowing the computer to function as storage means for storing product damage information including at least damaged position information, together with distribution attributes obtained during transportation, damage status analyzing means for analyzing a the status of the damage for each distribution attribute on the basis of the damage information, and presentation means for presenting results of the analysis.
- a specific twenty-fifth arrangement is a computer program product allowing the computer to function as storage means for storing product damage information including at least damaged position information, in a time series manner, damage status analyzing means for clarifying a variation in each damage along the time series to temporally analyze the occurrence of the damage, and presentation means for presenting results of the analysis.
- a specific twenty-sixth arrangement is a computer program product allowing the computer to function as storage means for storing product damage information including at least damaged position information, together with an item indicating the type of a product, damage status analyzing means for analyzing the status of damage for each product type on the basis of the damage information, and presentation means for presenting results of the analysis.
- a specific twenty-seventh arrangement is a computer program product allowing the computer to function as storage means for storing product damage information including at least damaged position information, together with an item indicating a location where the product was checked for damage, damage status analyzing means for analyzing the status of damage for each check location on the basis of the damage information, and presentation means for presenting results of the analysis.
- a specific twenty-eighth arrangement is a computer program product allowing the computer to function as storage means for storing product damage information including at least damaged position information, together with an item indicating at least one of the distribution attributes including transportation means, a transportation route, and a transporter, damage status analyzing means for analyzing the status of damage for each distribution attribute on the basis of the damage information, and presentation means for presenting results of the analysis.
- a twenty-ninth computer program product is characterized in that the damage information includes the type and level of damage.
- a thirtieth computer program product is characterized in that the damaged position information is indicated by planar two-dimensional position coordinates.
- a computer-readable recording medium which has a program recorded thereon, the program functioning as a damage status input terminal when executed by the computer.
- Its specific arrangement is a computer program product allowing the computer to function as a damage status input terminal comprising an information transferring apparatus that transfers product damage information including at least damaged position information, together with distribution attributes obtained during transportation.
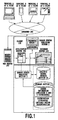
- Fig. 1 shows the configuration of a damage status analyzing system that analyzes the status of damage. If a plurality of cars are transported in cargoes from a location A to a location D, the status of damage in the cargoes is checked at each location. The results of the checks are sent from a plurality of terminals A to D to a damage status analyzing system 1 via the Internet 300. Then, the system 1 analyzes the status of damage.
- Fig. 1 operators conducting checks at these locations each use the terminal A, B, C, or D such as a personal computer to point a damaged area on a development of a car to be checked as shown in Fig. 5 (in this figure, a cross is used to indicate the damaged area). Furthermore, the operator checking the car inputs damage information such as the type and level of the damage and distribution attributes such as a name of a checking organization, a checked date and time, and a checked location. The input data is provided with security and then sent to a Web server 200 of the damage status analyzing system 1 via the Internet 300.
- damage information such as the type and level of the damage and distribution attributes such as a name of a checking organization, a checked date and time, and a checked location.
- the input data is provided with security and then sent to a Web server 200 of the damage status analyzing system 1 via the Internet 300.
- the Web server 200 identifies the operator of the terminal that has transferred the data, then clears the security provided for the transferred data, and subsequently delivers the data to an application server 100 constituting the damage status analyzing system 1.
- the data may be saved to a magnetic recording medium, which is then transported and delivered to the damage status analyzing system 1.
- a plan view drawn on paper and illustrating the occurrence of damage may be sent from a check point.
- the damaged area may be pointed (in the figure, a cross is used to indicate this area), and other damage information such as the type and level of the damage and distribution attributes such as a name of a checking organization, a checked date and time, and a checked location may then be input to save these data.
- the damage status analyzing system 1 analyzes the status of the damage on the basis of the accumulated data, and displays the results of the analysis on a screen of the client 130 connected to the application server 100.
- Fig. 2 shows the construction of apparatuses including the application server 100, a database server 120, and the client 130 connected to the application server 100, all of which constitute the damage status analyzing system 1.
- Each of these apparatuses comprises a CPU 102, internal storage devices such as a RAM 103 and a ROM 104, external storage devices such as a hard disk drive 105 and a CD-ROM driver 106, a particular communication device 107 composed of an adapter to which a dedicated line to the Internet is connected, input devices such as a keyboard 108 and a mouse 109, and output devices such as a display 110 and a printer 111, all of which are connected together via a system bus.
- the system bus 101 allows required data and commands to be communicated between these devices.
- the Web server 200 or terminal is composed of a general-purpose computer, it has the same configuration and thus its detailed description is omitted.
- the damage status analyzing system 1 is constructed on the application server 100, database server 120, and client 130, and has a storage section 2, a damage status analyzing section 3, and a presentation section 4, as shown in Fig. 1.
- the storage section 2 is composed of the hard disk drive 105 of the database server 120 to store damage information on cars including at least damaged position information, together with distribution attributes obtained during transportation. The stored information will be described later.
- the damage status analyzing section 3 is composed of the CPU 102 of the application server 100 and the RAM 103 thereof, which provides a working area.
- An analysis method storage section 30 composed of the hard disk drive 105 of the database server 120 provides an analysis method for the damage status analyzing section 3.
- the damage status analyzing section 3 has the function of analyzing the status of damage for each distribution attribute on the basis of the damage information.
- the analysis method stored in the analysis method storage section 30 analyzes the tendency of damage by taking out one or more arbitrary distribution attributes, rearranges the damage information and the other distribution attributes relative to the taken-out attributes, and counting the number of flaws concentrating at a particular position in a two-dimensional position coordinate system. If for example, cars of the same type are divided into groups of cargoes, which are then transported during different operations, then damage information is extracted for each group of cargoes taken out from the distribution attributes. The status of damage to the cars in each cargo group at each location is compared and analyzed. For the comparison and analysis, the data is rearranged in accordance with the time series, and the status of the same car type at the same location is compared for each part of the time series.
- One of the methods is to use initially fixed conditions to check whether or not damage has occurred under these conditions.
- the other is to formulate various hypotheses, extract data while varying the conditions, rearrange the data, and determine whether or not there is an unexpected significant data tendency. That is, this method presents only the particular condition with a significant tendency when the results are arranged.
- the presentation section 4 is composed of the display 110 of the client 130 and have the function of presenting the results of analysis. Although the presentation section 4 is composed of the client 130, it may be composed of the display (not shown) installed in the application server 100.
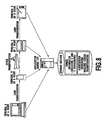
- Fig. 3 shows a data structure composed of damage information on a car including damaged position information as well as distribution attribute information obtained during transportation, both sets of information corresponding to the results of checks stored in the storage section 2.
- the data structure includes a (0) product number, that is, the body number of each car to be checked, the drawing number of a development of the car to be checked, and damaged position information composed of an X and Y coordinates indicative of each damaged position in the development. Damage information indicative of the type, shape, level, and the like of the damage at each damaged position is stored together with the X and Y coordinates. The figure illustrates the type, shape, level, size, and other factors of damage.
- the data structure further includes distribution attributes obtained during transportation.
- the distribution attributes include a name of a car type, a grade, a name of a checking organization, a checked date and time, a checked location, a plant code, a maker code, the name of a troopship, a loaded position within the ship, the type of a transportation instrument, a departure port, an arrival port, the name of a ship company, the name of a cargo handler, a departure date, an arrival date, the date of cargo handling, and other pieces of information.
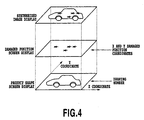
- Fig. 4 shows a method of synthesizing a development of a car type to be checked and damaged position information indicated by an X and Y coordinates.
- the synthesized screen is displayed on the presentation section 4 to allow an operator to visually confirm the damaged position.
- a tendency indicating which part of a checked car is frequently damaged or the like can be determined.
- the damaged position can be visually determined within a short time viewing the various status of damage under many and various classification and extraction conditions.
- Fig. 5 shows an input screen displayed if damaged position information and the type, level, and other factors of damage are input at, for example, a terminal A.
- a damaged position is clicked on the development of the checked car type using a cursor
- X and Y coordinate data on the development shown on the screen is obtained.
- the coordinate data is stored in the storage section 2 as damaged position information data.
- the input screen shown in Fig. 6 is presented, and damage information such as the type and level of the damage is input.
- Pieces of information are input for all of the damage to the target car. If there are a plurality of cars, the input operation is performed for predetermined ones of them. This operation may be performed for all the cars or only some of them which are extracted at certain intervals or at random. Subsequently, distribution attributes such as those shown in Fig. 3 are input.
- Fig. 7 shows a screen displaying, in the presentation section 4, damage information with damaged position information stored in the storage section 2, together with an enlarged development of a car type to be checked. Information on damaged areas marked with stars on the development is inverted on a spread sheet.
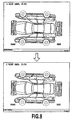
- Fig. 8 shows that the results of checks on a car damage status carried out at certain points are collectively stored in the storage section 2. This figure shows the case in which several hundreds of card are transported from a location A to a location B by land, then to a location C by sea, and subsequently to a location D by land again.
- the same target is checked in a time series manner or at each check point so that the results of the checks are accumulated in the storage section 2 of the damage status analyzing system 1.
- the damage status analyzing section 3 processes the accumulated results of the checks, when and where the damage has occurred and which part of the car has been damaged can be determined in detail from the distribution attribute information.
- distribution attributes such as the name of a ship, a loaded position within the ship, the type of a transportation instrument, the name of a ship company, and the name of a cargo handler as well as damage information such as the type and level of the damage are specified separately or in combination as classification and extraction conditions for the damaged position. In this manner, the causal relationship with the damage, e.g. which part of the car is prone to undergo the damage under certain conditions can be determined for each distribution attribute in detail, thereby enabling the cause of the damage to be determined or estimated.
- Fig. 9 shows positional information on damage discovered at a point C when a car with the same body number were checked at points B and C.
- Fig. 9 indicates that a right door position was damaged during loading, ocean shipping, or unloading.
- distribution attributes such as the name of a ship, a loaded position within the ship, the type of a transportation instrument, the name of a ship company, and the name of a cargo handler as well as damage information such as the type and level of the damage are specified separately or in combination as classification and extraction conditions for the damaged position for display.
- which part of the car is prone to undergo the damage under certain conditions can be determined, or information useful in estimating the cause of the damage can be obtained from the distribution attributes.
- Damage information including damaged position information is presented on the screen, and the damage status analyzing section 3 uses the various conditions in the distribution attribute information separately or in combination to provide classified and extracted damaged position information. Consequently, the status of the damage can be analyzed more closely than in the prior art within a very short time.
- the presentation section 4 provides the results of such damage status analysis for an operator analyzing the status, so that the analysis operator can precisely analyze the cause of the damage.
- the damage status analyzing section 3 draws out an appropriate one from the analysis method storage section 30 for execution as required.
- damage information is checked, and basic elements required to analyze the status of damage, i.e. temporal and locational attribute information and conditions are input to the computer.
- the damage status analyzing system shows when and where the damage occurred by arranging the data according to the conditions. This automatically provides the locational and temporal elements of the damage, which are basic check items.
- distribution attribute information and conditions such as the type of products, a harbor cargo handler and a handling method, a route, and the type of a transportation instrument are input to the computer, and the damage status analyzing system 1 arranges and displays these data.
- more detailed information that is, other distribution attribute factors concerning the damage can be verified. If a peculiar damage tendency occurs in particular environments and under particular conditions, distribution environment factors concerning these damage and attribute factors common to the damage are derived.
- the cause of damage to the surface of a vehicle is somewhat unique to its occurrence position.
- the present system uses the computer to precisely and promptly arrange and display the bias status of damaged positions on a two-dimensional plan view. Consequently, the most probable damage factors can be derived by comprehensive examinations based on the results of the analysis in the first and second step. This is useful in promptly discussing and planning future damage prevention measures and carrying out the planned measures as early as possible.
- the first to third steps need not necessarily be executed in this order, but the damage factors can be determined by executing the three steps in an arbitrary order.
- the status of damage is checked and recorded at two points in a car transporting process.
- information on a plurality of cargo handlers engaged in transportation and information on the name of a car type and the type and level of damage are added as data and input to the damage status analyzing system 1 together with positional information.
- Statistical analysis executed by the damage status analyzing system 1 indicates that in a certain transportation section, more scratches occurred close to a door handle or a keyhole on the driver side.
- Statistical analysis carried out by the damage status analyzing system 1 indicates that a large number of scratches have occurred at the opposite ends of the bumper of the car.
- Statistical analysis carried out by the damage status analyzing system 1 indicates that a large number of contamination losses and flaws have occurred at the right and left ends of the ceiling portion of the car.
- the dirty areas are uniformly distributed over the ceiling, then it is likely that flying dirt may have stuck to the car while it was placed outdoors. If the dirty areas or flaws are present only at the right and/or left end of the ceiling, then it is likely that this damage results from acts of operators such as the placement of operators' hands or dirty portable instruments at this position during cargo handling. Accordingly, the cargo handling method in this section must be corrected.
- Statistical analysis carried out by the damage status analyzing system 1 indicates that scratches are present between the ground and a fixed height in various areas including the door, fender, and right and left panel portions of the car. In this case, two estimated causes are derived.
- the other cause may be that a transportation section including a self-running section has a very narrow portion, where the car comes in contact with protrusions present therein.
- the facilities in the transportation process must be checked and improved.
- Statistical analysis carried out by the damage status analyzing system 1 indicates that a large number of scratches are found in the same area of the same car type regardless of the transportation section, transportation instrument, or cargo handler.
- the damage status analyzing system 1 carries out time-series and locational tendency analysis of damage and tendency analysis of distribution attribute information and damaged positions on a plan view.
- the cause of the damage which is difficult to promptly find with the conventional method, can be easily determined from the results of these analysis processes.
- the present invention provides not only a close damage check method but also a very effective support mechanism for consulting and negotiating with related people to reduce or prevent distribution damage from occurring during the manufacture or transportation process. This is because those engaged in the transportation process tend to avoid admitting that damage has occurred in their responsible section and because they are prone to treat damage, if any, as an "accidental occurrence".
- the damage status analyzing system 1 can present materials, together with the corresponding drawing, indicating that damage tends to occur evidently regularly only in the responsible section. This is more persuasive and is likely to facilitate discussion on appropriate corrective measures between the related parties.
- the damage status analyzing system 1 is constructed as a distributed processing system comprising the application server 100, the database server 120, and the client 130.
- a standalone configuration of a personal computer can also be used.
- the check data accumulated in the Web server 200 can be downloaded into the client 130 for analysis as required.
- the client 130 is a damage status analyzing system constituted by operating an application mounted in the client 130.
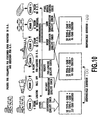
- Fig. 10 schematically shows analysis of the status of damage carried out using the damage status analyzing system, in accordance with time series if cars produced in the U.S. are exported to the U.K.
- Embodiment 2 dispatching quality was checked at the location O of a plant, railway transportation quality was checked after railway transportation, and a pre-loading check was conducted at a location N in the U.S. Then, ocean transportation quality was checked at a location S in the U.K. where the cargoes were unloaded, land transportation quality was checked at a location B in the U.K. after railway transportation, and the contents of repairs were finally checked at a location P in the U.K., that is, the destination. The results of these checks were accumulated in the damage status analyzing system 1 to analyze the status of damage.
- 115 cars of a certain type were checked including 58 TYPE-A grade cars and 57 TYPE-C grade cars.
- the same surveyor checked 84 cars including 58 TYPE-A grade cars and 26 TYPE-C grade cars.
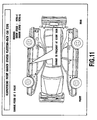
- Fig. 11 is a development of a car showing the status of damage for each car type observed when dispatching quality was checked.
- the points at which damage concentrated i.e. the points at which plural ones of the checked cars of the same grade are similarly damaged are marked with stars of different colors. Since the damage concentrates for both grades, the analysis operator adds an analysis result indicating that "damage is frequent at right door", to the analysis screen.
- the position of the damage in the "right door” is precisely displayed on the drawing, so that it is easy to determine manual operations or obstacles that may come in contact with that height or position during the transportation process. Compared to a conventional report indicating only that "flaw present in the right door", analysis and estimation of the cause is much easier.
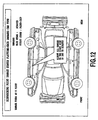
- Fig. 12 is a development of a car showing the status of damage for each damaged car type observed when dispatching quality was checked.
- the points at which similar damage concentrated i.e. the points at which plural ones of the checked cars were similarly damaged are marked with stars. Since the damage concentrates, the analysis operator adds an analysis result indicating that "almost all damage on the right side is due to scratch", to the analysis screen.
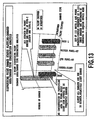
- Fig. 13 shows the results of composite analysis of damaged areas and types carried out when dispatching quality was checked.
- the analysis results are shown as a bar graph, and the analysis operator has added remarks to the graph.
- the pieces of registered distribution attribute information are arbitrarily combined together to analyze the tendency of the damage in various manner.
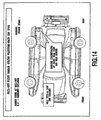
- Fig. 14 is a development of a car showing the status of damage for each car type observed when railway transportation quality was checked.
- the points at which damage concentrated are marked with starts of different colors. Damage occurred only in the TYPE-A grade and concentrated in the rear right portion of the car and the rear bumper. Accordingly, the analysis operator has added a corresponding analysis result to the analysis screen.
- Fig. 15 is a development of a car showing the status of damage for each damaged car type observed when railway transportation quality was checked.
- the confirmed damage includes not only scratches but also heavy damage caused by paint chips.
- the analysis operator has added a corresponding analysis result to the analysis screen.
- Fig. 16 is a graph showing the results of composite analysis of damaged areas and types carried out when railway transportation quality was checked.
- the analysis results are shown as a bar graph, and the analysis operator has added remarks to the graph.
- Fig. 17 is a development of a car showing the status of damage for each car type observed when pre-loading quality was checked.
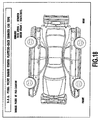
- Fig. 18 is a development of a car showing the status of damage for each damaged car type observed when pre-loading quality was checked.
- Fig. 19 is a development of a car showing the cumulative total of the status of damage for the same car type observed when pre-loading quality was checked. For the type-A cars, this figure indicates that damage concentrates in the rear bumper and the right QTR panel and door. The analysis operator has added a corresponding analysis result to the analysis screen.
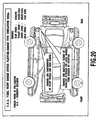
- Fig. 20 is a development of a car showing the cumulative total of the status of damage for the same damaged car type observed when pre-loading quality was checked. This figure indicates that damage concentrates in the right panel surface and the rear bumper. Although there is a slight difference in damage level between scratches and paint chips, these flaws are essentially handling damage. The analysis operator has added a corresponding analysis result to the analysis screen.
- damage data are accumulated one by one under arbitrary conditions and displayed on a plan view.
- damage data For particular cars transported under particular conditions, the tendency of damage occurring in particular areas can be discovered to facilitate analysis and estimation of the cause of the damage.
- Fig. 21 shows the results of composite analysis of damaged areas and types carried out when pre-loading quality was checked.
- the analysis results are shown as a bar graph, and the analysis operator has added remarks to the graph.
- Fig. 22 is a development of a car showing the status of damage for each car type observed when ocean shipping quality was checked.
- the significant occurrence of damage to the right door mirror and the distribution of damage to the QTR panel and bumper have been added to the analysis screen as analysis results.
- the generally high frequency of key missing has also been added to the screen.
- Fig. 23 is a development of a car showing the status of damage for each damaged car type observed when ocean shipping quality was checked. It has been confirmed that the key is missing. The damage determined to be a scratch damage level is relatively slight, so that a corresponding analysis result has been added to the analysis screen.
- Fig. 24 shows the results of composite analysis of damaged areas and types carried out when ocean shipping quality was checked.
- the analysis results are shown as a bar graph, and the analysis operator has added remarks to the graph.
- FIG. 25 development of a car showing the status of damage for each car type observed when the contents of repairs were finally checked.
- this figure indicates that damage concentrates in the upper part of the right body, and a corresponding analysis result has been added to the analysis screen.
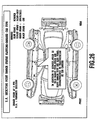
- Fig. 26 is a development of a car showing the status of damage for each damaged car type observed when the contents of repairs were finally checked. A large number of scratches have been found. Stains and severe damage unique to car carrier transportation have also been found, and a corresponding analysis result has been added to the analysis screen.
- Fig. 27 is a development of a car showing the cumulative total of the status of damage for the same car type observed when the contents of repairs were finally checked.
- Fig. 28 is a development of a car showing the cumulative total of the status of damage for the same damaged car type observed when the contents of repairs were finally checked.
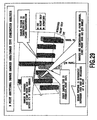
- Fig. 29 shows the results of composite analysis of damaged areas and types carried out when the contents of repairs were finally checked.
- the analysis results are shown as a bar graph, and the analysis operator has added remarks to the graph.
- Fig. 30 shows the transition of the frequency of damage during the entire transportation process according to Embodiment 2.
- the analysis operator has added remarks to the graph.
- Figs. 31 and 32 are flow charts showing the flow of a process executed mainly by the damage status analyzing system 1.
- a data mining method formulates a certain hypothesis concerning the cause of the damage and sequentially provides arbitrary analysis conditions to analyze tendencies obtained (as shown in Fig. 31).
- Another method uses initially fixed particular conditions, observes specified points for damage, compares the results of the observation, and records the actual situation of damage for each point, each section, and each transportation method.
- an analysis target is selected (step S101), and a plan view of a product, that is, the vehicle in this embodiment is set in the damage status analyzing system 1 (step S102). Then, damage check data required for analysis is collected, and various pieces of distribution attribute information are input and saved to the damage status analyzing system 1 together with damaged position information (X and Y coordinate axes) (step S103).
- step S104 After checking whether or not data required for analysis has been obtained (step S104), and n hypotheses concerning several causes of damage are formulated in accordance with the data mining method. For each hypothesis, I analysis conditions required to verify the hypothesis are set (step S107), and an analysis operation is continuously performed until each analysis pattern is completed (steps S106 and S109).
- step S114 if a significant tendency different from the others in the position, state, or content of the damage is observed on the basis of the analysis pattern based on the original hypothesis or an analysis pattern that has not initially been provided, then it is likely that this damage is not an accidental occurrence but has been caused by a problem unique to the distribution process (step S114). Accordingly, the cause of the damage is analyzed and verified, and corrective measures are discussed (step S115).
- the method in Fig. 32 uses initially fixed analysis conditions to check particular locations or sections for damage, using positional information.
- An analysis target and conditions are determined (step S201), a plan view of the vehicle, a target product, is set in the damage status analyzing system 1 (step S202). Damage data required for analysis is collected and input (step S203).
- step S204 these pieces of distribution attribute information are checked (step S204). If theses pieces of information do not match (step S204; No), the process is ended.
- step S204 If these pieces of information match (step S204; Yes) and if the cargoes have the same distribution attributes, the sets of damage information on these cargoes are compared (step S205). It is checked whether or not there is a significant difference between these sets of damage information (step S206). For example, if this difference can be numerically expressed, it is determined whether or not the difference exceeds a predetermined threshold.
- step S206 If the difference between these sets of information is not significant (step S206; No), the process is ended. If the difference is significant (step S 206; Yes), the results of the analysis are displayed (step S207), and the process is ended.
- the product can be checked by mainly checking whether or not the occurrence of damage has a particular tendency, while variously switching arbitrary conditions.
- the system 1 can be applied to the method of using initially fixed particular conditions to check particular sections, locations, and distribution attributes for damage.
- damage information such as the type and level of damage and distribution attribute information obtained during transportation are accumulated. This enables prompt and adequate analysis of the tendency and characteristic of damage such as the status and position thereof in distribution processes, for which visually more precise determinations are important.
- the damaged position information is indicated by planar two-dimensional position coordinates, it is possible to visually closely and statistically determine the tendency of damage such as the position and status thereof. Accordingly, presenting the results of analysis to the analysis operator enables prompt and adequate determination and analysis of the tendency and characteristic of damage such as the status and position thereof in the distribution process. Further, the cause of damage during car transportation can be easily analyzed, thereby enabling the determination of whether to take drastic or simple measures for the damage.
- the damage status analyzing system 1 is not limited to the above-described embodiments, and various changes may be made thereto without deviating from the spirits of the present invention.
- damage information such as the type and level of damage and distribution attribute information obtained during transportation are accumulated. It is important to visually more precisely determine the status of damage. Accordingly, the present invention is very effective in enabling prompt and adequate analysis of the tendency and characteristic of damage such as the status and position thereof in distribution processes.
- damaged position information is indicated by planar two-dimensional position coordinates
- damage information such as the type and level of damage and distribution attribute information obtained during transportation are accumulated in connection with the damaged position information.
- the present invention is suitable for establishing a distribution process with minimized damage.
Landscapes
- Engineering & Computer Science (AREA)
- Business, Economics & Management (AREA)
- Strategic Management (AREA)
- Entrepreneurship & Innovation (AREA)
- Human Resources & Organizations (AREA)
- Operations Research (AREA)
- Economics (AREA)
- Marketing (AREA)
- Data Mining & Analysis (AREA)
- Quality & Reliability (AREA)
- Tourism & Hospitality (AREA)
- Physics & Mathematics (AREA)
- General Business, Economics & Management (AREA)
- General Physics & Mathematics (AREA)
- Theoretical Computer Science (AREA)
- Management, Administration, Business Operations System, And Electronic Commerce (AREA)
- Warehouses Or Storage Devices (AREA)
Abstract
Description
Claims (31)
- A damage status analyzing method wherein product damage information including at least damaged position information is stored together with distribution attributes obtained during transportation so that a damage status is analyzed for each distribution attribute on the basis of damage information.
- A damage status analyzing method according to claim 1, wherein product damage information including at least damaged position information is stored in accordance with time series so that a variation in each damage is clarified on the basis of the time series to temporally analyze the occurrence of the damage.
- A damage status analyzing method according to claim 1, wherein product damage information including at least damaged position information is stored together with an item indicating the type of a product so that the status of damage is analyzed for each product type on the basis of the damage information.
- A damage status analyzing method according to claim 1, wherein product damage information including at least damaged position information is stored together with an item indicating a location where the product was checked for damage so that the status of damage is analyzed for each check location on the basis of the damage information.
- A damage status analyzing method according to claim 1, wherein product damage information including at least damaged position information is stored together with at least one of the distribution attributes including transportation means, a transportation route, and a transporter so that the status of damage is analyzed for each distribution attribute on the basis of the damage information.
- A damage status analyzing method according to any of claims 1 to 5, wherein said damage information includes the type and level of damage.
- A damage status analyzing method according to any of claims 1 to 6, wherein said damaged position information is indicated as planar two-dimensional position coordinates.
- A damage status analyzing system comprising:storage means for storing product damage information including at least damaged position information, together with distribution attributes obtained during transportation;damage status analyzing means for analyzing the status of the damage for each distribution attribute on the basis of the damage information; andpresentation means for presenting results of the analysis.
- A damage status analyzing system according to claim 8, comprising:storage means for storing product damage information including at least damaged position information, in a time series manner;damage status analyzing means for clarifying a variation in each damage along the time series to temporally analyze the occurrence of the damage; andpresentation means for presenting results of the analysis.
- A damage status analyzing system according to claim 8, comprising:storage means for storing product damage information including at least damaged position information, together with an item indicating the type of a product;damage status analyzing means for analyzing the status of damage for each product type on the basis of the damage information; andpresentation means for presenting results of the analysis.
- A damage status analyzing system according to claim 8, comprising:storage means for storing product damage information including at least damaged position information, together with an item indicating a location where the product was checked for damage;damage status analyzing means for analyzing the status of damage for each check location on the basis of the damage information; andpresentation means for presenting results of the analysis.
- A damage status analyzing system according to claim 8, comprising:storage means for storing product damage information including at least damaged position information, together with an item indicating at least one of the distribution attributes including transportation means, a transportation route, and a transporter;damage status analyzing means for analyzing the status of damage for each distribution attribute on the basis of the damage information;and presentation means for presenting results of the analysis.
- A damage status analyzing system according to any of claims 8 to 12, wherein said damage information includes the type and level of damage.
- A damage status analyzing system according to any of claims 8 to 13, wherein said damaged position information is indicated by planar two-dimensional position coordinates.
- A damage status input terminal comprising an information transferring apparatus that transfers product damage information including at least damaged position information, together with distribution attributes obtained during transportation.
- A computer-readable recording medium having a program recorded thereon, the program allowing the computer to function as:storage means for storing product damage information including at least damaged position information, together with distribution attributes obtained during transportation;damage status analyzing means for analyzing a the status of the damage for each distribution attribute on the basis of the damage information; andpresentation means for presenting results of the analysis.
- A computer-readable recording medium having a program recorded thereon according to claim 16, the program allowing the computer to function as:storage means for storing product damage information including at least damaged position information, in a time series manner;damage status analyzing means for clarifying a variation in each damage along the time series to temporally analyze the occurrence of the damage; andpresentation means for presenting results of the analysis.
- A computer-readable recording medium having a program recorded thereon according to claim 16, the program allowing the computer to function as:storage means for storing product damage information including at least damaged position information, together with an item indicating the type of a product;damage status analyzing means for analyzing the status of damage for each product type on the basis of the damage information; andpresentation means for presenting results of the analysis.
- A computer-readable recording medium having a program recorded thereon according to claim 16, the program allowing the computer to function as:storage means for storing product damage information including at least damaged position information, together with an item indicating a location where the product was checked for damage;damage status analyzing means for analyzing the status of damage for each check location on the basis of the damage information; andpresentation means for presenting results of the analysis.
- A computer-readable recording medium having a program recorded thereon according to claim 16, the program allowing the computer to function as:storage means for storing product damage information including at least damaged position information, together with an item indicating at least one of the distribution attributes including transportation means, a transportation route, and a transporter;damage status analyzing means for analyzing the status of damage for each distribution attribute on the basis of the damage information; andpresentation means for presenting results of the analysis.
- A computer-readable recording medium according to any of claims 16 to 20, wherein said damage information includes the type and level of damage.
- A computer-readable recording medium according to any of claims 16 to 21, wherein said damaged position information is indicated by planar two-dimensional position coordinates.
- A computer-readable recording medium having a program recorded thereon, the program allowing a computer to function as a damage status input terminal comprising an information transferring apparatus that transfers product damage information including at least damaged position information, together with distribution attributes obtained during transportation.
- A computer program product allowing a computer to function as:storage means for storing product damage information including at least damaged position information, together with distribution attributes obtained during transportation;damage status analyzing means for analyzing a the status of the damage for each distribution attribute on the basis of the damage information; andpresentation means for presenting results of the analysis.
- A computer program product according to claim 24, the program allowing a computer to function as:storage means for storing product damage information including at least damaged position information, in a time series manner;damage status analyzing means for clarifying a variation in each damage along the time series to temporally analyze the occurrence of the damage; andpresentation means for presenting results of the analysis.
- A computer program product according to claim 24, the program allowing a computer to function as:storage means for storing product damage information including at least damaged position information, together with an item indicating the type of a product;damage status analyzing means for analyzing the status of damage for each product type on the basis of the damage information; andpresentation means for presenting results of the analysis.
- A computer program product according to claim 24, the program allowing a computer to function as:storage means for storing product damage information including at least damaged position information, together with an item indicating a location where the product was checked for damage;damage status analyzing means for analyzing the status of damage for each check location on the basis of the damage information; andpresentation means for presenting results of the analysis.
- A computer program product according to claim 24, the program allowing a computer to function as:storage means for storing product damage information including at least damaged position information, together with an item indicating at least one of the distribution attributes including transportation means, a transportation route, and a transporter;damage status analyzing means for analyzing the status of damage for each distribution attribute on the basis of the damage information; andpresentation means for presenting results of the analysis.
- A computer program product according to any of claims 24 to 28, wherein said damage information includes the type and level of damage.
- A computer program product according to any of claims 24 to 29, wherein said damaged position information is indicated by planar two-dimensional position coordinates.
- A computer program product allowing a computer to function as a damage status input terminal comprising an information transferring apparatus that transfers product damage information including at least damaged position information, together with distribution attributes obtained during transportation.
Applications Claiming Priority (3)
| Application Number | Priority Date | Filing Date | Title |
|---|---|---|---|
| JP2000233960 | 2000-08-02 | ||
| JP2000233960A JP2002046823A (en) | 2000-08-02 | 2000-08-02 | Damage situation analysis method, damage situation analysis system, damage situation input terminal, and recording medium |
| PCT/JP2000/006752 WO2002012094A1 (en) | 2000-08-02 | 2000-09-29 | Damage status analysis method, damage status analysis system, damage status input terminal, recording medium and computer program product |
Publications (3)
| Publication Number | Publication Date |
|---|---|
| EP1306322A1 true EP1306322A1 (en) | 2003-05-02 |
| EP1306322A4 EP1306322A4 (en) | 2005-01-05 |
| EP1306322B1 EP1306322B1 (en) | 2008-07-16 |
Family
ID=18726405
Family Applications (1)
| Application Number | Title | Priority Date | Filing Date |
|---|---|---|---|
| EP00962965A Revoked EP1306322B1 (en) | 2000-08-02 | 2000-09-29 | Damage status analysis method, damage status analysis system, damage status input terminal, recording medium and computer program product |
Country Status (4)
| Country | Link |
|---|---|
| US (2) | US6862543B1 (en) |
| EP (1) | EP1306322B1 (en) |
| JP (1) | JP2002046823A (en) |
| WO (1) | WO2002012094A1 (en) |
Cited By (5)
| Publication number | Priority date | Publication date | Assignee | Title |
|---|---|---|---|---|
| US5910467A (en) * | 1997-05-23 | 1999-06-08 | Exxon Production Research Company | Solids-stabilized emulsion |
| EP2388702A3 (en) * | 2005-08-31 | 2012-01-11 | The Boeing Company | Automated damage assessment, report, and disposition |
| WO2012113084A1 (en) * | 2011-02-25 | 2012-08-30 | Audatex Gmbh | System and method for estimating collision damage to a car |
| US9824397B1 (en) | 2013-10-23 | 2017-11-21 | Allstate Insurance Company | Creating a scene for property claims adjustment |
| US10269074B1 (en) | 2013-10-23 | 2019-04-23 | Allstate Insurance Company | Communication schemes for property claims adjustments |
Families Citing this family (8)
| Publication number | Priority date | Publication date | Assignee | Title |
|---|---|---|---|---|
| US7889931B2 (en) * | 2004-10-22 | 2011-02-15 | Gb Investments, Inc. | Systems and methods for automated vehicle image acquisition, analysis, and reporting |
| US20060106652A1 (en) * | 2004-11-03 | 2006-05-18 | Wamsley David A | Graphic driven moving personal property tracking system and method |
| AU2006254632B2 (en) * | 2005-06-03 | 2011-10-27 | Stelvio Inc. | Management and analysis of cargo shipments |
| US8095395B2 (en) * | 2007-09-25 | 2012-01-10 | United Parcel Service Of America, Inc. | Method, system, and computer readable medium for analyzing damage to a package in a shipping environment |
| US8073753B2 (en) * | 2008-04-17 | 2011-12-06 | United Parcel Service Of America, Inc. | System and method for providing a packaging recommendation to a shipping customer |
| JP2010102556A (en) * | 2008-10-24 | 2010-05-06 | Mitsui Sumitomo Insurance Co Ltd | Physical distribution accident management device, physical distribution accident management method, and program |
| US9483522B2 (en) | 2013-03-07 | 2016-11-01 | Ricoh Company, Ltd. | Form aggregation based on marks in graphic form fields |
| CN119477123B (en) * | 2024-10-24 | 2025-06-17 | 北京鑫创数字科技股份有限公司 | A food traceability system based on blockchain |
Family Cites Families (16)
| Publication number | Priority date | Publication date | Assignee | Title |
|---|---|---|---|---|
| US3768645A (en) * | 1971-02-22 | 1973-10-30 | Sunkist Growers Inc | Method and means for automatically detecting and sorting produce according to internal damage |
| US3930994A (en) * | 1973-10-03 | 1976-01-06 | Sunkist Growers, Inc. | Method and means for internal inspection and sorting of produce |
| JPS5987081A (en) * | 1982-11-09 | 1984-05-19 | 池上通信機株式会社 | Appearance quality inspection method |
| JPH0799326B2 (en) * | 1986-08-30 | 1995-10-25 | 株式会社マキ製作所 | Appearance inspection method and apparatus for spherical articles |
| JP2622733B2 (en) * | 1988-09-28 | 1997-06-18 | 株式会社日立製作所 | Package delivery management method and device |
| JP2941308B2 (en) | 1989-07-12 | 1999-08-25 | 株式会社日立製作所 | Inspection system and electronic device manufacturing method |
| JP3006166B2 (en) * | 1991-06-25 | 2000-02-07 | 株式会社日立製作所 | Data analysis method, inspection system, and method of manufacturing thin film product |
| JP3052750B2 (en) * | 1994-09-22 | 2000-06-19 | 住友金属工業株式会社 | Product history management method and management system |
| JPH0950949A (en) * | 1995-05-26 | 1997-02-18 | Hitachi Ltd | Product manufacturing method and production management calculation system |
| GB9516762D0 (en) * | 1995-08-16 | 1995-10-18 | Phelan Sean P | Computer system for identifying local resources |
| JPH09179902A (en) * | 1995-12-25 | 1997-07-11 | Hitachi Ltd | Highly reliable logistics management method and system |
| JPH11144042A (en) * | 1997-11-12 | 1999-05-28 | Naoki Harigai | Method for finding new flaw of rental car and flaw finding device for implementing same method |
| JP3780707B2 (en) * | 1998-07-07 | 2006-05-31 | コニカミノルタホールディングス株式会社 | Management method in multi-process production of web |
| JP3187377B2 (en) * | 1998-10-06 | 2001-07-11 | 翼システム株式会社 | Computer readable medium storing insurance benefit agreement processing system and program |
| JP3747664B2 (en) * | 1998-12-09 | 2006-02-22 | Jfeスチール株式会社 | Steel plate inspection method, manufacturing method, and cold rolled steel plate manufacturing equipment |
| US6968293B2 (en) * | 2000-12-07 | 2005-11-22 | Juisclan Holding Gmbh | Method and apparatus for optimizing equipment maintenance |
-
2000
- 2000-08-02 JP JP2000233960A patent/JP2002046823A/en active Pending
- 2000-09-29 WO PCT/JP2000/006752 patent/WO2002012094A1/en not_active Ceased
- 2000-09-29 EP EP00962965A patent/EP1306322B1/en not_active Revoked
-
2002
- 2002-02-14 US US10/169,594 patent/US6862543B1/en not_active Expired - Lifetime
-
2004
- 2004-10-12 US US10/962,888 patent/US7062395B2/en not_active Expired - Lifetime
Cited By (11)
| Publication number | Priority date | Publication date | Assignee | Title |
|---|---|---|---|---|
| US5910467A (en) * | 1997-05-23 | 1999-06-08 | Exxon Production Research Company | Solids-stabilized emulsion |
| EP2388702A3 (en) * | 2005-08-31 | 2012-01-11 | The Boeing Company | Automated damage assessment, report, and disposition |
| WO2012113084A1 (en) * | 2011-02-25 | 2012-08-30 | Audatex Gmbh | System and method for estimating collision damage to a car |
| EP3789936A1 (en) * | 2011-02-25 | 2021-03-10 | Audatex GmbH | System and method for estimating collision damage to a car |
| US9824397B1 (en) | 2013-10-23 | 2017-11-21 | Allstate Insurance Company | Creating a scene for property claims adjustment |
| US10062120B1 (en) | 2013-10-23 | 2018-08-28 | Allstate Insurance Company | Creating a scene for property claims adjustment |
| US10068296B1 (en) | 2013-10-23 | 2018-09-04 | Allstate Insurance Company | Creating a scene for property claims adjustment |
| US10269074B1 (en) | 2013-10-23 | 2019-04-23 | Allstate Insurance Company | Communication schemes for property claims adjustments |
| US10504190B1 (en) | 2013-10-23 | 2019-12-10 | Allstate Insurance Company | Creating a scene for progeny claims adjustment |
| US11062397B1 (en) | 2013-10-23 | 2021-07-13 | Allstate Insurance Company | Communication schemes for property claims adjustments |
| US12579579B1 (en) | 2013-10-23 | 2026-03-17 | Allstate Insurance Company | Communication schemes for property claims adjustments |
Also Published As
| Publication number | Publication date |
|---|---|
| EP1306322A4 (en) | 2005-01-05 |
| JP2002046823A (en) | 2002-02-12 |
| WO2002012094A1 (en) | 2002-02-14 |
| US7062395B2 (en) | 2006-06-13 |
| US20050075802A1 (en) | 2005-04-07 |
| US6862543B1 (en) | 2005-03-01 |
| EP1306322B1 (en) | 2008-07-16 |
Similar Documents
| Publication | Publication Date | Title |
|---|---|---|
| US6862543B1 (en) | Method and system for analyzing damage of products | |
| Patel et al. | A case study: 5S implementation in ceramics manufacturing company | |
| Burdzik et al. | Cargo loading and unloading efficiency analysis in multimodal transport | |
| KR940001808B1 (en) | Inspection data interpretation system | |
| Zamora-Cristales et al. | Stochastic simulation and optimization of mobile chipping economics in processing and transport of forest biomass from residues | |
| Beham et al. | Performance, quality, and control in steel logistics 4.0 | |
| Mousavi et al. | Time consumption and productivity analysis of timber trucking using two kinds of trucks in northern Iran. | |
| JP3839822B2 (en) | Method for analyzing damage status of goods in logistics process, damage status analysis system and recording medium | |
| Jie et al. | The implementation of robotics and automation in improving warehouse efficiency among logistics operators in Malaysia | |
| Malyshev et al. | Artificial neural network detection of damaged goods by packaging state | |
| CN108846622A (en) | A kind of management system for enterprise logistics | |
| Saut | Productivity improvement of coal hauling using lean techniques: a case study in coal mining company in Indonesia | |
| CN110414904A (en) | A kind of container intelligence station system | |
| JP2019212305A (en) | Scraped automobile physical distribution management system | |
| JP2006036540A (en) | Damage situation analysis method for article in physical distribution process, damage situation analysis system, and recording medium | |
| Marzuki et al. | Factor Influence Of Container Loading And Unloading As Productivity Support On Mirah Terminal | |
| JP6833729B2 (en) | Revenue generation method by team building utilizing idle resources when scrap is generated | |
| PRILANA et al. | Human Reliability Analysis of Maritime Cargo Accidents in Indonesia using Risk Perception Technique | |
| Butor et al. | Reduction of life-cycle costs of locomotives by leaning maintenance process | |
| Khairuddin et al. | Successful Halal compliance factors for air cargo warehouse: Warehouse operator perspective | |
| Lubis et al. | The Effect of Standard Operating Procedures (SOPs), Supervision, and Information Technology on Employee Performance at JNE Outbound Unit Medan Main Branch | |
| Lebid et al. | CONSTRUCTION OF A SIMULATION MODEL OF THE WORK OF A WAREHOUSE ENTERPRISE AS A LINK IN THE LOGISTICS CHAIN. | |
| CN111401818A (en) | Express delivery achievement rate calculation method, device, equipment and storage medium | |
| Rokicki et al. | Disruptions in Supply Chains in the Automotive Industry During the COVID-19 Pandemic. The Case of Polish Companies-the Perspective of the Main Supply Market | |
| JP2025178872A (en) | Information processing device, information processing method, and program |
Legal Events
| Date | Code | Title | Description |
|---|---|---|---|
| PUAI | Public reference made under article 153(3) epc to a published international application that has entered the european phase |
Free format text: ORIGINAL CODE: 0009012 |
|
| 17P | Request for examination filed |
Effective date: 20020719 |
|
| AK | Designated contracting states |
Designated state(s): BE GB NL |
|
| RIN1 | Information on inventor provided before grant (corrected) |
Inventor name: NAKAMURA, TAKASHI Inventor name: TANIMOTO, TOSHIFUMI |
|
| RIN1 | Information on inventor provided before grant (corrected) |
Inventor name: NAKAMURA,TAKASHI,SOMPO JAPAN INSURANCE INC. Inventor name: TANIMOTO,TOSHIFUMI,SOMPO JAPAN INSURANCE INC. |
|
| A4 | Supplementary search report drawn up and despatched |
Effective date: 20041119 |
|
| 17Q | First examination report despatched |
Effective date: 20051021 |
|
| 17Q | First examination report despatched |
Effective date: 20051021 |
|
| GRAP | Despatch of communication of intention to grant a patent |
Free format text: ORIGINAL CODE: EPIDOSNIGR1 |
|
| RIN1 | Information on inventor provided before grant (corrected) |
Inventor name: TANIMOTO,TOSHIFUMIC/O SOMPO JAPAN INSURANCE INC. Inventor name: NAKAMURA,TAKASHIC/O SOMPO JAPAN INSURANCE INC. |
|
| RIC1 | Information provided on ipc code assigned before grant |
Ipc: G06Q 10/00 20060101ALI20080129BHEP Ipc: G06T 11/80 20060101ALI20080129BHEP Ipc: B65G 1/137 20060101AFI20080129BHEP Ipc: G07C 3/14 20060101ALI20080129BHEP |
|
| GRAS | Grant fee paid |
Free format text: ORIGINAL CODE: EPIDOSNIGR3 |
|
| GRAA | (expected) grant |
Free format text: ORIGINAL CODE: 0009210 |
|
| AK | Designated contracting states |
Kind code of ref document: B1 Designated state(s): BE GB NL |
|
| REG | Reference to a national code |
Ref country code: GB Ref legal event code: FG4D |
|
| PLBI | Opposition filed |
Free format text: ORIGINAL CODE: 0009260 |
|
| PLAX | Notice of opposition and request to file observation + time limit sent |
Free format text: ORIGINAL CODE: EPIDOSNOBS2 |
|
| 26 | Opposition filed |
Opponent name: MAYRHOFER, STEFAN Effective date: 20090416 |
|
| PLAB | Opposition data, opponent's data or that of the opponent's representative modified |
Free format text: ORIGINAL CODE: 0009299OPPO |
|
| NLR1 | Nl: opposition has been filed with the epo |
Opponent name: MAYRHOFER, STEFAN |
|
| PLAF | Information modified related to communication of a notice of opposition and request to file observations + time limit |
Free format text: ORIGINAL CODE: EPIDOSCOBS2 |
|
| PLBB | Reply of patent proprietor to notice(s) of opposition received |
Free format text: ORIGINAL CODE: EPIDOSNOBS3 |
|
| PGFP | Annual fee paid to national office [announced via postgrant information from national office to epo] |
Ref country code: NL Payment date: 20130810 Year of fee payment: 14 |
|
| PGFP | Annual fee paid to national office [announced via postgrant information from national office to epo] |
Ref country code: GB Payment date: 20130925 Year of fee payment: 14 |
|
| RDAF | Communication despatched that patent is revoked |
Free format text: ORIGINAL CODE: EPIDOSNREV1 |
|
| PGFP | Annual fee paid to national office [announced via postgrant information from national office to epo] |
Ref country code: BE Payment date: 20130912 Year of fee payment: 14 |
|
| RDAG | Patent revoked |
Free format text: ORIGINAL CODE: 0009271 |
|
| STAA | Information on the status of an ep patent application or granted ep patent |
Free format text: STATUS: PATENT REVOKED |
|
| 27W | Patent revoked |
Effective date: 20131001 |
|
| GBPR | Gb: patent revoked under art. 102 of the ep convention designating the uk as contracting state |
Effective date: 20131001 |