EP1086366B1 - A method in quality control of a spectrophotometer - Google Patents
A method in quality control of a spectrophotometer Download PDFInfo
- Publication number
- EP1086366B1 EP1086366B1 EP99924801A EP99924801A EP1086366B1 EP 1086366 B1 EP1086366 B1 EP 1086366B1 EP 99924801 A EP99924801 A EP 99924801A EP 99924801 A EP99924801 A EP 99924801A EP 1086366 B1 EP1086366 B1 EP 1086366B1
- Authority
- EP
- European Patent Office
- Prior art keywords
- spectrophotometer
- est
- spectrum
- dye
- concentration
- Prior art date
- Legal status (The legal status is an assumption and is not a legal conclusion. Google has not performed a legal analysis and makes no representation as to the accuracy of the status listed.)
- Expired - Lifetime
Links
- 238000000034 method Methods 0.000 title claims abstract description 37
- 238000003908 quality control method Methods 0.000 title claims abstract description 28
- 238000001228 spectrum Methods 0.000 claims abstract description 143
- 239000013598 vector Substances 0.000 claims abstract description 59
- 239000012530 fluid Substances 0.000 claims abstract description 16
- 239000000523 sample Substances 0.000 claims description 108
- 239000000975 dye Substances 0.000 claims description 88
- 210000004369 blood Anatomy 0.000 claims description 62
- 239000008280 blood Substances 0.000 claims description 62
- 238000000862 absorption spectrum Methods 0.000 claims description 61
- 238000002835 absorbance Methods 0.000 claims description 37
- 230000002452 interceptive effect Effects 0.000 claims description 28
- 239000013062 quality control Sample Substances 0.000 claims description 26
- 238000005259 measurement Methods 0.000 claims description 22
- 230000003595 spectral effect Effects 0.000 claims description 22
- 229910052754 neon Inorganic materials 0.000 claims description 21
- GKAOGPIIYCISHV-UHFFFAOYSA-N neon atom Chemical compound [Ne] GKAOGPIIYCISHV-UHFFFAOYSA-N 0.000 claims description 21
- 108010044495 Fetal Hemoglobin Proteins 0.000 claims description 11
- 239000013074 reference sample Substances 0.000 claims description 10
- 238000004458 analytical method Methods 0.000 claims description 9
- 230000000694 effects Effects 0.000 claims description 7
- 239000000306 component Substances 0.000 description 72
- IOOMXAQUNPWDLL-UHFFFAOYSA-N 2-[6-(diethylamino)-3-(diethyliminiumyl)-3h-xanthen-9-yl]-5-sulfobenzene-1-sulfonate Chemical compound C=12C=CC(=[N+](CC)CC)C=C2OC2=CC(N(CC)CC)=CC=C2C=1C1=CC=C(S(O)(=O)=O)C=C1S([O-])(=O)=O IOOMXAQUNPWDLL-UHFFFAOYSA-N 0.000 description 21
- 238000004519 manufacturing process Methods 0.000 description 12
- 239000012503 blood component Substances 0.000 description 11
- 239000000126 substance Substances 0.000 description 10
- 239000012088 reference solution Substances 0.000 description 9
- 230000004044 response Effects 0.000 description 9
- 238000000491 multivariate analysis Methods 0.000 description 8
- 239000012895 dilution Substances 0.000 description 7
- 238000010790 dilution Methods 0.000 description 7
- 230000004048 modification Effects 0.000 description 6
- 238000012986 modification Methods 0.000 description 6
- 230000008569 process Effects 0.000 description 5
- 230000000754 repressing effect Effects 0.000 description 5
- 238000010586 diagram Methods 0.000 description 4
- 239000000203 mixture Substances 0.000 description 4
- 238000002496 oximetry Methods 0.000 description 4
- 238000000513 principal component analysis Methods 0.000 description 4
- 238000012628 principal component regression Methods 0.000 description 4
- 230000008439 repair process Effects 0.000 description 4
- 239000000243 solution Substances 0.000 description 4
- 108010054147 Hemoglobins Proteins 0.000 description 3
- 102000001554 Hemoglobins Human genes 0.000 description 3
- 238000004847 absorption spectroscopy Methods 0.000 description 3
- 230000005540 biological transmission Effects 0.000 description 3
- 238000004159 blood analysis Methods 0.000 description 3
- 230000007547 defect Effects 0.000 description 3
- 230000007774 longterm Effects 0.000 description 3
- 238000013178 mathematical model Methods 0.000 description 3
- 238000012544 monitoring process Methods 0.000 description 3
- BPYKTIZUTYGOLE-IFADSCNNSA-N Bilirubin Chemical compound N1C(=O)C(C)=C(C=C)\C1=C\C1=C(C)C(CCC(O)=O)=C(CC2=C(C(C)=C(\C=C/3C(=C(C=C)C(=O)N\3)C)N2)CCC(O)=O)N1 BPYKTIZUTYGOLE-IFADSCNNSA-N 0.000 description 2
- 238000010521 absorption reaction Methods 0.000 description 2
- 230000008033 biological extinction Effects 0.000 description 2
- 125000002091 cationic group Chemical group 0.000 description 2
- 230000001419 dependent effect Effects 0.000 description 2
- 238000003745 diagnosis Methods 0.000 description 2
- 239000003792 electrolyte Substances 0.000 description 2
- 238000012067 mathematical method Methods 0.000 description 2
- 238000010606 normalization Methods 0.000 description 2
- 238000012545 processing Methods 0.000 description 2
- 239000001044 red dye Substances 0.000 description 2
- 239000002904 solvent Substances 0.000 description 2
- 238000012360 testing method Methods 0.000 description 2
- 239000001018 xanthene dye Substances 0.000 description 2
- BCHZICNRHXRCHY-UHFFFAOYSA-N 2h-oxazine Chemical compound N1OC=CC=C1 BCHZICNRHXRCHY-UHFFFAOYSA-N 0.000 description 1
- RBTBFTRPCNLSDE-UHFFFAOYSA-N 3,7-bis(dimethylamino)phenothiazin-5-ium Chemical compound C1=CC(N(C)C)=CC2=[S+]C3=CC(N(C)C)=CC=C3N=C21 RBTBFTRPCNLSDE-UHFFFAOYSA-N 0.000 description 1
- JUJWROOIHBZHMG-UHFFFAOYSA-N Pyridine Chemical compound C1=CC=NC=C1 JUJWROOIHBZHMG-UHFFFAOYSA-N 0.000 description 1
- 239000000999 acridine dye Substances 0.000 description 1
- 230000003213 activating effect Effects 0.000 description 1
- 230000004913 activation Effects 0.000 description 1
- 239000000654 additive Substances 0.000 description 1
- 230000000996 additive effect Effects 0.000 description 1
- 125000000129 anionic group Chemical group 0.000 description 1
- 239000007864 aqueous solution Substances 0.000 description 1
- 210000000601 blood cell Anatomy 0.000 description 1
- 238000009529 body temperature measurement Methods 0.000 description 1
- UBAZGMLMVVQSCD-UHFFFAOYSA-N carbon dioxide;molecular oxygen Chemical compound O=O.O=C=O UBAZGMLMVVQSCD-UHFFFAOYSA-N 0.000 description 1
- 230000008859 change Effects 0.000 description 1
- 230000002301 combined effect Effects 0.000 description 1
- 238000004590 computer program Methods 0.000 description 1
- 239000004020 conductor Substances 0.000 description 1
- 238000013523 data management Methods 0.000 description 1
- 210000003743 erythrocyte Anatomy 0.000 description 1
- 230000006870 function Effects 0.000 description 1
- 239000007789 gas Substances 0.000 description 1
- 229910052736 halogen Inorganic materials 0.000 description 1
- 150000002367 halogens Chemical class 0.000 description 1
- 230000002949 hemolytic effect Effects 0.000 description 1
- MOFVSTNWEDAEEK-UHFFFAOYSA-M indocyanine green Chemical compound [Na+].[O-]S(=O)(=O)CCCCN1C2=CC=C3C=CC=CC3=C2C(C)(C)C1=CC=CC=CC=CC1=[N+](CCCCS([O-])(=O)=O)C2=CC=C(C=CC=C3)C3=C2C1(C)C MOFVSTNWEDAEEK-UHFFFAOYSA-M 0.000 description 1
- 229940028435 intralipid Drugs 0.000 description 1
- 239000007788 liquid Substances 0.000 description 1
- 239000011159 matrix material Substances 0.000 description 1
- 229960000907 methylthioninium chloride Drugs 0.000 description 1
- 230000007935 neutral effect Effects 0.000 description 1
- 230000003287 optical effect Effects 0.000 description 1
- 239000013307 optical fiber Substances 0.000 description 1
- 239000000843 powder Substances 0.000 description 1
- 239000001016 thiazine dye Substances 0.000 description 1
- ANRHNWWPFJCPAZ-UHFFFAOYSA-M thionine Chemical compound [Cl-].C1=CC(N)=CC2=[S+]C3=CC(N)=CC=C3N=C21 ANRHNWWPFJCPAZ-UHFFFAOYSA-M 0.000 description 1
- XLYOFNOQVPJJNP-UHFFFAOYSA-N water Substances O XLYOFNOQVPJJNP-UHFFFAOYSA-N 0.000 description 1
Images




Classifications
-
- G—PHYSICS
- G01—MEASURING; TESTING
- G01J—MEASUREMENT OF INTENSITY, VELOCITY, SPECTRAL CONTENT, POLARISATION, PHASE OR PULSE CHARACTERISTICS OF INFRARED, VISIBLE OR ULTRAVIOLET LIGHT; COLORIMETRY; RADIATION PYROMETRY
- G01J3/00—Spectrometry; Spectrophotometry; Monochromators; Measuring colours
- G01J3/28—Investigating the spectrum
- G01J3/42—Absorption spectrometry; Double beam spectrometry; Flicker spectrometry; Reflection spectrometry
-
- G—PHYSICS
- G01—MEASURING; TESTING
- G01J—MEASUREMENT OF INTENSITY, VELOCITY, SPECTRAL CONTENT, POLARISATION, PHASE OR PULSE CHARACTERISTICS OF INFRARED, VISIBLE OR ULTRAVIOLET LIGHT; COLORIMETRY; RADIATION PYROMETRY
- G01J3/00—Spectrometry; Spectrophotometry; Monochromators; Measuring colours
- G01J3/28—Investigating the spectrum
-
- G—PHYSICS
- G01—MEASURING; TESTING
- G01N—INVESTIGATING OR ANALYSING MATERIALS BY DETERMINING THEIR CHEMICAL OR PHYSICAL PROPERTIES
- G01N21/00—Investigating or analysing materials by the use of optical means, i.e. using sub-millimetre waves, infrared, visible or ultraviolet light
- G01N21/17—Systems in which incident light is modified in accordance with the properties of the material investigated
- G01N21/25—Colour; Spectral properties, i.e. comparison of effect of material on the light at two or more different wavelengths or wavelength bands
- G01N21/27—Colour; Spectral properties, i.e. comparison of effect of material on the light at two or more different wavelengths or wavelength bands using photo-electric detection ; circuits for computing concentration
- G01N21/274—Calibration, base line adjustment, drift correction
Definitions
- the present invention relates to a method in quality control of a spectrophotometer for monitoring performance of the spectrophotometer, such as an oximeter for measurement of blood parameters.
- Spectrophotometers for measuring the composition of a substance by absorption spectroscopy are well known.
- oximeters are used to determine concentrations of various hemoglobin components or fractions in blood samples from measuring an absorption spectrum in the visible and/or infrared wavelength range.
- Such an oximeter is disclosed in EP 210417 .
- determination of a spectrum of a fluid sample is performed by transmission of light through a cuvette containing a part of the sample.
- the absorbance A( ⁇ ) of the sample is defined as the logarithm of the ratio of the light intensity before and after transmission through the sample.
- the absorbance A( ⁇ ) is defined as the logarithm of the ratio between the light intensity, I 0 , transmitted through a transparent aqueous reference solution and the light intensity transmitted through the sample:
- a ⁇ log ⁇ I o I
- the total absorbance A total is the sum of the individual components' absorbances since absorbance is an additive quantity.
- the absorption A total ( ⁇ ) recorded at each wavelength ⁇ contains contributions from each of the components in the sample.
- the vectors K y ( ⁇ ) may be determined mathematically by using methods such as multivariate analysis, or solving n equations with n unknowns, on data from reference samples.
- Known quality control samples specific for blood analysis are typically red dye based samples designed to simulate the spectrum of blood. In addition to a red dye, they sometimes contain certain amounts of oxygen, carbon dioxide, and electrolytes at an established pH for determining performance of blood gas and electrolyte instruments. Synthetic QC samples having an absorption spectrum that closely mimics that of physiological blood have not yet been provided.
- Quality control of spectrophotometers is typically performed by measuring the absorption spectrum of a QC sample comprising three to four different dyes. The dyes are mixed in a proportion so that the QC sample absorption spectrum timics the absorption spectrum of blood.
- a spectrum of a QC sample is measured on the oximeter to be monitered and the parameter values determined by the oximeter are compared with predetermined control limits assigned to the QC sample by a qualified person. If the determined parameters are outside the corresponding control limits, servicing of the oximeter is required.
- a quality control method for monitoring performance of an oximeter comprises measuring the absorption spectrum of a QC sample and comparing it to a standard spectrum of the QC sample. Instrumental errors of the oximeter are considered to be the primary source contributing to the observed difference. Instrumental errors are converted into blood component concentration values so that instrument errors can be reported in terms understood by the operator of the instrument.
- Future spectrophotometers are expected to facilitate determination of absorption spectra with improved resolution whereby instruments of higher precision and specificity are provided.
- High resolution measurements of spectra makes it more difficult to develop a suitable QC sample since precision and long term stability requirements are increased.
- each spectrophotometer positions a determined spectrum slightly differently along the wavelength axis. Therefore the wavelengths at which absorbance is determined are also positioned slightly differently for different spectrophotometers and thus, determined absorbances will vary for different spectrophotometers.
- An instrument error affects the spectrum of a sample, and specific types of instrument errors affect the spectrum in a distinct way that may be interpreted like the presence of a component in the sample in a different concentration.
- a variation of the length d of the light path through the cuvette causes determined absorbances A( ⁇ ) to vary according to Lambert-Beer's law (absorbance is proportional to d), and unintentional dilution of the sample in the cuvette affects the determined absorbance in the same way, etc.
- An absorption spectrum of a sample may be defined by a vector A m ( ⁇ ) comprising at least two elements, each of the elements representing an absorbance of the sample at a specific wavelength ⁇ j .
- a quality control method for a spectrophotometer as defined in claim 1 comprising the steps of:
- the wavelength shift ⁇ is determine after normalisation of the determined spectrum A m ( ⁇ ) with an estimate of the concentration of the dye.
- c ⁇ ( ⁇ ) has been determined from a combination of a reference spectrum A 0 ( ⁇ ) of a reference sample containing the dye and a first derivative A 0 '( ⁇ ) of the reference spectrum.
- a m ⁇ A 0 ⁇ + ⁇ A 0 ⁇ ⁇ ⁇ in which A 0 ( ⁇ ) is the reference spectrum, A 0 '( ⁇ ) is its first derivative with respect to the wavelength ⁇ , ⁇ is the wavelength shift to be determined, and A m ( ⁇ ) is a spectrum of the sample with the known spectrum A 0 ( ⁇ ) measured by the spectrophotometer in which the wavelength shift is to be determined.
- ⁇ may be determined according to various mathematical methods known in the art, e.g.
- the equation above may be solved for a selected wavelength, the equation may be solved for a set of selected wavelengths and ⁇ be calculated as an average of the solutions for ⁇ to the equation may be determined by a least squares fit, ⁇ may be determined by multivariate analysis, etc.
- a spectrophotometer as defined in claim 8 comprising a processor that is adapted to determined the wavelength shift ⁇ between an absorption spectrum A m ( ⁇ ) determined with the spectrophotometer on a fluid quality control sample containing a dye selected from such dyes which provide the quality control sample with an absorption spectrum with a significant absorbance peak showing a steep flank and a reference absorption spectrum A 0 ( ⁇ ) of a reference quality control sample containing the dye, stored in the memory of the spectrophotometer.
- the spectrophotometer comprising a memory with a mathematical parameter for the determination of a wavelength shift ⁇ of the spectrophotometer, and a processor that is connected to the memory and that is adapted to calculate the wavelength shift ⁇ from the mathematical parameter and from a spectrum A m ( ⁇ ) determined with the spectrophotometer on a fluid QC sample containing a dye.
- the mathematical parameter as mentioned above may comprise the first reference spectrum A 0 ( ⁇ ) and the first derivative A 0 '( ⁇ ) of the first reference spectrum A 0 ( ⁇ ) at a selected wavelength ⁇ 0 or at a selected set of wavelengths ⁇ 0 , ⁇ 1 ,..., ⁇ L , etc., or a parameter derived from the spectra, such as the parameter C ⁇ ( ⁇ ).
- ⁇ is normalised with c qc or an approximation to c qc , e.g. when the dye is a two-component dye, such as Sulforhodamine B, ⁇ is preferably normalised with a concentration of a first component of the dye s 1 .
- the normalisation of ⁇ with s 1 is desirable when there is a difference between the concentration of the dye in a reference sample from which the reference spectrum was determined, and the concentration of the dye in the QC sample.
- the mathematical parameter stored in the memory constitutes a vector C ⁇ ( ⁇ ) from which the wavelength shift ⁇ may be determined.
- the QC sample comprises a dye with two components in a chemical equilibrium where the ratio between the concentration of each component varies with the total concentration of the dye.
- the shape of the absorption spectrum is dependent on the total concentration of the dye. This characteristic of the dye makes it possible to distinguish between a concentration measurement error caused by undesired dilution of the sample in the cuvette, and a measurement error caused by light path changes in the cuvette.
- the method of preparing a spectrophotometer for quality control comprises determining a first reference spectrum A 01 ( ⁇ ) of a reference sample containing the dye in a first concentration and determining a second reference spectrum A 02 ( ⁇ ) of a reference sample containing the dye in a second concentration with the reference spectrophotometer, the dye comprising a first component and a second component in chemical equilibrium.
- Mathematically two model spectra A 1 ( ⁇ ) and A 2 ( ⁇ ) that represent spectral information about the first and the second component, respectively, may be derived from the first and second reference spectra A 0 1 ( ⁇ ) and A 02 ( ⁇ ) in such a way that the spectra of the reference samples can be calculated as a weighted sum of A 1 ( ⁇ ) and A 2 ( ⁇ ).
- a 1 ( ⁇ ) and A 1 ( ⁇ ) may be the individual spectra from the two components, respectively, of the dye, or, A 1 ( ⁇ ) may be the sum of the individual spectra from the two components while A 2 ( ⁇ ) may be the difference between the individual spectra of the two components, etc.
- a 1 ( ⁇ ) and A 2 ( ⁇ ) are determined from reference spectra A 0 1 ( ⁇ ) and A 02 ( ⁇ ) by Principal Components Analysis (PCA).
- PCA Principal Components Analysis
- Each of the parameters s 1 , s 2 , and ⁇ are determined by mathematical methods, such as multivariate analysis on data obtained from reference samples.
- the memory of the spectrophotometer may further comprise vectors C 1 ( ⁇ ) and C 2 ( ⁇ ) fulfilling the equations (14) and (15).
- the dye has a spectrum with a significant absorbance peak with a steep flank within the measurement range of the spectrophotometer in order to accurately determine small wavelength shifts.
- a wavelength shift of 0.05 nm is sufficient to cause an inaccurate determination of several blood parameters, such as ctHb, sO 2 , F O 2 Hb, F HHb, F OHb, F MetHb, etc.
- the spectrum of the QC sample resembles spectra of samples, which the spectrophotometer in question is intended to analyse so that performance of the instrument can be monitored.
- the dye should, preferably, also have a molar extinction coefficient in the range from 10,000 to 100,000.
- the dye may belong to one of several chemical classes, such as cyanine dyes, azacyanine dyes, triarylmethine dyes, acridine dyes, azine dyes, oxazine dyes, thiazine dyes, xanthene dyes, etc.
- Dyes belonging to the first four classes are typically cationic dyes being water soluble due to the molecule's positive charge.
- the xanthene dyes include the cationic and neutral rhodamines and the anionic sulforhodamines among which Sulforhodamine B is a preferred dye.
- the spectrum of reference samples containing the dye in at least two different concentrations is determined, e.g. by an accurate reference instrument of the same type as the spectrophotometer to be quality controlled, at a selected set of wavelengths. Then the coefficient vectors C 1 ( ⁇ ), C 2 ( ⁇ ) and C ⁇ ( ⁇ ) and the constants a and b are determined, e.g. by multivariate analysis, and stored at the time of manufacture in the memory of the spectrophotometers to be quality controlled by fluid QC samples when put into their normal use.
- the concentration c qc , the ratio s 2 /s 1 denoted Q ref and an initial wavelength shift ⁇ qc may be determined by a reference spectrophotometer.
- the initial wavelength shift of the QC sample emerges mainly from a variation in the composition of the solvent of the dye in the QC sample.
- a label such as a bar-code label, a magnetic label, etc, may be attached to each of the QC samples containing one or more of the values c qc , Q ref and ⁇ qc in question.
- one or more of the values may be printed in a bar code on a paper sheet following a set of QC samples. The values appearing on the labels or paper sheet are designated assigned values.
- a possible dilution of the QC sample may be determined from a difference between Q est and Q ref , and the combined effect of dilution and deviations in length d of the light path through the cuvette may be determined from a difference between c est and c qc .
- the estimated parameter values such as ⁇ , c est , and Q est , may be used for determination of parameter values of samples, the analysis of which the spectrophotometer is intended for, so that the outcome of the quality control procedure can be reported by the instrument in quantities meaningful for an operator of the instrument.
- the theoretical modifications to one or several predetermined standard blood spectra caused by a measurement error corresponding to one of the parameters ⁇ , c est , and Q est determined in the quality control procedure may be calculated by the oximeter. From the modified spectra, the oximeter may calculate corresponding blood parameter values to be reported to the operator of the instrument.
- the predetermined standard blood spectra may either be stored in the memory of the oximeter, or they may be derived mathematically by the processor in the oximeter from predetermined spectra of each blood component comprised in the standard blood samples.
- predetermined control limits for the reported blood parameter values are printed on a sheet of paper following a set of QC samples.
- the operator may compare blood parameter values reported by the oximeter with the predetermined control limits on the paper sheet, and determine whether the reported values are within the control limits.
- the predetermined control limits may also be stored in a label of the QC sample which label is read by the oximeter so that the oximeter is adapted to perform the comparison between the reported blood parameter values and the corresponding control limits.
- a method for repressing absorption spectra of interfering components or substances in a fluid sample is also provided.
- an interfering component in a sample is a component other than the preselected components for which the spectrophotometer is adapted to report parameter values, and the presence of said interfering component in the sample may interfere with the absorption spectrum of at least one of said preselected components.
- the absorbance A m ( ⁇ ) recorded at each wavelength ⁇ contains contributions from each of the components in the sample including said interfering components.
- the magnitude of the contribution and thereby the concentration of each component in the sample is determined according to equation (17) or equation (18) below
- C y K y ⁇ • A m ⁇
- the vectors K y ( ⁇ ) may be determined mathematically by using methods, such as multivariate data analysis, or solving n equations with n unknowns from data obtained from reference samples. By including one or several interfering components or substances in the reference sample, of which the reference spectrum is determined, one or several of the vectors K y ( ⁇ ) corresponding to one or several of the interfering components may be determined.
- the vector or vectors K y ( ⁇ ) corresponding to the interfering components are generally designated K int ( ⁇ ) and stored in the memory of the spectrophotometer together with the vectors K y ( ⁇ ).
- the spectrophotometer may further provide one or several predetermined vectors, A int ( ⁇ ), representing spectral information of the interfering components.
- a int ( ⁇ ) is obtained at a reference concentration c ref , whereby the spectrum of any interfering component may be derived at the determined concentration of the component according to Lambert-Beer's law, equation (1).
- the effect of the interfering components on determined blood parameter values is minimised by following a three stage process, in the following denoted "repression of spectra of interfering components".
- First stage is to determine the concentration of interfering components in the sample.
- Second stage is to determine a modified spectrum of the sample by subtracting the spectrum of the interfering component of the determined concentration from the measured spectrum A m ( ⁇ ) of the sample.
- Third stage is to determine concentrations of blood components c y and parameter values of blood components from the modified spectrum.
- the measured spectrum is only modified if the determined concentration of the interfering component is above a predetermined threshold value. This is because the modification of the measured spectrum creates some undesired "process noise" in the modified spectrum, due to an uncertainty in the estimate of the spectrum of the interfering component. This addition of "process noise" in the modified spectrum is only justified when the concentration of the interfering component in the sample is larger than the threshold value.
- An oximeter for blood analysis may provide several predetermined vectors for interfering components or substances of clinical importance and provide corresponding values of the vectors K int ( ⁇ ) in the memory.
- the interfering components may be chosen among components, which have previously caused significant interference in oximetry measurements, such as Fetal Hemoglobin, Bilirubin, Cardio Green, Evans Blue, Methylene Blue, Intralipid, HiCN, SHb, etc. By repressing the spectra of these components an oximeter with better precision in measurement of blood parameter values than currently available instruments is provided.
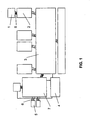
- Fig. 1 is a block diagram comprising a spectrometer 1 in an oximetry module (not shown) connected to a printed circuit board 2 with a data cable 6 comprising electrical conductors.
- the printed circuit board 2 controls and collects data from the spectrometer 1.
- the data collected are transmitted to a data processing unit 3 comprising a memory (not shown) and a processor (not shown). Values of predetermined coefficient vectors C 1 ( ⁇ ), C 2 ( ⁇ ) and C ⁇ ( ⁇ ) are stored in the memory.
- a barcode reader 5 is adapted to read data from bar-code labels mounted on QC samples or on a paper sheet enclosed with a set of samples, and transmits data to the data processing unit 3 via a data management computer 7.
- a power supply module 4 supplies power to the oximetry module from a mains connection.
- Fig. 2 is a schematic diagram of a wet section of an oximeter according to the invention, wherein a blood sample (not shown) is entered into the oximeter through an inlet probe 20. The sample is transferred to a cuvette 74. A preheater 15 is positioned along the sample path 30 to heat the sample to a substantially constant temperature of 37 °C. Pumps 10 are used to pump liquids and gasses through the wet section.
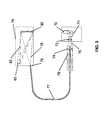
- Fig. 3 shows the main components of the spectrometer 1, wherein a light beam 75 with constant intensity is transmitted from a halogen lamp 70 to the cuvette 74 which comprises the blood or QC sample and is included in a hemolyzer 79.
- the blood sample is hemolyzed by means of ultrasonic waves. Hemolyzing is a process, which ruptures the walls of the red blood cells in the sample, thereby making the blood cells release their content of hemoglobin.
- the light beam 75 is transmitted to the cuvette 74 through an infrared filter 71, and a biconvex lens 72. After passing through the cuvette 74, the light beam 75 is transmitted to a measurement section 76, by means of an optical fibre 77.
- the light beam 75 passes through a thin slit 78, whereby the beam 75 is directed towards a concave grating unit 80, diffracting the light beam 75 according to wavelength.
- the concave grating unit 80 focuses light on a photodiode array 83, to which a diffracted light beam 82 is transmitted.
- the photodiode array 83 may consist of 128 photodiodes, and the array 83 is arranged in such a manner that light comprising a range of wavelengths of approximately 1.5 nm in the diffracted light beam 82, strikes a photodicde (not shown), which converts the light into a current substantially proportional to the light intensity which strikes it.
- a discrete intensity spectrum of the light beam 82 after transmission through the sample is produced. From this intensity spectrum an absorption spectrum of the blood sample comprised in the cuvette 74 may be determined by the oximeter.
- the absorption spectrum is measured in 128 channels located in the wavelength range 478-672 nm in the preferred embodiment of the invention.
- a channel is, in the present context, the part of the spectrum which is transmitted to a particular photodiode in the diode array 83.
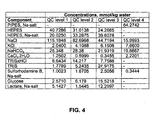
- a wavelength shift of the oximeter is determined in the quality control procedure. It is preferred that four different types of quality control samples (QC samples levels 1-4) are provided, cf. Fig. 4 .
- the QC levels comprise Sulforhodamine B in different concentrations. Increased reliability in the quality control of the oximeter is provided by measuring the absorption spectrum of QC samples at several QC levels. By utilising QC samples comprising Sulforhodamine B in different concentrations, it is ensured that the oximeter measures blood parameters correctly over a wide range of component concentrations in blood samples.
- Sulforhodamine B shows long term stability.
- the steep absorbance flank allows an accurate determination of the wavelength shift of the oximeter, since even very small wavelength shifts produce a large change in the measured absorbance at a given wavelength of a Sulforhodamine B containing sample.
- Sulforhodamine B is a dye with two components in a chemical equilibrium where the ratio between the concentration of each component in the dye varies with the total concentration of the dye. In this case the shape of the absorption spectrum is dependent on the total concentration c 1 of the dye.
- Fig. 5 shows three absorption spectra A 01 ( ⁇ ) 110, A 02 ( ⁇ ) 111 and A 03 ( ⁇ ) 112 of Sulforhodamine B samples determined at the total concentrations 2.5058 mmol/kg, 1.6705 mmol/kg and 1.0023 mmol/kg, respectively.
- the Sulforhodamine B samples correspond to QC levels 1-3 as shown in Fig. 4 .
- two model spectra A 1 ( ⁇ ) 105 and A 2 ( ⁇ ) 106 as shown in Fig. 6 may be derived from at least two reference spectra, e.g. A 01 ( ⁇ ) 110 and A 02 ( ⁇ ) 111 of Fig. 5 , wherein the two model spectra represent spectral information about a first and a second component, respectively of Sulforhodamine B, in such a way that the spectrum of the dye can be calculated as a weighted sum of A 1 ( ⁇ ) and A 2 ( ⁇ ).
- the two model spectra are, preferably, determined by Principal Component Analysis (PCA), whereby two orthogonal vectors are determined constituting the mathematical model spectra, A 1 ( ⁇ ) and A 2 ( ⁇ ).
- PCA Principal Component Analysis
- a set of scores or parameters s i1 and s i2 is also provided by the PCA analysis for each concentration of the dye, as the spectrum of the dye at a concentration c i can be calculated as a weighted sum of model spectra A 1 ( ⁇ ) and A 2 ( ⁇ ) and their corresponding scores or weights s i1 and s i2 .
- the PCA analysis may be provided by several computer programs, which are commercially available.
- the program used in the present embodiment is the "Unscrambler".
- the two model spectra A 1 ( ⁇ ) 105 and A 2 ( ⁇ ) 106 shown in Fig. 6 are determined by PCA from the three reference spectra A 01 ( ⁇ ), A 02 ( ⁇ ) and A 03 ( ⁇ ) with "Unscrambler".
- the reference concentrations of the dye in the solution at which the reference absorption spectra A 01 ( ⁇ ), A 02 ( ⁇ ) and A 03 ( ⁇ ) are measured are determined from the weight of the dye, Sulforhodamine B in powder form and the volume of the solvent.
- the reference absorption spectra are determined by measuring the absorption spectra of 5 samples containing Sulforhodamine B at each reference concentration, and determining an average value for the reference spectrum for each concentration.
- the reference absorption spectra of the samples are measured by a reference oximeter, which by definition has a zero wavelength shift.
- an oximeter not specifically appointed and handled as a reference oximeter will always exhibit some wavelength shift ⁇ whereby a measured absorption spectrum A m ( ⁇ ) of a sample will differ slightly from the reference spectrum A 0 ( ⁇ ) of the same sample measured on the reference oximeter.
- the relationship between the measured spectrum A m ( ⁇ ) and a reference spectrum A 0 ( ⁇ ) and the model spectra is for small wavelength shifts according to equation (9)
- a m ⁇ s 1 ⁇ A 1 ⁇ + s 2 ⁇ A 2 ⁇ + ⁇ A 0 ⁇ ⁇ ⁇
- ⁇ A 0 '( ⁇ ) is the first term in a Taylor series of the reference spectrum A 0 ( ⁇ ).
- the first derivative of the reference spectrum A 0 '( ⁇ ) is preferably calculated in approximation as a first derivative of the model spectrum A 1 ' ( ⁇ ).
- Coefficient vectors C 1 ( ⁇ ), C 2 ( ⁇ ) and C ⁇ ( ⁇ ) are, preferably, determined by multivariate analysis from the scores and the corresponding determined absorption spectra.
- the multivariate analysis starts by generating a table with 64 rows and 4 columns.
- the first three columns in this table comprise selected values of either one of the scores ⁇ i s i1 , s i1 , s i2 , and the last column comprises the corresponding calculated value of the spectrum A mi ( ⁇ ).
- Each row constitutes a calibration vector, and the entire table constitutes 64 calibration vectors.
- a 2 ( ⁇ j ) denotes the summation of squared absorbances across 128 wavelengths of the particular spectrum that corresponds to a particular score; i.e. the values of the score s i1 are evenly distributed between 0 and reciprocal of (square root( A 1 2 ( ⁇ )).
- equation (28) may be checked by inserting scores s i1 , s i2 from reference solutions with total concentrations c i of Sulforhodamine B not used in the determination of a and b. Thereby, the validity of equation (28) has been confirmed experimentally.
- ⁇ s 1 C ⁇ ⁇ • A m ⁇ wherein A m ( ⁇ ) is a QC/reference sample.
- Determined s 1 , s 2 scores may be interpreted as the equivalent concentrations of the first and the second component of the dye, respectively.
- the first component corresponds to the mathematical model spectrum A 1 ( ⁇ )
- the second component corresponds to the mathematical model spectrum A 2 ( ⁇ ).
- the determined coefficient vectors C A1 ( ⁇ ), C 1 ( ⁇ ) and C 2 ( ⁇ ) are stored in a matrix in the memory of the oximeter at the time of manufacture.
- the determined constants a, b are also stored in the memory of the oximeter at the time of manufacture.
- QC samples are, preferably, manufactured in lots, which may comprise 40,000-50,000 samples.
- the lot values of c qc , Q ref and ⁇ qc are, preferably, determined during manufacturing by measuring 5-10 samples on 3 reference oximeters. The oximeters have been adjusted to report exact parameter values on a standard blood sample.
- Average values of each of the measured parameters c qc , Q ref and ⁇ qc are calculated and preferably stored on a bar-code label attached to each of the QC samples.
- valves of c qc , Q ref and ⁇ qc are read from the bar-code label of the QC sample by a bar-code reader and stored in the memory of the oximeter.
- the ratio between s 1 and s 2 is determined and denoted Q est .
- the value of the wavelength shift of the oximeter is determined by dividing the score ⁇ s 1 with s 1 .
- ⁇ C ⁇ ⁇ • A m ⁇ s 1
- the length of the cuvette light path d 0 in the oximeter is, preferably, determined by measuring an absorption spectrum A m ( ⁇ ) of a Sulforhodamine B reference solution.
- concentration of Sulforhodamine B, c ref is, preferably, provided as an assigned value.
- the absorption spectrum A m ( ⁇ ) of the reference solution is measured, and an estimate of the concentration c est of the dye is calculated by the processor in the oximeter according to equations (27), (14), (15) by utilising predetermined coefficient vectors C ⁇ ( ⁇ ), C 1 ( ⁇ ) and C 2 ( ⁇ ) and constants a, b stored in the memory of the oximeter as previously described.
- the calculated value of d 0 is subsequently stored in the memory of the oximeter.
- the absorbance A( ⁇ ) of a fluid sample is measured by the oximeter by determining the logarithm of a light intensity I 0 transmitted through a transparent aqueous reference solution divided by the light intensity I transmitted through the fluid sample in question, according to equation (2)
- a ⁇ log ⁇ I 0 I .
- I 0 is denoted the zero point intensity, and is measured automatically at every calibration of the oximeter with said reference solution.
- a determined value of c est may be compared with the corresponding value c qc read from the label of the QC sample.
- the cuvette light path length d in the oximeter is different from the d 0 value stored in the memory of the oximeter, which causes a higher or a lower value of the measured absorbance, or the measured concentration c est of the dye deviates from the value of c qc .
- the determined concentration c est may deviate from the value of c qc due to errors in the wet section of the oximeter, such as defect tubes, defect pumps, errors in the cuvette, etc. It may all lead to undesired dilution of the sample. However c est may also be different from c qc due to an incorrect light path length d 0 of the cuvette.
- the difference between the estimated concentration and the reference concentration values may be caused by a difference between the light path length d 0 of the cuvette as calculated during calibration and the reference value d ref of the length determined during manufacture.
- the sample may be diluted.
- a dilution causes the concentration of the dye to be smaller than c ref and further causes a shift in the chemical equilibrium between the components s 1 and s 2 which causes the value of Q est to deviate from Q ref .
- the determined differences between measured parameters ⁇ , c est , and Q est and the corresponding parameters read from the bar-code label of the QC sample may be reported by the oximeter to the operator e.g. by means of a printer.
- a printed message may comprise information as to which of the measured parameters caused the QC sample to fail the quality control. Together with a printout of the failing parameter a message suggesting which part of the oximeter needs repair or service, may be included. For example, the printed message may recommend a repair of the measurement section 76 of the spectrometer 1, if the measured wavelength shift ⁇ is larger than a predetermined threshold value stored in the memory of the oximeter.
- the measured parameters of the QC sample are used to modify spectra of standard blood samples corresponding to either of the QC levels 1-4.
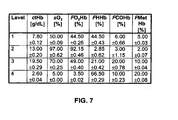
- Fig. 7 the figures in columns 2-7 of each row define a standard blood sample composition, and column 1 shows the related QC level.
- a corresponding standard blood spectrum as shown in Fig. 8 may be derived mathematically by the processor in the oximeter from predetermined spectra of each blood component comprised in the standard blood samples.
- the predetermined spectra of each blood component are, preferably, stored in the memory of the oximeter during manufacture.
- Each blood component parameter value in the table in Fig. 7 has an attached plus/minus limit value.
- the limit values are calculated errors, which would be produced by a measurement of parameter values in the standard blood sample with an oximeter having a wavelength shift of plus and minus 0.05 nm, respectively, as the only measurement error.
- the value of blood component F COHb in a level 1 sample would be measured to 5.34 % or 6.66 % instead of the correct value of 6.00 %.
- Even very small wavelength shifts in the oximeter introduces significant errors in the measured blood parameter values, thereby illustrating the importance of quality controlling the oximeter for wavelength shifts.
- the oximeter may use the modified spectrum to calculate corresponding blood parameter values.
- the parameter values are reported to the operator of the oximeter, and the operator may compare them with assigned control limits for the actual QC level.
- the effect of the instument errors revealed in the QC procedure on values reported for a blood sample with unknown blood parameter values may, e.g., appear from the deviations between the reported parameter values and the values of the relevant standard blood sample of Fig. 7 .
- Fig. 8 shows absorption spectra for each of standard blood sample, which absorption spectra are used in the oximeter for quality control levels 1-4.
- the spectra corresponding to levels 1-4 are 120, 121, 122, 123, respectively.
- Each spectrum has a corresponding c ref value corresponding to a Sulforhodamine B concentration.
- the above modification to the standard blood spectra shown in Fig. 8 resulting from the parameter ⁇ is a shift along the wavelength axis corresponding to the difference between ⁇ and ⁇ qc , ⁇ qc being either an assigned value or a predetermined fixed value stored in the memory of the oximeter.
- the modification of the standard blood spectra resulting from the parameter c est is a modification of the individual absorbances with the ratio c est /c ref .
- the relation between blood parameters that failed the quality control by being outside their corresponding control limits and the measured values of parameters ⁇ , c est , and Q est and thereby an error diagnosis of the oximeter may, preferably, be comprised in a service manual for a repair technician.
- a method for repressing absorption spectra of one or several interfering components or substances contained in a blood sample in the oximeter.
- the oximeter is adapted to repress the spectrum of Fetal Hemoglobin, which is known to cause significant interference in oximetry measurements.
- the vectors K y ( ⁇ ) are predetermined and stored in the memory of the spectrophotometer.
- a vector K fetal ( ⁇ ) corresponding to the concentration of Fetal Hemoglobin in the sample is determined.
- the oximeter further provides a predetermined vector A fetal ( ⁇ ), representing the difference spectrum between Adult Hemoglobin and Fetal Hemoglobin.
- the vector A fetal ( ⁇ ) is, preferably, determined at a reference concentration c fetal of 1 mmol/L.
- the second stage comprises the determination of a modified spectrum by subtracting the difference spectrum at the determined concentration from the measured spectrum A m ( ⁇ ) of the blood sample, if c fetal is greater than a predetermined threshold value, according to aquation (20)
- a mod ⁇ A m ⁇ - c total 1 ⁇ A total ⁇
- the modified spectrum is set equal to the measured spectrum A m ( ⁇ ).
- the third stage comprises the determination of concentrations of blood components c y from the modified spectrum A mod ( ⁇ ), whereby the effect of Fetal Hemoglobin in the blood sample on determined concentrations c y of blood components is minimised.
- an oximeter By repressing the spectrum of Fetal Hemoglobin automatically, an oximeter is provided with an increased precision in measured blood parameter values, and an easier operation than currently available instruments.
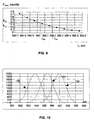
- Fig. 9 is a graph of a variable F neon plotted against the wavelength of light striking two photodiodes in wavelength channels 70 and 71 of the photodiode array 83 in the spectrometer 1 shown in Fig. 3 .
- the spectrometer 1 comprises a neon glow lamp (not shown), which emits at least one spectral line at a highly accurate reference wavelength of 585.25 nm, suitably positioned within the preferred wavelength range from 480 to 670 nm.
- the accurate wavelength of the emitted spectral line is used in the oximeter as a reference wavelength against which the location of the 128 wavelength channels of the array 83 is adjusted.
- F neon R 70 / R 71 wherein R(70) and R(71) are the magnitudes of the current or the response in each of the photodiodes located in channels 70 and 71.
- F neon is used as a variable that defines the position of the light of the reference wavelength emitted from the neon lamp relative to the wavelength channels in the spectrometer 1. This characteristic of F neon is utilised during field operation of the oximeter, where the value of F neon is measured at predetermined time intervals, and compared with a reference value F cal stored in the memory of the oximeter during manufacture.
- the spectrometer 1 is scanned with light emitted from a high precision monochromator in the wavelength range 585.25 +/- 7.5 nm during manufacture.
- a response curve for the photodiode located in channel 71 is measured.
- An example of a measured response curve is 131 shown in Fig. 10 .
- a calibration algorithm comprised in the memory of the oximeter calculates a corresponding response curve for channel 70 by shifting the wavelength axis.
- the calibration algorithm further calculates a wavelength calibration table comprising values of the variable F neon and the corresponding value of the wavelength of light emitted from the monochromator by using the determined response curves of channels 70 and 71.
- the oximeter stores determined values of the wavelength calibration table in the memory.
- a reference value of F neon denoted F cal
- the reference value of F cal is stored in the memory of the oximeter.
- the data comprised in the wavelength calibration table may be displayed graphically as shown in Fig. 9 .
- a calibration program measures the current temperature of the spectrometer 1 between two blood sample measurements in normal operation of the oximeter.
- the cuvette is always cleaned with a transparent rinse solution between two blood sample measurements.
- the current measured temperature of the spectrometer 1 is compared with a previous temperature measurement which was performed at the time of the previous neon lamp activation and stored in the memory of the oximeter.
- the calibration program determines whether the current temperature value deviates more than 0.3 °C from the previous temperature value, and performs a measurement of the current value of F neon if this is the case.
- the graph in Fig. 9 is now used to illustrate how a wavelength shift of the oximeter is determined and compensated during a period of time between two blood sample measurements, wherein the cuvette is rinsed.
- a first value of F neon denoted F cal corresponding to a first value of the wavelength denoted ⁇ cal are shown in the graph, and the value of F cal is determined, as previously described.
- a second value of the variable F neon denoted F act may be measured by the oximeter between two blood sample measurements.
- a second value of wavelength ⁇ denoted ⁇ act corresponding to F act may be determined.
- the value of ⁇ act may be determined from the discrete values of the variable ⁇ comprised in the calibration table according to well-known mathematical interpolation methods such as linear interpolation, polynomial interpolation, cubic spline interpolation, etc.
- a wavelength shift ⁇ of the spectrometer may be determined from the difference between the determined value ⁇ act and the calibration value ⁇ cal .
- the determined wavelength shift ⁇ of the spectrometer 1 may be utilised to compensate a measured absorption spectrum A m ( ⁇ ) of a fluid sample by determining a modified absorption spectrum A modi ( ⁇ ) of the sample, wherein the effect of the determined wavelength shift ⁇ on absorbances in the measured spectrum A m ( ⁇ ) is removed.
- the modified spectrum is, preferably, determined by first utilising a cubic spline function to generate interpolated absorbance values between the discrete values at the 128 wavelengths in the measured spectrum A m ( ⁇ ).
- the modified spectrum A modi ( ⁇ ) is determined by shifting the wavelength of each measured absorbance value in A m ( ⁇ ) sequentially with an amount equal to ⁇ and determine a corresponding interpolated absorbance value for the modified spectrum.
- a spectral lamp preferably a neon lamp, having at least one spectral line within a desired wavelength range enables the oximeter to perform highly accurate measurements of the wavelengths of light absorbed by a sample by comparing the determined wavelength of said at least one spectral line with the assigned wavelength of the spectral line stored in the memory of the oximeter, calculating the possible wavelength shift, and compensating the determined absorbance of the sample for said wavelength shift. Accordingly, the determined absorption spectrum by the spectrometer 1 is being compensated for wavelength shifts resulting from manufacturing tolerances and temperature drift during the use of the oximeter, thereby providing accurate measurements of blood parameter values.
- Fig. 10 shows three response curves 130, 131 and 132 of photodiodes located in the corresponding wavelength channels 70, 71 and 72.
- the x-axis of the graph is the wavelength in nm of the light striking the diodes, and the y-axis of the graph is counts.
- the wavelength distance between the peak points of e.g. response curve 130, 131 is approximately 1.5 nm, which is the channel distance between all the 128 adjacent wavelength channels of the diode array 13.
Landscapes
- Physics & Mathematics (AREA)
- Spectroscopy & Molecular Physics (AREA)
- General Physics & Mathematics (AREA)
- Engineering & Computer Science (AREA)
- Mathematical Physics (AREA)
- Theoretical Computer Science (AREA)
- Health & Medical Sciences (AREA)
- Life Sciences & Earth Sciences (AREA)
- Chemical & Material Sciences (AREA)
- Analytical Chemistry (AREA)
- Biochemistry (AREA)
- General Health & Medical Sciences (AREA)
- Immunology (AREA)
- Pathology (AREA)
- Investigating Or Analysing Materials By Optical Means (AREA)
- Spectrometry And Color Measurement (AREA)
Abstract
Description
- The present invention relates to a method in quality control of a spectrophotometer for monitoring performance of the spectrophotometer, such as an oximeter for measurement of blood parameters.
- Spectrophotometers for measuring the composition of a substance by absorption spectroscopy are well known. For example, oximeters are used to determine concentrations of various hemoglobin components or fractions in blood samples from measuring an absorption spectrum in the visible and/or infrared wavelength range. Such an oximeter is disclosed in
EP 210417 - In absorption spectroscopy, determination of a spectrum of a fluid sample is performed by transmission of light through a cuvette containing a part of the sample.
- Absorption spectroscopy is based on Lambert-Beer's law According to which the absorbance determined for a sample containing a single optically active component (a dye) is directly proportional to the concentration of the component and the length of the light path through the sample in the cuvette:

in which
A(λ) is the determined absorbance at wavelength λ,
ε(λ) is the molar extinction coefficient for the component at wavelength λ,
c is the molar concentration of the component, and
d is the length of the light path through the cuvette holding the sample. - The absorbance A(λ) of the sample is defined as the logarithm of the ratio of the light intensity before and after transmission through the sample. In practice the absorbance A(λ) is defined as the logarithm of the ratio between the light intensity, I0, transmitted through a transparent aqueous reference solution and the light intensity transmitted through the sample:

- For samples containing more than one optically active component, the total absorbance Atotal is the sum of the individual components' absorbances since absorbance is an additive quantity. Thus, with Y optically active components in a sample the total absorbance is given by

- in a sample spectrum, the absorption Atotal(λ) recorded at each wavelength λ contains contributions from each of the components in the sample. The magnitude of this contribution and thereby the concentration of each component in the sample is determined according to

in which
J is the total number of wavelengths λj at which absorption is determined by the spectrophotometer and Ky(λj) is a constant specific for component y at wavelength λj. - The vectors Ky (λ) may be determined mathematically by using methods such as multivariate analysis, or solving n equations with n unknowns, on data from reference samples.
- It is also known to monitor performance of spectrophotometers, such as oximeters, by a measuring the absorption spectrum of a fluid quality control sample, QC sample, with the spectrophotometer in question.
- Known quality control samples specific for blood analysis are typically red dye based samples designed to simulate the spectrum of blood. In addition to a red dye, they sometimes contain certain amounts of oxygen, carbon dioxide, and electrolytes at an established pH for determining performance of blood gas and electrolyte instruments. Synthetic QC samples having an absorption spectrum that closely mimics that of physiological blood have not yet been provided.
- Quality control of spectrophotometers, such as an oximeter, is typically performed by measuring the absorption spectrum of a QC sample comprising three to four different dyes. The dyes are mixed in a proportion so that the QC sample absorption spectrum timics the absorption spectrum of blood. A spectrum of a QC sample is measured on the oximeter to be monitered and the parameter values determined by the oximeter are compared with predetermined control limits assigned to the QC sample by a qualified person. If the determined parameters are outside the corresponding control limits, servicing of the oximeter is required.
- In
WO 96/30742 - It is an important disadvantage of known quality control methods that, typically, known QC samples comprise 3-4 different dyes, causing long-term stability of the sample to be less than desired. To compensate for this, parameter value acceptance ranges in an oximeter may be widened leading to a more relaxed performance monitoring than desired.
- It is another important disadvantage of known quality control methods that it is impossible with known quality control methods to distinguish between different types of instrument errors and to determine an individual contribution to deviation in parameter values from a specific type of instrument error. Thus, parameter value acceptance ranges have to be sufficiently wide to accommodate any possible type of instrument error. Further, a quality controlled spectrophotometer cannot be diagnosed if the determined parameter values lie outside the acceptable ranges. For example, a defect spectrophotometer with a wavelength shift may introduce the same deviation in the determined parameters as seen by dilution of the QC sample.
- Future spectrophotometers are expected to facilitate determination of absorption spectra with improved resolution whereby instruments of higher precision and specificity are provided. High resolution measurements of spectra makes it more difficult to develop a suitable QC sample since precision and long term stability requirements are increased.
- One of the most significant errors occurring in spectrophotometers is a wavelength shift. Due to manufacturing tolerances and drift during use, each spectrophotometer positions a determined spectrum slightly differently along the wavelength axis. Therefore the wavelengths at which absorbance is determined are also positioned slightly differently for different spectrophotometers and thus, determined absorbances will vary for different spectrophotometers.
- It is an object of the present invention to provide a quality control methods that facilitates the determination of various types of spectrophotometers errors, whereby an accurate diagnosis of an instrument failing the QC test is provided.
- An instrument error affects the spectrum of a sample, and specific types of instrument errors affect the spectrum in a distinct way that may be interpreted like the presence of a component in the sample in a different concentration. For example, a variation of the length d of the light path through the cuvette causes determined absorbances A(λ) to vary according to Lambert-Beer's law (absorbance is proportional to d), and unintentional dilution of the sample in the cuvette affects the determined absorbance in the same way, etc.
- An absorption spectrum of a sample may be defined by a vector Am(λ) comprising at least two elements, each of the elements representing an absorbance of the sample at a specific wavelength λj.
- According to a first aspect of the invention a quality control method for a spectrophotometer as defined in
claim 1 is provided, comprising the steps of: - determining with the spectrophotometer an absorption spectrum Am (λ) of a fluid quality control sample contraining a dye selected from such dyes which provide the quality control sample with an absorption spectrum with a significant absorbance peak showing a steep flank, and
- determining a wavelength shift Δλ between the absorption spectrum Am (λ) of the actually measured quality control sample and a reference absorption spectrum A0 (λ) of a reference quality control sample containing the dye stored in a memory of the spectrophotometer.
- The method is provided, wherein the wavelength shift Δλ is determined from Am (λ) and a predetermined mathematical parameter CΔλ(λ) stored in the memory of the spectrophotometer, wherein the vector cΔλ(λ) fulfils the equation

- The wavelength shift Δλ is determine after normalisation of the determined spectrum Am (λ) with an estimate of the concentration of the dye.
- In the method according to the invention c Δλ(λ) has been determined from a combination of a reference spectrum A0 (λ) of a reference sample containing the dye and a first derivative A0 '(λ) of the reference spectrum.
- In an approximation, only the first order derivative of the reference spectrum is considered:

in which A0(λ) is the reference spectrum, A0 '(λ) is its first derivative with respect to the wavelength λ, Δλ is the wavelength shift to be determined, and Am (λ) is a spectrum of the sample with the known spectrum A0 (λ) measured by the spectrophotometer in which the wavelength shift is to be determined.
Δλ may be determined according to various mathematical methods known in the art, e.g. the equation above may be solved for a selected wavelength, the equation may be solved for a set of selected wavelengths and Δλ be calculated as an average of the solutions for Δλ to the equation may be determined by a least squares fit, Δλ may be determined by multivariate analysis, etc. - The step of determining the mathematical parameter comprises the steps of
calculating a set of calibration vectors Bi (λ) according to
in which i = 1, 2,..., N (N>1) and si and si3 are constants of selected values,
determining a coefficient vector c Δλ(λ) constituting the mathematical parameter so that each set of corresponding values s13, Bi satisfies:
- According to a second aspect of the invention a spectrophotometer as defined in claim 8 is provided comprising a processor that is adapted to determined the wavelength shift Δλ between an absorption spectrum Am (λ) determined with the spectrophotometer on a fluid quality control sample containing a dye selected from such dyes which provide the quality control sample with an absorption spectrum with a significant absorbance peak showing a steep flank and a reference absorption spectrum A0 (λ) of a reference quality control sample containing the dye, stored in the memory of the spectrophotometer.
- The spectrophotometer is provided comprising
a memory with a mathematical parameter for the determination of a wavelength shift Δλ of the spectrophotometer, and
a processor that is connected to the memory and that is adapted to calculate the wavelength shift Δλ from the mathematical parameter and from a spectrum Am (λ) determined with the spectrophotometer on a fluid QC sample containing a dye. - The mathematical parameter is a coefficient vector c Δλ(λ) and wherein the wavelength shift Δλ is determined from

- The mathematical parameter as mentioned above may comprise the first reference spectrum A0 (λ) and the first derivative A0 '(λ) of the first reference spectrum A0 (λ) at a selected wavelength λ0 or at a selected set of wavelengths λ0, λ1,..., λL, etc., or a parameter derived from the spectra, such as the parameter C Δλ(λ).
- Since the parameter Δλ is proportional to a total concentration cqc of the dye, Δλ is normalised with cqc or an approximation to cqc, e.g. when the dye is a two-component dye, such as Sulforhodamine B, Δλ is preferably normalised with a concentration of a first component of the dye s1. The normalisation of Δλ with s1 is desirable when there is a difference between the concentration of the dye in a reference sample from which the reference spectrum was determined, and the concentration of the dye in the QC sample.
- Thus, in the spectrophotometer according to the invention, the mathematical parameter stored in the memory constitutes a vector C Δλ(λ) from which the wavelength shift Δλ may be determined.
- According to a further preferred embodiment of the invention, the QC sample comprises a dye with two components in a chemical equilibrium where the ratio between the concentration of each component varies with the total concentration of the dye. In this case the shape of the absorption spectrum is dependent on the total concentration of the dye. This characteristic of the dye makes it possible to distinguish between a concentration measurement error caused by undesired dilution of the sample in the cuvette, and a measurement error caused by light path changes in the cuvette.
- Thus, the method of preparing a spectrophotometer for quality control is defined in
claim 2 and comprises determining a first reference spectrum A01 (λ) of a reference sample containing the dye in a first concentration and determining a second reference spectrum A02(λ) of a reference sample containing the dye in a second concentration with the reference spectrophotometer, the dye comprising a first component and a second component in chemical equilibrium. Mathematically two model spectra A1 (λ) and A2 (λ) that represent spectral information about the first and the second component, respectively, may be derived from the first and second reference spectra A 01(λ) and A02 (λ) in such a way that the spectra of the reference samples can be calculated as a weighted sum of A1 (λ) and A2 (λ). For example, A1 (λ) and A1 (λ) may be the individual spectra from the two components, respectively, of the dye, or, A1(λ) may be the sum of the individual spectra from the two components while A2 (λ) may be the difference between the individual spectra of the two components, etc. Preferably, A1 (λ) and A2 (λ) are determined from reference spectra A 01(λ) and A02 (λ) by Principal Components Analysis (PCA). - The spectrum Am (λ) determined by the spectrophotometer is then given by

- Each of the parameters s1, s2, and Δλ are determined by mathematical methods, such as multivariate analysis on data obtained from reference samples.
- In this embodiment of the invention, the step of determining a mathematical parameter comprises the steps of
calculating a set of vectors Bi (λ) from
in which i = 1, 2,..., N (M>1) and si1, si2 and si3 are constants of selected values,
determining a vector C Δλ(λ) constituting the mathematical parameter so that
- Further, the mathematical parameter may comprise a vector C1 (λ) fulfilling that

and still further, the mathematical parameter may also comprise a vector C2 (λ) fulfilling that
- According to a preferred embodiment of the invention, the method in quality control of a spectrophotometer may utilise a QC sample containing the dye in a known concentration cqc and comprising the first and second components, and may further comprise the steps of
calculating parameters s1 and s2 from

in which C1 (λ) and C2 (λ) are the predetermined vectors previously stored in the memory of the spectrophotometer, and
calculating an estimated concentration Cest of the dye from
in which a and b are predetermined constants previously stored in the memory of the spectrophotometer, and s1 and s2 represents concentrations of a first and a second component, respectively, of the dye. - Likewise, in a preferred embodiment of the invention the memory of the spectrophotometer may further comprise vectors C1 (λ) and C2 (λ) fulfilling the equations (14) and (15).
- The memory may also comprise predetermined constants a and b and the processor may be further adapted to calculate the concentration cest of the dye according to equation (16)

- It is preferred that the dye has a spectrum with a significant absorbance peak with a steep flank within the measurement range of the spectrophotometer in order to accurately determine small wavelength shifts. For example, when the sample to be analysed is blood, a wavelength shift of 0.05 nm is sufficient to cause an inaccurate determination of several blood parameters, such as ctHb, sO2, FO2Hb, FHHb, FOHb, FMetHb, etc.
- Further, it is preferred that the spectrum of the QC sample resembles spectra of samples, which the spectrophotometer in question is intended to analyse so that performance of the instrument can be monitored.
- For example, in blood analysis important blood components have significant absorbances in the wavelength range from 480 to 670 nm. Thus, a dye with a spectrum resembling a blood spectrum and having a significant absorbance peak in the range from 400 to 800 nm, preferably from 480 to 670 nm, and having a steep absorbance flank, such as a flank having steepness larger than 40 mAbs/nm, preferably larger than 50 mAbs/nm for a light path length of 100 µm, is preferred for use in the methods according to the present invention. The dye should, preferably, also have a molar extinction coefficient in the range from 10,000 to 100,000.
- The dye may belong to one of several chemical classes, such as cyanine dyes, azacyanine dyes, triarylmethine dyes, acridine dyes, azine dyes, oxazine dyes, thiazine dyes, xanthene dyes, etc. Dyes belonging to the first four classes are typically cationic dyes being water soluble due to the molecule's positive charge. The xanthene dyes include the cationic and neutral rhodamines and the anionic sulforhodamines among which Sulforhodamine B is a preferred dye.
- According to a preferred embodiment of the invention, the spectrum of reference samples containing the dye in at least two different concentrations is determined, e.g. by an accurate reference instrument of the same type as the spectrophotometer to be quality controlled, at a selected set of wavelengths. Then the coefficient vectors C1 (λ), C2 (λ) and C Δλ(λ) and the constants a and b are determined, e.g. by multivariate analysis, and stored at the time of manufacture in the memory of the spectrophotometers to be quality controlled by fluid QC samples when put into their normal use.
- On manufacture of a QC sample the concentration cqc, the ratio s2/s1 denoted Qref and an initial wavelength shift Δλqc may be determined by a reference spectrophotometer. The initial wavelength shift of the QC sample emerges mainly from a variation in the composition of the solvent of the dye in the QC sample.
- A label, such as a bar-code label, a magnetic label, etc, may be attached to each of the QC samples containing one or more of the values cqc, Qref and Δλqc in question. Alternatively one or more of the values may be printed in a bar code on a paper sheet following a set of QC samples. The values appearing on the labels or paper sheet are designated assigned values.
- During quality control of a specific spectrophotometer, the assigned values of cqc, Qref and Δλqc are read by the spectrophotometer and the values are stored in its memory. Then the spectrum of the QC sample is determined and s1, s2, and Δλ are determined as previously described. The determined values for Qest = s2/s1, Δλ and cest are also calculated and compared to the assigned values of Qref, Δλqc and cqc, respectively.
- A possible dilution of the QC sample may be determined from a difference between Qest and Qref, and the combined effect of dilution and deviations in length d of the light path through the cuvette may be determined from a difference between cest and cqc.
- The estimated parameter values, such as Δλ, cest, and Qest, may be used for determination of parameter values of samples, the analysis of which the spectrophotometer is intended for, so that the outcome of the quality control procedure can be reported by the instrument in quantities meaningful for an operator of the instrument.
- For example, in an oximeter for determination of blood parameter values, the theoretical modifications to one or several predetermined standard blood spectra caused by a measurement error corresponding to one of the parameters Δλ, cest, and Qest determined in the quality control procedure may be calculated by the oximeter. From the modified spectra, the oximeter may calculate corresponding blood parameter values to be reported to the operator of the instrument.
- The predetermined standard blood spectra may either be stored in the memory of the oximeter, or they may be derived mathematically by the processor in the oximeter from predetermined spectra of each blood component comprised in the standard blood samples.
- In a preferred embodiment of the invention predetermined control limits for the reported blood parameter values are printed on a sheet of paper following a set of QC samples. The operator may compare blood parameter values reported by the oximeter with the predetermined control limits on the paper sheet, and determine whether the reported values are within the control limits.
- The predetermined control limits may also be stored in a label of the QC sample which label is read by the oximeter so that the oximeter is adapted to perform the comparison between the reported blood parameter values and the corresponding control limits.
- In a preferred embodiment of the invention, a method for repressing absorption spectra of interfering components or substances in a fluid sample, is also provided.
- In the present context an interfering component in a sample is a component other than the preselected components for which the spectrophotometer is adapted to report parameter values, and the presence of said interfering component in the sample may interfere with the absorption spectrum of at least one of said preselected components.
- In a determined sample spectrum, the absorbance Am (λ) recorded at each wavelength λ contains contributions from each of the components in the sample including said interfering components. The magnitude of the contribution and thereby the concentration of each component in the sample is determined according to equation (17) or equation (18) below

or the equivalent form
- The vectors Ky (λ) may be determined mathematically by using methods, such as multivariate data analysis, or solving n equations with n unknowns from data obtained from reference samples. By including one or several interfering components or substances in the reference sample, of which the reference spectrum is determined, one or several of the vectors Ky (λ) corresponding to one or several of the interfering components may be determined. The vector or vectors Ky (λ) corresponding to the interfering components are generally designated Kint (λ) and stored in the memory of the spectrophotometer together with the vectors Ky (λ).
- The spectrophotometer may further provide one or several predetermined vectors, Aint (λ), representing spectral information of the interfering components. Each Aint (λ) is obtained at a reference concentration cref, whereby the spectrum of any interfering component may be derived at the determined concentration of the component according to Lambert-Beer's law, equation (1).
- In this preferred embodiment of the invention, the effect of the interfering components on determined blood parameter values is minimised by following a three stage process, in the following denoted "repression of spectra of interfering components".
- First stage is to determine the concentration of interfering components in the sample. Second stage is to determine a modified spectrum of the sample by subtracting the spectrum of the interfering component of the determined concentration from the measured spectrum Am (λ) of the sample. Third stage is to determine concentrations of blood components cy and parameter values of blood components from the modified spectrum.
- According to this preferred embodiment of the invention, a spectrophotometer with repression of spectra of interfering components in a fluid sample is provided, for determination of a concentration cy of a component y of a sample and wherein the memory further comprises at least one vector Aint (λ) representing spectral information of an interfering component in the sample at a concentration cref , and
at least one vector Kint (λ), and wherein
the processor is further adapted to
calculate the concentration cint of the interfering component according to
and if cint is greater than a predetermined threshold value, cref, modify the measured spectrum Amod (λ) according to
Amod (λ) being the modified spectrum, and
determine cy from the modified spectrum Amod (λ) according to
whereby the effect of interfering components on determined concentrations cy is minimised. - The measured spectrum is only modified if the determined concentration of the interfering component is above a predetermined threshold value. This is because the modification of the measured spectrum creates some undesired "process noise" in the modified spectrum, due to an uncertainty in the estimate of the spectrum of the interfering component. This addition of "process noise" in the modified spectrum is only justified when the concentration of the interfering component in the sample is larger than the threshold value.
- An oximeter for blood analysis may provide several predetermined vectors for interfering components or substances of clinical importance and provide corresponding values of the vectors Kint (λ) in the memory. The interfering components may be chosen among components, which have previously caused significant interference in oximetry measurements, such as Fetal Hemoglobin, Bilirubin, Cardio Green, Evans Blue, Methylene Blue, Intralipid, HiCN, SHb, etc. By repressing the spectra of these components an oximeter with better precision in measurement of blood parameter values than currently available instruments is provided.
- The invention will now be described with reference to the drawings, wherein
-
Fig. 1 is a block diagram of an oximeter according to the invention, -
Fig. 2 is a schematic diagram of a wet section of an oximeter according to the invention, -
Fig. 3 shows main components of a spectrometer, i.e. the optical part of an oximeter according to the invention, -
Fig. 4 shows compositions of QC samples levels 1-4. -
Fig. 5 shows absorption spectra of Sulforhodamine B in three concentrations, -
Fig. 6 shows two normalised model spectra determined with Principal Component Analysis from Sulforhodamine B, -
Fig. 7 is a table comprising parameter values of blood samples each related to one of QC sample levels 1-4, -
Fig. 8 shows absorption spectra of four standard blood samples related to quality control levels 1-4, -
Fig. 9 is a graph of a variable Fnoon plotted against the wavelength of light striking two photodiodes in the spectrometer, -
Fig. 10 shows response curves of photodiodes located inwavelength channels -
Fig. 1 is a block diagram comprising aspectrometer 1 in an oximetry module (not shown) connected to a printedcircuit board 2 with adata cable 6 comprising electrical conductors. The printedcircuit board 2 controls and collects data from thespectrometer 1. The data collected are transmitted to adata processing unit 3 comprising a memory (not shown) and a processor (not shown). Values of predetermined coefficient vectors C1 (λ), C2 (λ) and C Δλ(λ) are stored in the memory. Abarcode reader 5 is adapted to read data from bar-code labels mounted on QC samples or on a paper sheet enclosed with a set of samples, and transmits data to thedata processing unit 3 via adata management computer 7. Apower supply module 4 supplies power to the oximetry module from a mains connection. -
Fig. 2 is a schematic diagram of a wet section of an oximeter according to the invention, wherein a blood sample (not shown) is entered into the oximeter through aninlet probe 20. The sample is transferred to acuvette 74. Apreheater 15 is positioned along thesample path 30 to heat the sample to a substantially constant temperature of 37 °C. Pumps 10 are used to pump liquids and gasses through the wet section. -
Fig. 3 shows the main components of thespectrometer 1, wherein alight beam 75 with constant intensity is transmitted from ahalogen lamp 70 to thecuvette 74 which comprises the blood or QC sample and is included in ahemolyzer 79. The blood sample is hemolyzed by means of ultrasonic waves. Hemolyzing is a process, which ruptures the walls of the red blood cells in the sample, thereby making the blood cells release their content of hemoglobin. Thelight beam 75 is transmitted to thecuvette 74 through aninfrared filter 71, and abiconvex lens 72. After passing through thecuvette 74, thelight beam 75 is transmitted to ameasurement section 76, by means of anoptical fibre 77. Thelight beam 75 passes through athin slit 78, whereby thebeam 75 is directed towards a concavegrating unit 80, diffracting thelight beam 75 according to wavelength. - The concave
grating unit 80 focuses light on aphotodiode array 83, to which a diffractedlight beam 82 is transmitted. Thephotodiode array 83 may consist of 128 photodiodes, and thearray 83 is arranged in such a manner that light comprising a range of wavelengths of approximately 1.5 nm in the diffractedlight beam 82, strikes a photodicde (not shown), which converts the light into a current substantially proportional to the light intensity which strikes it. By measuring the value of the current in each of the 128 photodiodes of thephotodiode array 83, a discrete intensity spectrum of thelight beam 82 after transmission through the sample is produced. From this intensity spectrum an absorption spectrum of the blood sample comprised in thecuvette 74 may be determined by the oximeter. - The absorption spectrum is measured in 128 channels located in the wavelength range 478-672 nm in the preferred embodiment of the invention. A channel is, in the present context, the part of the spectrum which is transmitted to a particular photodiode in the
diode array 83. - According to the invention a wavelength shift of the oximeter is determined in the quality control procedure. It is preferred that four different types of quality control samples (QC samples levels 1-4) are provided, cf.
Fig. 4 . The QC levels comprise Sulforhodamine B in different concentrations. Increased reliability in the quality control of the oximeter is provided by measuring the absorption spectrum of QC samples at several QC levels. By utilising QC samples comprising Sulforhodamine B in different concentrations, it is ensured that the oximeter measures blood parameters correctly over a wide range of component concentrations in blood samples. - In solution Sulforhodamine B shows long term stability. The steep absorbance flank allows an accurate determination of the wavelength shift of the oximeter, since even very small wavelength shifts produce a large change in the measured absorbance at a given wavelength of a Sulforhodamine B containing sample.
- In aqueous solution Sulforhodamine B is a dye with two components in a chemical equilibrium where the ratio between the concentration of each component in the dye varies with the total concentration of the dye. In this case the shape of the absorption spectrum is dependent on the total concentration c1 of the dye. This may be seen in
Fig. 5 , which shows three absorption spectra A01 (λ) 110, A02 (λ) 111 and A03 (λ) 112 of Sulforhodamine B samples determined at the total concentrations 2.5058 mmol/kg, 1.6705 mmol/kg and 1.0023 mmol/kg, respectively. The Sulforhodamine B samples correspond to QC levels 1-3 as shown inFig. 4 . - Mathematically, two model spectra A1 (λ) 105 and A2 (λ) 106 as shown in
Fig. 6 may be derived from at least two reference spectra, e.g. A01 (λ) 110 and A02 (λ) 111 ofFig. 5 , wherein the two model spectra represent spectral information about a first and a second component, respectively of Sulforhodamine B, in such a way that the spectrum of the dye can be calculated as a weighted sum of A1 (λ) and A2 (λ). - The two model spectra are, preferably, determined by Principal Component Analysis (PCA), whereby two orthogonal vectors are determined constituting the mathematical model spectra, A1 (λ) and A2 (λ). A set of scores or parameters si1 and si2 is also provided by the PCA analysis for each concentration of the dye, as the spectrum of the dye at a concentration ci can be calculated as a weighted sum of model spectra A1 (λ) and A2 (λ) and their corresponding scores or weights si1 and si2.
- The PCA analysis may be provided by several computer programs, which are commercially available. The program used in the present embodiment is the "Unscrambler". The two model spectra A1 (λ) 105 and A2 (λ) 106 shown in
Fig. 6 are determined by PCA from the three reference spectra A01 (λ), A02 (λ) and A03 (λ) with "Unscrambler". - The reference concentrations of the dye in the solution at which the reference absorption spectra A01 (λ), A02 (λ) and A03 (λ) are measured, are determined from the weight of the dye, Sulforhodamine B in powder form and the volume of the solvent. The reference absorption spectra are determined by measuring the absorption spectra of 5 samples containing Sulforhodamine B at each reference concentration, and determining an average value for the reference spectrum for each concentration. The reference absorption spectra of the samples are measured by a reference oximeter, which by definition has a zero wavelength shift.
- In practice, an oximeter not specifically appointed and handled as a reference oximeter will always exhibit some wavelength shift Δλ whereby a measured absorption spectrum Am (λ) of a sample will differ slightly from the reference spectrum A0 (λ) of the same sample measured on the reference oximeter. The relationship between the measured spectrum Am (λ) and a reference spectrum A0 (λ) and the model spectra is for small wavelength shifts according to equation (9)

wherein Δλ A0 '(λ) is the first term in a Taylor series of the reference spectrum A0 (λ). - The first derivative of the reference spectrum A0 '(λ) is preferably calculated in approximation as a first derivative of the model spectrum A1 ' (λ). The approximation is justified since the values of the scores si1 for the model spectra A1 (λ) are found to be much higher than the values of the scores si2 for the model spectra A2(λ), of Sulforhodamine B in relevant concentrations ci, so that

whereby the measured spectrum Ami (λ) may be approximated by
Δλisi1, si1, si2 are the scores or the constants corresponding to a concentration ci. - Coefficient vectors C1 (λ), C2 (λ) and CΔλ (λ) are, preferably, determined by multivariate analysis from the scores and the corresponding determined absorption spectra.
- The multivariate analysis starts by generating a table with 64 rows and 4 columns. The first three columns in this table comprise selected values of either one of the scores Δλisi1, si1, si2, and the last column comprises the corresponding calculated value of the spectrum Ami (λ). Each row constitutes a calibration vector, and the entire table constitutes 64 calibration vectors.
- The 64 values of each score appearing in one and the same column are evenly distributed between:

wherein A2(λj) denotes the summation of squared absorbances across 128 wavelengths of the particular spectrum that corresponds to a particular score; i.e. the values of the score si1 are evenly distributed between 0 and reciprocal of (square root(A1 2 (λ)). - The next step in the multivariate analysis comprises to determine from the table the coefficient vector C1 (λ) by Principal Component Regression so that each set of scores sil, and the corresponding spectrum Ami (λ), satisfies

- From the table the coefficient vector C2 (λ) is determined by Principal Component Regression so that each set of scores si2 and the corresponding spectrum Ami (λ), satisfies

- From the table the coefficient vector C Δλ(λ) is determined by Principal Component Regression (PCR) so that each set of scores Δλisi1 and the corresponding spectra Ami (λ), satisfies

- Further, it is assumed that the following relation between the calculated scores and a total concentration, ci of the dye exists

wherein constants a and b may be found by several methods, preferably, by inserting the determined scores from the total concentrations, ci of the dye of concentrations 2.5058 mmol/kg and 1.0023 mmol/kg in equation (27) and solve the resulting two equations with two unknown quantities, for a and b. The determined values of a, b are: a=0.1425; b=0.0931, so that equation (27) is determined as
- The validity of equation (28) may be checked by inserting scores si1, si2 from reference solutions with total concentrations ci of Sulforhodamine B not used in the determination of a and b. Thereby, the validity of equation (28) has been confirmed experimentally.
- In field use of the spectrophotometer the coefficient vectors are applied as follows:
- From the coefficient vector, C1 (λ) a score or parameter value, s1 may be determined according to equation (14)

- From the coefficient vector, C2 (λ) a score or parameter value, s2 may be determined according to equation (15)

wherein Am (λ) is a measured spectrum of a QC/reference sample. - From the coefficient vector C Δλ(λ) a score or parameter value Δλs1, which is proportional to the wavelength shift may be determined according to

wherein Am (λ) is a QC/reference sample. - Determined s1, s2 scores may be interpreted as the equivalent concentrations of the first and the second component of the dye, respectively. The first component corresponds to the mathematical model spectrum A1 (λ), and the second component corresponds to the mathematical model spectrum A2 (λ).
- The determined coefficient vectors CA1 (λ), C1 (λ) and C2(λ) are stored in a matrix in the memory of the oximeter at the time of manufacture. The determined constants a, b are also stored in the memory of the oximeter at the time of manufacture.
- QC samples are, preferably, manufactured in lots, which may comprise 40,000-50,000 samples. The lot values of cqc, Qref and Δλqc are, preferably, determined during manufacturing by measuring 5-10 samples on 3 reference oximeters. The oximeters have been adjusted to report exact parameter values on a standard blood sample.
- Average values of each of the measured parameters cqc, Qref and Δλqc are calculated and preferably stored on a bar-code label attached to each of the QC samples.
- During a quality control procedure of an oximeter in normal operation, e.g. at a hospital, the valves of cqc, Qref and Δλqc are read from the bar-code label of the QC sample by a bar-code reader and stored in the memory of the oximeter.
- Then the absorption spectrum of the QC sample is determined. An estimated concentration of Sulforhodamine B in the QC sample may be determined by the measured absorption spectrum Am (λ) by equation (27) as

since the values of s1 and s2 can be determined by the measured absorption spectrum Am (λ) and the vectors C1(λ) and C2(λ) according to equations (14) and (15). The ratio between s1 and s2 is determined and denoted Qest. - An estimate of a score proportional to the wavelength shift of the oximeter is provided by equation (26)

- Since the value of s1 has been determined, the value of the wavelength shift of the oximeter is determined by dividing the score Δλ s1 with s1.

- The length of the cuvette light path d0 in the oximeter is, preferably, determined by measuring an absorption spectrum Am (λ) of a Sulforhodamine B reference solution. The concentration of Sulforhodamine B, cref, is, preferably, provided as an assigned value.
- To determine the value of d0, the absorption spectrum Am (λ) of the reference solution is measured, and an estimate of the concentration cest of the dye is calculated by the processor in the oximeter according to equations (27), (14), (15) by utilising predetermined coefficient vectors C Δλ(λ), C1 (λ) and C2 (λ) and constants a, b stored in the memory of the oximeter as previously described.
- The concentration cest of the reference solution determined by the oximeter is utilised to calculate an actual value of the cuvette light path length, d0, in the oximeter according to

wherein dref is a reference value of the cuvette light path length, which is previously stored in the memory of the oximeter. The calculated value of d0 is subsequently stored in the memory of the oximeter. - The difference between the value of Δλ determined for the Sulforhodamine B reference solution and the assigned value Δλref for the reference solution is utilised to shift the subsequently measured spectra along the wavelength axis.
- The absorbance A(λ) of a fluid sample is measured by the oximeter by determining the logarithm of a light intensity I0 transmitted through a transparent aqueous reference solution divided by the light intensity I transmitted through the fluid sample in question, according to equation (2)

- I0 is denoted the zero point intensity, and is measured automatically at every calibration of the oximeter with said reference solution.
- During a quality control of the oximeter, a determined value of cest may be compared with the corresponding value cqc read from the label of the QC sample. A difference between the values may originate from two of the variables in Lambert-Beer's law, equation (1)

- It applies that either the cuvette light path length d in the oximeter is different from the d0 value stored in the memory of the oximeter, which causes a higher or a lower value of the measured absorbance, or the measured concentration cest of the dye deviates from the value of cqc.
- The determined concentration cest may deviate from the value of cqc due to errors in the wet section of the oximeter, such as defect tubes, defect pumps, errors in the cuvette, etc. It may all lead to undesired dilution of the sample. However cest may also be different from cqc due to an incorrect light path length d0 of the cuvette.
- If there is a difference between cest and cqc, and the value of Qref being equal to Qest, the difference between the estimated concentration and the reference concentration values may be caused by a difference between the light path length d0 of the cuvette as calculated during calibration and the reference value dref of the length determined during manufacture.
- If there is a difference between cest and cqc, the value of Qref being different from Qest, the sample may be diluted. A dilution causes the concentration of the dye to be smaller than cref and further causes a shift in the chemical equilibrium between the components s1 and s2 which causes the value of Qest to deviate from Qref.
- The determined differences between measured parameters Δλ, cest, and Qest and the corresponding parameters read from the bar-code label of the QC sample may be reported by the oximeter to the operator e.g. by means of a printer. A printed message may comprise information as to which of the measured parameters caused the QC sample to fail the quality control. Together with a printout of the failing parameter a message suggesting which part of the oximeter needs repair or service, may be included. For example, the printed message may recommend a repair of the
measurement section 76 of thespectrometer 1, if the measured wavelength shift Δλ is larger than a predetermined threshold value stored in the memory of the oximeter. - In a preferred embodiment of the invention the measured parameters of the QC sample are used to modify spectra of standard blood samples corresponding to either of the QC levels 1-4.
- In
Fig. 7 the figures in columns 2-7 of each row define a standard blood sample composition, andcolumn 1 shows the related QC level. For each of the four standard blood samples a corresponding standard blood spectrum as shown inFig. 8 may be derived mathematically by the processor in the oximeter from predetermined spectra of each blood component comprised in the standard blood samples. The predetermined spectra of each blood component are, preferably, stored in the memory of the oximeter during manufacture. - Each blood component parameter value in the table in
Fig. 7 has an attached plus/minus limit value. The limit values are calculated errors, which would be produced by a measurement of parameter values in the standard blood sample with an oximeter having a wavelength shift of plus and minus 0.05 nm, respectively, as the only measurement error. For example, the value of blood component FCOHb in alevel 1 sample would be measured to 5.34 % or 6.66 % instead of the correct value of 6.00 %. Thus, even very small wavelength shifts in the oximeter, introduces significant errors in the measured blood parameter values, thereby illustrating the importance of quality controlling the oximeter for wavelength shifts. - By determining the modifications to the mathematically derived standard blood spectrum related to the level of the actual QC sample under test resulting from the parameters Δλ, cest and optionally also Qest, determined in the QC procedure, the oximeter may use the modified spectrum to calculate corresponding blood parameter values. The parameter values are reported to the operator of the oximeter, and the operator may compare them with assigned control limits for the actual QC level. The effect of the instument errors revealed in the QC procedure on values reported for a blood sample with unknown blood parameter values may, e.g., appear from the deviations between the reported parameter values and the values of the relevant standard blood sample of
Fig. 7 . -
Fig. 8 shows absorption spectra for each of standard blood sample, which absorption spectra are used in the oximeter for quality control levels 1-4. The spectra corresponding to levels 1-4 are 120, 121, 122, 123, respectively. Each spectrum has a corresponding cref value corresponding to a Sulforhodamine B concentration. - The above modification to the standard blood spectra shown in
Fig. 8 resulting from the parameter Δλ is a shift along the wavelength axis corresponding to the difference between Δλ and Δλqc, Δλqc being either an assigned value or a predetermined fixed value stored in the memory of the oximeter. The modification of the standard blood spectra resulting from the parameter cest is a modification of the individual absorbances with the ratio cest/cref. - By adopting this method of converting determined measurement errors introduced by the oximeter into parameter values of blood samples, instrument errors are reported in terms which are easily understood by the operator of the oximeter.
- By noting which of the blood parameters failed the control, it may be possible to determine which of the measured parameters Δλ, Cest and Qest caused the quality control to fail, and thereby determine which part of the oximeter that needs repair or service.
- The relation between blood parameters that failed the quality control by being outside their corresponding control limits and the measured values of parameters Δλ, cest, and Qest and thereby an error diagnosis of the oximeter may, preferably, be comprised in a service manual for a repair technician.
- According to a preferred embodiment of the invention a method is provided for repressing absorption spectra of one or several interfering components or substances contained in a blood sample in the oximeter. Preferably, the oximeter is adapted to repress the spectrum of Fetal Hemoglobin, which is known to cause significant interference in oximetry measurements.
- In a determined blood sample spectrum, the absorbance Am (λ) recorded at each wavelength λ contains contributions from each component in the sample. Interfering components are naturally treated as the other components. The magnitude of the contribution and thereby the concentration of each component in the sample is determined according to equation (18)

- The vectors Ky (λ) are predetermined and stored in the memory of the spectrophotometer.
- By including a Fetal Hemoglobin component in a blood sample, of which the reference spectrum is to be determined, a vector Kfetal (λ) corresponding to the concentration of Fetal Hemoglobin in the sample, is determined.
- Preferably, the oximeter further provides a predetermined vector Afetal (λ), representing the difference spectrum between Adult Hemoglobin and Fetal Hemoglobin. The vector Afetal (λ) is, preferably, determined at a reference concentration cfetal of 1 mmol/L.
- The effect on determined blood parameter values due to the presence of Fetal Hemoglobin in the blood sample, is minimised by repressing the spectrum of Fetal Hemoglobin.
- The first stage in the repression process comprises the determination of the concentration of Fetal Hemoglobin in the blood sample, according to equation (19)

- The second stage comprises the determination of a modified spectrum by subtracting the difference spectrum at the determined concentration from the measured spectrum Am (λ) of the blood sample, if cfetal is greater than a predetermined threshold value, according to aquation (20)

wherein Amod (λ) is the modified spectrum and cref = 1 mmol/L. - If cfetal is smaller than the predetermined threshold value the modified spectrum is set equal to the measured spectrum Am (λ).
- The third stage comprises the determination of concentrations of blood components cy from the modified spectrum Amod (λ), whereby the effect of Fetal Hemoglobin in the blood sample on determined concentrations cy of blood components is minimised.
- By repressing the spectrum of Fetal Hemoglobin automatically, an oximeter is provided with an increased precision in measured blood parameter values, and an easier operation than currently available instruments.
- According to a preferred embodiment of the invention,
Fig. 9 is a graph of a variable Fneon plotted against the wavelength of light striking two photodiodes inwavelength channels photodiode array 83 in thespectrometer 1 shown inFig. 3 . Thespectrometer 1 comprises a neon glow lamp (not shown), which emits at least one spectral line at a highly accurate reference wavelength of 585.25 nm, suitably positioned within the preferred wavelength range from 480 to 670 nm. The accurate wavelength of the emitted spectral line is used in the oximeter as a reference wavelength against which the location of the 128 wavelength channels of thearray 83 is adjusted. To utilise the reference wavelength a variable Fneon is defined as
wherein R(70) and R(71) are the magnitudes of the current or the response in each of the photodiodes located inchannels channels intensity striking diode 70 is equal to the lightintensity striking diode 71, which means that the reference wavelength is positioned exactly between thechannels spectrometer 1. This characteristic of Fneon is utilised during field operation of the oximeter, where the value of Fneon is measured at predetermined time intervals, and compared with a reference value Fcal stored in the memory of the oximeter during manufacture. - The
spectrometer 1 is scanned with light emitted from a high precision monochromator in the wavelength range 585.25 +/- 7.5 nm during manufacture. A response curve for the photodiode located inchannel 71 is measured. An example of a measured response curve is 131 shown inFig. 10 . A calibration algorithm comprised in the memory of the oximeter calculates a corresponding response curve forchannel 70 by shifting the wavelength axis. The calibration algorithm further calculates a wavelength calibration table comprising values of the variable Fneon and the corresponding value of the wavelength of light emitted from the monochromator by using the determined response curves ofchannels channels - The data comprised in the wavelength calibration table may be displayed graphically as shown in
Fig. 9 . - A calibration program measures the current temperature of the
spectrometer 1 between two blood sample measurements in normal operation of the oximeter. The cuvette is always cleaned with a transparent rinse solution between two blood sample measurements. The current measured temperature of thespectrometer 1 is compared with a previous temperature measurement which was performed at the time of the previous neon lamp activation and stored in the memory of the oximeter. The calibration program determines whether the current temperature value deviates more than 0.3 °C from the previous temperature value, and performs a measurement of the current value of Fneon if this is the case. - The graph in
Fig. 9 is now used to illustrate how a wavelength shift of the oximeter is determined and compensated during a period of time between two blood sample measurements, wherein the cuvette is rinsed. A first value of Fneon denoted Fcal corresponding to a first value of the wavelength denoted λcal are shown in the graph, and the value of Fcal is determined, as previously described. A second value of the variable Fneon denoted Fact may be measured by the oximeter between two blood sample measurements. By utilising the predetermined wavelength calibration table comprised in the memory of the oximeter a second value of wavelength λ denoted λact corresponding to Fact may be determined. The value of λact may be determined from the discrete values of the variable λ comprised in the calibration table according to well-known mathematical interpolation methods such as linear interpolation, polynomial interpolation, cubic spline interpolation, etc. - A wavelength shift Δλ of the spectrometer may be determined from the difference between the determined value λact and the calibration value λcal. The determined wavelength shift Δλ of the
spectrometer 1 may be utilised to compensate a measured absorption spectrum Am (λ) of a fluid sample by determining a modified absorption spectrum Amodi (λ) of the sample, wherein the effect of the determined wavelength shift Δλ on absorbances in the measured spectrum Am (λ) is removed. - The modified spectrum is, preferably, determined by first utilising a cubic spline function to generate interpolated absorbance values between the discrete values at the 128 wavelengths in the measured spectrum Am (λ). The modified spectrum Amodi (λ) is determined by shifting the wavelength of each measured absorbance value in Am (λ) sequentially with an amount equal to Δλ and determine a corresponding interpolated absorbance value for the modified spectrum.
- The provision of a spectral lamp, preferably a neon lamp, having at least one spectral line within a desired wavelength range enables the oximeter to perform highly accurate measurements of the wavelengths of light absorbed by a sample by comparing the determined wavelength of said at least one spectral line with the assigned wavelength of the spectral line stored in the memory of the oximeter, calculating the possible wavelength shift, and compensating the determined absorbance of the sample for said wavelength shift. Accordingly, the determined absorption spectrum by the
spectrometer 1 is being compensated for wavelength shifts resulting from manufacturing tolerances and temperature drift during the use of the oximeter, thereby providing accurate measurements of blood parameter values. -
Fig. 10 shows threeresponse curves corresponding wavelength channels e.g. response curve
Claims (19)
- A quality control method for a spectrophotometer, comprising the steps of:- determining with the spectrophotometer an absorption spectrum Am (λ) of a fluid quality control sample containing a dye and being selected from such dyes which provide the quality control sample with an absorption spectrum with a significant absorbance peak showing a steep flank,- normalizing of the determined spectrum Am (λ) with an estimate of the concentration of the dye, and- determining the wavelength shift Δλ between the normalized Am (λ) and a reference absorption spectrum A0 (λ) of a first reference quality control sample containing the dye and obtained on a reference spectrophotometer and stored in a memory of the spectrophotometer, as Δλ = CΔλ(λ) • Am (λ), wherein CΔλ(λ) is a mathematical parameter stored in the memory of the spectrophotometer,characterised in that:the mathematical parameter CΔλ(λ) is determined by a method comprising the steps of:in which i = 1, 2,..., N (N>1) and si and si3 are constants, and- determining the reference absorption spectrum A0 (λ),- determining a first derivative A0'(λ) of the reference spectrum so that the above spectrum Am (λ) is expressed as Am (λ) = A0 (λ) + Δλ A0'(λ),- expressing a set of vectors Bi (λ) representing spectra obtained on the reference spectrophotometer from a set of N reference samples according to:
 - performing a mathematical analysis to determine the mathematical parameter CΔλ(λ) as a coefficient vector so that each set of corresponding values of si3 and Bi satisfies:
- A quality control method for a spectrophotometer, comprising the steps of:- determining with the spectrophotometer an absorption spectrum Am (λ) of a fluid quality control sample containing a dye and being selected from such dyes which comprise a first and a second component and which provide the quality control sample with an absorption spectrum with a significant absorbance peak showing a steep flank, and- determining the wavelength shift Δλ between Am (λ) and a reference absorption spectrum A0 (λ) of a first reference quality control sample containing the dye in a first concentration and obtained on a reference spectrophotometer and stored in a memory of the spectrophotometer, as Δλ = CΔλ(λ) • Am (λ)/s1(est), wherein CΔλ(λ) is a first mathematical parameter stored in the memory of the spectrophotometer, and wherein s1(est) is an estimated concentration of the first dye component, where s1(est) = C1(λ) • Am (λ), and C1(λ) is a second mathematical parameter stored in the memory of the spectrophotometer,characterised in that:the mathematical parameters C1(λ) and CΔλ(λ) are determined by a method comprising the steps of:in which i=1,2,..,N (N>1) and si1, si2 and si3 are constants, and- determining the reference absorption spectrum A0 (λ),- determining with the reference spectrophotometer a second reference spectrum A02 (λ) of a second reference sample containing the dye in a second concentration different from the first concentration,- determining a first derivative A0'(λ) of the first reference spectrum so that the above spectrum Am (λ) is expressed as Am (λ) = s1 A1 (λ) + s2 A2 (λ) + Δλ A0 '(λ), in which A1 (λ) and A2 (λ) are derived from the first and second reference spectra A0 (λ) and A02 (λ) and represent spectral information about the first and the second components of the dye, respectively, and wherein s1 and s2 are constants,- expressing a set of vectors Bi (λ) representing spectra obtained on the reference spectrophotometer from a set of N reference samples according to:

performing a mathematical analysis to determine:- the mathematical parameter C1(λ) as a coefficient vector so that each set of corresponding values of si1 and Bi satisfies: - the mathematical parameter CΔλ(λ) as a coefficient vector so that each set of corresponding values of si3 and Bi satisfies:
- The method according to any of the preceding claims, wherein the quality control sample has an assigned wavelength shift Δλqc, which method further comprises the step of comparing Δλ with Δλqc.
- The method according to claim 2, further comprising the steps of:- during the mathematical analysis, determining a mathematical parameter C2(λ) as a coefficient vector so that each set of corresponding values of si2 and Bi satisfies:

- The method according to claim 4, wherein the quality control sample has a known dye concentration cqc, and wherein the method further comprises the steps of:- calculating an estimated concentration of the second dye component s2(est) from
 - calculating an estimated concentration cest of the dye fromin which a and b are predetermined constants previously stored in the memory of the spectrophotometer, and
 - comparing cest with cqc.
 - The method according to claim 5, wherein the quality control sample has an assigned value of Qqc = s2(qc)/s1(qc), wherein s1(qc) and s2(qc) are assigned values of the concentration of the first and the second dye component, respectively, and further comprising the step of:- calculating a variable Qest = s2(est)/s1(est), and- comparing Qest with Qqc.
- The method according to any of the preceding claims, wherein the spectrophotometer is an oximeter and wherein the method further comprises the step of determining estimated errors in blood parameter values reported by the oximeter.
- A spectrophotometer comprising a memory and a processor that is adapted to determine the wavelength shift Δλ between an absorption spectrum Am (λ) determined with the spectrophotometer on a fluid quality control sample containing a dye selected from such dyes which provide the quality control sample with an absorption spectrum with a significant absorbance peak showing a steep flank, and a reference absorption spectrum A0 (λ) of a reference quality control sample containing the dye, obtained on a reference spectrophotometer and stored in the memory of the spectrophotometer, and
wherein the processor is adapted for normalizing the determined spectrum Am (λ) with an estimate of the concentration of the dye, and further adapted for determining the wave length shift Δλ as Δλ = CΔλ(λ) • Am (λ), CΔλ(λ) being a mathematical parameter stored in the memory of the spectrophotometer,
wherein the parameter CΔλ(λ) is determined by a method comprising the steps of:- determining the reference absorption spectrum A0 (λ),- determining a first derivative A0 '(λ) of the reference spectrum so that the above spectrum Am (λ) is expressed as Am (λ) = A0 (λ) + Δλ A0 '(λ),- expressing a set of vectors Bi (λ) representing spectra obtained on the reference spectrophotometer from a set of N reference samples according to:in which i = 1, 2,..., N (N>1) and si and si3 are constants, and - performing a mathematical analysis to determine the mathematical parameter CΔλ(λ) as a coefficient vector so that each set of corresponding values of si3 and Bi satisfies:
- A spectrophotometer comprising a memory and a processor that is adapted to determine the wavelength shift Δλ between an absorption spectrum Am (λ) determined with the spectrophotometer on a fluid quality control sample containing a dye selected from such dyes which comprise a first and a second component and which provide the quality control sample with an absorption spectrum with a significant absorbance peak showing a steep flank, and a reference absorption spectrum A0 (λ) of a first reference quality control sample containing the dye in a first concentration, obtained on a reference spectrophotometer and stored in the memory of the spectrophotometer, and
wherein the processor is adapted for determining the wavelength shift Δλ as Δλ = CΔλ(λ) • Am (λ)/s1(est), wherein CΔλ(λ) is a first mathematical parameter stored in the memory of the spectrophotometer, and wherein s1(est) is an estimated concentration of the first dye component, where s1(est) = C1(λ) • Am (λ), and C1(λ) is a second mathematical parameter stored in the memory of the spectrophotometer,
wherein the parameters CΔλ(λ) and C1(λ) are determined by a method comprising the steps of:- determining the reference absorption spectrum A0 (λ),- determining with the reference spectrophotometer a second reference spectrum A02 (λ) of a second reference sample containing the dye in a second concentration different from the first concentration,- determining a first derivative A0 '(λ) of the first reference spectrum so that the above spectrum Am (λ) is expressed as Am (λ) = s1 A1 (λ) + s2 A2 (λ) + Δλ A0 '(λ), in which A1 (λ) and A2 (λ) are derived from the first and second reference spectra A0 (λ) and A02 (λ) and represent spectral information about the first and the second components of the dye, respectively, and wherein s1 and s2 are constants,- expressing a set of vectors Bi (λ) representing spectra obtained on the reference spectrophotometer from a set of N reference samples according to:in which i=1,2,..,N (N>1) and si1, si2 and si3 are constants, and
performing a mathematical analysis to determine:- the mathematical parameter C1(λ) as a coefficient vector so that each set of corresponding values of si1 and Bi satisfies: - the mathematical parameter CΔλ(λ) as a coefficient vector so that each set of corresponding values of si3 and Bi satisfies:
- The spectrophotometer according to claims 8 or 9, wherein the quality control sample has an assigned wavelength shift Δλqc, and the processor is further adapted to compare Δλ with Δλqc.
- The spectrophotometer according to claim 9, wherein the method of preparing the spectrophotometer further comprises the steps of:- during the mathematical analysis, determining a mathematical parameter C2(λ) as a coefficient vector so that each set of corresponding values of si2 and Bi satisfies:si2 = C2(λ) • Bi (λ), i = 1,2,...,N, wherein C2(λ) is stored in the memory of the spectrophotometer.
- The spectrophotometer according to claim 11,
wherein the quality control sample has a known dye concentration cqc, and wherein the processor is further adapted for:- calculating the estimated concentration of the second dye component s2(est) from - calculating an estimated concentration cest of the dye fromin which a and b are predetermined constants previously stored in the memory of the spectrophotometer, and
 - comparing cest with cqc.
 - The spectrophotometer according to claim 12, wherein the quality control sample has an assigned value of Qqc = s2(qc)/s1(qc), wherein s1(qc) and s2(qc) are assigned values of the concentration of the first and the second dye component, respectively, and wherein the processor is further adapted for:- calculating a variable Qest = s2(est)/s1(est), and- comparing Qest with Qqc.
- The spectrophotometer according to any of claims 8-13, wherein the spectrophotometer is an oximeter and wherein the processor is further adapted for determining estimated errors in blood parameter values reported by the oximeter.
- The spectrophotometer according to any of claims 8-14 for the determination of a concentration cy of a component y of a sample and wherein the memory further comprises
at least one vector Aint(λ) representing spectral information of an interfering component in the sample at a concentration cref, and
at least one predetermined vector Kint(λ), and wherein
the processor is further adapted to
calculate the concentration cint of the interfering component according to
if cint is greater than a predetermined threshold value, cref, calculate a modified absorbance spectrum Amod (λ) according to
determine cy from the modified spectrum Amod (λ) according to
where Ky (λ) is a predetermined vector and whereby the effect of interfering components on determined concentrations cy is minimised. - The spectrophotometer according to claim 15,
wherein the interfering component is fetal hemoglobin. - The spectrophotometer according to any of claims 8-16 further comprising a spectral lamp for emission of light with at least one spectral line, and the processor is adapted to determine the wavelength of the at least one spectral line and to compare the determined wavelength of said at least one spectral line with the assigned wavelength from an initial calibration procedure of said spectral line stored in the memory of the spectrophotometer, calculate a wavelength shift, and compensate the determined absorption spectrum of said sample for said wavelength shift.
- The spectrophotometer according to claim 17, which is an oximeter, and wherein the spectral lamp emits light with at least one spectral line in the wavelength range 480-670 nm, and said oximeter is further provided with at least two photodiodes each of which convert the emitted light from the spectral lamp into a current substantially proportional to the light intensity which strikes the photodiode, and wherein the processor of said oximeter calculates the ratio Fneon between the two photodiode currents.
- A spectrophotometer according to claim 18, wherein said spectral lamp is a neon lamp which is activated when the temperature of the spectrometer deviates more than a critical temperature difference, such as more than about 0.2-0.5°C from the previous Fneon measurement.
Applications Claiming Priority (3)
| Application Number | Priority Date | Filing Date | Title |
|---|---|---|---|
| DK78398 | 1998-06-12 | ||
| DK78398 | 1998-06-12 | ||
| PCT/DK1999/000313 WO1999066310A1 (en) | 1998-06-12 | 1999-06-10 | A method in quality control of a spectrophotometer |
Publications (2)
| Publication Number | Publication Date |
|---|---|
| EP1086366A1 EP1086366A1 (en) | 2001-03-28 |
| EP1086366B1 true EP1086366B1 (en) | 2010-04-14 |
Family
ID=8097511
Family Applications (1)
| Application Number | Title | Priority Date | Filing Date |
|---|---|---|---|
| EP99924801A Expired - Lifetime EP1086366B1 (en) | 1998-06-12 | 1999-06-10 | A method in quality control of a spectrophotometer |
Country Status (7)
| Country | Link |
|---|---|
| US (1) | US6980285B1 (en) |
| EP (1) | EP1086366B1 (en) |
| JP (1) | JP2002518670A (en) |
| AT (1) | ATE464555T1 (en) |
| DE (1) | DE69942250D1 (en) |
| DK (1) | DK1086366T3 (en) |
| WO (1) | WO1999066310A1 (en) |
Cited By (1)
| Publication number | Priority date | Publication date | Assignee | Title |
|---|---|---|---|---|
| WO2025186076A1 (en) * | 2024-03-08 | 2025-09-12 | Radiometer Medical Aps | A lightguide assembly for an apparatus for hemolyzing a blood sample |
Families Citing this family (35)
| Publication number | Priority date | Publication date | Assignee | Title |
|---|---|---|---|---|
| US20050037505A1 (en) * | 2000-05-11 | 2005-02-17 | James Samsoondar | Spectroscopic method and apparatus for analyte measurement |
| WO2005062986A2 (en) | 2003-12-31 | 2005-07-14 | The University Of South Carolina | Thin-layer porous optical sensors for gases and other fluids |
| US20070201136A1 (en) | 2004-09-13 | 2007-08-30 | University Of South Carolina | Thin Film Interference Filter and Bootstrap Method for Interference Filter Thin Film Deposition Process Control |
| JP2006162355A (en) * | 2004-12-03 | 2006-06-22 | Olympus Corp | Wavelength confirming method of apparatus with built in photometer and autoanalyzer |
| JP2006214968A (en) * | 2005-02-07 | 2006-08-17 | Dainichiseika Color & Chem Mfg Co Ltd | Method for detecting wavelength shift, method for correcting spectroscopic measurement data, and recording medium |
| US8345234B2 (en) | 2005-11-28 | 2013-01-01 | Halliburton Energy Services, Inc. | Self calibration methods for optical analysis system |
| WO2007064575A1 (en) | 2005-11-28 | 2007-06-07 | Ometric Corporation | Optical analysis system and method for real time multivariate optical computing |
| US20070166245A1 (en) * | 2005-11-28 | 2007-07-19 | Leonard Mackles | Propellant free foamable toothpaste composition |
| EP1974201A1 (en) | 2005-11-28 | 2008-10-01 | University of South Carolina | Optical analysis system for dynamic, real-time detection and measurement |
| WO2008002903A2 (en) | 2006-06-26 | 2008-01-03 | University Of South Carolina | Data validation and classification in optical analysis systems |
| JP2008032641A (en) * | 2006-07-31 | 2008-02-14 | Nidec Copal Corp | Photometric level correction method and measuring object inspection system |
| WO2008121693A1 (en) * | 2007-03-30 | 2008-10-09 | University Of South Carolina | Improved stability for optical computing system |
| EP2078187A2 (en) | 2006-11-02 | 2009-07-15 | University of South Carolina | Multi-analyte optical computing system |
| JP4884239B2 (en) | 2007-01-12 | 2012-02-29 | ベックマン コールター, インコーポレイテッド | Wavelength identification method and analyzer |
| JP2008170340A (en) * | 2007-01-12 | 2008-07-24 | Olympus Corp | Method for specifying wavelength, and analyzer |
| WO2008121684A1 (en) * | 2007-03-30 | 2008-10-09 | University Of South Carolina | Novel multi-analyte optical computing system |
| WO2008121715A1 (en) | 2007-03-30 | 2008-10-09 | Ometric Corporation | In-line process measurement systems and methods |
| WO2008121692A1 (en) | 2007-03-30 | 2008-10-09 | University Of South Carolina | Tablet analysis and measurement system |
| US8283633B2 (en) | 2007-11-30 | 2012-10-09 | Halliburton Energy Services, Inc. | Tuning D* with modified thermal detectors |
| JP5411127B2 (en) * | 2008-03-31 | 2014-02-12 | テルモ株式会社 | Calibration reagent adjustment method, calibration reagent, and blood component measuring apparatus calibration method using this calibration reagent |
| US8212213B2 (en) | 2008-04-07 | 2012-07-03 | Halliburton Energy Services, Inc. | Chemically-selective detector and methods relating thereto |
| CA2720854C (en) | 2008-04-30 | 2015-03-31 | Instrumentation Laboratory Company | Hemoglobin based bilirubin reference material |
| KR101247445B1 (en) * | 2008-07-07 | 2013-03-26 | 신닛테츠스미킨 카부시키카이샤 | Method for measuring water content in a compound and water content measuring device |
| CN102131957A (en) * | 2008-08-28 | 2011-07-20 | 硅绝缘体技术有限公司 | UV absorption based monitor and control of chloride gas stream |
| EP2359147A1 (en) * | 2008-12-19 | 2011-08-24 | F. Hoffmann-La Roche AG | Device and method for automated verification of the calibration (calibration verification) of an analyzer |
| JP5738564B2 (en) * | 2010-09-30 | 2015-06-24 | オリンパス株式会社 | Image processing system |
| EP2472219B1 (en) | 2011-01-04 | 2014-03-19 | Hach Lange GmbH | Method for determining a shape adjustment value F for laboratory fluid analysis vessels |
| SG11201703202YA (en) | 2014-10-24 | 2017-05-30 | Univ Monash | Method and system for detection of disease agents in blood |
| KR20170082206A (en) * | 2016-01-06 | 2017-07-14 | 삼성전자주식회사 | Fluid analysis cartridge and fluid analysis apparatus including the same |
| JP6513762B2 (en) * | 2016-12-15 | 2019-05-15 | 株式会社堀場製作所 | Analyzer, program for analyzer and analysis method |
| IL297609A (en) | 2020-04-28 | 2022-12-01 | Siemens Healthcare Diagnostics Inc | Acoustophoretic lysis devices and methods |
| EP4113531A1 (en) | 2021-06-29 | 2023-01-04 | Radiometer Medical ApS | Predictive maintenance system and method |
| KR102790621B1 (en) * | 2021-07-07 | 2025-04-04 | 가천대학교 산학협력단 | Blood analysis device using optical analysis |
| JP7320894B1 (en) * | 2023-02-09 | 2023-08-04 | 日本分光株式会社 | Spectrum analysis method, analysis device and analysis program |
| CN116297263B (en) * | 2023-02-13 | 2025-09-16 | 安荣信科技(南京)有限公司 | Self-calibration and self-verification device and method for spectrum analyzer |
Citations (2)
| Publication number | Priority date | Publication date | Assignee | Title |
|---|---|---|---|---|
| EP0132399A1 (en) * | 1983-07-21 | 1985-01-30 | Corning Glass Works | Cooximetry quality control reagents |
| WO1997001751A1 (en) * | 1995-06-29 | 1997-01-16 | Chiron Diagnostics Corporation | Determination of component concentrations taking account of measurement errors |
Family Cites Families (17)
| Publication number | Priority date | Publication date | Assignee | Title |
|---|---|---|---|---|
| US3638640A (en) * | 1967-11-01 | 1972-02-01 | Robert F Shaw | Oximeter and method for in vivo determination of oxygen saturation in blood using three or more different wavelengths |
| EP0167816A2 (en) * | 1984-06-13 | 1986-01-15 | Abbott Laboratories | Fluid analyzing apparatus with offset correction means |
| US6262798B1 (en) * | 1992-09-29 | 2001-07-17 | Board Of Regents, The University Of Texas System | Method and apparatus for direct spectrophotometric measurements in unaltered whole blood |
| US5568400A (en) * | 1989-09-01 | 1996-10-22 | Stark; Edward W. | Multiplicative signal correction method and apparatus |
| US5459677A (en) * | 1990-10-09 | 1995-10-17 | Board Of Regents Of The University Of Washington | Calibration transfer for analytical instruments |
| US5243546A (en) * | 1991-01-10 | 1993-09-07 | Ashland Oil, Inc. | Spectroscopic instrument calibration |
| US5397899A (en) * | 1992-07-21 | 1995-03-14 | Western Atlas International, Inc. | Method for improving infrared analysis estimations by automatically compensating for instrument instabilities |
| EP0663997B1 (en) | 1992-10-07 | 1996-05-29 | Ashland Oil, Inc. | Spectroscopic instrument calibration |
| US5553615A (en) * | 1994-01-31 | 1996-09-10 | Minnesota Mining And Manufacturing Company | Method and apparatus for noninvasive prediction of hematocrit |
| JP3694029B2 (en) * | 1995-02-09 | 2005-09-14 | フォス アナリティカル アクティーゼルスカブ | Standardization method of spectrometer |
| US5828445A (en) * | 1995-03-30 | 1998-10-27 | Chiron Diagnostics Corporation | Method for measuring and reporting co-oximeter quality control results |
| JP3304692B2 (en) * | 1995-05-23 | 2002-07-22 | 株式会社島津製作所 | Spectrometer |
| US5758644A (en) * | 1995-06-07 | 1998-06-02 | Masimo Corporation | Manual and automatic probe calibration |
| JPH0915048A (en) | 1995-06-28 | 1997-01-17 | Shimadzu Corp | Spectrophotometer |
| AT404513B (en) * | 1996-07-12 | 1998-12-28 | Avl Verbrennungskraft Messtech | METHOD AND MEASURING ARRANGEMENT FOR THE OPTICAL DETERMINATION OF TOTAL HEMOGLOBIN CONCENTRATION |
| US6029115A (en) | 1996-10-03 | 2000-02-22 | Perkin Elmer Llc | Analyzing spectrometric data |
| US6064899A (en) * | 1998-04-23 | 2000-05-16 | Nellcor Puritan Bennett Incorporated | Fiber optic oximeter connector with element indicating wavelength shift |
-
1999
- 1999-06-10 DE DE69942250T patent/DE69942250D1/en not_active Expired - Lifetime
- 1999-06-10 AT AT99924801T patent/ATE464555T1/en not_active IP Right Cessation
- 1999-06-10 WO PCT/DK1999/000313 patent/WO1999066310A1/en not_active Ceased
- 1999-06-10 EP EP99924801A patent/EP1086366B1/en not_active Expired - Lifetime
- 1999-06-10 US US09/719,415 patent/US6980285B1/en not_active Expired - Fee Related
- 1999-06-10 DK DK99924801.6T patent/DK1086366T3/en active
- 1999-06-10 JP JP2000555079A patent/JP2002518670A/en active Pending
Patent Citations (2)
| Publication number | Priority date | Publication date | Assignee | Title |
|---|---|---|---|---|
| EP0132399A1 (en) * | 1983-07-21 | 1985-01-30 | Corning Glass Works | Cooximetry quality control reagents |
| WO1997001751A1 (en) * | 1995-06-29 | 1997-01-16 | Chiron Diagnostics Corporation | Determination of component concentrations taking account of measurement errors |
Cited By (1)
| Publication number | Priority date | Publication date | Assignee | Title |
|---|---|---|---|---|
| WO2025186076A1 (en) * | 2024-03-08 | 2025-09-12 | Radiometer Medical Aps | A lightguide assembly for an apparatus for hemolyzing a blood sample |
Also Published As
| Publication number | Publication date |
|---|---|
| US6980285B1 (en) | 2005-12-27 |
| JP2002518670A (en) | 2002-06-25 |
| DK1086366T3 (en) | 2010-08-09 |
| DE69942250D1 (en) | 2010-05-27 |
| EP1086366A1 (en) | 2001-03-28 |
| WO1999066310A1 (en) | 1999-12-23 |
| ATE464555T1 (en) | 2010-04-15 |
Similar Documents
| Publication | Publication Date | Title |
|---|---|---|
| US6980285B1 (en) | Method in quality control of a spectrophotometer | |
| US4373818A (en) | Method and device for analysis with color identification test paper | |
| US11754539B2 (en) | System and computer-implemented method for extrapolating calibration spectra | |
| US8760645B2 (en) | Method of normalizing a fluorescence analyzer | |
| US7899636B2 (en) | Calibration of optical analysis making use of multivariate optical elements | |
| US7663738B2 (en) | Method for automatically detecting factors that disturb analysis by a photometer | |
| CN102105779B (en) | Method for detection of gases by laser spectroscopy, and gas sensor | |
| US9453796B2 (en) | Method for calibrating clinical chemistry instruments | |
| JP2010261944A (en) | Method for detecting contaminants in optical measurement cuvettes | |
| JP5186635B2 (en) | Plant water stress measurement method | |
| EP0817957B1 (en) | Method for oximeter standardization and for reporting results | |
| JP6230017B2 (en) | Component concentration analyzer using light emitting diode | |
| JPH07151677A (en) | Densitometer | |
| Westerhaus | Equation development | |
| KR20010101371A (en) | Reaction monitoring | |
| US12578265B2 (en) | Preparation method for preparing spectrometric determinations of at least one measurand in a target application | |
| US20230011975A1 (en) | Method of determining an optical pathlength through a cuvette | |
| JPH0643095A (en) | Near infrared analyzer | |
| JPH0854337A (en) | Method for measuring the concentration c of an absorbing substance which is uniformly distributed in a carrier substance | |
| MXPA97007500A (en) | Method for the calibration of an oximeter and to stop result | |
| WO2024144798A9 (en) | Hybrid fluorescence-absorbance measurement system and method for sub-microliter and sub-nanoliter volume measurement | |
| CN119935949A (en) | A method for determining the concentration of nitric acid and plutonium in P350 solution | |
| JPS6229016B2 (en) | ||
| Chang et al. | Double beam near-infrared spectrometer for compensation of background water absorption and instrumental drift in intensity | |
| JPH02254343A (en) | Spectroscopic measurement apparatus |
Legal Events
| Date | Code | Title | Description |
|---|---|---|---|
| PUAI | Public reference made under article 153(3) epc to a published international application that has entered the european phase |
Free format text: ORIGINAL CODE: 0009012 |
|
| 17P | Request for examination filed |
Effective date: 20001213 |
|
| AK | Designated contracting states |
Kind code of ref document: A1 Designated state(s): AT CH DE DK FR GB IT LI |
|
| RAP1 | Party data changed (applicant data changed or rights of an application transferred) |
Owner name: RADIOMETER MEDICAL APS |
|
| 17Q | First examination report despatched |
Effective date: 20070904 |
|
| GRAP | Despatch of communication of intention to grant a patent |
Free format text: ORIGINAL CODE: EPIDOSNIGR1 |
|
| RIN1 | Information on inventor provided before grant (corrected) |
Inventor name: HANSEN, HEINE |
|
| GRAS | Grant fee paid |
Free format text: ORIGINAL CODE: EPIDOSNIGR3 |
|
| GRAA | (expected) grant |
Free format text: ORIGINAL CODE: 0009210 |
|
| AK | Designated contracting states |
Kind code of ref document: B1 Designated state(s): AT CH DE DK FR GB IT LI |
|
| REG | Reference to a national code |
Ref country code: GB Ref legal event code: FG4D |
|
| REG | Reference to a national code |
Ref country code: CH Ref legal event code: EP |
|
| REF | Corresponds to: |
Ref document number: 69942250 Country of ref document: DE Date of ref document: 20100527 Kind code of ref document: P |
|
| REG | Reference to a national code |
Ref country code: DK Ref legal event code: T3 |
|
| PG25 | Lapsed in a contracting state [announced via postgrant information from national office to epo] |
Ref country code: AT Free format text: LAPSE BECAUSE OF FAILURE TO SUBMIT A TRANSLATION OF THE DESCRIPTION OR TO PAY THE FEE WITHIN THE PRESCRIBED TIME-LIMIT Effective date: 20100414 |
|
| REG | Reference to a national code |
Ref country code: CH Ref legal event code: PL |
|
| PLBE | No opposition filed within time limit |
Free format text: ORIGINAL CODE: 0009261 |
|
| STAA | Information on the status of an ep patent application or granted ep patent |
Free format text: STATUS: NO OPPOSITION FILED WITHIN TIME LIMIT |
|
| 26N | No opposition filed |
Effective date: 20110117 |
|
| PG25 | Lapsed in a contracting state [announced via postgrant information from national office to epo] |
Ref country code: IT Free format text: LAPSE BECAUSE OF FAILURE TO SUBMIT A TRANSLATION OF THE DESCRIPTION OR TO PAY THE FEE WITHIN THE PRESCRIBED TIME-LIMIT Effective date: 20100414 |
|
| PG25 | Lapsed in a contracting state [announced via postgrant information from national office to epo] |
Ref country code: LI Free format text: LAPSE BECAUSE OF NON-PAYMENT OF DUE FEES Effective date: 20100630 Ref country code: CH Free format text: LAPSE BECAUSE OF NON-PAYMENT OF DUE FEES Effective date: 20100630 |
|
| REG | Reference to a national code |
Ref country code: DE Ref legal event code: R081 Ref document number: 69942250 Country of ref document: DE Owner name: RADIOMETER MEDICAL APS, DK Free format text: FORMER OWNER: RADIOMETER MEDICAL APS, BROENSHOEJ, DK Effective date: 20121022 |
|
| REG | Reference to a national code |
Ref country code: GB Ref legal event code: 732E Free format text: REGISTERED BETWEEN 20130207 AND 20130214 |
|
| REG | Reference to a national code |
Ref country code: GB Ref legal event code: 732E Free format text: REGISTERED BETWEEN 20130425 AND 20130501 |
|
| REG | Reference to a national code |
Ref country code: FR Ref legal event code: PLFP Year of fee payment: 17 |
|
| PGFP | Annual fee paid to national office [announced via postgrant information from national office to epo] |
Ref country code: DE Payment date: 20150629 Year of fee payment: 17 Ref country code: GB Payment date: 20150629 Year of fee payment: 17 Ref country code: DK Payment date: 20150625 Year of fee payment: 17 |
|
| PGFP | Annual fee paid to national office [announced via postgrant information from national office to epo] |
Ref country code: FR Payment date: 20150617 Year of fee payment: 17 |
|
| REG | Reference to a national code |
Ref country code: DE Ref legal event code: R119 Ref document number: 69942250 Country of ref document: DE |
|
| REG | Reference to a national code |
Ref country code: DK Ref legal event code: EBP Effective date: 20160630 |
|
| GBPC | Gb: european patent ceased through non-payment of renewal fee |
Effective date: 20160610 |
|
| REG | Reference to a national code |
Ref country code: FR Ref legal event code: ST Effective date: 20170228 |
|
| PG25 | Lapsed in a contracting state [announced via postgrant information from national office to epo] |
Ref country code: DE Free format text: LAPSE BECAUSE OF NON-PAYMENT OF DUE FEES Effective date: 20170103 Ref country code: FR Free format text: LAPSE BECAUSE OF NON-PAYMENT OF DUE FEES Effective date: 20160630 |
|
| PG25 | Lapsed in a contracting state [announced via postgrant information from national office to epo] |
Ref country code: GB Free format text: LAPSE BECAUSE OF NON-PAYMENT OF DUE FEES Effective date: 20160610 |
|
| PG25 | Lapsed in a contracting state [announced via postgrant information from national office to epo] |
Ref country code: DK Free format text: LAPSE BECAUSE OF NON-PAYMENT OF DUE FEES Effective date: 20160630 |