EP1059522A1 - Method and apparatus for examining fluids of biological origin - Google Patents
Method and apparatus for examining fluids of biological origin Download PDFInfo
- Publication number
- EP1059522A1 EP1059522A1 EP99810517A EP99810517A EP1059522A1 EP 1059522 A1 EP1059522 A1 EP 1059522A1 EP 99810517 A EP99810517 A EP 99810517A EP 99810517 A EP99810517 A EP 99810517A EP 1059522 A1 EP1059522 A1 EP 1059522A1
- Authority
- EP
- European Patent Office
- Prior art keywords
- spectrum
- concentration
- extinction
- hemoglobin
- bilirubin
- Prior art date
- Legal status (The legal status is an assumption and is not a legal conclusion. Google has not performed a legal analysis and makes no representation as to the accuracy of the status listed.)
- Withdrawn
Links
- 239000012530 fluid Substances 0.000 title claims abstract description 13
- 238000000034 method Methods 0.000 title claims description 39
- BPYKTIZUTYGOLE-IFADSCNNSA-N Bilirubin Chemical compound N1C(=O)C(C)=C(C=C)\C1=C\C1=C(C)C(CCC(O)=O)=C(CC2=C(C(C)=C(\C=C/3C(=C(C=C)C(=O)N\3)C)N2)CCC(O)=O)N1 BPYKTIZUTYGOLE-IFADSCNNSA-N 0.000 claims abstract description 110
- 238000001228 spectrum Methods 0.000 claims abstract description 78
- 102000001554 Hemoglobins Human genes 0.000 claims abstract description 56
- 108010054147 Hemoglobins Proteins 0.000 claims abstract description 56
- 230000008033 biological extinction Effects 0.000 claims abstract description 53
- 150000002632 lipids Chemical class 0.000 claims abstract description 24
- 210000004369 blood Anatomy 0.000 claims abstract description 20
- 239000008280 blood Substances 0.000 claims abstract description 20
- 239000000126 substance Substances 0.000 claims abstract description 13
- 238000011156 evaluation Methods 0.000 claims abstract description 8
- 239000000523 sample Substances 0.000 claims description 48
- 238000005259 measurement Methods 0.000 claims description 17
- 230000002547 anomalous effect Effects 0.000 claims description 4
- 238000009434 installation Methods 0.000 claims description 4
- 238000005375 photometry Methods 0.000 claims description 4
- 238000004458 analytical method Methods 0.000 claims description 3
- 230000000284 resting effect Effects 0.000 claims 1
- 238000012360 testing method Methods 0.000 abstract description 24
- 230000003287 optical effect Effects 0.000 description 24
- 230000003595 spectral effect Effects 0.000 description 18
- 210000002966 serum Anatomy 0.000 description 15
- 239000011159 matrix material Substances 0.000 description 10
- 238000012544 monitoring process Methods 0.000 description 10
- 238000004847 absorption spectroscopy Methods 0.000 description 5
- 210000002381 plasma Anatomy 0.000 description 5
- 238000005070 sampling Methods 0.000 description 4
- 239000012895 dilution Substances 0.000 description 3
- 238000010790 dilution Methods 0.000 description 3
- 238000000338 in vitro Methods 0.000 description 3
- 230000002452 interceptive effect Effects 0.000 description 3
- 229940028435 intralipid Drugs 0.000 description 3
- 206010018910 Haemolysis Diseases 0.000 description 2
- 241000950629 Icteria Species 0.000 description 2
- 239000013060 biological fluid Substances 0.000 description 2
- 201000010099 disease Diseases 0.000 description 2
- 208000037265 diseases, disorders, signs and symptoms Diseases 0.000 description 2
- 229910052736 halogen Inorganic materials 0.000 description 2
- 150000002367 halogens Chemical class 0.000 description 2
- 230000008588 hemolysis Effects 0.000 description 2
- 238000009533 lab test Methods 0.000 description 2
- 230000002159 abnormal effect Effects 0.000 description 1
- 238000010521 absorption reaction Methods 0.000 description 1
- 238000000862 absorption spectrum Methods 0.000 description 1
- 239000012491 analyte Substances 0.000 description 1
- 238000000149 argon plasma sintering Methods 0.000 description 1
- 238000012742 biochemical analysis Methods 0.000 description 1
- 210000001124 body fluid Anatomy 0.000 description 1
- 239000010839 body fluid Substances 0.000 description 1
- 210000004027 cell Anatomy 0.000 description 1
- 125000003636 chemical group Chemical group 0.000 description 1
- 238000006243 chemical reaction Methods 0.000 description 1
- 239000003153 chemical reaction reagent Substances 0.000 description 1
- 150000001875 compounds Chemical class 0.000 description 1
- 230000003750 conditioning effect Effects 0.000 description 1
- 230000003247 decreasing effect Effects 0.000 description 1
- 238000001514 detection method Methods 0.000 description 1
- 238000010586 diagram Methods 0.000 description 1
- 239000012470 diluted sample Substances 0.000 description 1
- 230000002949 hemolytic effect Effects 0.000 description 1
- 238000007689 inspection Methods 0.000 description 1
- 230000001000 lipidemic effect Effects 0.000 description 1
- 238000000691 measurement method Methods 0.000 description 1
- 239000000203 mixture Substances 0.000 description 1
- 230000035764 nutrition Effects 0.000 description 1
- 235000016709 nutrition Nutrition 0.000 description 1
- 238000000255 optical extinction spectrum Methods 0.000 description 1
- 239000013307 optical fiber Substances 0.000 description 1
- 230000000704 physical effect Effects 0.000 description 1
- 238000002360 preparation method Methods 0.000 description 1
- 239000012088 reference solution Substances 0.000 description 1
- 239000012898 sample dilution Substances 0.000 description 1
- 230000035945 sensitivity Effects 0.000 description 1
- 239000000243 solution Substances 0.000 description 1
- 210000002700 urine Anatomy 0.000 description 1
Images


Classifications
-
- G—PHYSICS
- G01—MEASURING; TESTING
- G01N—INVESTIGATING OR ANALYSING MATERIALS BY DETERMINING THEIR CHEMICAL OR PHYSICAL PROPERTIES
- G01N21/00—Investigating or analysing materials by the use of optical means, i.e. using sub-millimetre waves, infrared, visible or ultraviolet light
- G01N21/17—Systems in which incident light is modified in accordance with the properties of the material investigated
- G01N21/25—Colour; Spectral properties, i.e. comparison of effect of material on the light at two or more different wavelengths or wavelength bands
- G01N21/27—Colour; Spectral properties, i.e. comparison of effect of material on the light at two or more different wavelengths or wavelength bands using photo-electric detection ; circuits for computing concentration
- G01N21/274—Calibration, base line adjustment, drift correction
Definitions
- the present invention relates to a method for examining a fluid according to the preamble of claim 1. It relates further to devices for executing the method.
- In vitro interferences arise from the fact that biochemical analysis are performed in the complex matrices that make up biological fluids, e.g. serum, plasma or urine. These fluids contain numerous compounds that either have chemical groups that can react with the test reagents or can have the physical or spectral properties of the target analyte. Further, the chemical composition of body fluids can vary with the nature and the extent of disease processes. In vitro interferences can be classified into two classes: spectral and chemical interference.
- hemolysis The most commonly observed interferences are hemolysis, icteria, and lipemia. Some 30 % of samples obtained from clinic or hospitalized patients are hemolyzed, icteric, or lipemic. Main reasons for hemolysis are unskilled blood taking or sample preparation, for icteria the jaunice disease, and for lipemia fat nutrition before blood taking.
- sample quality monitoring is the determination of the interfering substances hemoglobin, bilirubin, and lipid prior to conducting fully automated clinical laboratory tests in order to provide meaningful and accurate test results. If a sample is sufficiently contaminated with interference substances, the test may either not be conducted or the test result may be flagged to be not reliable. Particularly, such a test is desirable in connection with the use of clinical-chemical analyzers which perform most of the analysis of a sample merely full automatically and without respecting special circumstances as regards individual blood samples.
- a method and device for semi-quantitative sample quality monitoring of hemoglobin and bilirubin using multiple wavelength measurements on diluted serum samples has been disclosed in US-4,263,512.
- the method suffers from non-quantitative determination of the interference concentrations and from the need of specific sample conditioning.
- Alternative methods are chromatographic or clinical-chemical determination of the interference concentrations. The first suffers from high measurement time and delicate instrumentation, whereas the second is not suited for reagentless measurement.
- the combination or superposition of the extinction spectrum of this first one of the components in a pure state and a function approximating the background extinction is fitted to the measured spectrum of the fluid to be analyzed in a wavelength range, where the component to be determined shows a significant or characteristic shape of its extinction curve.
- the function approximating the background extinction may e.g. be a straight line, and in this case, the wavelength range is preferably chosen where the expected background extinction spectrum is similar to a straight line.
- Sample quality monitoring of blood serum or plasma by optical absorption spectroscopy in the visible and near IR range is investigated.
- the evaluation is performed by the method according to the present invention, yielding the content of the hemoglobin and bilirubin. Lack of a reproducible relation between light-scattering and lipid concentration inhibits quantitative determination of the lipid concentration by optical absorption spectroscopy.
- a differential extinction spectrum which is obtained from subtracting the hemoglobin and bilirubin contributions from the extinction spectrum of the target sample. It contains the spectral contributions of the lipid and the matrix, e.g. the blood serum or plasma, which can then be investigated for spectral anomalies.
- the method is experimentally investigated using a series of 125 synthetic test samples and a series of 92 real blood sera. Accuracy and reproducibility of the technique versus the performance of the spectroscopic measurement device are analyzed.
- the basic setup for optical absorption spectroscopy for sample quality monitoring is shown in Fig. 1.
- the beam 1 of a multiple optical wavelength light source 2 is collimated by lens 3, which directs the light of spectral intensity I o ( ⁇ ) to the target sample.
- the optical path in the target sample is denoted by d.
- Lens 4 collects the transmitted light of intensity I( ⁇ ), which is then detected by a spectral wavelength analyzer, symbolized by its input 5.
- E g is the extinction characteristic of the matrix, e.g. blood serum or plasma.
- Figure 2 shows the extinction coefficients K h 10 of hemoglobin, K b 11 of bilirubin, and K l 12 of lipid (Intralipid 20% [Pharmacia, Sweden]) in the visible and near IR range.
- the extinction spectrum E g 13 of a standard blood serum (Control Serum N (human) [Hoffmann-La Roche, Switzerland]) is also shown in Fig. 2 (dashed line).
- the solid line 30 refers to the reference solution of Intralipid, the broken lines 31 refer to several samples of real whole blood sera after subtraction of the extinction contribution by hemoglobin and bilirubin.
- E diff is obtained from subtracting the hemoglobin and bilirubin contributions from the measured extinction spectrum.
- E diff represents the sum of the spectral contributions of the lipid (E l ) and the matrix (E g ) , and may additionally be investigated for spectral anomalies over the whole spectral range.
- the hemoglobin concentration is determined 38 from the measured extinction spectrum E( ⁇ ) 35 in the approximate wavelength range ⁇ rh ⁇ [545, 575] nm, where the hemoglobin has typical spectral characteristics and the bilirubin contribution is quasi negligible (Fig. 2).
- the bilirubin concentration is determined from the measured extinction spectrum E( ⁇ ) 35 in the wavelength range ⁇ rb ⁇ [480, 545] nm.
- CV lim a critical to weak reproducibility 51 of the results, i. e. concentrations and differential spectrum. Consequently, the measurement would e.g. be disregarded, repeated, or assigned reduced reliability.
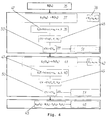
- the bloc diagram in Fig. 4 summarizes the proposed measurement and evaluation method for sample quality monitoring.
- Sample quality monitoring based on optical absorption spectroscopy as shown in Fig. 1, has been experimentally investigated using a state-of-the-art spectrometer (Cary V, VARIAN, Australia).
- the collimated beam had an approximate spot size of 5 ⁇ 2 mm 2 .
- the hemoglobin concentration C h has been obtained from linear least squares fitting the model in Eqs.
- the differential extinction spectrum E diff has been obtained from Eq. (7).
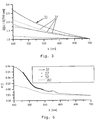
- Figure 5 shows the experimentally measured extinction spectrum E( ⁇ ) of a typical real whole blood serum 55.
- the best fitting extinction models for hemoglobin 57 and bilirubin 59 in Eqs. (3) and (5) are represented by crosses and dots, respectively.
- the differential extinction spectrum E diff ( ⁇ n ) 60 is also shown by the dashed line.
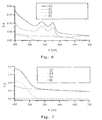
- Figs. 6 and 7 show other examples of real whole blood serum samples, namely with a high hemoglobin content respectively an highly icteric sample. Furthermore, in Fig. 6, the differential spectrum shows an anomalous differential spectrum which is merely constant with additionally an increased extinction with increasing wavelength above about 650 nm.
- the continuous line 62 is the measured spectrum
- the dashed line 64 and the dotted line 65 are the hemoglobin respectively the bilirubin contributions
- the dash-dotted line 66 is the differential spectrum, each time calculated from the results according to the described method.
- the hemoglobin and bilirubin concentrations of a series of 125 independent test samples have been determined.
- the samples have been synthesized using a standard blood serum (Control Serum N (human) [Hoffmann-La Roche, Switzerland]) to which hemoglobin (Hemolysat [Hoffmann-La Roche, Switzerland]), bilirubin (B-4126 mixed isomers [Sigma, Switzerland]) and lipid (Intralipid 20% [Pharmacia, Sweden]) have been added.
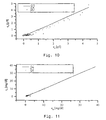
- the optically measured hemoglobin 70 and bilirubin 72 concentrations versus added concentrations are represented in Fig. 8 and 9.
- the hemoglobin and bilirubin concentrations of a series of 92 real whole blood sera have then been optically determined.
- the concentrations have been determined by clinical-chemical analysis(Cobas® Integra 700 analyzer, [Hoffmann-La Roche, Switzerland]).
- Figures 10 and 11 show the optically versus clinical-chemically determined hemoglobin [bilirubin] concentrations 90 [91].
- the sensitivity of the method is approximately C h,min ⁇ 0.5 g/l hemoglobin and C b,min ⁇ 2 mg/dl bilirubin.
- the clinical-chemical method has also limited accuracy; namely the bilirubin concentrations (Fig. 11) show better correlation than the hemoglobin concentrations (Fig. 10), although the accuracy of the optically measured bilirubin concentration is affected by the accuracy of the hemoglobin concentration determination (sequential determination of hemoglobin and bilirubin, see above).
- the light was spectroscopically analyzed by a low cost, plane-concave spectrometer PCS [CSEM-Z, Switzerland] with spectral resolution ⁇ ⁇ 8 nm.
- the hemoglobin concentration C h has been obtained from linear least squares fitting the model in Eqs.
- the differential extinction spectrum E diff has been obtained from Eq. (7).
- Figures 16 and 17 show the PCS versus the state-of-the-art (Cary V) spectroscopically measured hemoglobin respectively bilirubin concentrations of the set of 92 blood sera of Figs. 10, 11 and 12 to 15. In the case of hemoglobin (Fig.
- the examination of the samples yields a result indicating an anomalous condition of the sample, there may be generated by the examining device, e. g., one or more of the following signals or responses:
- the described method may be implemented in various arrangements, preferably in connection with an automated analyzer, e g. as follows:
Abstract
A quality test of fluids of biological origin can be
performed optically with applying a suitable evaluation
method. In case of two components to be determined in a such
fluid, an extinction spectrum is approximated in a first
wavelength range by a combination of a merely theoretical
curve and the spectrum of the pure first substance in a
first wavelength range, and this evaluation is repeated in a
second wavelength range this time by approximating the
measured spectrum (62) by a combination of a hypothetical
curve, the spectrum (64) of the first component with the
already determined concentration, and the spectrum (65) of
the pure second component. Furthermore, it is feasible to
subtract the first and second spectrum and analyze the so
obtained differential spectrum (66) in view of anomalies.
The hypothetical curves are preferably straight lines which
are defined by slope and ordinate section. In the praxis of
the quality test of blood, bilirubin and hemoglobin may be
quantitatively be determined, whilst the background together
with the lipid component can be qualitatively examined by
means of the differential spectrum.
Description
- The present invention relates to a method for examining a fluid according to the preamble of
claim 1. It relates further to devices for executing the method. - Clinical laboratory tests are routinely performed on the serum or plasma of whole blood. The tests commonly employ a series of reactions which terminate after the generation of chromophores which facilitate detection by spectroscopic measurements. The accuracy of most spectroscopic tests is affected to some extent by in vitro interferences. In vitro interferences arise from the fact that biochemical analysis are performed in the complex matrices that make up biological fluids, e.g. serum, plasma or urine. These fluids contain numerous compounds that either have chemical groups that can react with the test reagents or can have the physical or spectral properties of the target analyte. Further, the chemical composition of body fluids can vary with the nature and the extent of disease processes. In vitro interferences can be classified into two classes: spectral and chemical interference. The most commonly observed interferences are hemolysis, icteria, and lipemia. Some 30 % of samples obtained from clinic or hospitalized patients are hemolyzed, icteric, or lipemic. Main reasons for hemolysis are unskilled blood taking or sample preparation, for icteria the jaunice disease, and for lipemia fat nutrition before blood taking.
- The goal of sample quality monitoring is the determination of the interfering substances hemoglobin, bilirubin, and lipid prior to conducting fully automated clinical laboratory tests in order to provide meaningful and accurate test results. If a sample is sufficiently contaminated with interference substances, the test may either not be conducted or the test result may be flagged to be not reliable. Particularly, such a test is desirable in connection with the use of clinical-chemical analyzers which perform most of the analysis of a sample merely full automatically and without respecting special circumstances as regards individual blood samples.
- A method and device for semi-quantitative sample quality monitoring of hemoglobin and bilirubin using multiple wavelength measurements on diluted serum samples has been disclosed in US-4,263,512. The method suffers from non-quantitative determination of the interference concentrations and from the need of specific sample conditioning. Alternative methods are chromatographic or clinical-chemical determination of the interference concentrations. The first suffers from high measurement time and delicate instrumentation, whereas the second is not suited for reagentless measurement.
- Therefore, it is an aim of the present invention to provide a method for estimating rapidly the content of at least one component in a biological fluid.
- Such a method is given in
claim 1, the remaining claims presenting preferred embodiments and applications thereof and an installation for executing the method. - In a preferred method according to the invention, the combination or superposition of the extinction spectrum of this first one of the components in a pure state and a function approximating the background extinction is fitted to the measured spectrum of the fluid to be analyzed in a wavelength range, where the component to be determined shows a significant or characteristic shape of its extinction curve. The function approximating the background extinction may e.g. be a straight line, and in this case, the wavelength range is preferably chosen where the expected background extinction spectrum is similar to a straight line.
- The invention shall be further explained in referring to exemplary embodiments with reference to the Figure:
- Fig. 1:
- Schematic representation of a photometric spectrum measurement arrangement.
- Fig. 2:
- Extinction spectra of pure components and a standard blood serum.
- Fig. 3:
- Normalized extinction spectra of real whole blood sera, bilirubin and hemoglobin contribution being subtracted, and a reference lipid solution sample.
- Fig. 4:
- Evaluation method for sample quality monitoring.
- Fig. 5:
- Experimentally measured extinction spectrum of a real whole blood serum and results of the evaluation method.
- Fig. 6:
- Measured extinction spectrum of a strongly hemolytic whole blood sample and respective extinction spectra obtained by the examination method.
- Fig. 7:
- As Fig. 6 for a strongly icteric whole blood sample.
- Figs. 8, 9:
- Optically determined hemoglobin (Fig. 8) and bilirubin (Fig. 9) concentrations versus added concentrations for 125 independent test samples.
- Figs. 10,11:
- Optically measured hemoglobin respectively bilirubin concentration values vs. clinical-chemically measured concentration values for independent real whole blood sera.
- Figs. 12-15:
- Optically measured hemoglobin and bilirubin concentrations of 92 real whole blood sera and the respective CV values obtained using a state-of-the-art spectrometer.
- Fig. 16, 17:
- Low-cost versus state-of-the-art spectroscopically measured (Fig. 16) hemoglobin and bilirubin (Fig. 17) concentrations of 92 real whole blood sera.
- Fig. 18:
- Schematic illustration of a dip probe.
- Sample quality monitoring of blood serum or plasma by optical absorption spectroscopy in the visible and near IR range is investigated. The target measuring ranges are 0.1 - 10 g/l hemoglobin, 2 - 20 mg/dl (1 dl = 0.1 liter) bilirubin and 100 - 2000 mg/dl lipid with a measurement accuracy of 20 %. The evaluation is performed by the method according to the present invention, yielding the content of the hemoglobin and bilirubin. Lack of a reproducible relation between light-scattering and lipid concentration inhibits quantitative determination of the lipid concentration by optical absorption spectroscopy. Therefore, it is provided a differential extinction spectrum, which is obtained from subtracting the hemoglobin and bilirubin contributions from the extinction spectrum of the target sample. It contains the spectral contributions of the lipid and the matrix, e.g. the blood serum or plasma, which can then be investigated for spectral anomalies. The method is experimentally investigated using a series of 125 synthetic test samples and a series of 92 real blood sera. Accuracy and reproducibility of the technique versus the performance of the spectroscopic measurement device are analyzed.
- The basic setup for optical absorption spectroscopy for sample quality monitoring is shown in Fig. 1. The
beam 1 of a multiple opticalwavelength light source 2 is collimated bylens 3, which directs the light of spectral intensity Io(λ) to the target sample. The optical path in the target sample is denoted by d.Lens 4 collects the transmitted light of intensity I(λ), which is then detected by a spectral wavelength analyzer, symbolized by itsinput 5. - Optical absorption is commonly characterized by the extinction E(λ), which is defined as
- In the presence of J interfering substances in the target sample, e.g. hemoglobin, bilirubin and lipid (i. e., J=3), the extinction can be described by the linear combinationwhere Kj and Cj are the specific extinction coefficient and the concentration of interfering substance j = (j = 1, 2, ..., J), respectively. The dilution of the target sample is denoted by qdil, i. e. (original concentrations) : (sample concentrations)=(1:qdil). Eg is the extinction characteristic of the matrix, e.g. blood serum or plasma. Figure 2 shows the

extinction coefficients K h 10 of hemoglobin, Kb 11 of bilirubin, andK l 12 of lipid (Intralipid 20% [Pharmacia, Sweden]) in the visible and near IR range. The extinction spectrum Eg 13 of a standard blood serum (Control Serum N (human) [Hoffmann-La Roche, Switzerland]) is also shown in Fig. 2 (dashed line). - In the scope of sample quality monitoring, a minimum number of Nmin = 4 statistically independent extinction values E(λn) (n = 1, ..., 4) should allow to determine the four unknown parameters in Eq. (2), i.e. the concentration of the interference substances hemoglobin (Ch), bilirubin (Cb) and lipid (Cl), and the matrix part (E g ). More reproducible results are expected by least squares fitting the model of the extinction spectrum E(λ) in Eq. (2) to N > Nmin measured values E(λn) (n = 1, 2, ... , N) in order to obtain best estimates of the values of Ch, Cb and Ci.
- However, it is observed that the specific extinction coefficient Kl(λ) of lipid is not reproducible in real blood sera, which is mainly due to the statistical distribution of the size of the scattering centers in the lipid. Further, the monotonically decreasing extinction spectrum of lipid versus wavelength lacks typical (local) characteristics (Fig. 2). Therefore, it cannot be distinguished from the extinction spectrum of the matrix (Eg).
- Figure 3 shows extinction spectra of real whole blood sera, from which the hemoglobin and bilirubin contributions have been subtracted. These differential spectra therefore represent the sum of the spectral contributions of the lipid and the matrix. The shown extinction spectra are normalized to the extinction at λ = 700 nm. The
solid line 30 refers to the reference solution of Intralipid, thebroken lines 31 refer to several samples of real whole blood sera after subtraction of the extinction contribution by hemoglobin and bilirubin. - Hence quantitative determination of the hemoglobin (Ch), bilirubin (Cb) and lipid (Cl) concentrations appears not to be possible by measuring the optical extinction spectrum of the target sample and fitting the model in Eq. (2) to the measured values E (λn) .
- Therefore, sequential determination of first the hemoglobin (Ch) and then the bilirubin (Cb) concentration is proposed. The differential spectrum Ediff is obtained from subtracting the hemoglobin and bilirubin contributions from the measured extinction spectrum. Ediff represents the sum of the spectral contributions of the lipid (El) and the matrix (Eg) , and may additionally be investigated for spectral anomalies over the whole spectral range.
- The method (cf. Fig. 4) is based on approximating the differential spectrum Ediff = Eg + El in a limited wavelength range λr by a straight line. First, the hemoglobin concentration is determined 38 from the measured extinction spectrum E(λ) 35 in the approximate wavelength range λrh ≅ [545, 575] nm, where the hemoglobin has typical spectral characteristics and the bilirubin contribution is quasi negligible (Fig. 2). The extinction spectrum is approximated by
- Then, the bilirubin concentration is determined from the measured extinction spectrum E(λ) 35 in the wavelength range λrb ≅ [480, 545] nm. The extinction spectrum is approximated by
differential spectrum E diff 45 is obtained byspectral anomalies 46. - The reproducibility of the measured concentrations Ch and Cb of hemoglobin respectively bilirubin can be analytically calculated, if the minimum number Nmin = 3 of measured extinction values E(λn) in the range xrh[b] are used to determine ch [cb] from Eq. (3) respectively Eq. (5). The reproducibility of a measured concentration C is commonly characterized by the coefficient of variation CV = σc / E{c}, where σx and E{x} stand for the standard deviation and the statistical expectation (mean value) of {x}, respectively. Using Eqs. (1), (2), and (7), it can be readily shown that CV of the concentration Cj is related to the reproducibility of the (physically) measured optical intensity σI/I0 throughwhere
λ - When N > Nmin statistically independent measured values E(λn) are used for the linear least squares algorithm, it can be shown that the CV 48 [49] of the measured hemoglobin [bilirubin] concentration is related to Eq. (8) through
weak reproducibility 51 of the results, i. e. concentrations and differential spectrum. Consequently, the measurement would e.g. be disregarded, repeated, or assigned reduced reliability. - The bloc diagram in Fig. 4 summarizes the proposed measurement and evaluation method for sample quality monitoring.
- Sample quality monitoring, based on optical absorption spectroscopy as shown in Fig. 1, has been experimentally investigated using a state-of-the-art spectrometer (Cary V, VARIAN, Australia). The collimated beam had an approximate spot size of 5 × 2 mm2. The optical path in the test sample was d = 10 mm. The sample dilution was 1:20 (qdil = 20). The spectrum of the test sample was measured in the wavelength range λ = [300, 1200] nm with a spectral resolution of Δλ = 0.05 nm and a spectral sampling rate of Δλs = 1 nm/pixel. The hemoglobin concentration Ch has been obtained from linear least squares fitting the model in Eqs. (3) and (4) to N1 = 28 measured values E(λn) in the wavelength range λrh = [545, 575] nm. The bilirubin concentration Cb has been obtained from linear least squares fitting the model in Eqs. (5) and (6) to N2 = 63 measured values E(λn) in the wavelength range λrb = [480, 545] nm. The differential extinction spectrum Ediff has been obtained from Eq. (7). The reproducibility of the measured hemoglobin and bilirubin concentrations has then been calculated according to Eqs. (8) and (9), with σI/I0 = 5·10-5 for the reproducibility of the measured optical intensities.
- As an example, Figure 5 shows the experimentally measured extinction spectrum E(λ) of a typical real
whole blood serum 55. The best fitting extinction models for hemoglobin 57 and bilirubin 59 in Eqs. (3) and (5) are represented by crosses and dots, respectively. The best fitting hemoglobin and bilirubin concentrations are Ch = 0.18 g/l (CV = 1.5 %) and Cb = 0.67 mg/dl (CV = 0.3 %), respectively. The differential extinction spectrum Ediff(λn) 60 is also shown by the dashed line. - Figs. 6 and 7 show other examples of real whole blood serum samples, namely with a high hemoglobin content respectively an highly icteric sample. Furthermore, in Fig. 6, the differential spectrum shows an anomalous differential spectrum which is merely constant with additionally an increased extinction with increasing wavelength above about 650 nm. The
continuous line 62 is the measured spectrum, the dashedline 64 and the dottedline 65 are the hemoglobin respectively the bilirubin contributions, and the dash-dottedline 66 is the differential spectrum, each time calculated from the results according to the described method. - In order to investigate the accuracy of the method, the hemoglobin and bilirubin concentrations of a series of 125 independent test samples have been determined. The samples have been synthesized using a standard blood serum (Control Serum N (human) [Hoffmann-La Roche, Switzerland]) to which hemoglobin (Hemolysat [Hoffmann-La Roche, Switzerland]), bilirubin (B-4126 mixed isomers [Sigma, Switzerland]) and lipid (
Intralipid 20% [Pharmacia, Sweden]) have been added. The added concentrations of hemoglobin, bilirubin and lipid were Ch = [0, 0.17, 0.83, 3.33, 15] g/l, Cb = [0, 1, 2, 10, 20] mg/dl and C1 = [0 50 100 400 1800] mg/dl, respectively, leading to the set of 5·5·5 test samples. The optically measuredhemoglobin 70 andbilirubin 72 concentrations versus added concentrations are represented in Fig. 8 and 9. - In the case of hemoglobin (Fig. 8), a linear least squares fit 74 (cfit,h = C0,h + mb Ch) yields an offset concentration c0,h = 0.12 g/l and a slope mh = 0.95. The correlation coefficient between the best fit and the measured values is ρ = 0.999. In the case of bilirubin (Fig. 9), a second linear least squares fit 76 (cfit,b = c0,b + mb Cb) yields an offset concentration c0,b = 1.64 mg/dl and a slope mb = 0.999. The correlation coefficient between the best fit and the measured values is ρ = 0.995. Note that Control Serum N (human) has an approximate bilirubin concentration of Cb ≅ 2 mg/dl. Further, it is stated that the amount of added hemoglobin, bilirubin and lipid also has finite accuracy.
- The hemoglobin and bilirubin concentrations of a series of 92 real whole blood sera have then been optically determined. The concentration values were in the range Ch = [0, 5] g/l for hemoglobin and Cb = [0, 45] mg/dl for bilirubin. As reference values, the concentrations have been determined by clinical-chemical analysis(
Cobas® Integra 700 analyzer, [Hoffmann-La Roche, Switzerland]). Figures 10 and 11 show the optically versus clinical-chemically determined hemoglobin [bilirubin] concentrations 90 [91]. - The results show that the sensitivity of the method is approximately Ch,min ≅ 0.5 g/l hemoglobin and Cb,min ≅ 2 mg/dl bilirubin. The observed correlation coefficients between the reference 93 [94] and the optically determined 90 [91] hemoglobin [bilirubin] concentrations were ρ = 0.980 and ρ = 0.996, respectively. Note that the clinical-chemical method has also limited accuracy; namely the bilirubin concentrations (Fig. 11) show better correlation than the hemoglobin concentrations (Fig. 10), although the accuracy of the optically measured bilirubin concentration is affected by the accuracy of the hemoglobin concentration determination (sequential determination of hemoglobin and bilirubin, see above).
- In comparison, the benchmark Hitachi-Formula (US-4,263,512) evaluation algorithm has been used to evaluate the optical absorption spectra. The observed correlation coefficients between the reference and the Hitachi-Formula determined concentration values were ρ = 0.879 for hemoglobin and ρ = 0.992 for bilirubin.
- The coefficient of variation CV of the measured hemoglobin and bilirubin concentrations has been calculated from Eq. (8), where σI/I0 = 5·10-5 was the reproducibility of the measured optical intensities and
λ = 560nm [λ = 512nm] was the center wavelength of λrh[b]. Figures 12 to 15 show the optically measured hemoglobin (Fig. 12) and bilirubin (Fig. 14) concentrations of the set of 92 real blood sera and the respective CV values (Fig. 13 resp. Fig. 15). Inspection of Figs. 12 to 15 shows that the reproducibility is better for large concentration values, and that the values for hemoglobin and bilirubin are better than CV < 10 % respectively < 1 % for 89 respectively 91 of 92 analyzed sera. - Sample quality monitoring, based on optical absorption spectroscopy as shown in Fig. 1, has then been experimentally investigated with low cost optical elements. The multiple optical wavelength light source was a white-light halogen lamp (Halogen 5V, 5W, Pν ≅ 2 nW/nm @ λ = 530 nm [MICROPARTS GmbH, Germany]). The collimated beam had an approximate diameter of D = 2 mm. The optical path in the test sample was d = 10 mm. The dilution of the sample was 1 : 20 (qdil = 20). The transmitted light was collected by a lens (focal length f = 5 mm) and coupled into an optical fiber with core diameter Øc = 100 µm. The light was spectroscopically analyzed by a low cost, plane-concave spectrometer PCS [CSEM-Z, Switzerland] with spectral resolution Δλ ≅ 8 nm. The spectrum of the test sample was measured by a linear photodiode array (512 pixels, center-to-center spacing Δx = 25 µm) in the wavelength range λ = [421, 704] nm. The spectral sampling rate was Δλs = 2.8 nm/pixel. The reproducibility of the measured optical intensities was σI/I0 = 5·10-4. The hemoglobin concentration Ch has been obtained from linear least squares fitting the model in Eqs. (3) and (4) to N1 = 11 measured values E(λn) in the wavelength range λrh = [545, 575] nm. The bilirubin concentration Cb has been obtained from linear least squares fitting the model in Eqs. (5) and (6) to N2 = 20 measured values E(λn) in the wavelength range λrb = [480, 545] nm. The differential extinction spectrum Ediff has been obtained from Eq. (7). Figures 16 and 17 show the PCS versus the state-of-the-art (Cary V) spectroscopically measured hemoglobin respectively bilirubin concentrations of the set of 92 blood sera of Figs. 10, 11 and 12 to 15. In the case of hemoglobin (Fig. 16), a linear least squares fit (cfit,h = c0,h + mh Ch) in the concentration range Ch < 2 g/l yields an offset concentration c0,h = 0.043 g/l and a slope mh = 0.859. The correlation coefficient between the best fitting curve and the PCS measured values is ρ = 0.997. In the case of bilirubin (Fig. 17), a linear least squares fit (cfit,b = c0,b + mb Cb) in the concentration range Cb < 15 mg/dl yields an offset concentration c0,b = -0.010 mg/dl and a slope mb = 0.940. The correlation coefficient between the best fitting curve and the PCS measured values is ρ = 0.998. The results show that low cost spectrometers can readily be used for sample quality monitoring purposes.
- If the examination of the samples yields a result indicating an anomalous condition of the sample, there may be generated by the examining device, e. g., one or more of the following signals or responses:
- an optical and/or acoustical warning signal to excite the operator's attention, particularly in case an abnormal sample has been detected,
- a printout of results (spectra, coefficients etc.) on a printer,
- a print on the analyzer's printout, so that the operator can immediately see if the results of the regular, chemical-clinical examination are true or prone to artefacts, or
- an automatic repetition of the measurement, e.g. using a new test sample.
- The described method may be implemented in various arrangements, preferably in connection with an automated analyzer, e g. as follows:
- The quality test may be done as a first photometric pass in the photometric site of an analyzer. Thereby, the performance of the analyzer is reduced because this prescan and the regular photometric pass are performed subsequently, or an additional sample is needed causing consumption of sample material;
- An additional photometric site is provided for the quality test;
- The pipette, or more generally, the supply system of the analyzer for the fluids to be tested, is provided with a transparent site, i. e. an optical flow-through cell (OFTC), in connection with a photometer; where necessary, particularly when the conduit system subsequently provides differently diluted samples, there may be arranged different OFTC paths with different optical path lengths in connection with flow switches for compensating the varying dilutions;
- A stand-alone photometer dedicated to the quality tests
- A
probe 110 for immersing into asample container 111 as exemplary shown in Fig. 11: At itsend 112, it is provided with alateral recess 113 serving as the optical path. The light 115 passes the recess 114 within the probe shaft and is reflected back by aprism 116 so that it traverses therecess 113. Above the recess, by an appropriate optic 117, the light having passed is collected and forwarded to the photometer (not shown) by alight guide 119. - The sample tube itself may be used as the photometric cuvette, provided the differing lengths of the optical observation paths can be compensated for, i. e. the path lengths are determined and can be input into the quality test system, and/or the sample tubes are of sufficiently equal size so that the optical paths do only differ within small limits, maybe in an even negligible variation range.
- From the above description, variations of the invention are conceivable to the one skilled in the art without leaving the scope of the invention as defined in the claims. For instance, it is conceivable:
- to extend the method to the determination of a third and further components by continuing the sequential determination method using two, three, four etc. previously determined components for ascertaining the concentrations of a third, fourth etc. component;
- to have the differential spectrum analyzed automatically by determining its curvature (i. e. the second derivative) and/or slope (i. e. the first derivative), which should increase respectively be negative for increasing wavelength in the exemplary quality test set forth above;
- to choose deviating wavelength ranges for the photometric measurements, particularly if the quality test is used for determining other components of the samples provided that the spectra to be combined in order to approximate the measured spectrum show peculiarities in the given wavelength range so that the approximation parameters, before all the concentration of the sought component, are unambiguously derivable;
- to determine the differential spectrum in a subrange of the wavelength range used for the determination of the single components, or possibly even a range extending beyond this range.
Claims (15)
- Method for evaluating an extinction spectrum of a fluid of preferably biological origin, with at least two components, characterized in that
a first extinction spectrum E1(λ) of the fluid is measured in a first wavelength range λ= λ1,1 to λ1,n, and an approximated spectrum E1(λ) is fitted to this extinction spectrum, the approximated spectrum being a combination, preferably the sum, ofthe fitting being performed by varying the concentration c1 and at least two of the coefficients ai,1, so that the deviation between measured spectrum and approximated spectrum is minimized, in order to determine the concentration of the first component wherein the wavelength ranges are selected such that the concentration c1 of the component can be determined unambiguously.a predetermined approximation function f1(λ,ai,1), with i ranging from zero to at least one, for the background extinction, andthe predetermined extinction spectrum E1(c1,λ) of a pure first component of concentration·c1 of the components to be determined, - A method according to claim 1, characterized in that in at least one further second wavelength range λ=λk,1 to λk,n, k ≥ 2, a second extinction spectrum Ek(λ) of the fluid is measured and a second approximated spectrum
E k(λ) is fitted to the second spectrum, the second approximated spectrumE k(λ) being a combination, preferably the sum of:the fitting being performed by varying the concentration ck and at least two of the coefficients ai,k so that the deviation between measured spectrum and approximated spectrum is minimized, in order to determine the concentration of the second component, wherein the wavelength ranges are selected such that the concentration Ck of the said second component k can be determined unambiguously.a predetermined approximation function fk(λ,ai,k) with i ranging from zero to at least one, for the background extinction,the combination, particularly the sum, of the extinctions El(cl,λ), l=1 to k-1, of the k-1 pure first and second components priorly determined, andthe predetermined extinction Ek(ck,λ) of the said pure second component k of concentration Ck to be determined, - A method according to claim 1 or 2, characterized in that at least one, preferably all, of the functions fk(λ,ai,k), k ≥ 1, are of the formwith n ≥ 1 and preferably n=1.

- A method according to one of claims 1 to 3, characterized in that the fit of the approximated spectra
E k(λ), k ≥ 1, to the measured values E(λi), with i=1 to N, N being the number of measured values, is done by a least squares fit. - A method according to one of claims 1 to 4, characterized in that the sample is marked at least anomalous if the determined concentrations Ck, k ≥ 1, are outside a predetermined range.
- A method according to one of claims 1 to 5, characterized in that a differential spectrumwith J being the number of components, and λ being in a range covering at least 30 %, preferably at least 50 % and most preferably about 100 % or more of the whole wavelength range defined by the broadest combination of λl,1 and λ1,n, λ2,1 and λ2,n,..., λJ,1 and λJ,n is computed, and the differential spectrum is subjected to an analysis in view of anomalies.

- A method according to claim 6, characterized in that the curvature and/or the slope of the differential spectrum in at least one predetermined wavelength range is/are determined, the result compared with the expected values, and in that the differential spectrum is estimated to be normal if the values compared have identical sign, optionally with the magnitude resting in a predetermined range given by an upper and a lower limiting curve.
- A method according to one of claims 1 to 7, characterized in thatthe sample is blood, preferably human blood, or a fluid derived therefrom,the first wavelength range is chosen in the range of 500 to 600 nm, preferably from 545 nm to 575 nm, even more preferably being essentially identical with one of these ranges, the first reference spectrum E1(λ) being that of hemoglobin, so that the concentration C1 of hemoglobin is determinable, andthe second wavelength range is chosen in the range of 400 to 600 nm, preferably from 480 nm to 545 nm, even more preferably being essentially identical with these ranges, the second reference spectrum E2(λ) being that of bilirubin, so that the concentration C2 of bilirubin is determinable.
- A method according to claim 8, characterized in that the lipid concentration and the overall constitution of the sample are estimated to be normal if the differential spectrum has a negative slope and/or a positive curvature.
- A method according to one of claims 8 to 9, characterized in that the sample is estimated to be of critical condition if the concentration of bilirubin and/or hemoglobin exceed a predetermined value, and/or if the differential spectrum is anomalous.
- A method according to one of claims 1 to 10, characterized in that the spectra are provided as electrical signals and furnished to an evaluation device comprising a processor which performs the method steps on the spectra under the control of a program, and that the results are stored in a storage means, preferably a storage means for digital data, and/or presented to an operator, preferably by printing, displaying and/or producing audible sounds.
- An installation for implementing the method of one of claims 1 to 11 for use with an analyzer, preferably a clinical-chemical analyzer, characterized in that in the supply path of sample fluid of the analyzer, at least one photometric measurement site is provided so that extinction spectra can be taken of the fluid in the supply path.
- A photometric probe for implementing the method of one of claims 1 to 11, characterized in that its end comprises a photometric measurement site confined by two facing walls, one of which being equipped with a light source, and the second well being equipped with a light capturing means, the measurement site, the light source and the light capturing means being so arranged that light emanating from the light source passes the measurement site and, at least to a significant part, is captured by the light capturing means.
- A photometric probe according to claim 13, characterized in that it comprises a light guide passing the measurement site, and that a light deviating means, preferably a prism, is arranged such that light exiting the light guide is deviated, preferably by an angle of substantially 180°, towards the light exiting side of the first wall of the measurement site.
- An analyzer, preferably a chemical-clinical analyzer, with an installation for photometric measurements, characterized in that the installation comprises a program memory and a device for executing the program, wherein the execution of the program implements the method of one of claims 1 to 11.
Priority Applications (5)
| Application Number | Priority Date | Filing Date | Title |
|---|---|---|---|
| EP99810517A EP1059522A1 (en) | 1999-06-11 | 1999-06-11 | Method and apparatus for examining fluids of biological origin |
| US10/018,080 US6882425B1 (en) | 1999-06-11 | 2000-06-07 | Method and apparatus for examining fluids of biological origin |
| JP2001503504A JP2003502631A (en) | 1999-06-11 | 2000-06-07 | Method and apparatus for testing biologically derived fluids |
| PCT/EP2000/005237 WO2000077494A1 (en) | 1999-06-11 | 2000-06-07 | Method and apparatus for examining fluids of biological origin |
| EP00936867A EP1185852A1 (en) | 1999-06-11 | 2000-06-07 | Method and apparatus for examining fluids of biological origin |
Applications Claiming Priority (1)
| Application Number | Priority Date | Filing Date | Title |
|---|---|---|---|
| EP99810517A EP1059522A1 (en) | 1999-06-11 | 1999-06-11 | Method and apparatus for examining fluids of biological origin |
Publications (1)
| Publication Number | Publication Date |
|---|---|
| EP1059522A1 true EP1059522A1 (en) | 2000-12-13 |
Family
ID=8242873
Family Applications (2)
| Application Number | Title | Priority Date | Filing Date |
|---|---|---|---|
| EP99810517A Withdrawn EP1059522A1 (en) | 1999-06-11 | 1999-06-11 | Method and apparatus for examining fluids of biological origin |
| EP00936867A Ceased EP1185852A1 (en) | 1999-06-11 | 2000-06-07 | Method and apparatus for examining fluids of biological origin |
Family Applications After (1)
| Application Number | Title | Priority Date | Filing Date |
|---|---|---|---|
| EP00936867A Ceased EP1185852A1 (en) | 1999-06-11 | 2000-06-07 | Method and apparatus for examining fluids of biological origin |
Country Status (4)
| Country | Link |
|---|---|
| US (1) | US6882425B1 (en) |
| EP (2) | EP1059522A1 (en) |
| JP (1) | JP2003502631A (en) |
| WO (1) | WO2000077494A1 (en) |
Cited By (8)
| Publication number | Priority date | Publication date | Assignee | Title |
|---|---|---|---|---|
| WO2006040387A1 (en) * | 2004-10-11 | 2006-04-20 | Thermo Fisher Scientific Oy | Method for automatically detecting factors that disturb analysis by a photometer |
| EP2549264A1 (en) | 2011-07-18 | 2013-01-23 | Siemens Healthcare Diagnostics Products GmbH | Method and system for determining the concentration of substances in bodily fluids |
| CN105116156A (en) * | 2015-07-22 | 2015-12-02 | 江苏英诺华医疗技术有限公司 | Optimized biochemical detection method suitable for medical examination |
| EP3051271A1 (en) | 2015-01-27 | 2016-08-03 | Siemens Healthcare Diagnostics Products GmbH | Method for assaying lipids and other interferents in body fluid samples |
| CN106018400A (en) * | 2015-03-31 | 2016-10-12 | 希森美康株式会社 | Sample analyzer, sample analyzing method, and control device |
| EP3165900A1 (en) | 2015-11-09 | 2017-05-10 | F. Hoffmann-La Roche AG | Multi-wavelength illumination for spectral interference detection |
| EP3290905A1 (en) * | 2016-09-05 | 2018-03-07 | F. Hoffmann-La Roche AG | Signal offset determination and correction |
| EP3591378A1 (en) | 2018-07-03 | 2020-01-08 | Siemens Healthcare Diagnostics Products GmbH | Method for assaying lipids, haemoglobin and bilirubin in body fluid samples |
Families Citing this family (10)
| Publication number | Priority date | Publication date | Assignee | Title |
|---|---|---|---|---|
| JP4496838B2 (en) * | 2004-04-28 | 2010-07-07 | 日立化成工業株式会社 | Spectroscopic device and total reflection Raman spectroscopic device |
| US7375815B2 (en) * | 2004-10-12 | 2008-05-20 | Agilent Technologies, Inc. | Optical devices, systems and method for producing a collimated light path |
| US20080144005A1 (en) * | 2006-12-19 | 2008-06-19 | Cytyc Corporation | Method for analyzing blood content of cytological specimens |
| EP1987762A1 (en) * | 2007-05-03 | 2008-11-05 | F.Hoffmann-La Roche Ag | Oximeter |
| DE112009002702B4 (en) * | 2008-11-17 | 2013-09-05 | Hitachi High-Technologies Corporation | Automatic analyzer |
| AU2010282784C1 (en) * | 2009-08-13 | 2014-03-13 | Siemens Healthcare Diagnostics Inc. | Methods and apparatus for ascertaining interferents and physical dimensions in liquid samples and containers to be analyzed by a clinical analyzer |
| CN103732272A (en) | 2012-07-30 | 2014-04-16 | 汾沃有限公司 | Optical detection of lipids |
| WO2018144633A1 (en) * | 2017-01-31 | 2018-08-09 | Theranos Ip Company, Llc | Methods and devices for improved signal detection from biological samples |
| JP7057820B2 (en) | 2017-07-19 | 2022-04-20 | シーメンス・ヘルスケア・ダイアグノスティックス・インコーポレーテッド | Specimen evaluation method and sample evaluation device using hyperspectral imaging |
| WO2020103051A1 (en) * | 2018-11-21 | 2020-05-28 | 北京普利生仪器有限公司 | Method for measuring sample absorbance difference, sample analyzer and storage medium |
Citations (3)
| Publication number | Priority date | Publication date | Assignee | Title |
|---|---|---|---|---|
| WO1991004470A1 (en) * | 1989-09-22 | 1991-04-04 | Ada Technologies, Inc. | Spectrometer for performing measurements in a fluid stream |
| EP0562800A2 (en) * | 1992-03-24 | 1993-09-29 | Shimadzu Corporation | Determining a base line of a measurement curve |
| EP0915338A2 (en) * | 1997-11-10 | 1999-05-12 | Jeacle Limited | Photometric analysis of water suspensions |
Family Cites Families (10)
| Publication number | Priority date | Publication date | Assignee | Title |
|---|---|---|---|---|
| DE2847176C2 (en) | 1977-10-31 | 1982-05-06 | Hitachi, Ltd., Tokyo | Method for the photometric determination of substances in blood serum |
| JPS5463785A (en) * | 1977-10-31 | 1979-05-22 | Hitachi Ltd | Colorimetric analysis method |
| GB2020009B (en) * | 1978-04-08 | 1982-12-01 | Bodenseewerk Perkin Elmer Co | Apparatus for determining the concentration of components of a sample |
| DE3043984A1 (en) * | 1980-11-21 | 1982-06-03 | Langhals, Heinz, Dr., 5880 Lüdenscheid | METHOD FOR DETERMINING THE COMPOSITION OF BINARY LIQUID MIXTURES |
| US5137023A (en) * | 1990-04-19 | 1992-08-11 | Worcester Polytechnic Institute | Method and apparatus for monitoring blood analytes noninvasively by pulsatile photoplethysmography |
| US5424840A (en) * | 1992-07-21 | 1995-06-13 | The State Of Oregon Acting By And Through The State Board Of Higher Education On Behalf Of Oregon State University | In situ chlorophyl absorption meter |
| US5573952A (en) * | 1994-08-12 | 1996-11-12 | E. I. Du Pont De Nemours And Company | Process for controlling concentration of a solution of a solvent and polymer |
| DE4433827C2 (en) * | 1994-09-22 | 1999-01-07 | Zeiss Carl Jena Gmbh | Arrangement and method for measuring substance parameters in layers of media, in particular for calibration-free in vivo measurement of oxygen saturation in optically accessible blood vessels |
| WO1997019340A1 (en) | 1995-11-21 | 1997-05-29 | Cme Telemetrix Inc. | Apparatus and method for rapid spectrophotometric pre-test screen of specimen for a blood analyzer |
| JPH1164217A (en) * | 1997-08-26 | 1999-03-05 | Iseki & Co Ltd | Component quantity detecting device for spectral analyzer |
-
1999
- 1999-06-11 EP EP99810517A patent/EP1059522A1/en not_active Withdrawn
-
2000
- 2000-06-07 EP EP00936867A patent/EP1185852A1/en not_active Ceased
- 2000-06-07 JP JP2001503504A patent/JP2003502631A/en active Pending
- 2000-06-07 WO PCT/EP2000/005237 patent/WO2000077494A1/en not_active Application Discontinuation
- 2000-06-07 US US10/018,080 patent/US6882425B1/en not_active Expired - Fee Related
Patent Citations (3)
| Publication number | Priority date | Publication date | Assignee | Title |
|---|---|---|---|---|
| WO1991004470A1 (en) * | 1989-09-22 | 1991-04-04 | Ada Technologies, Inc. | Spectrometer for performing measurements in a fluid stream |
| EP0562800A2 (en) * | 1992-03-24 | 1993-09-29 | Shimadzu Corporation | Determining a base line of a measurement curve |
| EP0915338A2 (en) * | 1997-11-10 | 1999-05-12 | Jeacle Limited | Photometric analysis of water suspensions |
Cited By (18)
| Publication number | Priority date | Publication date | Assignee | Title |
|---|---|---|---|---|
| US7663738B2 (en) | 2004-10-11 | 2010-02-16 | Thermo Fisher Scientific Oy | Method for automatically detecting factors that disturb analysis by a photometer |
| WO2006040387A1 (en) * | 2004-10-11 | 2006-04-20 | Thermo Fisher Scientific Oy | Method for automatically detecting factors that disturb analysis by a photometer |
| US9395300B2 (en) | 2011-07-18 | 2016-07-19 | Siemens Healthcare Diagnostics Products Gmbh | Method and system for determining the concentration of substances in body fluids |
| EP2549264A1 (en) | 2011-07-18 | 2013-01-23 | Siemens Healthcare Diagnostics Products GmbH | Method and system for determining the concentration of substances in bodily fluids |
| WO2013010970A1 (en) | 2011-07-18 | 2013-01-24 | Siemens Healthcare Diagnostics Products Gmbh | Method and system for determining the concentration of substances in body fluids |
| CN103649721A (en) * | 2011-07-18 | 2014-03-19 | 西门子医学诊断产品有限责任公司 | Method and system for determining the concentration of substances in body fluids |
| CN105823739A (en) * | 2015-01-27 | 2016-08-03 | 西门子医学诊断产品有限责任公司 | Method for determining lipids and other interfering substances in body fluid samples |
| EP3051271A1 (en) | 2015-01-27 | 2016-08-03 | Siemens Healthcare Diagnostics Products GmbH | Method for assaying lipids and other interferents in body fluid samples |
| EP3051272A2 (en) | 2015-01-27 | 2016-08-03 | Siemens Healthcare Diagnostics Products GmbH | Method for assaying lipids and other interferents in body fluid samples |
| EP3051272A3 (en) * | 2015-01-27 | 2016-10-26 | Siemens Healthcare Diagnostics Products GmbH | Method for assaying lipids and other interferents in body fluid samples |
| US9594076B2 (en) | 2015-01-27 | 2017-03-14 | Siemens Healthcare Diagnostics Products Gmbh | Method for determining lipids and other interfering substances in body fluid samples |
| CN106018400A (en) * | 2015-03-31 | 2016-10-12 | 希森美康株式会社 | Sample analyzer, sample analyzing method, and control device |
| CN106018400B (en) * | 2015-03-31 | 2019-01-22 | 希森美康株式会社 | Device for analyzing samples, method of sample analysis and control device |
| CN105116156A (en) * | 2015-07-22 | 2015-12-02 | 江苏英诺华医疗技术有限公司 | Optimized biochemical detection method suitable for medical examination |
| EP3165900A1 (en) | 2015-11-09 | 2017-05-10 | F. Hoffmann-La Roche AG | Multi-wavelength illumination for spectral interference detection |
| EP3290905A1 (en) * | 2016-09-05 | 2018-03-07 | F. Hoffmann-La Roche AG | Signal offset determination and correction |
| US10458997B2 (en) | 2016-09-05 | 2019-10-29 | Roche Diagnostics Operations, Inc. | Signal offset determination and correction |
| EP3591378A1 (en) | 2018-07-03 | 2020-01-08 | Siemens Healthcare Diagnostics Products GmbH | Method for assaying lipids, haemoglobin and bilirubin in body fluid samples |
Also Published As
| Publication number | Publication date |
|---|---|
| WO2000077494A1 (en) | 2000-12-21 |
| EP1185852A1 (en) | 2002-03-13 |
| US6882425B1 (en) | 2005-04-19 |
| JP2003502631A (en) | 2003-01-21 |
Similar Documents
| Publication | Publication Date | Title |
|---|---|---|
| US6882425B1 (en) | Method and apparatus for examining fluids of biological origin | |
| JP3994143B2 (en) | Pre-test differentiation method and apparatus for rapid spectrophotometry of specimens for hematology analyzers | |
| US4125372A (en) | Method and device for testing liquids | |
| US5083283A (en) | Method of determining calibration curve and apparatus using calibaration curve | |
| US6353471B1 (en) | Method and apparatus for non-destructive screening of specimen integrity | |
| US4669878A (en) | Automatic monochromator-testing system | |
| US7663738B2 (en) | Method for automatically detecting factors that disturb analysis by a photometer | |
| CA1127865A (en) | Method and device for analysis with color identification test paper | |
| EP0967954B1 (en) | APPARATUS FOR determining the concentration of INTERFERENTS IN PLASMA | |
| US6522398B2 (en) | Apparatus for measuring hematocrit | |
| EP0975976B1 (en) | Calibrator material for instruments which measure interferents in serum and plasma specimens | |
| EP0769691A2 (en) | Apparatus for urine analysis | |
| EP1023583B1 (en) | Method for measurement of blood substitutes | |
| US20070190637A1 (en) | Apparatus for handling fluids | |
| JP4366261B2 (en) | Method for determining presence / absence of abnormality in measurement reaction process, automatic analyzer capable of executing the method, and storage medium storing program of the method | |
| JP2023539444A (en) | Circuit board with built-in light source | |
| JP2007285922A (en) | Clinical blood examination method using near infrared ray | |
| CA2323442C (en) | Method and apparatus for measuring proteins | |
| JP2005127757A (en) | Automatic analyzer | |
| US20020110487A1 (en) | Apparatus and method for handling fluids | |
| JPH0735744A (en) | Analytic method for urine | |
| KR101893219B1 (en) | Body fluid analyzing method and body fluid analyzing system using the same | |
| EP0186704A1 (en) | Automatic monochromator-testing system | |
| JP2004045096A (en) | Apparatus for determining bio-component | |
| EP0762108A2 (en) | Method of and apparatus for measuring ketone concentration in organism |
Legal Events
| Date | Code | Title | Description |
|---|---|---|---|
| PUAI | Public reference made under article 153(3) epc to a published international application that has entered the european phase |
Free format text: ORIGINAL CODE: 0009012 |
|
| AK | Designated contracting states |
Kind code of ref document: A1 Designated state(s): AT BE CH CY DE DK ES FI FR GB GR IE IT LI LU MC NL PT SE |
|
| AX | Request for extension of the european patent |
Free format text: AL;LT;LV;MK;RO;SI |
|
| AKX | Designation fees paid | ||
| STAA | Information on the status of an ep patent application or granted ep patent |
Free format text: STATUS: THE APPLICATION IS DEEMED TO BE WITHDRAWN |
|
| REG | Reference to a national code |
Ref country code: DE Ref legal event code: 8566 |
|
| 18D | Application deemed to be withdrawn |
Effective date: 20010614 |