TECHNICAL FIELD
-
This invention relates to techniques for
detection probes and method of detection for
detecting a specimen that has specified
polynucleotide base (DNA, RNA or the like ), by
mixing detection probes, which are labeled with
fluorescent dyes and can be bound to the
specimen,into a specimen sample containing a
specimen and measuring the fluorescence emitted by
the specimen sample.
BACKGROUND ART
-
For methods for detecting and quantifying DNAs
or RNAs having specified base sequences present in
samples, methods utilizing "detection probes" that
specifically hybridize to DNAs or RNAs, which are
the subject of detection, are widely in use.
Oligonucleotide nucleic acids having base sequences
complementary to parts of the base sequences for
DNAs or RNAs (target nucleic acids), which are the
subject of detection, are frequently used as
detection probes.
-
In these methods, after hybrids between
detection probes and target nucleic acids have been
formed, any changes resulting from the formation of
the hybrids are detected, thereby confirming that
the target nucleic acids to be the subject of
detection are contained in samples and quantifying
their contents. For example, a detection probe is
labeled with a fluorescent dye. This fluorescent
labeled detection probe(fluorescent labeled
oligonucleotide nucleic acid) is added to a sample.
If a target nucleic acid is present in the sample,
the fluorescent labeled detection probe binds to the
target nucleic acid to form a hybrid. Then, a
manipulation is performed to separate the
fluorescent labeled detection probe that does not
bind from the fluorescent labeled detection probe
that has been hybridized to the target nucleic acid
in the sample, thereby removing the fluorescent
labeled detection probe that does not bind in the
sample. Here, if the fluorescence intensity of the
sample is measured, it will enable the amount of the
target nucleic acid in the sample to be quantified.
-
The above-described method needs a manipulation
for removing the detection probe that does not bind
to the target nucleic acid after the detection probe
has been added to the sample. Because such a
manipulation for separation is complicated in
practice, a variety of assays that do not require
manipulations for separating non-bound probes from
bound probes after addition of probes have been
attempted(homogeneous assays).
-
One of the homogeneous assays is a method that
utilizes resonance energy transfer occurring between
two kinds of fluorescent molecules. Generally, when
two kinds of fluorescent molecules are within a
distance of about 70-80 angstroms, interaction
between the fluorescent molecules occurs(resonance
energy transfer) and thus their fluorescence
spectrum or fluorescence decay curve changes. In a
fluorescence spectrum, the fluorescence intensity
resulting from a donor (in general between the two
kinds of fluorescent molecules, the molecule whose
absorption spectrum is on the shorter wavelength
side) decreases, whereas the fluorescence intensity
resulting from an acceptor (between the two kinds of
fluorescent molecules, the molecule whose absorption
is on the longer wavelength side) increases. Also,
with respect to changes in the fluorescence decay
curve after pulse-excitation, decay for the donor
accelerates, whereas decay for the acceptor delays.
-
Some attempts are made to utilize this
resonance energy transfer between fluorescent
molecules in the homogeneous assays for nucleic
acids. Specifically, two kinds of fluorescent
labeled detection probes(those individually labeled
with different kinds of fluorescent dye molecules)
are provided and these hybridize to a target nucleic
acid adjacently with each other. The energy
transfer occurs to cause changes in the fluorescence
spectrum, because the two kinds of fluorescent dyes
are within a close distance in a hybrid. Namely,
the fluorescence spectrum changes as a result of the
formation of the hybrid comprising the two kinds of
fluorescent labeled detection probes and the target
nucleic acid, which will enable the detection of the
target nucleic acid by measuring the change in the
fluorescence spectrum (Cardullo, R.A., et al. (1988)
Proc. Natl. Acad. Sci. USA. 85, 8790-8794,
EP0070685). USP 4996143 discloses oligonucleotide
probes labeled with fluorescence dyes suited for
methods of detecting target nucleic acids based on
measurement of changes in fluorescence spectra.
-
Accordingly, the method to measure any change
in a fluorescence spectrum caused by the energy
transfer is useful for the homogeneous assays of
nucleic acids. However, if the amount of detection
probes in a sample (the number of their molecules)
exceeds that of a target nucleic acid (the number of
its molecules), practically it becomes very
difficult to use the above-described method for
detecting a target nucleic acid based on changes in
a fluorescence spectrum. Namely, the fluorescence
spectrum to be measured is the sum of a fluorescence
spectrum resulting from a small number of
fluorescent dye molecules that has undergone the
energy transfer and a fluorescence spectrum
resulting from a large number of fluorescent dye
molecules that has not undergone the energy transfer.
Thus, the fluorescence spectrum resulting from the
small number of fluorescent dye molecules that has
undergone the energy transfer is buried in the
fluorescence spectrum resulting from the large
number of fluorescent dye molecules that has not
undergone the energy transfer, which makes it
practically impossible to detect any changes in the
fluorescence spectrum caused by the energy transfer.
-
It quite often happens in the actual
measurement of biological samples that the amounts
of detection probes exceed those of nucleic acids
(target nucleic acids), which are the subject of
detection. One such example is that the amount of a
target nucleic acid in a sample is unknown. Also,
the concentrations of detection probes in samples
can not be lowered below certain levels, because
sensitivity in measurement depends on the
fluorescence intensities of the samples. Thus, when
the amounts of the target nucleic acids are very
small (low concentrations), the amounts of the
detection probes exceed those of the target nucleic
acids.
-
Accordingly, there is a need for the method
that will allow the highly accurate detection of a
nucleic acid, which is the subject of detection,
even under the conditions where detection probes are
present in excess relative to a nucleic acid, which
is the subject of detection.
-
In general, among methods for detecting and
measuring energy transfer between fluorescent
molecules, there are a method to measure any changes
in a fluorescence spectrum and a method to measure
any changes in the decay curve of fluorescence
intensities after pulse excitation (time-resolution
method). Where fluorescent molecules that have
undergone the energy transfer and the same kind of
fluorescent molecules that have not undergone the
energy transfer coexist, it often happens that the
method to measure a fluorescence decay curve (time-resolved
measurement) is more advantageous than the
method to measure changes in a fluorescence spectrum
(Morrison, L.E. (1980) Anal. Chem. 174 101-120;
Japanese Laid-Open Patent Application Hei 7-229835).
The fluorescence decay of an acceptor delays due to
the energy transfer. Morrison disclosed that when
the delay in decay is sufficiently large, it is
possible to selectively measure the fluorescence
resulting from the acceptor excited by the energy
transfer by measuring fluorescence intensities in a
time zone after the fluorescence decay resulting
from the acceptor directly excited is substantially
complete. In Japanese Laid-Open Patent Application
Hei 7-229835, there is provided a method for
calibrating errors in detection that are caused by
mixing of fluorescence resulting from a donor into
the fluorescence wavelength region of an acceptor,
said method measuring fluorescence decay in the
fluorescence wavelength of the donor in addition to
fluorescence decay in the fluorescence wavelength
region of the acceptor.
-
Furthermore, in Japanese Laid-Open Patent
Application Hei 7-229835 it is stated that if the
method of Hei 7-229835 (a method to detect energy
transfer between fluorescent molecules through
time-resolved measurement) is applied to a
homogeneous assay of nucleic acids, the detection of
a target nucleic acid is feasible even under the
conditions where detection probes are present in
excess relative to a target nucleic acid. However,
there is no mention of the requirements that the
detection probes to be used in said method should
satisfy.
DISCLOSURE OF INVENTION
-
This invention relates to the fluorescent
labeled detection probes wherein the fluorescence
decay of a fluorescent dye as an acceptor is
sufficiently delayed when two kinds of detection
probes labeled with fluorescent dyes are hybridized
to the same specimen (target nucleic acid)
adjacently with each other to form a hybrid and
energy transfer occurs between the two kinds of
fluorescent dye molecules.
-
This invention also provides a method for
detecting a target nucleic acid with high
sensitivity by the use of said probes. This has
enabled the detection of the target nucleic acid
with high sensitivity and great accuracy under the
conditions where the detection probes are present in
excess relative to the target nucleic acid.
-
In order to be able to detect a target nucleic
acid with high sensitivity under the conditions
where detection probes are present in excess
relative to the target nucleic acid by utilizing the
energy transfer, it was thought that the
fluorescence decay of an acceptor which forms a
hybrid with a detection probe labeled with a donor
fluorescent dye and a target nucleic acid and is
excited by the energy transfer needs to be delayed
to a large extent as compared with the fluorescence
decay of an acceptor excited directly.
-
It was discovered that in the hybrid formed
from the two kinds of fluorescent labeled detection
probes and the target nucleic acid, the magnitude of
the delay in the fluorescence decay of the acceptor
excited by the energy transfer largely depended on
the following factors: (1) the base number between
the two nucleotides, one of which is conjugated with
the donor fluorescent dye molecule on the one
detection probe and the other of which is conjugated
with acceptor flourescent dye molecule on the other
detection probe (which defines the mean distance
between the two fluorescent dye molecules); (2) the
structure of spacing (double-stranded or single-stranded)
between the two nucleotides, one of which
is conjugated with the donor fluorescent dye
molecule on the one detection probe and the other of
which is conjugated with acceptor flourescent dye
molecule on the other detection probe; (3) the
positions of the nucleotides, which the fluorescent
dye molecules were conjugated with, on the detection
probes; and (4) the kinds of the fluorescent dye
molecules. Based on these findings for detection
probes, a combination of suitable fluorescent dyes
was chosen, the base number was selected so that the
distance between the two kinds of fluorescent dye
molecules could be appropriate at formation of a
hybrid, and the structure between the two
nucleotides to which the fluorescent dye molecules
bound in a hybrid was appropriately set. This
successfully led to the discoveries of a method and
detection probes that will enable the detection of a
target nucleic acid with high sensitivity in a
sample where the detection probes are present in
excess relative to the target nucleic acid.
-
The requirements for detection probes used to
detect energy transfer through measurement of
changes in a fluorescence decay curve (according to
this invention) greatly differs from those for
detection probes used to detect the energy transfer
through measurement of changes in a fluorescence
spectrum (as disclosed in USP 4996143).
-
The amounts of changes in a fluorescence
spectrum (decreasing quantity of fluorescence
resulting from of a donor and increasing quantity of
fluorescence resulting from an acceptor) become
greater as energy transfer efficiency increases.
The energy transfer efficiency is in inverse
proportion to the sixth power of the distance
between a donor and an acceptor; therefore, to
accurately detect the energy transfer based on the
changes in the fluorescence spectrum, the distance
between the donor and the acceptor is desirably made
as close as possible in an actual sample. USP
4996143 describes that the distance (base number)
between a donor dye and an acceptor dye which
substantially makes the detection of the energy
transfer possible is "two to seven bases" and that
the smaller the base number is, the better the
detection. By contrast, it was realized that a
median degree of the energy transfer efficiency (on
the order of 50%) is most desirable when the energy
transfer is detected by the measurement of delays in
the fluorescence decay curve of an acceptor. As the
energy transfer efficiency becomes higher, the
quantity of fluorescence from the acceptor increases,
whereas the delay in the fluorescence decay of the
aceptor grows smaller. The increase in the quantity
of fluorescence facilitates the detection of a
change in the decay curve, but the smaller delay in
decay renders the detection of the change difficult.
In view of these two contradicting factors, either
of too high energy transfer efficiency and too low
efficiency is unsuitable for the detection of a
specimen. In other words, for the purpose of
detection of a specimen the distance (base number)
between the donor dye and the acceptor dye at the
time of hybrid formation is most desirably that
which brings a median degree of the energy transfer
efficiency (as will be described later, see FIG. 2).
For example, when a combination of Bodipy 493/503
(donor) and Cy5 (acceptor) was used as fluorescent
dyes, this distance proved to be "from 10 to 12
bases" in terms of the base number in a hybrid: in
the case where the spacing between the two
nucleotides to which the dyes bind in the hybrid
adopts a double-stranded structure, as will be
described later.
-
Also, in few instances the distance between a
donor dye and an acceptor dye is fixed in an actual
sample, and it frequently fluctuates with time.
Such fluctuations in the distance between the donor
dye and the acceptor dye are caused by movement of
the dye molecules or the like and their magnitude or
speed greatly differs depending on the structure of
a hybrid. Because the amount of a change in a
fluorescence spectrum caused by the formation of the
hybrid is determined by the mean distance (mean
energy transfer efficiency) between a donor and an
acceptor in the hybrid, thus far there has been
little necessity for giving consideration to the
magnitude of fluctuations in the distance between
the dyes in the hybrid formed when the properties of
detection probes were investigated. By contrast, a
fluorescence decay curve generally depends on
fluctuations of the distance between two dyes and
their distribution. In reality, the fluorescence
decay curve of fluorescent dye molecules on
detection probes having formed a hybrid was found to
heavily depend on the boundary of movement of the
dye molecules defined by the structure of the hybrid.
Consequently, it has become clear that to design
detection probes such that in the hybrid the spacing
between the two nucleotides to which the fluorescent
dyes bind adopts a double-stranded structure
throughout and to locate the labeling position of
one of the fluorescent dyes at a termini of the
oligonucleotide are most desirable for the purpose
of detection of a specimen.
-
This invention relates to the finding of
detection probes that are suited for the detection
of a specimen by time-resolved measurement of the
energy transfer (i.e., a method to measure changes
in a fluorescence decay curve) with a view to
enabling the detection with great accuracy, of a
specimen under the conditions where the detection
probes are in large excess in the specimen.
-
Specifically, this invention provides:
- a pair of detection probes for detecting a
specimen having a specified polynucleotide base
sequence, said pair of detection probes comprising:
- a donor probe to which a first fluorescent dye
molecule binds, having a base sequence capable of
hybridizing with a part of the polynucleotide base
sequence; and
- an acceptor probe to which a second fluorescent
dye molecule binds, having a base sequence capable
of hybridizing with a part of the polynucleotide
base sequence,
wherein a fluorescence decay curve resulting
from the donor probe and the acceptor probe
significantly changes when a hybrid among the donor
probe, the acceptor probe, and the specimen is
formed. -
-
Also, the invention provides the detection
probes as described above, wherein spacing between a
nucleotide to which the first fluorescent molecule
of the donor probe binds and a nucleotide to which
the second fluorescent molecule of the acceptor
probe binds is a double-stranded structure in the
hybrid.
-
Also, the invention provides the detection
probes as described above, wherein the donor probe
and the acceptor probe are hybridized to the
specimen sequentially and adjacently in the hybrid.
-
Also, the invention provides the detection
probes as described above, wherein either the first
fluorescent dye molecule or the second fluorescent
dye molecule is a terminal part at a side on which
the pair of detection probes sequentially
hybridizing on the specimen are adjacent with each
other.
-
Also, the invention provides the detection
probes as described above, wherein the donor probe
and the acceptor probe are hybridized to the
specimen and a part of spacing between a nucleotide
to which the first fluorescent dye molecule binds
and a nucleotide to which the second fluorescent dye
molecule binds adopts a double-stranded structure in
the hybrid formed from the pair of detection probes
and the specimen.
-
Also, the invention provides the detection
probes as described above, wherein a base number
between a nucleotide to which the first fluorescent
dye molecule binds and a nucleotide to which the
second fluorescent dye molecule binds is from 4 to
20 in the hybrid.
-
Also, the invention provides the detection
probes as described above, wherein a base number
between a nucleotide to which the first fluorescent
dye molecule binds and a nucleotide to which the
second fluorescent dye molecule binds is from 8 to
16 in the hybrid.
-
Also, the invention provides the detection
probes as described above, wherein the first
fluorescent dye molecule has either a fluorophore of
a 4,4-difluoro-4-boro-3a,4a-diaza-s-indacene type or
a fluorophore of a fluorescein type, and the second
fluorescent dye molecule has either a fluorophore of
an Indocyanine type or a fluorophore of a Rhodamine
type.
-
Also, the invention provides the detection
probes as described above, wherein the first
fluorescent dye molecule has a fluorophore of a 4,4-difluoro-4-boro-3a,4a-diaza-s-indacene
type and the
second fluorescent dye molecule has a fluorophore of
an Indocyanine type.
-
Further, this invention provides a method for
detecting a specimen having a specified
polynucleotide base sequence, said method
comprising:
- (1) the first step of forming a hybrid from the
specimen and a pair of detection probes, said pair
of detection probe comprising:
- a donor probe to which a first fluorescent dye
molecule binds, having a base sequence capable of
hybridizing with a part of the polynucleotide base
sequence; and
- an acceptor probe to which a second
fluorescent dye molecule binds, having a base
sequence capable of hybridizing with a part of the
polynucleotide base sequence;
- (2) the second step of measuring a decay curve
of fluorescence intensities for the hybrid in a
wavelength region of fluorescence resulting from the
second fluorescent dye;
- (3) the third step of measuring a decay curve
of fluorescence intensities for the pair of
detection probes in a wavelength region of
fluorescence resulting from the second fluorescent
dye; and
- (4) the fourth step of detecting the presence
of the polynucleotide base sequence based on a
comparison between the fluorescence decay curve
obtained in the second step and the fluorescence
decay curve obtained in the third step.
-
-
Also, the invention provides the method for
detecting a specimen having a specified
polynucleotide base sequence as described above,
wherein spacing between a nucleotide to which the
first fluorescent dye molecule of the donor probe
binds and a nucleotide to which the second
fluorescent dye molecule of the acceptor probe binds
is a double-stranded structure in the hybrid.
-
Also, the invention provides the method for
detecting a specimen having a specified
polynucleotide base sequence as described above,
wherein the donor probe and the acceptor probe
hybridize to the specimen sequentially and
adjacently in the hybrid.
-
Also, the invention provides the method for
detecting a specimen having a specified
polynucleotide base sequence as described above,
wherein either the first fluorescent dye molecule or
the second fluorescent dye molecule is a terminal
part at a side on which the pair of detection probes
sequentially hybridizing on the specimen are
adjacent with each other.
-
Also, the invention provides the method for
detecting a specimen having a specified
polynucleotide base sequence as described above,
wherein the donor probe and the acceptor probe
hybridize to the specimen and a part of spacing
between a nucleotide to which the first fluorescent
dye molecule binds and a nucleotide to which the
second fluorescent dye molecule binds adopts a
double-stranded structure in the hybrid formed from
the pair of detection probes and the specimen.
-
Also, the invention provides the method for
detecting a specimen having a specified
polynucleotide base sequence as described above,
wherein a base number between a nucleotide to which
the first fluorescent dye molecule binds and a
nucleotide to which the second fluorescent dye
molecule binds is from 4 to 20 in the hybrid.
-
Also, the invention provides the method for
detecting a specimen having a specified
polynucleotide base sequence as described above,
wherein a base number between a nucleotide to which
the first fluorescent dye molecule binds and a
nucleotide to which the second fluorescent dye
molecule binds is from 8 to 16 in the hybrid.
-
Also, the invention provides the method for
detecting a specimen having a specified
polynucleotide base sequence as described above,
wherein the first fluorescent dye molecule has
either a fluorophore of a 4,4-difluoro-4-boro-3a,4a-diaza-s-indacene
type or a fluorophore of a
fluorescein type and the second fluorescent dye
molecule has either a fluorophore of an Indocyanine
type or a fluorophore of a Rhodamine type.
-
Also, the invention provides the method for
detecting a specimen having a specified
polynucleotide base sequence as described above,
wherein the first fluorescent dye molecule has a
fluorophore of a 4,4-difluoro-4-boro-3a,4a-diaza-s-indacene
type and the second fluorescent dye
molecule has a fluorophore of an Indocyanine type.
BRIEF DESCRIPTION OF DRAWINGS
-
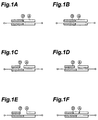
- FIG. 1A illustrates one of several embodiments
of detection probes according to this invention
where in a hybrid, the spacing between the two
nucleotides to which fluorescent dye molecules bind
adopts a double-stranded structure and one of the
fluorescent dye molecules is labeled (or bound) at a
terminal part facing the adjacent part of the other
probe. In the figure the positions of the donor and
acceptor dyes are mutually interchangeable.
- FIG. 1B illustrates one of several embodiments
of detection probes according to the invention where
in a hybrid, the spacing between two nucleotides to
which fluorescent dye molecules bind adopts a
double-stranded structure and both of the
fluorescent dye molecules are labeled (or bound) at
middle parts of the respective probes. In the
figure the positions of the donor and acceptor dyes
are mutually interchangeable.
- FIG. 1C illustrates one of several embodiments
of detection probes according to the invention where
in a hybrid, the spacing between two nucleotides to
which fluorescent dye molecules bind is partially a
double-stranded structure, one of the fluorescent
dye molecules is labeled at a terminal part facing
the adjacent part of the other probe and the other
fluorescent dye molecule is labeled at a middle part
of said probe. In the figure the positions of the
donor and acceptor dyes are mutually
interchangeable.
- FIG. 1D illustrates one of several embodiments
of detection probes according to the invention where
in a hybrid, the spacing between two nucleotides to
which fluorescent dye molecules bind is partially a
double-stranded structure and both of the
fluorescent dye molecules are labeled at middle
parts of the respective probes. In the figure the
positions of the donor and acceptor dyes are
mutually interchangeable.
- FIG. 1E illustrates one of several embodiments
of detection probes according to the invention where
in a hybrid, the spacing between two nucleotides to
which fluorescent dye molecules bind is a single-stranded
structure and both of the fluorescent dye
molecules are labeled at terminal parts of the
respective probes facing the adjacent parts of the
other probes. In the figure the positions of the
donor and acceptor dyes are mutually interchangeable.
- FIG. 1F illustrates one of several embodiments
of detection probes according to the invention where
in a hybrid, a third probe (not labeled with
fluorescence) is introduced into the hybrid so that
the spacing between the two nucleotides to which
fluorescent dye molecules bind may adopt a double-stranded
structure. In the figure the positions of
the donor and acceptor dyes are mutually
interchangeable.
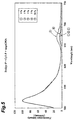
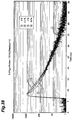
- FIG. 2 is a graph illustrating a comparison of
accuracy in detecting a specimen (target nucleic
acid) by various detection probes according to the
invention. In the detection probes the following
factors are varied: (1) the kinds of combination of
fluorescent dye molecules; (2) whether the spacing
between the two nucleotides to which the fluorescent
dye molecules bind in a hybrid is made single-stranded
or double-stranded; (3) the base number
between the two nucleotides to which the fluorescent
dye molecules bind in the hybrid (abscissa in the
figure). Employing these detection probes, changes
in fluorescence decay curves in the fluorescence
wavelength region of the acceptors caused by the
formation of hybrids with the specimen were measured.
The ordinate in the figure (Δτ/σΔτ) is a parameter
comparatively representing S/N to distinguish
fluorescence decay curves in the presence of the
specimen from those in the absence of the specimen.
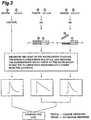
- FIG. 3 is a schematic diagram illustrating
detection of the presence of a specimen by using
detection probes and method of detection according
to the invention.
- FIG. 4 shows the fluorescence decay curves in
the fluorescence wavelength region of an acceptor
when a pair of detection probes (oligo-DNAs labeled
with fluorescence dye molecules) was mixed with
target DNA to be the specimen in such varying
proportions as to render the probes excessive. The
detection probes used are as follows: the donor
fluorescent dye is Bodipy 493/503 and the acceptor
fluorescent dye is Cy5; at the time of hybrid
formation the nucleotide to which the donor
fluorescent dye binds and the nucleotide to which
the acceptor fluorescent dye binds are spaced by 12
bases; and its spacing is double-stranded. The
proportions of the target DNA to the probes are as
follows: (1) 0%, (2) 1%, (3) 3%, (4) 5%, and (5) 20%
(target DNA/probe, molar ratio).
- FIG. 5 shows the fluorescence spectra of the
samples shown in FIG. 4: a pair of detection probes
and a target DNA to be the specimen were mixed in
such varying proportions as to render the probes
excessive. The detection probes used are as
follows: the donor fluorescent dye is Bodipy 493/503
and the acceptor fluorescent dye is Cy5; at the time
of hybrid formation the nucleotide to which the
donor fluorescent dye binds and the nucleotide to
which the acceptor fluorescent dye binds are spaced
by 12 bases; and its spacing is double-stranded.
The proportions of the target DNA to the probes are:
(1) 0%, (2) 1%, (3) 3%, (4) 5%, and (5) 20% (target
DNA/probe, molar ratio).
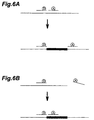
- FIG. 6A is a schematic diagram illustrating one
of the examples where detection probes and method of
detection by the use of the probes according to the
invention are applied, indicating that they can be
used to detect any change by which a different DNA
fragment is incorporated into a specified site of
DNA during alternations of the primary structure of
a nucleic acid.
- FIG. 6B is a schematic diagram illustrating one
of the examples where detection probes and method of
detection by the use of the probes according to the
invention are applied, indicating that they can be
used to detect any change by which a different DNA
fragment is incorporated into a specified site of
DNA during alternations of the primary structure of
a nucleic acid.
- FIG. 7 is a schematic diagram illustrating one
of the examples where detection probes and method of
detection by the use of the probes according to the
invention are applied, indicating that they can be
used to detect any change (inversion) by which the
direction of a specified site of DNA is inverted
during alternations of the primary structure of a
nucleic acid.
- FIG. 8 is a schematic diagram illustrating one
of the examples where detection probes and method
of detection by the use of the probes according to
the invention are applied, indicating that they can
be used to detect any change by which a specified
site of DNA is deleted during alternations of the
primary structure of a nucleic acid.
- FIG. 9 shows the obtained fluorescence decay
curve of a hybrid which was formed with a pair of
detection probes and the target DNA when the
following pair was used as detection probes. Namely,
Bodipy 493/503 was used as a donor fluorescent dye,
Cy5 as an acceptor fluorescent dye, Bodipy 493/503
was labeled at the 5'-end of the donor probe, and
Cy5 was labeled to a nucleotide in the middle part
of the acceptor probe. Also, the spacing between
the two nucleotides to which the fluorescent dyes
bind in a hybrid forms a double-strand. () denotes
the fluorescence decay curve when there were used
the detection probes where the base number between
the two nucleotides to which the fluorescent dyes
bound was four bases (n=4) in the hybrid. (▴)
denotes a pulse of excitation light.
- FIG. 10 shows the obtained fluorescence decay
curve of a hybrid which was formed with a pair of
detection probes and the target DNA when the
following pair was used as detection probes. Namely,
Bodipy 493/503 was used as a donor fluorescent dye,
Cy5 as an acceptor fluorescent dye, Bodipy 493/503
was labeled at the 5'-end of the donor probe, and
Cy5 was labeled to a nucleotide in the middle part
of the acceptor probe. Also, the spacing between
the two nucleotides to which the fluorescent dyes
bind in a hybrid forms a double-strand. () denotes
the fluorescence decay curve when there were used
the detection probes where the base number between
the two nucleotides to which the fluorescent dyes
bound was eight bases (n=8) in the hybrid. (▴)
denotes a pulse of excitation light.
- FIG. 11 shows the obtained fluorescence decay
curve of a hybrid which was formed with a pair of
detection probes and the target DNA when the
following pair was used as detection probes. Namely,
Bodipy 493/503 was used as a donor fluorescent dye,
Cy5 as an acceptor fluorescent dye, Bodipy 493/503
was labeled at the 5'-end of the donor probe, and
Cy5 was labeled to a nucleotide in the middle part
of the acceptor probe. Also, the spacing between
the two nucleotides to which the fluorescent dyes
bind in a hybrid forms a double-strand. () denotes
the fluorescence decay curve when there were used
the detection probes where the base number between
the two nucleotides to which fluorescent dyes bound
was 10 bases (n=10) in the hybrid. (▴) denotes a
pulse of excitation light.
- FIG. 12 shows the obtained fluorescence decay
curve of a hybrid which was formed with a pair of
detection probes and the target DNA when the
following pair was used as detection probes. Namely,
Bodipy 493/503 was used as a donor fluorescent dye,
Cy5 as an acceptor fluorescent dye, Bodipy 493/503
was labeled at the 5'-end of the donor probe, and
Cy5 was labeled to a nucleotide in the middle part
of the acceptor probe. Also, the spacing between
the two nucleotides to which the fluorescent dyes
bind in a hybrid forms a double-strand. () denotes
the fluorescence decay curve when there were used
the detection probes where the base number between
the two nucleotides to which the fluorescent dyes
bound was 12 bases (n=12) in the hybrid. (▴)
denotes a pulse of excitation light.
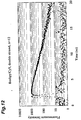
- FIG. 13 shows the obtained fluorescence decay
curve of a hybrid which was formed with a pair of
detection probes and the target DNA when the
following pair was used as detection probes. Namely,
Bodipy 493/503 was used as a donor fluorescent dye,
Cy5 as an acceptor fluorescent dye, Bodipy 493/503
was labeled at the 5'-end of the donor probe, and
Cy5 was labeled to a nucleotide in the middle part
of the acceptor probe. Also, the spacing between the
two nucleotides to which the fluorescent dyes bind
in a hybrid forms a double-strand. () denotes the
fluorescence decay curve when there were used the
detection probes where the base number between the
two nucleotides to which the fluorescent dyes bound
was 14 bases (n=14) in the hybrid. (▴) denotes a
pulse of excitation light.
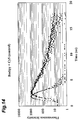
- FIG. 14 shows the fluorescence decay curve of
the detection probes (specimen DNA not contained),
which is a control fluorescence decay curve ()
against FIGs. 9-13. (▴) denotes a pulse of
excitation light.
- FIG. 15 shows the obtained fluorescence decay
curve of a hybrid which was formed with a pair of
detection probes and the target DNA () when the
following pair was used as detection probes. Namely,
Bodipy 493/503 was used as a donor fluorescent dye,
Cy5 as an acceptor fluorescent dye, Bodipy 493/503
was labeled at the 5'-end of the donor probe, and
Cy5 was labeled to a nucleotide in the middle part
of the acceptor probe. The two nucleotides to which
the fluorescent dyes bind are spaced by 10 bases
(n=10) in a hybrid. () denotes the fluorescence
decay curve when there were used the detection
probes where the spacing between the two nucleotides
to which the fluorescent dyes bound was double-stranded
throughout in the hybrid. (▴) denotes a
pulse of excitation light.
- FIG. 16 shows the obtained fluorescence decay
curve of a hybrid which was formed with a pair of
detection probes and the target DNA () when the
following pair was used as detection probes. Namely,
Bodipy 493/503 was used as a donor fluorescent dye,
Cy5 as an acceptor fluorescent dye, Bodipy 493/503
was labeled at the 5'-end of the donor probe, and
Cy5 was labeled to a nucleotide in the middle part
of the acceptor probe. The two nucleotides to which
the fluorescent dyes bound are spaced by 10 bases
(n=10) in a hybrid. () denotes the fluorescence
decay curve when there were used the detection
probes where the spacing between the two nucleotides
to which the fluorescent dyes bound consisted of a
single-stranded portion with two bases and a double-stranded
portion with eight bases in the hybrid.
(▴) denotes a pulse of excitation light.
- FIG. 17 shows the obtained fluorescence decay
curve of a hybrid which was formed with a pair of
detection probes and the target DNA () when the
following pair was used as detection probes. Namely,
Bodipy 493/503 was used as a donor fluorescent dye,
Cy5 as an acceptor fluorescent dye, Bodipy 493/503
was labeled at the 5'-end of the donor probe, and
Cy5 was labeled to a nucleotide in the middle part
of the acceptor probe. The two nucleotides to which
the fluorescent dyes bind are spaced by 10 bases
(n=10) in a hybrid. () denotes the fluorescence
decay curve when there were used the detection
probes where the spacing between the two nucleotides
to which the fluorescent dyes bound consisted of a
single-stranded portion with four bases and a
double-stranded portion with six bases in the hybrid.
(▴) denotes a pulse of excitation light.
- FIG. 18 shows the obtained fluorescence decay
curve of a hybrid which was formed with a pair of
detection probes and the target DNA () when the
following pair was used as detection probes. Namely,
Bodipy 493/503 was used as a donor fluorescent dye,
Cy5 as an acceptor fluorescent dye, Bodipy 493/503
was labeled at the 5'-end of the donor probe, and
Cy5 was labeled to a nucleotide in the middle part
of the acceptor probe. The two nucleotides to which
the fluorescence dyes bind are spaced by 10 bases
(n=10) in a hybrid. () denotes the fluorescence
decay curve when there were used the detection
probes where the spacing between the two nucleotides
to which the fluorescent dyes bound consisted of a
single-stranded portion with six bases and a double-stranded
portion with four bases in the hybrid. (▴)
denotes a pulse of excitation light
- FIG. 19 shows the fluorescence decay curve of
the detection probes (specimen DNA not contained),
which is a control fluorescence decay curve ()
against FIGs. 15-18. (▴) denotes a pulse of
excitation light.
- FIG. 20 shows the obtained fluorescence decay
curve of a hybrid which was formed with a pair of
detection probes and the target DNA () when the
following pair was used as detection probes. Bodipy
493/503 was used as a donor fluorescent dye, and Cy5
as an acceptor fluorescent dye. The two nucleotides
to which the fluorescent dyes bind are spaced by 10
bases (n=10) in a hybrid and its spacing forms a
double-strand. () denotes the fluorescence decay
curve when there were used the detection probes
where the labeling position of Bodipy 493/503 was at
the 5'-end of the donor probe (i.e., Bodipy 493/503
was bound to the nucleotide at which the two probes
adjoined in the hybrid). The labeling position of
Cy5 in the acceptor probe is at its position where n
equals to 10 (intermediate labeling). (▴) denotes a
pulse of excitation light.
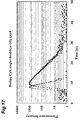
- FIG. 21 shows the obtained fluorescence decay
curve of a hybrid which was formed with a pair of
detection probes and the target DNA () when the
following pair was used as detection probes. Bodipy
493/503 was used as a donor fluorescent dye, and Cy5
as an acceptor fluorescent dye. The two nucleotides
to which the fluorescent dyes bind are spaced by 10
bases (n=10) in a hybrid and its spacing forms a
double-strand. () denotes the fluorescence decay
curve when there were used the detection probes
where the labeling position of Bodipy 493/503 in the
donor probe was set at a position shifted one base
inside from the position of a gap of the two probes
(i.e., the position facing the acceptor probe: the
5'-end of the donor probe) in the hybrid. The
labeling position of Cy5 in the acceptor probe is at
its position where n equals to 10 (intermediate
labeling). (▴) denotes a pulse of excitation light.
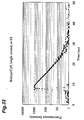
- FIG. 22 shows the obtained fluorescence decay
curve of a hybrid which was formed with a pair of
detection probes and the target DNA () when the
following pair was used as detection probes. Bodipy
493/503 was used as a donor fluorescent dye, and Cy5
as an acceptor fluorescent dye. The two nucleotides
to which the fluorescent dyes bind are spaced by 10
bases (n=10) in a hybrid and its spacing forms a
double-strand. () denotes the fluorescence decay
curve when there were used the detection probes
where the labeling position of Bodipy 493/503 in the
donor probe was set at a position shifted two bases
inside from the position of a gap of the two probes
(i.e., the position facing the acceptor probe: the
5'-end of the donor probe) in the hybrid. The
labeling position of Cy5 in the acceptor probe is at
its position where n equals to 10 (intermediate
labeling). (▴) denotes a pulse of excitation light.
- FIG. 23 shows the obtained fluorescence decay
curve of a hybrid which was formed with a pair of
detection probes and the target DNA () when the
following pair was used as detection probes. Bodipy
493/503 was used as a donor fluorescent dye, and Cy5
as an acceptor fluorescent dye. The two nucleotides
to which the fluorescent dyes bind are spaced by 10
bases (n=10) in a hybrid and its spacing forms a
double-strand. () denotes the fluorescence decay
curve when there were used the detection probes
where the labeling position of Bodipy 493/503 in the
donor probe was set at a position shifted four bases
inside from the position of a gap of the two probes
(i.e., the position facing the acceptor probe: the
5'-end of the donor probe) in the hybrid. The
labeling position of Cy5 in the acceptor probe is at
its position where n equals to 10 (intermediate
labeling). (▴) denotes a pulse of excitation light.
- FIG. 24 shows the fluorescence decay curve of
the detection probes (specimen DNA not contained),
which is a control fluorescence decay curve ()
against FIGs. 20-23. (▴) denotes a pulse of
excitation light.
- FIG. 25 shows the obtained fluorescence decay
curve of a hybrid which was formed with a pair of
detection probes and the target DNA () when the
following pair was used as detection probes. Namely,
Bodipy 493/503 was used as a donor fluorescent dye,
Cy3.5 as an acceptor fluorescent dye, Bodipy 493/503
was labeled at the 5'-end of the donor probe, and
Cy3.5 was labeled to a nucleotide in the middle part
of the acceptor probe. Also, the spacing between
the two nucleotides to which the fluorescent dyes
bind in a hybrid forms a double-strand. () denotes
the fluorescence decay curve when there were used
the detection probes where the base number between
the two nucleotides to which the fluorescent dyes
bound was eight bases in the hybrid. (▴) denotes a
pulse of excitation light.
- FIG. 26 shows the obtained fluorescence decay
curve of a hybrid which was formed with a pair of
detection probes and the target DNA () when the
following pair was used as detection probes. Namely,
Bodipy 493/503 was used as a donor fluorescent dye,
Cy3.5 as an acceptor fluorescent dye, Bodipy 493/503
was labeled at the 5'-end of the donor probe, and
Cy3.5 was labeled to a nucleotide in the middle part
of the acceptor probe. Also, the spacing between
the two nucleotides to which the fluorescent dyes
bind in a hybrid forms a double-strand. () denotes
the fluorescence decay curve when there were used
the detection probes where the base number between
the two nucleotides to which the fluorescent dyes
bound was 12 bases (n=12) in the hybrid. (▴)
denotes a pulse of excitation light.
- FIG. 27 shows the obtained fluorescence decay
curve of a hybrid which was formed with a pair of
detection probes and the target DNA () when the
following pair was used as detection probes. Namely,
Bodipy 493/503 was used as a donor fluorescent dye,
Cy3.5 as an acceptor fluorescent dye, Bodipy 493/503
was labeled at the 5'-end of the donor probe, and
Cy3.5 was labeled to a nucleotide in the middle part
of the acceptor probe. Also, the spacing between
the two nucleotides to which the fluorescent dyes
bind in a hybrid forms a double-strand. () denotes
the fluorescence decay curve when there were used
the detection probes where the base number between
the two nucleotides to which the fluorescent dyes
bound was 16 bases (n=16) in the hybrid. (▴)
denotes a pulse of excitation light.
- FIG. 28 shows the fluorescence decay curve of
the detection probes (specimen DNA not contained),
which is a control fluorescence decay curve ()
against FIGs. 25-27. (▴) denotes a pulse of
excitation light.
- FIG. 29 shows the obtained fluorescence decay
curve of a hybrid which was formed with a pair of
detection probes and the target DNA () when the
following pair was used as detection probes. Namely,
Bodipy 493/503 was used as a donor fluorescent dye,
Cy5 as an acceptor fluorescent dye, Bodipy 493/503
was labeled at the 5'-end of the donor probe, and
Cy5 was labeled to a nucleotide in the middle part
of the acceptor probe. Also, the spacing between
the two nucleotides to which the fluorescent dyes
bind in a hybrid forms a single-strand. () denotes
the fluorescence decay curve when there were used
the detection probes where the base number between
the two nucleotides to which the fluorescent dyes
bound was four bases (n=4) in the hybrid. (▴)
denotes a pulse of excitation light.
- FIG. 30 shows the obtained fluorescence decay
curve of a hybrid which was formed with a pair of
detection probes and the target DNA () when the
following pair was used as detection probes. Namely,
Bodipy 493/503 was used as a donor fluorescent dye,
Cy5 as an acceptor fluorescent dye, Bodipy 493/503
was labeled at the 5'-end of the donor probe, and
Cy5 was labeled to a nucleotide in the middle part
of the acceptor probe. Also, the spacing between
the two nucleotides to which the fluorescent dyes
bind in a hybrid forms a single-strand. () denotes
the fluorescence decay curve when there were used
the detection probes where the base number between
the two nucleotides to which the fluorescent dyes
bound was eight bases (n=8) in the hybrid. (▴)
denotes a pulse of excitation light.
- FIG. 31 shows the obtained fluorescence decay
curve of a hybrid which was formed with a pair of
detection probes and the target DNA () when the
following pair was used as detection probes. Namely,
Bodipy 493/503 was used as a donor fluorescent dye,
Cy5 as an acceptor fluorescent dye, Bodipy 493/503
was labeled at the 5'-end of the donor probe, and
Cy5 was labeled to a nucleotide in the middle part
of the acceptor probe. Also, the spacing between
the two nucleotides to which the fluorescent dyes
bind in a hybrid forms a single-strand. () denotes
the fluorescence decay curve when there were used
the detection probes where the base number between
the two nucleotides to which the fluorescent dyes
bound was 10 bases (n=10) in the hybrid. (▴)
denotes a pulse of excitation light.
- FIG. 32 shows the obtained fluorescence decay
curve of a hybrid which was formed with a pair of
detection probes and the target DNA () when the
following pair was used as detection probes. Namely,
Bodipy 493/503 was used as a donor fluorescent dye,
Cy5 as an acceptor fluorescent dye, Bodipy 493/503
was labeled at the 5'-end of the donor probe, and
Cy5 was labeled to a nucleotide in the middle part
of the acceptor probe. Also, the spacing between
the two nucleotides to which the fluorescent dyes
bind in a hybrid forms a single-strand. () denotes
the fluorescence decay curve when there were used
the detection probes where the base number between
the two nucleotides to which the fluorescent dyes
bound was 12 bases (n=12) in the hybrid. (▴)
denotes a pulse of excitation light.
- FIG. 33 shows the obtained fluorescence decay
curve of a hybrid which was formed with a pair of
detection probes and the target DNA () when the
following pair was used as detection probes. Namely,
Bodipy 493/503 was used as a donor fluorescent dye,
Cy5 as an acceptor fluorescent dye, Bodipy 493/503
was labeled at the 5'-end of the donor probe, and
Cy5 was labeled to a nucleotide in the middle part
of the acceptor probe. Also, the spacing between
the two nucleotides to which the fluorescent dyes
bind in a hybrid forms a single-strand. () denotes
the fluorescence decay curve when there were used
the detection probes where the base number between
the two nucleotides to which the fluorescent dyes
bound was 15 bases (n=15) in the hybrid. (▴)
denotes a pulse of excitation light.
- FIG. 34 shows the obtained fluorescence decay
curve of a hybrid which was formed with a pair of
detection probes and the target DNA () when the
following pair was used as detection probes. Namely,
Bodipy 493/503 was used as a donor fluorescent dye,
Cy5 as an acceptor fluorescent dye, Bodipy 493/503
was labeled at the 5'-end of the donor probe, and
Cy5 was labeled to a nucleotide in the middle part
of the acceptor probe. Also, the spacing between
the two nucleotides to which the fluorescent dyes
bind in a hybrid forms a single-strand. () denotes
the fluorescence decay curve when there were used
the detection probes where the base number between
the two nucleotides to which the fluorescent dyes
bound was 20 bases (n=20) in the hybrid. (▴)
denotes a pulse of excitation light.
- FIG. 35 shows the fluorescence decay curve of
the detection probes (specimen DNA not contained),
which is a control fluorescence decay curve ()
against FIGs. 29-34. (▴) denotes a pulse of
excitation light.
- FIG. 36 shows the fluorescence decay curves in
the fluorescence wavelength region of an acceptor
when a pair of detection probes (oligo-DNAs labeled
with fluorescent dye molecules) was mixed with a
target RNA to be the specimen in such varying
proportions as to render the probes excessive. The
detection probes used are as follows: the donor
fluorescent dye is Bodipy 493/503 and the acceptor
fluorescent dye is Cy5; at the time of hybrid
formation the spacing between the nucleotide to
which the donor fluorescent dye bind and the
nucleotide to which the acceptor fluorescent dye
bind is double-stranded; and the base number for the
spacing is 12 (n=12). The proportions of the target
RNA to the probes are: (1) 0%, (2) 2.5%, (3) 5%, and
(4) 20% (target RNA/probe, molar ratio).
- FIG. 37 shows the fluorescence spectra of the
samples shown in FIG. 36: a pair of detection probes
and a target RNA to be the specimen were mixed in
such varying proportions as to render the probes
excessive. The detection probes used are as
follows: the donor fluorescent dye is Bodipy 493/503
and the acceptor fluorescent dye is Cy5; at the time
of hybrid formation the spacing between the
nucleotide to which the donor fluorescent dye bind
and the nucleotide to which the acceptor fluorescent
dye bind is double-stranded; and the base number for
the spacing is 12 (n=12). The proportions of the
target RNA to the probes are: (1) 0%, (2) 2.5%, (3)
5%, and (4) 20% (target RHA/probe, molar ratio).
- FIG. 38 shows the fluorescence decay curves in
the fluorescence wavelength region of an acceptor
when a pair of detection probes (S-oligo labeled
with fluorescent dye molecules) was mixed with a
target RNA to be the specimen in such varying
proportions as to render the probes excessive. The
detection probes used are as follows: the donor
fluorescent dye is Bodipy 493/503 and the acceptor
fluorescent dye is Cy5; at the time of hybrid
formation the spacing between the nucleotide to
which the donor fluorescent dye bind and the
nucleotide to which the acceptor fluorescent dye
bind is double-stranded; and the base number for the
spacing is 10 (n=10). The proportions of the target
RNA to the probes are: (1) 0%, (2) 2.5%, (3) 5%, and
(4) 20% (target RNA/probe, molar ratio).
-
BEST MODE FOR CARRYING OUT THE INVENTION
Specimens
-
Specimens to be detected by the detection
probes and method of detection according to this
invention are not particularly limited with respect
to their kinds, structures, length, etc. and include
ordinary nucleic acids and nucleic acid analogs.
For example, DNA, RNA, synthetic oligonucleotides,
synthetic polynucleotides, and the like are named.
The specimen also includes that which possesses in
its part a structure having a specified base
sequence to which the detection probes according to
the invention bind substantially in a specific
manner. Here, the specimen does not need to possess
a nucleic acid structure throughout. Therefore, in
employing the method of detection according to the
invention, it is not required that all the base
sequences of nucleic acid or nucleic acid analog of
the specimen be known, and only the base sequence of
its specified portion that allows the specific
binding by the detection probes according to the
invention be known. Methods for base sequence
determination known in the art may be used to find
out the base sequence of the above-mentioned
specified portion in the specimen.
Detection Probes
-
For the detection probes according to this
invention, two fluorescent labeled oligonucleotides
that are labeled with different types of fluorescent
dye molecules are to be used as a pair.
-
Nucleic acid portions comprising the backbone
of the detection probes are not limited to DNA or
RNA and may be various nucleic acid analogs that are
commonly used. For example, among others those in
which phosphoric ester portions are converted to
phosphorothioates (S-oligo) and those in which they
are converted to methylphosphonates (M-oligo) are
named. Those in which amide, sulfoamide,
ethyleneglycol, and thioformal substitute
phosphodiester bonds are also named. Those in which
sugars are modified may also be used. For example,
they include the ones in which 2'-position of a
ribose is modified by 2'-O-alkyl, 2'-O-allyl, 2'-halogen,
and 2'-amino. Polyamidonucleic acids (PNA)
may also be used.
-
There is no particular limitation to the base
number of each probe. It suffices if the following
conditions are satisfied: the formation of a stable
hybrid with a target nucleic acid that is a
specimen; and low probability of forming hybrids
through erroneous recognition of nucleic acids other
than the specimen. For this purpose, usually more
than 10 bases are enough and more than 15 bases are
preferable. The total base number of the two probes
is also not particularly limited. It suffices if
the two probes are both able to hybridize with the
specified base sequence site of a target nucleic
acid of the specimen. Usually it is more than 20
bases and preferably more than 30 bases.
-
The base sequence of the probe according to
this invention may be the one that is complementary
to the base sequence of the specified site in the
specimen at which the detection probes bind to (or
hybridize with) the specimen. Here, as long as the
detection probes substantially hybridize with the
specified site of the specimen as described above,
parts of the base sequences of the detection probes
do not need to have complementation to the base
sequence of the specified site of the specimen as
described above.
-
The probes according to the invention are those
which show large delays in the fluorescence decay of
an acceptor fluorescent dye at the time of forming a
hybrid with a target nucleic acid to be the specimen.
To this end, in the probes according to the
invention the following factors are appropriately
set: the combination of fluorescent dyes; the base
number between the nucleotides to which the
fluorescent dye molecules bind in the hybrid;
whether the spacing between the nucleotides to which
the fluorescent dye molecules bind in the hybrid is
single-stranded or double-stranded; and the
positions of the fluorescent dye molecules in the
hybrid.
-
Generally, where each of donor and acceptor
dyes is singly present, decay of the fluorescence
intensities of each dye when the dye is pulse-excited
is represented by a single exponential
function decaying with the time constant
(fluorescence lifetime) pertaining to each dye
molecule (eqs (1) and (2)).
-
The fluorescence decay curve of a donor when
the donor is singly present (or when no energy
transfer between the donor and an acceptor is
occurring):
Id(t)=exp(-t/τd), τd:fluorescence lifetime of donor
-
The fluorescence decay curve of an acceptor
when the acceptor is singly present (or when no
energy transfer between a donor and the acceptor is
occurring):
Ia(t)=exp(-t/τa), τa:fluorescence lifetime of
acceptor
-
If resonance energy transfer occurs between a
donor and an acceptor, fluorescence decay of the
donor accelerates and that of the acceptor delays.
When the distance between a donor molecule and an
acceptor molecule is supposed to be fixed, the
fluorescence decay curve of the donor is represented
by eq (3). Here, fluorescence lifetime τda is defined
by efficiency E of the energy transfer. Namely, the
higher the energy transfer efficiency becomes, the
more fluorescence decay of the donor accelerates.
-
The fluorescence decay curve of a donor
undergoing the energy transfer:
I'd(t)=exp(-t/τda) τda=τd(1-E)
-
On the other hand, the fluorescence decay curve
of an acceptor is represented by eq (4). This decay
curve is not a single exponential function.
-
The fluorescence decay curve of an acceptor
excited by the energy transfer:
I' a (t) = 0 t exp-(t-τ)τ da ·exp(-τ/τ a )dτ
-
As described above, eqs (3) and (4) represent
the fluorescence decay curves when the distance
between the donor molecule and the acceptor molecule
is supposed to be fixed. If the distance between
the donor and the acceptor is not fixed and
fluctuates, the fluorescence lifetime of the donor
during its energy transfer in eqs (3) and (4) is not
a constant, but incorporates a function expressing
distribution of the distance between the donor and
the acceptor due to the fluctuations.
-
By measuring energy transfer between two
fluorescent dye molecules according to a time-resolution
method, a target nucleic acid is to be
detected under the conditions where detection probes
are present in excess relative to the target nucleic
acid: for this purpose, it is necessary to enlarge
the difference between the fluorescence decay curve
represented by eq (4) and the fluorescence decay
curve represented by eq (2). The fluorescence decay
curve of eq (4) is defined by fluorescence lifetime
of the donor, fluorescence lifetime of the acceptor,
the energy transfer efficiency and fluctuations in
the distance between the donor and the acceptor,
while the fluorescence decay curve of eq (2) is
defined by lifetime of the acceptor.
-
Accordingly, the combination of fluorescent
dyes, the mean distance between two fluorescent dye
molecules in a hybrid (which principally defines the
energy transfer efficiency), and the magnitude of
its fluctuations may be set in a mutually
appropriate manner.
-
In addition, the combination of the fluorescent
dyes desirably satisfy the following conditions:
- 1. The fluorescence lifetime of a donor is
longer than that of an acceptor and its difference
is large.
- 2. The probability of an acceptor's being
excited at the excitation wavelength of a donor is
low (i.e., the molecular absorption coefficient of
the donor at its absorption maximum >> the molecular
absorption coefficient of the acceptor at the
wavelength of the donor's absorption maximum).
- 3. The overlap between the fluorescence spectrum
of a donor and the fluorescence spectrum of an
acceptor is small (i.e., mixing of the fluorescence
of the donor into the fluorescence wavelength region
of the acceptor is small).
-
-
The combination of fluorescent dyes that
satisfy the above-mentioned conditions is, for
example, the one in which a Bodipy (4,4-difluoro-4-boro-3a,4a-diaza-s-indacene)
type dye or fluorescein
type dye is used as the donor dye and this is
combined an Indocyanine type dye or Rhodamine type
dye as the acceptor dye.
-
The mean distance between two fluorescent dye
molecules in a hybrid is determined by the base
number between the nucleotides to which the two
fluorescent dye molecules bind in the hybrid. It is
also supposed that the magnitude of fluctuations in
the distance between the fluorescent dye molecules
is determined by the following factors among others:
whether the spacing between the nucleotides to which
the two fluorescent dye molecules bind is a single-stranded
structure or double-stranded structure (see
FIG. 1); the positions of the fluorescent dye
molecules in the hybrid; and the structures and
length of linkers between the fluorescent dye
molecules and the oligonucleotides.
-
Table 1, on the basis of Examples, summarizes
the cases in which delays in the fluorescence decay
curves in the fluorescence wavelength region of
acceptors were observed for hybrids between a
variety of fluorescent labeled probes and a target
DNA. The variety of fluorescent labeled probes were
prepared and each one pair of the probes was mixed
with the target DNA to form a hybrid. The hybrid
was separated with a high performance liquid column
chromatogram and its fluorescence spectrum and
fluorescence decay curve were measured. With
respect to the pair of probes, its fluorescence
spectrum and fluorescence decay curve were measured
in a sample containing no target DNA, and changes in
the fluorescence spectra as well as in the
fluorescence decay curves (delays) resulting from
the formation of the hybrid were observed. See
Examples for details.
| Combination of fluorescent dyes donor/ acceptor | Oligonucleotide Structure between the donor fluorescent dye and the acceptor flourescent dye in the hybrid | base number (n) between the donor fluorescent dye and the acceptor fluorescent dye in the hybrid | changes in fluorescence spectrum | delays in fluorescence decay in fluorescence wavelength region of acceptor |
| BODIPY/Cy5 | single-stranded | 4,8,10,12,15,20 | + | +++ |
| | double-stranded | 4,8,10,12,14 | + | ++++ |
| BODIPY/Cy3.5 | double-stranded | 8,12,16 | + | ++ |
| FITC/Cy5 | single-stranded | 12,15,20 | + | + |
| | double-stranded | 10,12 | + | ++ |
| FITC/Cy3 | single-stranded | 12,15,20 | + | - |
| | double-stranded | 10,13,15 | + | + |
| | single-stranded | 4,8,12,15,20 | + | - |
| | double-stranded | 15 | + | + |
-
"Bodipy" is a trademark of Molecular Probes Inc.
(Eugene, OR, USA). Also, unless otherwise stated,
"Bodipy" in Examples is "Bodipy 493/503." Cy3,
Cy3.5, and Cy5 are trademarks of Amersham Inc.
-
For all the kinds of detection probes used,
changes in fluorescence spectra resulting from the
formation of hybrids were observed. This indicates
that energy transfer occurs through the hybrid
formation. In reference to the magnitude of delays
in fluorescence decay curves in the wavelength
region of acceptors, large differences depending on
the kinds of detection probes were noted. In the
item "delays in fluorescence decay in the
fluorescence wavelength of acceptor" in Table 1,
"++++" means that an extremely large delay is caused
in the fluorescence decay, "+++" means that a large
delay is caused in the fluorescence decay, "++"
means that a delay is caused in the fluorescence
decay, and "+" means that a delay is noted in the
fluorescence decay. "-" means that no delay is
noted in the fluorescence decay.
-
Bodipy/Cy5 is most preferable for the
combination of fluorescent dyes, and Bodipy/Cy3.5
and FITC/Cy5 follow in this order. Combinations of
FITC/Cy3 and FITC/Rhodamine are usable when the
spacing between fluorescent dye molecules in the
hybrid is made double-stranded. Bodipy is superior
to FITC as a donor dye: it is thought to be mainly
ascribable to the fact that the difference between
fluorescence lifetime of the donor and fluorescence
lifetime of the acceptor (Cy5, about one ns;
Rhodamine, about three ns) grows larger because the
fluorescence lifetime of Bodipy (about seven ns) is
longer than that of FITC (about four ns). When the
combination that would not allow good separation of
the fluorescence spectrum of the donor from that of
the acceptor was used, a delay in the fluorescence
decay was caused in the case where the spacing
between the fluorescent dyes in the hybrid was made
double-stranded, whereas no delay in the
fluorescence decay was noted in the case where the
spacing was made single-stranded.
-
As is evident from Table 1, it is understood
that where the spacing between the fluorescent dyes
in the hybrid is made double-stranded, a larger
delay is caused in the fluorescence decay compared
with the single-stranded spacing. It is thought
that when the spacing between the nucleotides to
which the two fluorescent dyes bind is a single-stranded
structure in the hybrid, the relative
spatial positions of the donor and acceptor dyes
fluctuate greatly because the freedom of molecular
motion for the portion being single-stranded is
large. Namely, the distance between the two dyes
fluctuates with time. On the other hand, in the
case of a double-stranded structure because the
freedom of molecular motion for that portion is far
more restricted than a single-stranded structure,
the fluctuations and distribution of the distance
between the donor dye and the acceptor dye are small.
The results in Examples indicate that where
fluctuations in the distance between the donor dye
and the acceptor dye are small; that is to say, the
structure between the two fluorescent dyes is made
double-stranded, a large delay is caused in the
fluorescence decay.
-
As is shown in the foregoing and Examples, a
variety of the pair of detection probes labeled with
fluorescence that cause large delays in the
fluorescence decay resulting from the formation of
hybrids with a target nucleic acid do exist. When
these probes were used, accuracy in the detection of
changes in the fluorescence decay curves resulting
from the hybrid formation was quantitatively
compared: to this end an analysis as described below
was conducted.
-
With the formation of a hybrid (due to energy
transfer), the fluorescence of an acceptor increases
but its increments vary from one probe to another
(because they depend on the energy transfer
efficiency). Thus, the accuracy to identify changes
in the fluorescence decay curve resulting from the
formation of the hybrid is determined by the
magnitude of the changes in the decay curve and
variations in the quantity of fluorescence.
-
S/N (signal-to-noise ratio) distinguishing the
fluorescence decay curve of probes that had formed a
hybrid from that of probes that had not formed a
hybrid was used as an index to evaluate each pair of
probes.
-
The S/N distinguishing the two fluorescence
decay curves was computed according to the following
procedure (S.A. Soper, B.L. Legender, and D.C.
Williams (1995) Analy. Chem. 67, 4358-4365 was
consulted).
-
First, with respect to each of the fluorescence
decay curve of probes forming a hybrid and the
fluorescence decay curve of probes not forming a
hybrid (i.e., a sample containing no target nucleic
acid), the rate of decay was computed according to
the following equation using a time zone of from
three ns to seven ns after irradiation with pulse-excitation
light:
τ=-Δt/(ln(D1/D0))
- D0: quantity of fluorescence in a time zone of 3-5 ns
- D1: quantity of fluorescence in a time zone of 5-7 ns
- Δt =2 ns
-
-
Also, the magnitude of scatters (σ) of data was
computed according to the following equation:
σ=τx(-ln(D1/D0))/(1/D0+1/D1)1/2
σ is the standard deviation of data distribution
when the measurement was performed many times under
the same conditions and takes smaller values as the
quantity of fluorescence increases: with increasing
fluorescence quantities the scattering of data
becomes smaller.
-
S/N (signal-to-noise ratio) distinguishing the
fluorescence decay curve of probes forming a hybrid
from that of probes not forming a hybrid is
expressed by Δτ/σΔτ, which is obtained by dividing
the sum of scatters of the data (σΔτ) by the
differential fluorescence lifetime (Δτ).
-
Here,
Δτ=τ(hybrid)-τ(probe) σΔτ=(σ(hybrid)2+σ(probe)2)1/2
-
Table 2 and FIG. 3 show the results:Δτ/σ
Δτ
values in Table 2 and FIG. 3 are in relative units.
-
For combinations of the fluorescent dyes-Bodipy/Cy5,
Bodipy/Cy3.5, and FITC/CY5, the base
number between the two nucleotides to which the dyes
bind in the hybrid was varied: Table 2 and FIG. 3
show S/N identifying the changes in the fluorescence
decay curves then. To see effects on the S/N for
identification caused by the difference in the
structures between the two nucleotides to which the
fluorescent dyes bound (single-stranded or double-stranded),
the base numbers were fixed to 10 in the
combinations of Bodipy/Cy5 dyes and their spacing
was made into a mixed structure of single-stranded
and double-stranded, where the ratio of single-stranded
to double-stranded was varied: variations
in the S/N then are also shown in the Table. To see
effects of the labeling positions of the fluorescent
dyes in the hybrid, the base numbers were fixed to
10 in the combinations of Bodipy/Cy5 dyes and the
labeling positions of Bodipy of the Bodipy-labeled
probes (donor probes) were shifted to their middle
parts from the 5'-ends (the positions of the gap=0):
variations in the S/N then are also shown in the
Table.
-
The above results clearly show the following:
- (1) When in the combinations of Bodipy/Cy5
fluorescent dyes, the spacing between the
nucleotides to which the two fluorescent dyes bind
adopts a double-stranded structure in the hybrids,
the base number between the two fluorescent dyes is
most preferably from 10 to 12.
- (2) When in the combinations of Bodipy/Cy5
fluorescent dyes, the spacing between the
nucleotides to which the two fluorescent dyes bind
adopts a single-stranded structure in the hybrids,
the S/N for identification improves more as the base
number between the two fluorescent dyes increases
(in 4<n<20). The S/N for identification at n=20 is
smaller compared with the case of a double-stranded
structure.
- (3) When in the combinations of Bodipy/Cy3.5
fluorescent dyes, the spacing between the
nucleotides to which the two fluorescent dyes bind
adopts a double-stranded structure in the hybrids,
the dependence of S/N on the base number between the
two fluorescent dyes shows a trend similar to the
combinations of Bodipy/Cy5. However, the S/N values
are smaller than those for Bodipy/Cy5.
- (4) When in the combinations of FITC/Cy5
fluorescent dyes, the spacing between the
nucleotides to which the two fluorescent dyes bind
adopts a double-stranded structure in the hybrids,
the S/N values are smaller than those for Bodipy/Cy5.
- (5) When in the combinations of Bodipy/Cy5
fluorescent dyes (the base number between the
nucleotides to which the fluorescent dyes bind,
n=10), the structures between the nucleotides to
which the two fluorescent dyes bind are made into
mixed structures of single-stranded and double-stranded,
the case where the structure is all
double-stranded gives the best S/N for
identification.
- (6) When in the combinations of Bodipy/Cy5
fluorescent dyes (the base number between the
nucleotides to which the fluorescent dyes bind,
n=10), the labeling position of Bodipy of the
Bodipy-labeled probes (donor probes) is best at the
5'-end. As the labeling position shifts toward the
middle part of the probe, the S/N lowers.
-
-
Here, the result in (6) may be interpreted as
follows. In the hybrid comprising two probes and a
target nucleic acid, a gap on the chain at the probe
side is generated between the nucleotides at which
the two probes are adjacent to each other. Thus,
the corresponding phosphodiester bond on the side of
the target nucleic acid has increasing freedom of
movement. Accordingly, it is supposed that the
magnitude of fluctuations in the distance between
the two fluorescent dyes, which results from the
movement of the hybrid in an aqueous solution,
becomes smaller as the fluorescent dyes approach the
gap position of the hybrid. The result in (6)
suggests that if either one of the donor and
acceptor probes is labeled at a terminus on the side
opposing the other probe, it will increase the S/N
for identification to the greatest degree.
-
Based on these results, it is understood that
among the detection probes to be used in the present
Examples, the most suitable ones are the pair in
which Bodipy/Cy5 was used as a combination of the
fluorescent dyes and the spacing between the
nucleotides to which Bodipy and Cy5 bind forms a
double-stranded structure and its base number is
from 10 to 12 in the hybrid with a specimen. Here,
either dye of Bodipy and Cy5 is labeled to a
terminus of the corresponding detection probe.
-
In the detection probes according to this
invention, groups binding fluorescent dye molecules
to oligonucleotides are not particularly limited,
but they are desirably bound through suitable
linkers. In the case where the linker is too short
then, there is a possibility that interaction
between fluorescent dye molecules and the backbone
or base part of a nucleic acid grows strong, and as
a result, the desired resonance energy transfer
between the two fluorescent dye molecules does not
take place sufficiently. Also, in the case where
the linker is too long, there is a strong
possibility that the two fluorescent dye molecules
freely move and fluctuations in the distance between
the two fluorescent dye molecules become exceedingly
large, which is thus not preferred. Preferable
length of the linker for the detection probes
according to the invention is from a tetramethylene
chain to a decamethylene chain. For binding with
fluorescent dye molecules, covalent bond formation
reactions known in the art can be used. For example,
they are an amide, ester, and ether bond, etc. and
particularly an amide bond is preferable. The
detection probes used in the present Examples employ
a tetramethylene chain as a linker.
-
Among combinations of fluorescent dyes to be
used for the detection probes according to this
invention, dyes having fluorophores of the Bodipy
type (4-difluoro-4-boro-3a,4a-diaza-s-indacene) are
used as donor dyes and to these are combined dyes
having fluorophores of the Indocyanin type as
acceptors; as examples of those combinations,
combinations of Bodipy 493/503 with Cy3, Cy3.5, and
Cy5 are illustrated. Other kinds of Bodipy having
different wavelength characteristics (Molecular
Probes Inc.) and Cy5.5, Cy7 (Amersham) are also
usable. Specifically, there are combinations such
as "Bodipy-TMR and Cy5" and "Bodipy-TR and Cy7."
Similarly to the combination of "Bodipy 493/503 and
Cy5," those combinations have characteristics such
that the difference in fluorescence lifetime between
the donor and the acceptor is about sevenfold and
the maximum wavelength in the fluorescence spectrum
of the donor is separated from that of the acceptor
by about 150 nm. In the combinations "Bodipy-TMR
and Cy5.5" and "Bodipy-TR and Cy7," their
wavelengths are generally shifted to the longer
wavelength side by about 50 nm and about 100 nm,
respectively as compared with "Bodipy 493/503 and
Cy5." In general, biological samples frequently
contain luminescent substances and this luminescence
forms background light against measurements, thus
lowering measured S/Ns. Because the quantity of
luminescence for this background light generally
decreases toward the long wavelength region, it is
advantageous to use the long wavelength region when
the high sensitivity measurements of biological
samples is to be performed.
Method for Detecting Specimen
-
The detection of a specimen using detection
probes according to this invention can, for example,
be carried out in the following manner (see FIG. 3).
- (1) The detection probes are prepared.
- (2) The detection probes are added to a sample
in appropriate amounts. If the sample contains the
specimen, a part of the detection probes forms a
hybrid with the specimen.
- (3) Employing a recording device capable of
fluorescence time-resolved measurements, the
fluorescence decay curve in the fluorescence
wavelength region of an acceptor is measured. The
fluorescence in the fluorescence wavelength region
of the acceptor contains fluorescence excited by the
energy transfer resulting from the hybrid formation.
- (4) The fluorescence decay curve of the
detection probes in the fluorescence wavelength
region of the acceptor is measured.
- (5) The fluorescence decay curve measured in
(3) and the fluorescence decay curve measured in (4)
are subjected to a comparative examination. If the
specimen is present in the sample, the fluorescence
decay curve changes. If the specimen is not present
in the sample, no significant changes in the two
fluorescence decay curves are noted.
-
Examination for Detection of Specimen under the
Conditions with Excessive Probes
Conditions with Excessive Probes
-
The detection probes and method of detection
according to this invention enable the detection of
the presence of a specimen with high sensitivity
even under the conditions where the probes are
present in large excess relative to the specimen.
FIG. 4 shows the results obtained when the
combination of Bodipy/Cy5 fluorescent dyes was used
as detection probes, where the spacing between the
two nucleotides to which the fluorescent dyes bind
adopted a double-stranded structure and its base
number was 12. This shows changes in the
fluorescence decay curves when the concentration
ratio of the detection probes to the target DNA was
varied. The concentration of the detection probes
was fixed and to this was added the target DNA to
provide 0% (no target DNA was added), 1%, 3%, 5%,
and 20% as molar ratios. From FIG. 4, it is
apparent that even if the detection probes are
present in excess 100-fold relative to the target
nucleic acid, the fluorescence decay curve
sufficiently displaying significant differences is
obtained.
-
One example of methods to quantitatively
examine the changes in fluorescence decay carves as
represented by FIG. 4 is shown below (Table 3).
Fluorescence lifetime τ is computed from the
fluorescence decay curve using values of
fluorescence intensities in a time zone of from one
to nine ns after irradiation with pulse excitation
light. The magnitude of scatters in those
measurements (standard deviation in the distribution
of data when the measurement was conducted many
times under the same conditions) is also computed.
τ=-Δt/(ln(D1/D0))
- D0: quantity of fluorescence in a time zone of 1-5 ns
- D1: quantity of fluorescence in a time zone of 5-9 ns
- Δt =4 ns
σ=τx(-ln(D1/D0))/(1/D0+1/D1)1/2 -
-
Examination of the difference between the two
fluorescence decay curves (here, a difference from
the decay curve of a sample containing no target
nucleic acid (the control)) is to be performed using
Δτ/σΔτ as a parameter.
-
Here,
Δτ=τ(sample containing target DNA)-τ(control) σΔτ=(σ(sample containing target DNA)2+σ(control)2)1/2
-
Δτ/σ
Δτ represents S/N identifying the
difference between the two fluorescence decay curves
and its greater value means that examination of the
presence of target the DNA with great accuracy is
feasible.
| probe: BODIPY/CY5 (double-stranded, n=12) |
| specimen DNA/probe: | 1% | 3% | 5% | 20% |
| Δτ/σΔτ | 7.09 | 12.10 | 17.14 | 36.02 |
Comparison with Method for Detection of Specimen
Based on Fluorescence Spectral Measurements
-
Compared with conventional methods based on the
measurements of changes in fluorescence spectra, the
present method based on the measurement of
fluorescence decay curves has great accuracy for
examination over tens of times in the detection of a
specimen under the conditions with excessive
detection probes. FIG. 5 shows changes in
fluorescence spectra for the same sample used in FIG.
4.
-
The magnitude of changes in a fluorescence
spectrum can be expressed in terms of either of the
two ratios: the ratio of Ia/Id wherein Id is
fluorescence intensity at the maximum wavelength
(517 nm) of the Bodipy 493/503 fluorescence and Ia
is fluorescence intensity at the maximum wavelength
(667 nm) of the Cy5 fluorescence; and the ratio of
fluorescence intensity in the wavelength region of
the Bodipy fluorescence (e.g., 510-560 nm) to
fluorescence intensity in the wavelength region of
the Cy5 fluorescence (e.g., 650-700 nm). Here, S/N
for identifying the difference between the two
fluorescence spectra is expressed by ΔI/σ
ΔI.
ΔI = Ia/Ib (sample containing target DNA)- Ia/Ib
(control) σΔI = (σ(sample containing target DNA)2 + σ
(control)2)1/2 σ = (Ia/Id)x(1/Id + 1/Ia)1/2
| probe: BODIPY/CY5 (double-stranded, n=12) |
| specimen DNA/probe; | 1% | 3% | 5% | 20% |
| Δ(Ia/Ib)/σΔτ, peak ratio | 0.18 | 0.51 | 0.78 | 3.05 |
| Δ(Ia/Ib)/σΔτ, integration ratio | 1.08 | 3.16 | 4.45 | 16.83 |
-
From a comparison of numerical values in Tables
3 and 4, it is understood that a method of detection
utilizing fluorescence decay curves (time-resolution
method) has great superiority over a method
utilizing fluorescence spectra for a sample in which
detection probes are present in excess relative to a
specimen. Especially, it is understood that
according as the detection probes become more
excessive relative to the specimen, the superiority
of the time-resolution method grows greater.
-
The detection probes and method of detection
according to this invention are applicable even if
the specimen is RNA.
-
FIG. 36 is an example where various detection
probes and method of detection according to the
invention were used to detect RNA. It is understood
that similarly to the results in FIG. 4 where the
specimen is DNA, the fluorescence decay curves delay
in proportion to the contents of RNA in samples
where the detection probes are present in excess
relative to RNA, which is the specimen. See
Examples for details.
-
The detection probes and method of detection
according to this invention are also effective in
the case where the oligonucleotide part of the
detection probe is an oligonucleotide of the
phosphorothioate type.
-
FIG. 38 shows an example where oligonucleotides
of the phosphorothioate type (S-oligo) were used as
detection probes to detect RNA. It is understood
that similarly to the results in FIGs. 4 and 36, the
fluorescence decay curves delay in proportion to the
contents of RNA in samples where the detection
probes are present in excess relative to RNA, which
is the specimen. See Examples for details.
Application of Probes According to the Invention
-
The subject that the detection probes and the
method using the same can detect is not limited to
the detection of nucleic acids to be a specimen.
For example, it is also possible to detect
alterations of the primary structure of a nucleic
acid (such as incorporation of nucleic acid,
inversion and deletion) with high sensitivity and
great accuracy.
-
For example, when the incorporation of other
DNA fragment into a specified site of a DNA is to be
detected, the positions at which two probes are
hybridized onto the DNA are set to be on both sides
of the site into which the DNA fragment will be
incorporated, as is shown in FIG. 6A. If the DNA
fragment is not incorporated, energy transfer occurs
because the two probes are hybridized adjacently.
On the other hand, if the incorporation takes place,
the energy transfer efficiency decreases because the
two probes are to be hybridized at distant sites,
causing the fluorescence decay curve to change.
Also, as shown in FIG. 6B, when a probe hybridizing
with a DNA fragment to be incorporated is used as
one of the probes, the two probes are hybridized
adjacently and the energy transfer occurs if the
incorporation takes place. The incorporation of
other DNA fragment into a specified site of a DNA is
utilized in manipulations for gene cloning, e.g.,
when a desired DNA fragment is incorporated into a
vector. If the detection probes and method of
detection according to this invention are employed,
it does not necessitate manipulations such as
separation of non-bonded probes or washing, after
addition of the detection probes to the sample and
makes it possible to easily detect that the
incorporation has taken place.
-
Also, when an exogenous gene is incorporated
into a vector, the direction of incorporation often
poses a problem. As shown in FIG. 7, it is designed
such that one of the probes is hybridized to one end
of a DNA fragment being incorporated; if the DNA is
incorporated in one direction (tentative normal
direction in FIG. 7, top), the energy transfer
occurs, whereas if it is incorporated in the
inverted direction (inverted direction in FIG. 7,
bottom), the energy transfer does not occur.
-
Also, DNA fragments of certain size may
sometimes be removed (i.e., deletion). In some
hereditary diseases, the deletion of a DNA fragment
from a specified site causes such genepathy.
Further, when splicing reaction in cell nuclei
produces messenger RNA, an RNA fragment at a
specified site (intron) is removed. As shown in FIG.
8, if it is designed such that one of the probes is
hybridized to a nucleic acid fragment to be removed,
the detection of these reactions is enabled.
EXAMPLES
1. Detection Probes
-
A variety of oligo-DNAs labeled with various
fluorescent dyes were synthesized and these
hybridized to DNAs that serve as specimens to be
tested. After separating and purifying the
resulting hybrids, their fluorescence spectra and
fluorescence decay curves were measured.
(1) Synthesis of the Probes
-
Oligo-DNAs having base sequences as described
below were synthesized with a DNA/RNA synthesizer
(Perkin Elmer Model 394 or Perspective Model 18909)
according to the β-cyanoethylamidite method.
- N1: 5'-GCTATGACCATGXTTAC-3'
- N2: 5'-GCTATGACCAXGATTAC-3'
- N3: 5'-GCTATGACXATGATTAC-3'
- N4: 5'-GCTATGAXCATGATTAC-3'
- N5: 5'-GCTATGXCCATGATTAC-3'
- N6: 5'-GCTAXGACCATGATTAC-3'
- N7: 5'-GCXATGACCATGATTAC-3'
In the above-mentioned probes N1-N7, "X" denotes
a Uni-Link AminoModifier (Clonetech Laboratories
Inc., Code No. CL5190-1).
- N8: 5'-AXCGCGCAATTAACCC -3'
- N9: 5'-AGXGCGCAATTAACCC -3'
- N10: 5'-AGCGXGCAATTAACCC -3'
In the above-mentioned probes N8-N10, "X"
denotes a Uni-Link AminoModifier.
- N11: 5'-XAGCGCGCAATTAACCC -3'
In the above-mentioned probe N11, "X" denotes 6-(trifluoroacetylamino)
hexyl- (2-cyanoethyl)-(N, N-diisopropyl)-phosphoroamidite
(TFAc hexanolamine
linker, Perkin Elmer Japan Co. Ltd., Cat No.400808).
- N12: 5'-XCCATGATTAC-3'
- N13: 5'-XGACCATGATTAC-3'
- N14: 5'-XTGACCATGATTAC-3'
- N15: 5'-XTATGACCATGATTAC-3'
- N16: 5'-XGCTATGACCATGATTAC-3'
- N17: 5'-GCTATGACCATGATTACX-3'
-
-
In the above-mentioned probes N12-N17, "X"
denotes a TFAchexanolamine linker.
-
The respective products thus obtained were
separated with an ion-exchange high performance
chromatograph and main peaks were fractionated. The
conditions used for the ion-exchange high
performance chromatograph were as follows: a TSK-GEL
DEAE-2WS column (available form Tosoh Co. LTD., 4.6
mm ⊘ x 250 mm in full length) was used; a flow rate
of 0.8 ml/min, 40 °C temperature, and a HCOOHNH4
gradient- 20% CH3CN as a mobile phase were used; and
detection was carried out at an absorption
wavelength of 260 nm. The HCOOHNH4 gradient was
prepared by changing the mixing ratio of two
solutions: A solution-0.2 M HCOOHNH4; and B solution-1
M HCOOHNH4. For the proportion of the B solution,
a gradient of 35%-85% /20 min was used.
-
After desalting the fractionated solution, the
products were lyophilized.
(Labeling of Oligo-DNAs with Bodipy 494/503)
-
Oligo-DNAs (N8, N9, N10, and N11) were labeled
with Bodipy 493/503 dye.
-
NHSS (N-hydroxysulfosuccinimide sodium salt)
2.5 mg was dissolved in 30 µl of sterilized water
and EDAC (1-ethyl-3-(3-dimethylaminopropyl)
carbodiimide) 5 mg in 50 µl of sterilized water,
respectively. These were mixed with 1 mg of Bodipy
493/503 propionic acid dissolved in 50 µl of DMF and
allowed to react at room temperature for 30 min.
The resulting solution was mixed with a lyophilized
oligo-DNA dissolved in 300 µl of 0.5 M Na
2CO
3/NaHCO
3
buffer (pH 9.3) and allowed to react overnight under
the shielded light. After the reaction solution was
gel filtrated to remove unreacted dye, the product
was purified with a reverse phase high performance
liquid column chromatograph. The conditions used
for the reverse phase high performance liquid column
chromatograph were as follows: a CAPCELL PAKC18
(available from Shiseido Co. LTD., 6 mm ⊘ x 250 mm
in full length) was used; a flow rate of 1 ml/min,
40 °C temperature, and a CH
3CN gradient -5mMTEAA as a
mobile phase were used; and detection was carried
out at an absorption wavelength of 260 nm. The CH
3CN
gradient was prepared by changing the mixing ratio
of two solutions: A solution-5% CH
3CN; and B
solution-40% CH
3CN. For the proportion of the B
solution, a gradient of 30%-80% /20 min was used.
The absorption spectra of fractionated peaks were
measured, thus confirming absorption at 260 nm and
absorption of the fluorescent dye (493 nm). These
fractions were lyophilized and stored.
- BP0 (N11 labeled with Bodipy493/503): 5'-XAGCGCGCAATTAACCC
-3'
- BP1 (N8 labeled with Bodipy493/503): 5'-AXCGCGCAATTAACCC
-3'
- BP2 (N9 labeled with Bodipy493/503): 5'-AGXGCGCAATTAACCC
-3'
- BP4 (N10 labeled with Bodipy493/503): 5'-AGCGXGCAATTAACCC
-3'
-
-
In the above "X" denotes that which Bodipy
493/503 binds to through a linker.
(Labeling of Oligo-DNAs with FITC)
-
Oligo-DNAs (N11, N12, N13, N14, N15, and N17)
were labeled with FITC (fluorescein isothiocyanate,
Molecular Probes Inc.).
-
FITC 1.5 mg was dissolved in 150 µl of DMF.
This was mixed with a solution dissolving a
lyophilized oligo-DNA in 300 µl of 0.5 M
Na
2CO
3/NaHCO
3 buffer (pH 9.3) and allowed to react
overnight under the shielded light. After the
reaction solution was gel filtrated to remove
unreacted dye, the product was purified with a
reverse phase high performance liquid column
chromatograph. The conditions used for the reverse
phase high performance liquid column chromatograph
were as follows: a CAPCELL PAKC18 (available from
Shiseido Co. LTD., 6 mm ⊘ x 250 mm in full length)
was used; a flow rate of 1 ml/min, 40 °C temperature,
and a CH
3CN gradient -5mMTEAA as a mobile phase were
used; and detection was carried out at an absorption
wavelength of 260 nm. The CH
3CN gradient was
prepared by changing the mixing ratio of two
solutions: A solution-5% CH
3CN; and B solution-40%
CH
3CN. For the proportion of the B solution, a
gradient of 15%-65% /20 min was used. The
absorption spectra of fractionated peaks were
measured, thus confirming absorption at 260 nm and
absorption of the fluorescent dye (495 nm). These
fractions were lyophilized and stored.
- 5F (N11 labeled with FITC): 5'-XAGCGCGCAATTAACCC -3'
- 5F10 (N12 labeled with FITC): 5'-XCCATGATTAC-3'
- 5F12 (N13 labeled with FITC): 5'-XGACCATGATTAC-3'
- 5F13 (N14 labeled with FITC): 5'-XTGACCATGATTAC-3'
- 5F15 (N15 labeled with FITC): 5'-XTATGACCATGATTAC-3'
- 3F (N17 labeled with FITC): 5'-GCTATGACCATGATTACX-3'
-
-
In the above "X" denotes that which FITC binds
to through a linker.
(Labeling of Oligo-DNA with XRITC)
-
Qligo-DNA (N11) was labeled with XRITC
(rhodamine X isothiocyanate, Molecular Probes Inc.).
-
XRITC 1.5 mg was dissolved in 150 µl of DMF.
This was mixed with a solution dissolving the
lyophilized oligo-DNA in 300 µl of 0.5 M
Na
2CO
3/NaHCO
3 buffer (pH 9.3) and allowed to react
overnight under the shielded light. After the
reaction solution was gel filtrated to remove
unreacted dye, the product was purified with a
reverse phase high performance liquid column
chromatograph. The conditions used for the reverse
phase high performance liquid column chromatograph
were as follows: a CAPCELL PAKC18 (available from
Shiseido Co. LTD., 6 mm ⊘ x 250 mm in full length)
was used; a flow rate of 1 ml/min, 40 °C temperature,
and a CH
3CN gradient -5mMTEAA as a mobile phase were
used; and detection was carried out at an absorption
wavelength of 260 nm. The CH
3CN gradient was
prepared by changing the mixing ratio of two
solutions: A solution-5% CH
3CN; and B solution-40%
CH
3CN. For the proportion of the B solution, a
gradient of 30%-80% /20 min was used. The
absorption spectra of fractionated peaks were
measured, thus confirming absorption at 260 nm and
absorption of the fluorescent dye (570 nm). These
fractions were lyophilized and stored.
- 5R16 (N11 labeled with XRITC): 5'-XAGCGCGCAATTAACCC
-3'
-
-
In the above "X" denotes that which XRITC binds
to through a linker.
(Labeling of Oligo-DNA with Cy3)
-
Oligo-DNA (N11) was labeled with Cy3 dye.
-
One tube of Cy3 dye (Amersham Inc, FluoroLink
Cat. No. PA23001) was dissolved in 100 µl of
sterilized water. This was mixed with a solution
dissolving the lyophilized oligo-DNA in 200 µl of
0.5 M Na
2CO
3/NaHCO, buffer (pH 9.3) and allowed to
react overnight under the shielded light. After the
reaction solution was gel filtrated to remove
unreacted dye, the product was purified with a
reverse phase high performance liquid column
chromatograph. The conditions used for the reverse
phase high performance liquid column chromatograph
were as follows: a CAPCELL PAKC18 (available from
Shiseido Co. LTD., 6 mm ⊘ x 250 mm in full length)
was used; a flow rate of 1 ml/min, 40 °C temperature,
and a CH
3CN gradient -5mMTEAA as a mobile phase were
used; and detection was carried out at an absorption
wavelength of 260 nm. The CH
3CN gradient was
prepared by changing the mixing ratio of two
solutions: A solution-5% CH
3CN; and B solution-40%
CH
3CN. For the proportion of the B solution, a
gradient of 15%-60% /20 min was used. The
absorption spectra of fractionated peaks were
measured, thus confirming absorption at 260 nm and
absorption of the fluorescent dye (550 nm). These
fractions were lyophilized and stored.
- 5Cy3 (N11 labeled with Cy3): 5'-XAGCGCGCAATTAACCC -
3'
-
-
In the above "X" denotes that which Cy3 binds
to through a linker.
(Labeling of Oligo-DNAs with Cy3.5)
-
Oligo-DNAs (N3, N6, and N16) were labeled with
Cy3.5 dye.
-
One tube of Cy3.5 dye (Amersham Inc, FluoroLink
Cat. No. PA23501) was dissolved in 100 µl of
sterilized water. This was mixed with a solution
dissolving a lyophilized oligo-DNA in 200 µl of 0.5
M Na
2CO
3/NaHCO
3 buffer (pH 9.3) and allowed to react
overnight under the shielded light. After the
reaction solution was gel filtrated to remove
unreacted dye, the product was purified with a
reverse phase high performance liquid column
chromatograph. The conditions used for the reverse
phase high performance liquid column chromatograph
were as follows: a CAPCELL PAKC18 (available from
Shiseido Co. LTD., 6 mm ⊘ x 250 mm in full length)
was used; a flow rate of 1 ml/min, 40 °C temperature,
and a CH
3CN gradient -5mMTEAA as a mobile phase were
used; and detection was carried out at an absorption
wavelength of 260 nm. The CH
3CN gradient was
prepared by changing the mixing ratio of two
solutions: A solution-5% CH
3CN; and B solution-40%
CH
3CN. For the proportion of the B solution, a
gradient of 15%-60% /20 min was used. The
absorption spectra of fractionated peaks were
measured, thus confirming absorption at 260 nm and
absorption of the fluorescent dye (581 nm). These
fractions were lyophilized and stored.
- Cy358 (N3 labeled with Cy3.5): 5'-GCTATGACXATGATTAC-3'
- Cy3512 (N6 labeled with Cy3.5): 5'-GCTAXGACCATGATTAC-3'
- Cy3516 (N16 labeled with Cy3.5): 5'-XGCTATGACCATGATTAC-3'
-
-
In the above "X" denotes that which Cy3.5
binds to through a linker.
(Labeling of Oligo-DNAs with Cy5)
-
Oligo-DNAs (N1, N2, N3, N4, N5, N6, N7, N11,
and N17) were labeled with Cy5 dye.
-
One tube of Cy5 dye (Amersham Inc, FluoroLink
cat. No. PA25001) was dissolved in 100 µl of
sterilized water. This was mixed with a solution
dissolving a lyophilized oligo-DNA in 200 µl of 0.5
M Na
2CO
3/NaHCO
3 buffer (pH 9.3) and allowed to react
overnight under the shielded light. After the
reaction solution was gel filtrated to remove
unreacted dye, the product was purified with a
reverse phase high performance liquid column
chromatograph. The conditions used for the reverse
phase high performance liquid column chromatograph
were as follows: a CAPCELL PAKC18 (available from
Shiseido Co. LTD., 6 mm ⊘ x 250 mm in full length)
was used; a flow rate of 1 ml/min, 40 °C temperature,
and a CH
3CN gradient -5mMTEAA as a mobile phase were
used; and detection was carried out at an absorption
wavelength of 260 nm. The CH
3CN gradient was
prepared by changing the mixing ratio of two
solutions: A solution-5% CH
3CN; and B solution-40%
CH
3CN. For the proportion of the B solution, a
gradient of 15%-60% /20 min was used. The
absorption spectra of fractionated peaks were
measured, thus confirming absorption at 260 nm and
absorption of the fluorescent dye (649 nm). These
fractions were lyophilized and stored.
- Cy54 (N1 labeled with Cy5): 5'-GCTATGACCATGXTTAC-3'
- Cy56 (N2 labeled with Cy5): 5'-GCTATGACCAXGATTAC-3'
- Cy58 (N3 labeled with Cy5): 5'-GCTATGACXATGATTAC-3'
- Cy59 (N4 labeled with Cy5): 5'-GCTATGAXCATGATTAC-3'
- Cy510 (N5 labeled with Cy5): 5'-GCTATGXCCATGATTAC-3'
- Cy512 (N6 labeled with Cy5): 5'-GCTAXGACCATGATTAC-3'
- Cy514 (N7 labeled with Cy5): 5'-GCXATGACCATGATTAC-3'
- 5Cy5 (N11 labeled with Cy5): 5'-XAGCGCGCAATTAACCC -
3,
- 3Cy5 (N17 labeled with Cy5): 5'-GCTATGACCATGATTACX-3'
-
-
In the above "X" denotes that which Cy5 binds
to through a linker.
(2) synthesis of Specimen DNAs
-
Oligo-DNAs having base sequences as described
below were synthesized with a DNA/RNA synthesizer
(Perkin Elmer Model 394 or Perspective Model 18909)
according to the β-cyanoethylamidite method.
-
The respective products thus obtained were
separated with an ion-exchange high performance
chromatograph and main peaks were fractionated. The
conditions used for the ion-exchange high
performance chromatograph were as follows: a TSK-GEL
DEAE-2WS column (available from Tosoh Co. LTD., 4.6
mm ⊘ x 250 mm in full length) was used; a flow rate
of 0.8 ml/min, 40 °C temperature, and a gradient of
HCOOHNH4 - 20% CH3CN as a mobile phase were used; and
detection was carried out at an absorption
wavelength of 260 nm. The HCOOHNH4 gradient was
prepared by changing the mixing ratio of two
solutions: A solution-0.2 M HCOOHNH4; and B solution-1
M HCOOHNH4. For the proportion of the B solution,
a gradient of 35%-85% /20 min was used.
-
After desalting the fractionated solution, the
products were lyophilized and stored.
(3) Formation of Hybrids between Detection Probes
and Sample DNAs and Separation of the Hybrids by
High Performance Liquid Chromatography
-
A pair of detection probes consisting of a
donor probe and an acceptor probe 40 pmol (each 40
pmol of the donor and acceptor probes) was mixed
with 40 pmol of a specimen DNA in 10 mM Tris-HCl (pH
7.4) and 140 mM NaCl 10 µl at room temperature for 5
min and allowed to hybridize with each other.
Subsequently, the hybrid was separated with an ion-exchange
high performance chromatograph (ion
exchange HPLC). The conditions used for the ion-exchange
high performance chromatograph were as
follows: a TSK-GEL DEAE-NPR column (available from
Tosoh Co. LTD.) was used; a flow rate of 1 ml/min,
40 °C temperature, and a NaCl gradient-20 mMTris-HCl
(pH 9.5) as a mobile phase were used; and detection
was carried out at an absorption wavelength of 260
nm and with fluorescence intensity (excitation
wavelength: the wavelength of the donor dye at its
absorption maximum, wavelength of fluorescence
detection: the wavelength of the acceptor at its
fluorescence maximum). The NaCl gradient was
prepared by changing the mixing ratio of two
solutions: A solution-20 mM Tris-HCl (pH 9.5); and B
solution-20 mM Tris-HCl (pH 9.5), 1 M NaCl. The
following conditions were used:
- 0-2 min:B Solution proportion; a gradient of 25%-45%
- 2-12 min:B Solution proportion; a gradient of 45%-55%
- 12-13 min:B Solution proportion; a gradient of 55%-100%
-
-
In the chromatograph a peak manifesting strong
fluorescence was identified to be the peak of the
hybrid: only when the energy transfer occurs, strong
fluorescence is observed. The peaks having strong
fluorescence were eluted at positions with longer
retention times on the chromatogram than the elution
positions of individual probes.
-
The fluorescence spectra of the obtained HPLC
fractions were measured (fluorescence
spectrophotometer: Hitachi F-4500), confirming that
the energy transfer had occurred.
(4) Measurements of Fluorescence Decay Curves of
Hybrids
-
The fluorescence decay curves of the hybrids
separated, purified with a high performance liquid
column chromatograph were measured.
-
Picosecond fluorescence lifetime recording
device C4780 (Hamamatsu Photonics Co. Ltd.)
-
- 1. Argon laser excitation titanium
sapphire laser (Spectra Physics Inc.)
- Argon ion laser: Model 2080
- Mode-lock titanium sapphire laser:
TSUNAMI
- Frequency doubler/pulse selector:
Model 3980
- 2. Nitrogen-dye laser (Laser Photonics)
- Dye: COUMARIN 307
-
-
(a) Fluorescence decay curves in the
fluorescence wavelength region of the acceptors
(650-700 nm) where the donor fluorescent dyes were
Bodipy 493/503 and the acceptor dyes were Cy5 and
the structures between the two nucleotides to which
the fluorescent dyes bound in the hybrids were made
double-stranded and the base number (n) between the
fluorescent dyes in the hybrids were set at n=4, 8,
10, 12, and 14.
-
Bodipy 493/503 is labeled to the 5'-end
position of the donor probes and Cy5 is labeled to
the middle parts of the acceptor probes.
Separation, Purification of the Hybrids by High
Performance Liquid Chromatography
-
| donor probe |
acceptor probe |
specimen DNA |
elution time (min) on HPLC |
| BP0 |
Cy54 |
T0 |
5.89-6.40 |
| BP0 |
Cy58 |
T0 |
5.82-6.14 |
| BP0 |
Cy510 |
T0 |
5.90-6.23 |
| BP0 |
Cy512 |
T0 |
5.97-6.40 |
| BP0 |
Cy514 |
T0 |
6.03-6.49 |
Fluorescence Decay Curves of the Hybrids
-
| hybrid |
base number (n) between the fluorescent dyes |
fluorescence decay curve |
| BP0/Cy54/T0 |
n=4 |
FIG. 9 |
| BP0/Cy58/T0 |
n=8 |
FIG.10 |
| BP0/Cy510/T0 |
n=10 |
FIG.11 |
| BP0/Cy512/T0 |
n=12 |
FIG.12 |
| BP0/Cy514/T0 |
n=14 |
FIG.13 |
| BP0/Cy510 (two kinds of probes were mixed) |
FIG.14 |
- Excitation light: titanium sapphire laser 480 nm
(FIGs. 9-13)
- nitrogen-dye laser 490 nm (FIG. 14)
- Wavelength region of fluorescence measurements: 650-700
nm
-
-
The "BP0/Cy510" is the sample where BP0 40
pmol and cy510 40 pmol were dissolved in 200 µl of
20 mM Tris-HCl (pH 7.4) and 0.5 M NaCl.
-
(b) Fluorescence decay curves in the
fluorescence wavelength region of the acceptors
(650-700 nm) where the donor fluorescent dyes were
Bodipy 493/503 and the acceptor dyes were Cy5 and
the base numbers (n) between the fluorescent dyes in
the hybrids were set at n=10 and the structures
between the two nucleotides to which the fluorescent
dyes bound in the hybrids were made into mixtures of
double-strand and single-strand. Bodipy 493/503 is
labeled to the 5'-end positions of the donor probes
and Cy5 is labeled to the middle parts of the
acceptor probes.
Separation, Purification of the Hybrids by High
Performance Liquid Chromatography
-
| donor probe |
acceptor probe |
specimen DNA |
elution time (mm) on HPLC |
| BP0 |
Cy510 |
T0 |
6.01-6.51 |
| BP0 |
Cy58 |
T2 |
5.63-6.24 |
| BP0 |
Cy56 |
T4 |
5.55-6.24 |
| BP0 |
Cy54 |
T6 |
5.99-6.42 |
Fluorescence Decay Curves of the Hybrids
-
| hybrid |
the number of bases (gap) adopting a single-stranded structure |
fluorescence decay curve |
| BP0/Cy510/T0 |
0 |
FIG. 15 |
| BP0/Cy58/T2 |
2 |
FIG. 16 |
| BP0/Cy56/T4 |
4 |
FIG. 17 |
| BP0/Cy54/T6 |
6 |
FIG. 18 |
| BP0/Cy510 (two kinds of probes were mixed) |
FIG. 19 |
- Excitation light: titanium sapphire laser 480 nm
(FIG. 19)
- nitrogen-dye laser 490 nm (FIGs. 15-18)
- Wavelength region of fluorescence measurements: 650-700
nm
-
-
The "BP0/Cy510" is the sample where BP0 40 pmol
and Cy510 40 pmol were dissolved in 200 µl of 20 mM
Tris-HCl (pH 9.5) and 0.5 M NaCl.
-
(c) Fluorescence decay curves in the
fluorescence wavelength region of the acceptors
(650-700 nm) where the donor fluorescent dyes were
Bodipy 493/503 and the acceptor dyes were Cy5 and
the base numbers (n) between the fluorescence dyes
in the hybrids were set at n=10, the structures
between the two nucleotides to which the fluorescent
dyes bound in the hybrids were made double-strand,
and the labeling positions of one fluorescent dye in
the hybrids were separated from the position of
"gap" (the site at which the two probes were
adjacent to each other) by 0 (the terminal site of a
probe) , one, two, and four bases, respectively.
Bodipy 493/503 is labeled to the 5'-end position of
BP0 or the middle parts of BP1, BP2 and BP4 within
the donor probes and Cy5 is labeled to the middle
parts of the acceptor probes.
Separation, Purification of the Hybrids by High
Performance Liquid Chromatography (HPLC)
-
| donor probe |
acceptor probe |
specimen DNA |
elution time (mm) on HPLC |
| BP0 |
Cy510 |
T0 |
6.01-6.51 |
| BP1 |
Cy59 |
T0 |
5.52-6.12 |
| BP2 |
Cy58 |
T0 |
5.45-5.99 |
| BP4 |
Cy56 |
T6 |
5.46-5.91 |
Fluorescence Decay Curves of the Hybrids
-
| hybrid |
the number of bases from the gap |
fluorescence decay curve |
| BP0/Cy510/T0 |
0 |
FIG. 20 |
| BP1/Cy59/T0 |
1 |
FIG. 21 |
| BP2/Cy58/T0 |
2 |
FIG. 22 |
| BP4/Cy56/T0 |
4 |
FIG. 23 |
| BP0/Cy510 (two kinds of probes were mixed) |
FIG. 24 |
- Excitation light: titanium sapphire laser 480 nm
(FIG. 24)
- nitrogen-dye laser 490 nm (FIGs. 20-23)
- Wavelength region of fluorescence measurements: 650-700
nm
-
-
The "BP0/Cy510" is the sample where BP0 40 pmol
and Cy510 40 pmol were dissolved in 200 µl of 20 mM
Tris-HCl (pH 9.5) and 0.5 H NaCl.
-
(d) Fluorescence decay curves in the
fluorescence wavelength region of the acceptors
(600-650 nm) where the donor fluorescent dyes were
Bodipy 493/503 and the acceptor dyes were Cy3.5 and
the structures between the two nucleotides to which
the fluorescent dyes bound in the hybrids were made
double-stranded and the base numbers (n) between the
fluorescent dyes in the hybrids were set at n=8, 12,
and 16.
Separation, Purification of the Hybrids by High
Performance Liquid Chromatography (HPLC)
-
| donor probe |
acceptor probe |
specimen DNA |
elution time (min) on HPLC |
| BP0 |
Cy358 |
T0 |
5.56-5.93 |
| BP0 |
Cy3512 |
T0 |
5.74-6.35 |
| BP0 |
Cy3516 |
T0 |
5.65-5.85 |
Fluorescence Decay Curves of the Hybrids
-
| hybrid |
base number (n) between the fluorescent dyes |
fluorescence decay curve |
| BP0/Cy358/T0 |
n=4 |
FIG. 25 |
| BP0/Cy3512/T0 |
n=12 |
FIG. 26 |
| BP0/Cy3516/T0 |
n=16 |
FIG. 27 |
| BP0/Cy3512/T0 (two kinds of probes were mixed) |
FIG. 28 |
- Excitation light: titanium sapphire laser 480 nm
- Wavelength region of fluorescence measurements: 650-700
nm
-
-
The "BP0/Cy3512" is the sample where BP0 40
pmol and Cy3512 40 pmol were dissolved in 200 µl of
20 mM Tris-HCl (pH 9.5) and 0.5 M NaCl.
-
(e) Fluorescence decay curves in the fluorescence
wavelength region of the acceptors (650-700 nm)
where the donor fluorescent dyes were FITC and the
acceptor dyes were Cy5 and the structures between
the two nucleotides to which the fluorescent dyes
bound in the hybrids were made double-stranded and
the base numbers (n) between the fluorescent dyes in
the hybrids were set at n=10 and 12.
Separation, Purification of the Hybrids by High
Performance Liquid Chromatography (HPLC)
-
| donor probe |
acceptor probe |
specimen DNA |
elution time (min) on HPLC |
| 5F10 |
5Cy5 |
T0 |
8.12-8.89 |
| 5F12 |
5Cy5 |
T0 |
6.27-6.73 |
Fluorescence Decay Curves of the Hybrids
-
Fluorescence decay curves of the hybrids,
5F10/5Cy5/T0 and 5F12/5Cy5/T0, were measured. The
fluorescence decay curve of a sample was also
measured as control: the sample where 5F 10 40 pmol
and 5Cy5 40 pmol were dissolved in 200 µl of 20 mM
Tris-HCl (pH 9.5) and 0.5 M NaCl. Delays in the
fluorescence decay curves caused by the formation of
the hybrids were noted but not distinct (not shown
in the figures).
- Excitation light: nitrogen-dye laser 480 nm
- wavelength region of fluorescence measurements: 650-700
nm
-
-
(f) Fluorescence decay curves in the fluorescence
wavelength region of the acceptors (650-700 nm)
where the donor fluorescent dyes were FITC and the
acceptor dyes were Cy5 and the structures between
the two nucleotides to which the fluorescent dyes
bound in the hybrids were made single-stranded and
the base numbers (n) between the fluorescent dyes in
the hybrids were set at n=12, 15, and 20.
Separation, Purification of the Hybrids by High
Performance Liquid Chromatography (HPLC)
-
| donor probe |
acceptor probe |
specimen DNA |
elution time (min) on HPLC |
| 5F |
3Cy5 |
T12 |
8.96-9.52 |
| 5F |
3Cy5 |
T15 |
8.76-9.49 |
| 5F |
3Cy5 |
T20 |
8.87-9.26 |
Fluorescence Decay Curves of the Hybrids
-
Fluorescence decay curves of the hybrids-5F/3Cy5/T12,
5F/3Cy5/T15, and 5F/3Cy5/T20- were
measured. The fluorescence decay curve of a sample
was also measured as control: the sample where 5F 40
pmol and 3Cy5 40 pmol were dissolved in 200 µl of
20 mM Tris-HCl (pH 9.5) and 0.5 M NaCl. Delays in
the fluorescence decay curves caused by the
formation of the hybrids were not particularly noted
(not shown in the figures).
- Excitation light: titanium sapphire laser 480 nm
- Wavelength region of fluorescence measurements: 650-700
nm
-
-
(g) Fluorescence decay curves in the
fluorescence wavelength region of the acceptors
(580-630 nm) where the donor fluorescent dyes were
FITC and the acceptor dyes were Cy3 and the
structures between the two nucleotides to which the
fluorescent dyes bound the hybrids were made double-stranded
and the base numbers (n) between the
fluorescent dyes in the hybrids were set at n=12, 15,
and 20.
Separation, Purification of the Hybrids by High
Performance Liquid Chromatography (HPLC)
-
| donor probe |
acceptor probe |
specimen DNA |
elution time (min) on HPLC |
| 3F |
5Cy3 |
T12 |
7.45-8.29 |
| 3F |
5Cy3 |
T15 |
7.22-8.47 |
| 3F |
5Cy3 |
T20 |
7.18-8.07 |
Fluorescence Decay Curves of the Hybrids
-
Fluorescence decay curves of the hybrids-3F/5Cy3/T12,
3F/5Cy3/T15, and 3F/5Cy3/T20- were
measured. The fluorescence decay curve of a sample
was also measured as control: the sample where 3F 40
pmol and 5Cy3 40 pmol were dissolved in 200 µl of
20 mM Tris-HCl (pH 9.5) and 0.5 M NaCl. Delays in
the fluorescence decay curves caused by the
formation of the hybrids were not particularly noted
(not shown in the figures).
- Excitation light: titanium sapphire laser 480 nm
- Wavelength region of fluorescence measurements: 580-630
nm
-
-
(h) Fluorescence decay curves in the
fluorescence wavelength region of the acceptors
(580-630 nm) where the donor fluorescent dyes were
FITC and the acceptor dyes were Cy3 and the
structures between the two nucleotides to which the
fluorescent dyes bound in the hybrids were made
double-stranded and the base numbers (n) between the
fluorescent dyes in the hybrids were set at n=10, 13,
and 15.
Separation, Purification of the Hybrids by High
Performance Liquid Chromatography (HPLC)
-
| donor probe |
acceptor probe |
specimen DNA |
elution time (min) on HPLC |
| 5F10 |
5Cy3 |
T0 |
7.54-7.75 |
| 5F13 |
5Cy3 |
T0 |
7.23-7.45 |
| 5F15 |
5Cy3 |
T0 |
7.24-7.76 |
Fluorescence Decay Curves of the Hybrids
-
Fluorescence decay curves of the hybrids-5F10/5Cy3/T0,
5F/5Cy3/T0, and 5F15/5Cy3/T0- were
measured. The fluorescence decay curve of a sample
was also measured as control: the sample where 5F10
40 pmol and 5Cy3 40 pmol were dissolved in 200 µl of
20 mM Tris-HCl (pH 9.5) and 0.5 M NaCl. Delays in
the fluorescence decay curves caused by the
formation of the hybrids were not particularly noted
(not shown in the figures).
- Excitation light: titanium sapphire laser 480 nm
- Wavelength region of fluorescence measurements: 580-630
nm
-
-
(i) Fluorescence decay curve in the
fluorescence wavelength region of the acceptor (600-650
nm) where the donor fluorescent dye was FITC and
the acceptor dye was XRITC and the structure between
the two nucleotides to which the fluorescent dyes
bound in the hybrid was made double-stranded and the
base number (n) between the fluorescent dyes in the
hybrid was set at n=15.
Separation, Purification of the Hybrid by High
Performance Liquid Chromatography (HPLC)
-
| donor probe |
acceptor probe |
specimen DNA |
elution time (mm) on HPLC |
| 5F15 |
5R16 |
T0 |
6.75-7.53 |
Fluorescence Decay Curve of the Hybrid
-
The fluorescence decay curve of the hybrid,
5F15/5R16/T0, was measured. The fluorescence decay
curve of a sample was also measured as control: the
sample where 5F15 40 pmol and 5R16 40 pmol were
dissolved in 200 µl of 20 mM Tris-HCl (pH 9.5) and
0.5 M NaCl. A delay in the fluorescence decay curve
caused by the formation of the hybrid was not
particularly noted (not shown in the figures).
Excitation light: titanium sapphire laser 480 nm
wavelength region of fluorescence measurement: 600-650
nm
-
(j) Fluorescence decay curves in the
fluorescence wavelength region of the acceptors
(600-650 nm) where the donor fluorescent dyes were
FITC and the acceptor dyes were XRITC and the
structures between the two nucleotides to which the
fluorescent dyes bound in the hybrids were made
single-stranded and the base numbers (n) between the
fluorescent dyes in the hybrids were set at n=4, 8,
12, 15, and 20.
-
These samples were not separated with a high
performance liquid column chromatogram and their
fluorescence decay curves were measured on samples
in which the probes and specimen DNAs were mixed.
The fluorescence decay curve of a sample was also
measured as control: the sample where 3F 40 pmol and
5R16 40 pmol were dissolved in 200 µl of 20 mM
Tris-HCl (pH 9.5) and 0.5 M NaCl. Delays in the
fluorescence decay curves caused by the formation of
the hybrids were not particularly noted (not shown
in the figures).
- Excitation light: titanium sapphire laser 480 nm
- Wavelength region of fluorescence measurements: 600-650
nm
| donor probe | acceptor probe | specimen DNA |
| 3F | 5R16 | T4 |
| 3F | 5R16 | T8 |
| 3F | 5R16 | T12 |
| 3F | 5R16 | T15 |
| 3F | 5R16 | T20 |
-
-
(k) Fluorescence decay curves in the
fluorescence wavelength region of the acceptors
(650-700 nm) where the donor fluorescent dyes were
Bodipy 493/503 and the acceptor dyes were Cy5 and
the structures between the two nucleotides to which
the fluorescent dyes bound in the hybrids were made
single-stranded and the base numbers (n) between the
fluorescent dyes in the hybrids were set at n=4, 8,
10, 12, 15, and 20.
-
Bodipy 493/503 is labeled to the 5'-end
positions of the donor probes and Cy5 is labeled to
middle parts of the acceptor probes.
Separation, Purification of the Hybrids by High
Performance Liquid Chromatography (HPLC)
-
| donor probe |
acceptor probe |
specimen DNA |
elution time (min) on HPLC |
| BP0 |
3Cy5 |
T4 |
7.02-7.59 |
| BP0 |
3Cy5 |
T8 |
7.37-8.10 |
| BP0 |
3Cy5 |
T10 |
8.74-9.32 |
| BP0 |
3Cy5 |
T12 |
8.91-9.22 |
| BP0 |
3Cy5 |
T15 |
8.83-9.18 |
| BP0 |
3Cy5 |
T20 |
8.69-9.17 |
Fluorescence Decay Curves of the Hybrids
-
| hybrid |
base number (n) between the fluorescent dyes |
fluorescence decay curve |
| BP0/3Cy5/T4 |
n=4 |
FIG. 29 |
| BP0/3Cy5/T8 |
n=8 |
FIG. 30 |
| BP0/3Cy5/T10 |
n=10 |
FIG. 31 |
| BP0/3Cy5/T12 |
n=12 |
FIG. 32 |
| BP0/3Cy5/T15 |
n=15 |
FIG. 33 |
| BP0/3Cy5/T20 |
n=20 |
FIG. 34 |
-
FIG. 35 represents the fluorescence decay curve
of the sample where BP0 40 pmol and Cy510 40 pmol.
were dissolved in 200 µl of 20 mM Tris-HCl (pH 9.5)
and 0.5 M NaCl.
- Excitation light: titanium sapphire laser 480 nm
(FIGs. 29-34)
- nitrogen-dye laser 490 nm (FIG. 35)
- Wavelength region of fluorescence measurements: 650-700
nm
-
2. Detection of Specimen in a Sample where
Detection Probes Are Present in Excess Relative to
the Specimen
(1) Synthesis of the Probes
-
Fluorescent labeled oligo-DNAs and fluorescent
labeled oligonucleotides of the phosphorothioate
type (S-oligo) having base sequences as described
below were synthesized according to the procedures
as described in the foregoing "1. Detection Probes
(1) Synthesis of the Detection Probes."
Oligo-DNAs labeled with Bodipy 493/503
-
- BP0:5'-XAGCGCGCAATTAACCC-3'
- D1: 5'-XTCTAGTTGGTCTGTC-3'
-
-
In BP0 and D1 as described above, "X" denotes
the position to which Bodipy 493/503 binds.
S-Oligo labeled with Bodipy 493/503
-
- D2: 5'-XTCTAGTTGGTCTGTC-3'
-
-
In D2 as described above, "X" denotes the
position to which Bodipy 493/503 binds.
Oligo-DNAs labeled with Cy5
-
- Cy512: 5'-GCTAXGACCATGATTAC-3'
- A1: 5'-GCAXACTTCXTCATCT-3'
-
-
In Cy 512 and A1 as described above, "X"
denotes the position to which Cy5 binds.
S-Oligo labeled with Cy5
-
- A2: 5'-GCAGAXCTTCTCATCT-3'
-
-
In A2 as described above, "X" denotes the
position to which Cy5 binds.
(2) Synthesis of Specimen DNAs and RNAs
-
Specimen DNAs and RNAs having the base
sequences as described below were synthesized
according to the procedures as described in the
foregoing "1. Detection Probes (2) Synthesis of
Specimen DNAs."
Specimen DNA (T0)
-
- 5'-GGGTTAATTGCGCGCTGTAATCATGGTCATAGC-3'
-
Specimen RNA (RT1)
-
- 5'-GACAGACCAACUAGAAGAUGAGAAGUCUGC-3'
-
(3) Preparation of Samples for Measurement and
Measurements of Fluorescence Spectra and
Fluorescence Decay Curves
-
A pair of detection probes consisting of a
donor probe and an acceptor probe (each 200 pmol)
and varying concentrations of a specimen were mixed
in 200 µl of 1xSSC buffer (15 mM Na3citrate, pH 7.0,
150 mM NaCl) and allowed to react at room
temperature for 10 min. Subsequently, fluorescence
spectra and fluorescence decay curves were measured.
Measurements of Fluorescence Spectra
-
- Fluorescence spectrophotometer: Hitachi F-4500
- Excitation wavelength: 490 nm
- Recording wavelength of fluorescence spectra: 500-750
nm
-
-
Measurements of fluorescence decay curves
Picosecond fluorescence lifetime recording device
C4780 (Hamamatsu Photonics Co. Ltd.)
Excitation light sources:
-
- 1. Argon laser excitation titanium sapphire
laser (Spectra Physics Inc.)
- Argon ion laser: Model 2080
- Mode-lock titanium sapphire laser: TSUNAMI
- Frequency doubler/pulse selector: Model
3980
- 2. Nitrogen-dye laser (Laser Photonics)
- nitrogen laser: Model LN1200
- Dye: COUMARIN 307
- Wavelength region for fluorescence
- measurements: 650-700 nm
-
-
(a) For the detection probe in order to detect
a DNA that serves as a specimen, there is used a
pair of oligo-DNAs: the donor fluorescent dye is
Bodipy 493/503 and the acceptor dye is Cy5; the
spacing between the two nucleotides to which the
fluorescent dyes bind adopts a double-stranded
structure when the hybrid is formed and the base
number (n) for the spacing is set at 12 (n=12); and
the Bodipy 494/503 is bound to the nucleotide
locating at the gap of the hybrid.
| donor probe | acceptor probe | specimen | fluorescence decay curve | fluorescence spectrum |
| BP0 | Cy512 | T0 | FIG. 4 | FIG. 5 |
Fluorescence Decay Curves (FIG.4)
-
| number in the figure |
amount of detection probe |
amount of specimen DNA |
molar ratio (Specimen DNA/probe) |
| 1 |
200 pmol |
0 |
0 |
| 2 |
200 pmol |
2 pmol |
1% |
| 3 |
200 pmol |
6 pmol |
3% |
| 4 |
200 pmol |
10 pmol |
5% |
| 5 |
200 pmol |
40 pmol |
20% |
-
As is evident from FIG. 4, with increasing
amounts of the specimen DNA the decay curves are
more delayed. In the figure, decay curve 1 (a
sample containing no specimen) and decay curve 2 (a
sample containing the specimen DNA with its content
being 1% as a molar ratio relative to the probe) are
unambiguously distinguishable and even if the
detection probe are present in 1000-fold excess,
detection of the specimen is feasible.
Fluorescence Spectra (FIG. 5)
-
| number in the figure |
amount of detection probe |
amount of specimen DNA |
molar ratio (Specimen DNA/probe) |
| 1 |
200 pmol |
0 |
0 |
| 2 |
200 pmol |
2 pmol |
1% |
| 3 |
200 pmol |
6 pmol |
3% |
| 4 |
200 pmol |
10 pmol |
5% |
| 5 |
200 pmol |
40 pmol |
20% |
-
In the fluorescence spectrum, spectra 1-3 are
practically indistinguishable, and it is also
difficult to recognize any changes in the spectra 1
and 4.
-
(b) For the detection probe in order to detect
a RNA that serve as a specimen, there is used a pair
of oligo-DNAs: the donor fluorescent dye is Bodipy
493/503 and the acceptor dye is Cy5; the spacing
between the two nucleotides to which the fluorescent
dyes bind adopts a double-stranded structure when
the hybrid is formed; and the Bodipy 494/503 is
bound to the nucleotide locating at the gap of the
hybrid.
| donor probe | acceptor probe | specimen | base number between the two dyes | fluorescence decay curve | fluorescence spectrum |
| D1 | A1 | RT1 | n=12 | FIG. 36 | FIG. 37 |
Fluorescence Decay Curves (FIG. 36)
-
| number in figure |
amount of detection probe |
amount of specimen RNA |
molar ratio (Specimen/probe) |
| 1 |
200 pmol |
0 |
0 |
| 2 |
200 pmol |
5 pmol |
2.5% |
| 3 |
200 pmol |
10 pmol |
5% |
| 4 |
200 pmol |
40 pmol |
20% |
Fluorescence Spectra (FIG. 37)
-
| number in figure |
amount of detection probe |
amount of specimen RNA |
molar ratio (Specimen/probe) |
| 1 |
200 pmol |
0 |
0 |
| 2 |
200 pmol |
5 pmol |
2.5% |
| 3 |
200 pmol |
10 pmol |
5% |
| 4 |
200 pmol |
40 pmol |
20% |
-
As is shown in FIG. 36, with increasing amounts
of the specimen RNA the decay curves are more
delayed. From the figure, it is apparent that even
under the conditions where the detection probes are
present in large excess relative to the specimen RNA,
detection of the specimen RNA is feasible.
-
(c) For the detection probe in order to detect
a RNA that serves as a specimen, there is used a
pair of oligo-DNAS of the phosphothioate type: the
donor fluorescent dye is Bodipy 493/503 and the
acceptor dye is Cy5; the spacing between the two
nucleotides to which the fluorescent dyes bind
adopts a double-stranded structure when the hybrid
is formed; and the Bodipy 494/503 is bound to the
nucleotide locating at the gap of the hybrid.
| donor probe | acceptor probe | specimen | base number between two dyes | fluorescence decay curve |
| D2 | A2 | RT1 | n=10 | FIG. 38 |
Fluorescence Decay Curves (FIG. 38)
-
| number in figure |
amount of detection probe |
amount of specimen RNA |
molar ratio (Specimen/probe) |
| 1 |
200 pmol |
0 |
0 |
| 2 |
200 pmol |
5 pmol |
2.5% |
| 3 |
200 pmol |
10 pmol |
5% |
| 4 |
200 pmol |
40 pmol |
20% |
-
As is shown in FIG. 38, with increasing amounts
of the specimen RNA the decay curves are more
delayed. From the figure, it is apparent that even
if under the conditions where the detection probes
are present in large excess relative to the specimen
RNA, detection of the specimen RNA is feasible.
INDUSTRIAL APPLICABILITY
-
This invention has developed detection probes
and method of detection that will enable the
detection of DNAs and RNAs having specified base
sequences contained in a specimen sample with great
ease, accuracy, and high sensivity. It is
anticipated that if the detection probes and method
of detection according to this invention are applied
to gene diagnosis, cell diagnosis and the like, they
will exercise great power. It is also expected that
by applying the detection probe and method of
detection according to this invention to
experimental protocols in the field of genetic
engineering such as gene cloning, experimental
techniques in said filed will be advanced immensely.