EP0668498A2 - Method and instrument for measuring fluorescence resonance energy transfer - Google Patents
Method and instrument for measuring fluorescence resonance energy transfer Download PDFInfo
- Publication number
- EP0668498A2 EP0668498A2 EP95300981A EP95300981A EP0668498A2 EP 0668498 A2 EP0668498 A2 EP 0668498A2 EP 95300981 A EP95300981 A EP 95300981A EP 95300981 A EP95300981 A EP 95300981A EP 0668498 A2 EP0668498 A2 EP 0668498A2
- Authority
- EP
- European Patent Office
- Prior art keywords
- fluorescence
- light
- wavelength
- energy transfer
- over
- Prior art date
- Legal status (The legal status is an assumption and is not a legal conclusion. Google has not performed a legal analysis and makes no representation as to the accuracy of the status listed.)
- Granted
Links
Images


Classifications
-
- G—PHYSICS
- G01—MEASURING; TESTING
- G01N—INVESTIGATING OR ANALYSING MATERIALS BY DETERMINING THEIR CHEMICAL OR PHYSICAL PROPERTIES
- G01N21/00—Investigating or analysing materials by the use of optical means, i.e. using sub-millimetre waves, infrared, visible or ultraviolet light
- G01N21/62—Systems in which the material investigated is excited whereby it emits light or causes a change in wavelength of the incident light
- G01N21/63—Systems in which the material investigated is excited whereby it emits light or causes a change in wavelength of the incident light optically excited
- G01N21/64—Fluorescence; Phosphorescence
- G01N21/6408—Fluorescence; Phosphorescence with measurement of decay time, time resolved fluorescence
-
- G—PHYSICS
- G01—MEASURING; TESTING
- G01N—INVESTIGATING OR ANALYSING MATERIALS BY DETERMINING THEIR CHEMICAL OR PHYSICAL PROPERTIES
- G01N21/00—Investigating or analysing materials by the use of optical means, i.e. using sub-millimetre waves, infrared, visible or ultraviolet light
- G01N21/62—Systems in which the material investigated is excited whereby it emits light or causes a change in wavelength of the incident light
- G01N21/63—Systems in which the material investigated is excited whereby it emits light or causes a change in wavelength of the incident light optically excited
- G01N21/64—Fluorescence; Phosphorescence
- G01N2021/6417—Spectrofluorimetric devices
- G01N2021/6421—Measuring at two or more wavelengths
-
- Y—GENERAL TAGGING OF NEW TECHNOLOGICAL DEVELOPMENTS; GENERAL TAGGING OF CROSS-SECTIONAL TECHNOLOGIES SPANNING OVER SEVERAL SECTIONS OF THE IPC; TECHNICAL SUBJECTS COVERED BY FORMER USPC CROSS-REFERENCE ART COLLECTIONS [XRACs] AND DIGESTS
- Y10—TECHNICAL SUBJECTS COVERED BY FORMER USPC
- Y10S—TECHNICAL SUBJECTS COVERED BY FORMER USPC CROSS-REFERENCE ART COLLECTIONS [XRACs] AND DIGESTS
- Y10S436/00—Chemistry: analytical and immunological testing
- Y10S436/805—Optical property
-
- Y—GENERAL TAGGING OF NEW TECHNOLOGICAL DEVELOPMENTS; GENERAL TAGGING OF CROSS-SECTIONAL TECHNOLOGIES SPANNING OVER SEVERAL SECTIONS OF THE IPC; TECHNICAL SUBJECTS COVERED BY FORMER USPC CROSS-REFERENCE ART COLLECTIONS [XRACs] AND DIGESTS
- Y10—TECHNICAL SUBJECTS COVERED BY FORMER USPC
- Y10T—TECHNICAL SUBJECTS COVERED BY FORMER US CLASSIFICATION
- Y10T436/00—Chemistry: analytical and immunological testing
- Y10T436/14—Heterocyclic carbon compound [i.e., O, S, N, Se, Te, as only ring hetero atom]
- Y10T436/142222—Hetero-O [e.g., ascorbic acid, etc.]
- Y10T436/143333—Saccharide [e.g., DNA, etc.]
Abstract
Description
- The present invention relates to a method and an apparatus for identifying substances by measuring the energy transferred between and within molecules and more particularly to detecting small amounts of substances within living cells by measuring energy transfer.
- Fluorescence resonance energy transfer (FRET) within or between two different types of molecule, that occurs when energy from an excited donor fluorophore is transferred directly to an acceptor fluorophore, is a useful phenomenon for studying the character of molecules. This method is especially useful for in vitro measurements of small quantities of substances and can be applied to analysis of genetic information to measure expression of genes and changes in the primary structure of DNA and RNA to a high degree of precision.
- Next, an explanation will be provided for a general method for measuring energy transfer from an excited fluorophore (donor) to an absorber (acceptor).
- 1. The spectra, including changes in the spectra, of fluorescence from the donor and acceptor are measured.
- 2. Reduction in intensity of fluorescence from the donor or increase in intensity of fluorescence from the acceptor is measured.
- 3. The speed at which the intensity of the fluorescent intensity of the donor decreases after pulse-laser excitation (i.e., the fluorescence lifetime) is measured.
- However, sometimes the sample contains numerically more molecules that do not emit energy (i.e., free molecules) than molecules that do emit energy, in which case measurement using this three-step method is impossible. This three-step method is also not possible when the density of energy-transferring donors or acceptors can not be determined. Because in this three-step method fluorescence from both energy- emitting and non-energy emitting molecules is measured, the characteristic change in fluorescence which occurs from energy transfer is buried in the fluorescence produced by molecules that do not emit energy. Also, when the increase in fluorescence intensity in the acceptor is measured in
step 2, the acceptor directly absorbs some of the excitation light and fluoresces at an intensity significant compared to the intensity of acceptor fluorophore emission from energy transfer. This makes determination of only the energy transfer induced fluorescence from the acceptor fluorophore impossible. - Larry E. Morrison describes a method of measuring energy transfer under these conditions (Analytical Biochemistry 174, pp 101-120, 1988). His technique "requires the selection of donor and acceptor fluorophores such that the fluorescence lifetime of the donor is greater than the fluorescence lifetime of the acceptor." The fluorescence emitted from the acceptor is measured a predetermined duration of time (set by a delay gate) after the donor fluorophore has been excited by the pulse of light. With this method, the fluorescence emitted from the acceptor as a result of direct absorption of the excitation light is temporally separated from the fluorescence emitted from the acceptor by energy transfer. Measurement of energy transfer is improved because the fluorescence contributed by light excitation (i.e., not by energy transfer) of the acceptor is eliminated.
- Roger Y. Tsein et al. describe a method wherein the ratio of the fluorescent intensities of the donor and the acceptor when excited by a certain wavelength excitation light is calculated and an image produced from the results (Trends in Cell Biology, Vol. 3, pp. 242-245, 1993). Takatoku Oida et al. describe temporal analysis of imaging (Biophys. J., Vol. 64, pp.676-685, 1993). With those two methods, fluorescence for each fluorophore can be separated by electric gating of detector signals. Scattering of light or mixing with light other than the objective fluorescence can be prevented. Precision in measuring fluorescent intensity can be increased by differences in the length of the optical pathways. Influence of unknown densities of molecules can also be reduced. Energy transfer within cultivated cells can be measured under a microscope.
- However, when the amount of free donor fluorophores that do not emit energy becomes rather large, the long wavelength region of the donor fluorescence gets largely mixed in the short wavelength region of the acceptor fluorescence, with the result that the fluorescence from the donor and from the acceptor can not be separated. For these reasons, energy transfer in living samples, such as cultivated cells, is particularly difficult to measure.
- It is an objective of the present invention to provide a method and an apparatus that allow measurement of energy transfer that occurs in only a few molecules even when energy transfer does not occur in most of the molecules.
- In order to attain the above object and other objects, the present invention provides a method of measuring energy transfer between a plurality of light emission molecules, the method comprising the steps of: irradiating with excitation light a plurality of light emission molecules, having different light emission lifetimes, so that the light emission molecules emit light; dividing the emitted light into at least two different wavelength regions; measuring temporal changes in each of the at least two wavelength regions of the light emission over at least two different time periods; and determining information on energy transfer generated between the plurality of light emission molecules based on the measured results in each of the wavelength regions over each of the time periods.
- The plurality of light emission molecules may include two kinds of fluorophores having different fluorescence lifetimes.
- The wavelength dividing step may divide the emitted fluorescence into a first wavelength region and a second wavelength region different from each other. The temporal change measuring step may measure temporal changes in the first wavelength region and the second wavelength region of the fluorescence over a first time period and a second time period different from each other. The energy transfer information determining step may determine the information, based on the fluorescence in each of the first and second wavelength regions over each of the first and second time periods.
- Fluorescence intensity of fluorescence from the acceptor fluorophores attenuates over time after the irradiation of the excitation light, in accordance with its fluorescent lifetime, the attenuation being substantially completed at a first timing. Fluorescence intensity of fluorescence from the donor fluorophores attenuates over time after the irradiation of the excitation light, in accordance with its fluorescent lifetime, the attenuation being substantially completed at a second timing. The fluorescence lifetime of the donor fluorophores varies when energy transfer occurs from the donor fluorophores to the acceptor fluorophores so that fluorescence intensity of fluorescence from the donor fluorophores attenuates over time when the energy transfer occurs after the irradiation of the excitation light, in accordance with its varied fluorescent lifetime, the attenuation being substantially completed at a third timing different from the second timing. The temporal change measuring step may include the step of setting the first time period between the first timing and the third timing and setting the second time period between the third timing and the second timing.
- The energy transfer information determining step may calculate the following formula with the fluorescence over each time period:

- wherein ID1 is the intensity of fluorescence in the first wavelength region obtained over the first time period; ID2 is the intensity of fluorescence in the first wavelength region obtained over the second time period; IA1 is the intensity of fluorescence in the second wavelength region obtained over the first time period; and IA2 is the intensity of fluorescence in the second wavelength region obtained over the second time period.
- According to another aspect, the present invention provides a device for measuring energy transfer between a plurality of light emission molecules, the device comprising: a light source for irradiating a plurality of light emission molecules having different light emission lifetimes with excitation light so that the plurality of light emission molecules emit light; a wavelength divider for dividing the emitted light into a first wavelength region and a second wavelength region different from each other; a measuring unit for measuring temporal changes in the light in the first wavelength region and the second wavelength region over a first time period and a second time period different from each other; and a determination unit for determining information on energy transfer occurring between the light emission molecules, based on the light intensity of the first and second wavelength regions during the first time period and the second time period.
- The above and other objects, features and advantages of the invention will become more apparent from reading the following description of the preferred embodiment taken in connection with the accompanying drawings in which:
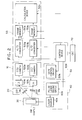
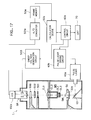
- Fig. 1 shows a schematic structure of the energy transfer measuring device of an embodiment of the present invention;
- Fig. 2 shows a structure of a detailed example of the energy transfer measuring device of the embodiment;
- Fig. 3 shows a structure of a concrete example of the energy transfer measuring device of the embodiment;
- Fig. 4 illustrates how the wavelength regions are set for the fluorescence light from donor and acceptor;
- Fig. 5(a) shows temporal change in intensity of fluorescence from fluorophore;
- Fig. 5(b) shows an excitation light irradiation timing for causing the fluorophore to emit fluorescence shown in Fig. 5(a);
- Fig. 5(c) shows a gate opening timing according to a first method;
- Fig. 5(d) shows a gate opening timing according to a second method;
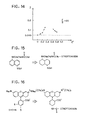
- Fig. 6(a) shows chemical formulas of IEADANS;
- Fig. 6(b) shows chemical formulas of TRITC;
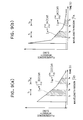
- Fig. 7(a) shows temporal change in intensity of fluorescence from free donor fluorophore;
- Fig. 7(b) shows temporal charge in intensity of fluorescence from free acceptor fluorophore;
- Fig. 7(c) shows an excitation light irradiation timing for causing the free donor fluorophore to emit fluorescence shown in Fig. 7(a) and for causing the free acceptor fluorophore to emit fluorescence shown in Fig. 7(b);
- Fig. 8 shows temporal change in intensity of fluorescence from a sample containing free donor fluorophores and free acceptor fluorophores;
- Fig. 9(a) shows temporal change in intensity of fluorescence of wavelength region ΓD of the fluorescence of Fig. 8;
- Fig. 9(b) shows temporal change in intensity of fluorescence of wavelength region rA of the fluorescence of Fig. 8;
- Fig. 10 is a circuitry diagram of an example of the calculation device for calculating the parameter Z;
- Fig. 11 (a) shows temporal change in intensity of fluorescence at wavelength region ΓD from free donor fluorophore;
- Fig. 11 (b) shows temporal change in intensity of fluorescence at wavelength region ΓD from free acceptor fluorophore;
- Fig. 11 (c) shows temporal change in intensity of fluorescence at wavelength region rA from free donor fluorophore;
- Fig. 11 (d) shows temporal change in intensity of fluorescence at wavelength region rA from free acceptor fluorophore;
- Fig. 11 (e) shows temporal change in intensity of fluorescence at wavelength region ΓD from donor fluorophore when energy transfer occurs;
- Fig. 11 (f) shows temporal change in intensity of fluorescence at wavelength region ΓD from acceptor fluorophore when energy transfer occurs;
- Fig. 11 (g) shows temporal change in intensity of fluorescence at wavelength region rA from donor fluorophore when energy transfer occurs;
- Fig. 11 (h) shows temporal change in intensity of fluorescence at wavelength region ΓA from acceptor fluorophore when energy transfer occurs;
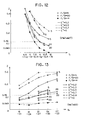
- Fig. 12 shows relationship between the parameter Z and the time period T1, the F/B and the E*;
- Fig. 13 shows relationship between the parameter Z and the time period T2, the F/B and the E*;
- Fig. 14 shows relationship between the parameter Z and the E*;
- Fig. 15 shows how IEADANS is tagged with streptoavidin in a first sample;
- Fig. 16 shows how TRITC is tagged with streptoavidin in a first sample;
- Fig. 17 shows a structure of another detailed example of the energy transfer measuring device of the embodiment; and
- Fig. 18 illustrates how fluorescent images for the two wavelength regions at the two time periods are separated to be incident on an image receiving region of the CCD camera of the device of Fig. 17.
- A method and instrument for measuring fluorescence resonance energy transfer according to a preferred embodiment of the present invention will be described while referring to the accompanying drawings wherein like parts and components are designated by the same reference numerals to avoid duplicating description.
- As shown in Fig. 1, an energy-
transfer measuring instrument 1 according to the present invention includes: anexcitation light source 40; asample holder 30; awavelength divider 20 such as a filter, a prism, or a diffraction grating; alight detector 10 including a gate; adata processing portion 50; and aprocessor 60. - The
excitation light source 40 is for irradiating a sample mounted in thesample holder 30 with excitation light. Theexcitation light source 40 can be a gas laser such as a nitrogen, helium-neon, or argon ion laser, a semiconductor laser, or an ultraviolet light source. The laser is preferable for the light source, and the gas laser is more preferable because laser light, preferably generated by a gas laser, makes a good excitation light in terms of excitation ability and in terms of intensity. Thelight detector 10 can be a photomultiplier tube, a photodiode, an avalanche photodiode, a streak tube, or a charge-coupled device (CCD). - FRET is generated from resonant interaction between two molecules: an energy contributing donor molecule and an energy receiving acceptor. Both the donor molecule and the acceptor molecule are light emission molecules, such as fluorescent, phosphorescent, and chemiluminescent molecules, which emit light when excited by excitation light. The donor molecule and the acceptor molecule show different emission lifetimes. Energy transfer can occur when the emission spectrum of the donor overlaps the absorption spectrum of the acceptor. Also, the donor and the acceptor must be within a certain distance (for example, less than 8 nm) from each other. Preferable donor/acceptor combinations that can be used with this method are fluorescent donors with fluorescent or phosphorescent acceptors, or phosphorescent donors with phosphorescent or fluorescent acceptors.
- The measurement device of the present invention will be described below, with reference to an example wherein the sample to be measured includes two fluorophores that show different fluorescence lifetimes when excited by the excitation light.
- Fluorescence generated upon irradiation with an excitation light can be separated into a predetermined number (two in the present embodiment) of different wavelengths by using the
wavelength divider 20. Afterward, the divided light is measured by thelight detector 10. Measurement by thelight detector 10 is performed after a predetermined duration of time passes after irradiation by theexcitation light source 40. That is, when irradiation is performed using a pulse of light from theexcitation light source 40, thelight detector 10 is triggered into operation after the lowering edge of the pulse of light. The temporal attenuation of the detection signal from thelight detector 10 is read over at least two separate time periods and sent to thedata processing portion 50. Detection signals can be read over two different time periods by opening the gate of thelight detector 10 during the time periods. Theprocessor 60 controls drive of theexcitation light source 40 and thelight detector 10 and processes of thedata processing portion 50. - However, the
light detector 10 need not be provided with gates. For example, thelight detector 10 could constantly output detection signals to thedata processing portion 50 and theprocessing portion 50 operated to separate the detection signals by time periods. However, the excitation light irradiating timing and the two detection signal pick up durations should be set within a very short time period relative to the response speed of thedata processing portion 50. Accordingly, it is desirable to set the two time periods directly by thelight detector 10. - The combination of the
wavelength divider 20 and thelight detector 10 serves to divide light emitted from the excited sample into two separate wavelengths and into two separate time periods so as to obtain data on four separate physical values. The data can then be processed by thedata processing portion 50 in a manner to be described later to determine the existence of energy transfer, the condition of energy transfer, and the other information. - Fig. 2 shows a more detailed example of the energy
transfer measurement instrument 1 shown in Fig. 1. The sample SM mounted in thesample holder 30 in this example contains donor and acceptor fluorophores. Thelight source 40 includes agas laser 40a and a pulselaser drive circuit 40a, which is for driving thegas laser 40a in pulses. The sample SM will emit fluorescence upon irradiation by light from thegas laser 40a. Because the sample includes fluorescent molecules of both the donor and the acceptor, the wavelengths of fluorescence from the sample span a wavelength region r of light emitted from the excited donor and a wavelength region rA of light emitted from the acceptor. Atransmission filter 201, with a transmission region corresponding to the wavelength region rp, end atransmission filter 202, with a transmission region corresponding to the wavelength region rA, serve as thewavelength divider 20. The generated fluorescence is therefore divided into two different wavelength regions when passed through thesefilters 210 and 202. - Fluorescence at the wavelength regions ΓD and rA are inputted to
image intensifiers 101 aend 101 b respectively. Each of theimage intensifiers - The fluorescent images thus outputted from the
image intensifiers CCD cameras CCD cameras gas laser 40a outputs a pulse of excitation light, thegate control circuit 60a outputs a trigger signal simultaneously to both of theimage intensifiers image intensifiers image intensifiers CCD cameras - The fluorescence intensity of each pixel of the
CCD cameras - The signal charges outputted from the
CCD cameras 102a and 102 during the first time period T1 and the second time period T2 are successively converted to digital signals by the A/D converters frame memories frame memories calculation device 50c then calculates total fluorescence intensity for each wavelength region by spatially integrating the pixel fluorescence intensities at each time period. The total fluorescence intensity at wavelength region ΓD over the first time period T1 will be referred to as fluorescence intensity ID1 hereinafter. The total fluorescence intensity at wavelength region ΓD over the second time period T2 will be referred to as fluorescence intensity ID2 hereinafter. The total fluorescence intensity at wavelength region ΓA over the first time period T1 will be referred to as fluorescence intensity IA1 hereinafter. The total fluorescence intensity at wavelength region ΓA over the second time period T2 will be referred to as fluorescence intensity IA2 hereinafter. Information on energy transfer can be calculated based on the fluorescence intensities ID1, ID2, IA1, and IA2, as will be described later. The fluorescence intensities and the calculated information on energy transfer are sent to thecontrol device 60b so that it can be outputted to theCRT 70, which serves as an external output device. - Fig. 3 shows a concrete example of the
device 1 shown in Fig. 2. Coherent excitation light emitted from thegas laser 40a reflects off aplanar mirror 101, passes through onexcitation transmission filter 30b and asample mounting glass 30a and irradiates the sample SM mounted on theglass 30a. The fluorescence emitted from the sample SM is focused by a microscope MS so as to be incident on ahalf mirror 100. Thehalf mirror 100 divides the incident light into two parts. One part passes through thehalf mirror 100 so as to be incident on thetransmission filter 201 for the donor wavelength region ΓD. The other part reflects off thehalf mirror 100 so as to be incident on thetransmission filter 202 for the acceptor wavelength region rA. The same processes described while referring to the device shown in Fig. 2 are performed on the fluorescence that passes through the transmission filters 201 and 202, whereupon the resultant fluorescence intensities and energy transfer information are displayed on theCRT 70. - The excitation
light transmission filter 30b is for allowing transmission of excitation light at the wavelength region necessary for excitation of the donor and for blocking transmission of background light. The microscope MS includes objective lenses OL1 and OL2, positioned on the sample side of the microscope, and eyepiece lenses CL1 and CL2, positioned at the filter (i.e., 201 and 202) side of the microscope. - The energy transfer measurement device is housed in a light-blocking case VE for preventing external light from becoming incident on the sample, the
CCD cameras - Below will be given an explanation of a method for determining the donor wavelength region ΓD and the acceptor wavelength region rA at which the transmission filters 201 and 202 divide the fluorescence.
- The graph shown in Fig. 4 indicates the spectral characteristics (i.e., relationship between wavelength and intensity) of fluorescence emitted from fluorescent molecules. The solid line represents changes in fluorescence from the donor and the dotted line represents changes in fluorescence from the acceptor. The donor wavelength region ΓD is defined to extend from wavelength λ1 to wavelength X2 and the acceptor wavelength region rA is defined to extend from wavelength λ3 on up. The wavelength X2 of the donor wavelength region ΓD is set below the rising edge of the acceptor fluorescence spectrum. Wavelength λ3 is set so that five percent of the long wavelength part of the donor fluorescence is mixed in the acceptor wavelength region ΓA.Because the spectral characteristics of respective kinds of fluorophores are known, the values λ1 x2, and λ3 (i.e., ΓD and rA) can be determined for the respective fluorophores.
- Below will be given an explanation of a method for determining timing of gate openings by the
image intensifiers - Assume that the sample includes some free fluorophores (for example, free donor) having a specific fluorescence lifetime τF. When the
control device 60b shown in either Fig. 2 or 3 inputs the clock pulse shown in Fig. 5 (b) to the pulselaser drive circuit 40b, the excited fluorophores in the sample SM emits fluorescence at intensities that attenuate over time as shown in Fig. 5 (a). - The fluorescence intensity of the fluorescence over the first time period T1 and over the second time period T2 are obtained by applying a voltage to the MCP's of the
image intensifiers - To improve the signal-to-noise ratio of the
CCD cameras image intensifiers CCD cameras CCD cameras image intensifiers image intensifiers - The signal-to-noise ratio can be further improved by repeatedly sampling the pixel fluorescence intensity during the predetermined time periods T1 and T2 using either gate method A or B and accumulating the pixel fluorescence to obtain the total fluorescence intensity.
- Concrete values of the first time period T1 and the second time period T2 should be set according to the fluorescence lifetime τ of the fluorophores to be measured by the
energy transfer detector 1. - Below will be described a method for determining the values T1 and T2 with reference to an example for using IEADANS (shown in Fig. 6(a)) as donor and TRITC (shown in Fig. 6(b)) as acceptor. It is known that IEADANS (donor) has a fluorescence lifetime τF-D of 15.0 ns under circumstances where no TRITC (acceptor) is present close to IEADANS, that is, when IEADANS is free. It is also known that TRITC has a fluorescence lifetime τF-p of 1.5 ns when free, that is, under circumstances where no IEADANS is present close to TRITC. Because the fluorescence lifetime of IEADANS (donor) is longer than that of TRITC (acceptor), they are suitable for being measured by the device of the present invention.
- The first time period T1 and the second time period T2 should he set as shown in Fig. 7 when the sample includes these free donor and free acceptor molecules. It is noted that values along the vertical axis of Fig. 7 are logarithmically expressed. When this sample is irradiated with the pulse of excitation light shown in Fig. 7(c), the free donor emits fluorescence over time as shown in Fig. 7(a) and the free acceptor emits fluorescence over time as shown in Fig. 7(b). As can be seen in Figs. 7(a) and 7(b), fluorescence from both the free donor and the free acceptor attenuates with passage of time until the fluorescence from the free acceptor attains an intensity of zero at time point tF-A-end and the fluorescence from the free donor attains an intensity of zero at time point tF-D-end. The first time period T1 is set to begin after time point tF-A-end and the second time period T2 is set to begin after first time period T1 and to end before the time point tF-D-end.
- Fig. 8 shows temporal changes in intensity of fluorescence totally generated from the sample including both the donor and acceptor. The fluorescence intensity is determined for the first time period T1 and the second time period T2 as indicated by the shaded portion of the graph in Fig. 8. In the device of the present invention, the fluorescence is divided into light of different wavelengths when it passes through the transmission filters 201 and 202. As shown in Fig. 9, the fluorescence of the donor wavelength region (Fig. 9(a)) and of the acceptor wavelength region (Fig. 9(b)) is inputted to the
image intensifiers - When the sample includes not only free donors and free acceptors but also donors and acceptors under energy transfer conditions, the temporal changes in fluorescent intensities shown in Figs. 8 and 9 vary, and the fluorescence intensities ID1, ID2, IA1, and IA2 over the time periods T1 and T2 also vary. Thus, detection of these intensities ID1, ID2, IA1, and IA2 can provide information on energy transfer occurring in the sample.
- The manner of obtaining information on energy transfer will be described according to the present invention.
- The information relating to the presence or absence of energy transfer and/or the amount of energy transfer is obtained from the fluorescence intensities ID1, ID2, IA1, and IA2 through the calculation described below.
- First, a parameter Z of the fluorescence intensity is calculated using the following formula 1:

- One method of performing this calculation is with a
calculation device 50c having the circuitry shown in Fig. 10. The parameter Z is calculated by first inputting the fluorescence intensities ID1, ID2, IA1, and IA2 into this structure including three division circuits 501 C, 502C and 504C and a subtraction circuit 503C. The parameter Z outputted from this circuitry is then inputted to thedetermination circuit 505c where it is judged whether parameter Z is greater than a threshold value Zo. If so, then energy transfer is determined to have taken place in the sample. If parameter Z is determined to be lower than the threshold value Zo then energy transfer is determined not to have taken place. - The threshold value Zo is determined based on various information previously known about energy transfer in the sample, such as the first time period Ti; the second time period T2; the wavelengths λ1, x2, and λ3; the fluorescence lifetimes τF-D and τF-A of the donor and acceptor under free conditions; the ratio ND/NA between the number of donor molecules and the number of acceptor molecules in the sample; the ratio F/B between the number of donor molecules under free conditions and the number of donor molecules under energy transfer condition; and energy transfer efficiency E* defined by an equation of E* = 1 - (τE-DA / τF-D) where τE-DA is the fluorescence lifetime of the donor under energy transfer condition. It is noted that the energy transfer efficiency E* depends on the sixth power r6 of the distance r between the donor and the acceptor.
- The relationship between the above-listed values Ti, T2, λ1, λ2, X3, τF-D, TF-A, ND/NA, F/B, and E*; and the fluorescent intensities ID1, ID2, IA1, and IA2 (i.e., the parameter Z) will be described below.
- Fig. 11 (a) shows temporal changes in fluorescence intensity Ia (t) of donor wavelength region ΓD emitted from free donor when the excitation light is irradiated at time to. Fig. 11 (b) shows temporal changes in fluorescence intensity Ib (t) of donor wavelength region ΓD emitted from free acceptor when the excitation light is irradiated at time to. Fig. 11 (c) shows temporal changes in fluorescence intensity Ib (t) of acceptor wavelength region rA emitted from free donor when the excitation light is irradiated at time to. Fig. 11 (d) shows temporal changes in fluorescence intensity Id (t) of acceptor wavelength region rA emitted from free acceptor when the excitation light is irradiated at time to.
- As apparent from the figures, fluorescence from both the free donor and the free acceptor attenuates with passage of time until the fluorescence from the free acceptor attains an intensity of zero at time point tF-A-end and the fluorescence from the free donor attains an intensity of zero at time point tF-D-end. The temporal attenuation in each of these intensities can be expressed using the following
Formulas 2 through 5:


- It is noted that If τF-D, tF-D-end, TF-A, or tF-A-end is unknown, they can be obtained by the measurement device of the present invention. The sample including the free donor is set in the device and attenuation in intensity of fluorescence from free donor is detected. Similarly, the sample including the free acceptor is set in the device, and attenuation in intensity of fluorescence from the free acceptor is detected. Based on these detected results, the fluorescence lifetimes τF-D and τF-A and the fluorescence attenuation completion time points tF-D-end and tF-A-end under free conditions are calculated.
- Energy transfer will occur when the donor and acceptor are excited when present in the sample in close proximity within about 8 nm from each other. When energy transfer occurs, temporal changes in fluorescence from donor and acceptor vary.
- Fig. 11 (e) shows temporal changes in fluorescence intensity le (t) of donor wavelength region ΓD emitted from energy transferring donor. Fig. 11 (f) shows temporal changes in fluorescence intensity It (t) of donor wavelength region ΓD emitted from energy transferring acceptor. Fig. 11 (g) shows temporal changes in fluorescence intensity Ig (t) of acceptor wavelength region ΓA emitted from energy transferring donor. Fig. 11 (h) shows temporal changes in fluorescence intensity Ih (t) of acceptor wavelength region ΓA emitted from energy transferring acceptor.
- Thus, fluorescence from both the donor and the acceptor, between which energy transfer occurs, attenuates with passage of time until the fluorescence from both the donor and acceptor attains an intensity of zero at time point tE-DA-end. It is apparent from these figures that when energy transfer occurs from the donor to the acceptor, on amount of time required for the donor fluorescence intensity to attain an intensity of zero decreases, and an amount of time required for the acceptor fluorescence intensity to attain an intensity of zero increases.
- The attenuation in each of those intensities over time t can be expressed using the following
Formulas 6 through 9:


- wherein E, G, Hi, and H2 are constants, and τE-oA is the fluorescence lifetime of the energy transferring donor.
- It is apparent that energy transfer shortens the donor fluorescence lifetime. In other words, the donor fluorescence lifetime τE-DA under energy transfer condition is shorter than the lifetime τF-D under free condition.
- It is noted that if τE-DA or tE-DA-end is known, they can also be obtained by the measurement device of the present invention. The sample including the donor and the acceptor under the energy transfer condition is set in the device and attenuation in intensity of fluorescence from donor and acceptor is detected. Based on the detected results, the fluorescence lifetime τE-DA and the fluorescence attenuation completion time points tE-DA-end under energy transfer condition is calculated.
- Generally, the sample to be measured contains free donor, free acceptor and donor and acceptor in which energy transfer occurs. In this case, fluorescence from donor and acceptor caused by energy transfer shown in Figs. 1 (e) - 1(h) is observed in addition to the fluorescence of the free donor and free acceptor shown in Figs. 1 (a) - 1 (d).
- In order to measure the energy transfer thus occurring in the sample, therefore, as shown in Figs. 11 (a) through (h), the first time period T1 is set to begin after time point tF-A-end and to end before time point tE-DA-end (i.e., tF-A-end < T1 < tE-DA-end), and the second time period T2 is set to begin after time point tE-DA-end and to end before the time point tF-D-end (i.e., tE-DA-end < T2 < tF-D-end). In other words, the timings t1 and t2 defining the time period T1 therebetween and the timings t3 and t4 defining the time period T2 therebetween satisfy the following inequalities: tF-A-end < t1, t2 < tE-DA-end, tE-DA-end < t3, and t4 < tF-D-end. These time period settings cause fluorescence emitted from the energy-transferring donor not to be observed over the second time period T2 at wavelength region ΓD or at wavelength region ΓA (Figs. 11-(e) and (g)). These time period settings also cause the fluorescence emitted from the energy-accepting acceptor over the first time period T1 at wavelength region ΓA to be observed (Fig. 11 (h)).
- It is noted that because the fluorescence lifetimes τF-D, τF-A, and τE-DA and the attenuation completion time points tF-A-end, tE-DA-end, and tF-D-end are known or measured by the measuring device of the present invention, the time periods T1 and T2 can be easily determined. For example, when using the above-described IEADANS and TRITC for the donor and the acceptor, it can be determined that T1 is set between 9 and 12 ns and T2 is set between 21 and 27 ns. In other words, t1 = 9 ns, t2 = 12 ns, t3 = 21 ns, and t4 = 27 ns, where t0 (excitation irradiation timing) = 0 ns.
- Based on these time period settings, the values ID1, ID2, IA1, and IA2 have the following relationships with the values T1, T2, λ1, λ2, X3, τF-D, τF-A, ND/NA, F/B, and E*. , F/B, and E*.


- Because the parameter Z is defined by the values ID1, ID2, IA1, and IA2 according to the
Formula 1, the parameter Z have the relationships with the values Ti, T2, λ1, λ2, X3, τF-D, τF-A, ND/NA, F/B, and E*, that are determined by theformulas 1 and 10 - 19. - Figs. 12 and 13 show the relationships between the parameter Z and the values T1 and T2, F/B, and E*, where the other values λ1, λ2, X3, τF-D, TF-A, and ND/NA are fixed to 460nm, 510 nm, 530 nm, 15.0 ns, 1.5 ns, and 1, respectively. It is noted that these values are for measuring the IEADANS and the TRITC. Fig. 12 shows how parameter Z changes dependently on the first time period T1 when the second time period T2 is set to extend between 21 and 27 ns after the pulse of excitation light. Fig. 13 shows how parameter Z changes dependently on the second time period T2 when the first time period T1 is set to extend between 9 and 12 ns after the pulse of excitation light. Each of the figures shows several lines for the case where the values F/B and E* have several values.
- It can be understood from the figures that when energy transfer occurs between the donor and acceptor, parameter Z equals or exceeds 0.049. Accordingly, by setting the threshold value Zo to 0.049 for the measurement of IEADANS and TRITC, the energy
transfer measuring device 1 shown in Fig. 2 or Fig. 3 will determine that energy transfer is present when the measured and calculated parameter Z equals or exceeds the threshold value Zo or absent when the measured and calculated parameter Z is less than the threshold value Zo. - It can also be determined from Figs. 12 and 13 that when energy transfer is occurring in molecules (IEADANS and TRITC) at an energy transfer efficiency E* of 0.3 to 0.7, the value of parameter Z becomes larger than 0.116. Accordingly, by setting another threshold value Z1 of 0.116 when measuring IEADANS and TRITC, the energy
transfer measuring device 1 shown in Fig. 2 or Fig. 3 will determine that energy transfer is occurring at an energy transfer efficiency E* of 0.3 to 0.7 when the measured and calculated parameter Z exceeds the threshold value Z1 or not occurring when the measured and calculated parameter Z is less than the threshold value Zi. - Fig. 14 shows that parameter Z is directly dependent on the energy transfer efficiency E* when both F/B is fixed to 20 and the second time period T2 is cat between 21 and 27 (21 ≦ T2 27). The graph further shows that when the measured parameter Z is equal to or less than the threshold value Zo of 0.049, then energy transfer is determined not to be present. Fig. 14 further shows that when measured parameter Z is equal to or greater than a threshold value Z, of 0.116, the energy transfer efficiency E* of the occurring energy transfer is 0.3 or 0.7 or therebetween (i.e., 0.3 ≦ E* < 0.7). Because the energy transfer efficiency E* is inversely proportional to the sixth power of the distance r between the donor and the acceptor (i.e., r6), the range of the distance r can also be determined based on the thus determined range of the energy transfer efficiency E*. Similarly, if any other values (such as F/B or ND/NA) are unknown, the ranges of these values can be calculated. Thus, any information related to energy transfer can be obtained.
- Experiments were performed using the device shown in Fig. 3 to determine information on energy transfer between IEADANS (referred to as fluorescent molecule D hereinafter) and TRITC (referred to as fluorescent molecule A hereinafter).
- First, a first sample of streptoavidin (protein) tagged with fluorescent molecule D as shown in Fig. 15 was prepared. Then, a second sample of streptoavidin tagged with fluorescent molecule A as shown in Fig. 16. A third sample of streptoavidin tagged with both fluorescent molecule D and fluorescent molecule A was prepared. In the third sample, molecules A and D were tagged to positions of the streptoavidin close enough for energy transfer to occur.
- Then, the fluorescence lifetime TF-D and TF-A of fluorescent molecules A and D under free condition was measured with the
energy transfer instrument 1 shown in Fig. 3. That is, a sample solution containing the first sample was set on thesample setting glass 30a. Fluorescent intensity was measured while varying the time period at which theimage intensifiers - It is noted that based on these measurements, values of the fluorescence attenuation completion timings tF-D-end and tF-A-end for the molecules D and A under free conditions were also obtained. In addition, a sample solution containing the third sample with a relatively high density was set on the
sample setting glass 30a. Fluorescent intensity was measured while varying the time period at which theimage intensifiers 
- According to this experiments, the first time period T1 was set between 9 and 12 ns from the excitation light irradiation timing, and the second time period T2 was set between 21 and 27 ns from the excitation light irradiation timing.
- Then, in order to measure the energy transfer, the device of Fig. 3 was set up as follows. A
nitrogen laser 40a was provided for exciting samples with a 337 nm wavelength laser beam. Afilter 201 was provided for allowing passage of a wavelength region Γ1 spanning 460 to 510 nm. Afilter 202 was provided for allowing passage of a wavelength region r2 from 530 nm and longer. The first time period T1 for operation of theimage intensifier 101 a was set between 9 and 12 ns. The second time period T2 for operation of theimage intensifier 101 b was set between 21 and 27 ns. - In a first experiment, the
fluorescence intensities 101, ID2, IA1, and IA2 were measured for a sample solution containing 1 µM of the first sample and 1 µM of the second sample. In this sample solution, energy transfer did not occur from the fluorescent molecule D to the fluorescent molecule A. The following fluorescence intensities were measured in the first experiment: were measured for a sample solution containing 1 µM of the first sample and 1 µM of the second sample. In this sample solution, energy transfer did not occur from the fluorescent molecule D to the fluorescent molecule A. The following fluorescence intensities were measured in the first experiment:

- In a second experiment, the fluorescence intensities ID1, ID2, IA1, and IA2 were measured for a sample solution containing 1 µM of the first sample, 1 µM of the second sample, and 0.05 µM of the third sample. Of all molecules in the sample, energy transfer occurred in 5% of the sample solution and did not occur in 95%. Accordingly, the ratio F/B was 20. The following fluorescence intensities were measured in the second experiment: were measured for a sample solution containing 1 µM of the first sample, 1 µM of the second sample, and 0.05 µM of the third sample. Of all molecules in the sample, energy transfer occurred in 5% of the sample solution and did not occur in 95%. Accordingly, the ratio F/B was 20. The following fluorescence intensities were measured in the second experiment:


- The values for parameter Z calculated by the
calculation device 50c from the first and second experiments were:

- By comparing the calculated values Z with the threshold value Zo of 0.049, it could be determined that energy transfer did not occur in any molecules during the first experiment and that energy transfer did occur in some molecules during the second experiment. By comparing the calculated values Z with the threshold value Z, of 0.116, it could be further determined that energy transfer of an energy transfer efficiency E* of between 0.3 and 0.7 occurred in the second experiment. Because the energy transfer efficiency E* is inversely proportional to the sixth power of the distance r between positions on the streptoavidin where the donor and the acceptor were tagged can be determined.
- Next, an
energy transfer device 1 according to a second example of the present embodiment will be described while referring to Figs. 17 and 18. In the first example, as shown in Fig. 3, the device is provided with two wavelength selective filters for dividing the fluorescence by wavelength and with two image intensifiers for picking up the fluorescence of each wavelength over each time period. Contrarily, in the second example, a single diffraction grating or prism is used to divide the fluorescence by wavelength, and a single streak tube is used for picking up the fluorescence of each wavelength over each time period. - An energy transfer measuring device with this structure will be described while referring to Fig. 17. The
gas laser 40a (nitrogen laser, for example) is pulsingly driven by the pulselaser drive circuit 40b. The sample SM generates fluorescence when irradiated. The fluorescence is collected by the microscope MS so as to be incident on a streak tube SR after passing through aslit 501, anexcitation cut filter 502, and a diffraction grating (prism) 500. The excitation light cutfilter 502 is for cutting off the excitation light (coherent light from the nitrogen gas laser). The excitation light will become noise for the weak fluorescence that has passed through the filter. The diffraction grating spatially divides the fluorescence that has passed through the filter into the wavelength regions r and rA. - Accordingly, fluorescence, spatially spreading according to its wavelength, is incident on the streak tube SR. Streak tubes from the N3373 streak tube series produced by Hamamatsu Photonics are suitable for use as the streak tube SR. The time period for measurement can be set at picosecond to femtosecond time intervals. The streak tube SR includes a photoelectric surface on which the fluorescence is incident. Electrons resulting from photoelectric conversion of the fluorescence are deflected by deflection electrodes. A fluorescing surface for converting the electrons back to fluorescence is provided at the output of the streak tube SR. The time period is set by the sweep voltage applied to the deflecting electrodes for scanning the electrons. The sweep voltage is supplied to the deflecting electrodes from a sweep
voltage generation circuit 503. The fluorescence outputted from the streak tube SR is picked up as an image by thesame CCD camera 102a shown in Fig. 3. - Fig. 18 shows representation of a fluorescence image incident on the light receiving region of the
CCD camera 102a. The fluorescence image is divided horizontally into separate wavelengths by thediffraction grating 500 and vertically into time periods by the sweep of the streak tube SR. The fluorescence intensity of the regions corresponding to reception regions R1 through R4 are respectively accumulated in thecalculation circuit 50c to determine thefluorescence intensities 101, ID2, IA1, and IA2. Other components of the energy transfer device shown in Fig. 17 are the same as those shown in Fig. 3. Information relating to energy transfer can be obtained from thefluorescence intensities 101, ID2, IA1, and IA2. The fluorescence intensities end energy transfer information are sent to thecontroller 60b and displayed on theCRT 70. - With the device according to the second example, time periods can be set with a high degree of precision using the streak tube SR. Also, because a
diffraction grating 500 is used for dividing the fluorescence by wavelength, the fluorescence from the donor can be divided from the fluorescence from the acceptor using thesame CCD camera 102a. This insures that fluorescence from the donor and from the acceptor are measured simultaneously with no difference in the time periods that may be caused when these are measured by separate units. - While the invention has been described in detail with reference to specific embodiments thereof, it would be apparent to those skilled in the art that various changes and modifications may be made therein without departing from the spirit of the invention, the scope of which is defined by the attached claims.
- For example, in the above described embodiment, whether energy transfer occurred is determined using the parameter Z. However, it would be convenient to define other parameter functions determined based on various test results for each fluorophore sample. An experimenter could then simply refer to values of the parameter functions (for example, Z Zo) to easily determine his/her required information.
- Although IEADANS and TRITC are suggested as a donor/acceptor combination, any combination can be used as long as the donor has a fluorescence lifetime TF-D longer than that TF-A of the acceptor, and the fluorescence spectrum of the donor overlaps the absorption spectrum of the acceptor. For example, fluorescein and tetramethylrhodamin make a good combination with a fluorescence lifetime ratio of four.
- With this method, it is possible to detect the energy transfer occurring in only a small amount of the molecules in the entire sample, even though energy transfer does not occur in most of the molecules of the sample.
- The above-described measurement of energy transfer of the present invention is a very effective when applied to in vivo detection of substances present in only small quantities. The energy transfer method is applicable to a method in which probes (i.e., donor and acceptor molecules that bind with the objective substance in a particular way) are added to the objective substance. Examples of probes are antibodies for when the objective molecule is a protein or complementary oligonucleotides for when the objective molecule is DNA or RNA. By detecting the energy transfer between the probes, the amount of the objective substance that combined with the probes are measured. Sometimes, large amount of free probes (free donors and free acceptors) that are not in combination with the objective molecule or substance are present in the living cell under investigation. Although the free probes can be washed out when the measurement is made in vitro, this is not possible with in vivo measurements. In vivo measurement has to be conducted under conditions where many free donor molecules are present.
- When only a small amount of the objective molecules or substances to be bound with probes are present, sometimes the probes will be absorbed in a manner other than the particular way described above. The signal from probes that are bound with objective molecules in the characteristic manner differs from the signal from free probes or from probes absorbed by the objective molecule in an uncharacteristic manner. By applying this phenomenon to the energy transfer method of the present invention, experiments can be designed so that the signal generated from probe characteristically bound with subject molecule will change when probe binds characteristically with subject molecule. For example, when the base sequence in an DNA or RNA is under investigation, two types of oligonucleotide probe, tagged with different fluorescent reagents at their terminals, are prepared. By attaching these probes to different regions about two to seven bases apart on the objective DNA or RNA through hybridization, the objective DNA or RNA can be detected by measuring the energy transfer between the two fluorescent probes. This detection method is described by Heller, M. J et al., in European Patent Application Publication No.070685 in 1983 and by Heller, M. J and Jablonski E.J. in European Patent Application Publication No. 229943 in 1987.
- Under conditions such as in vivo when the unbound probe can not be washed away, many molecules in which energy transfer does not occur will be present in the sample. Because of this, energy transfer has been conventionally unapplicable to this type of DNA sequencing. The energy transfer device and method according to the present invention solve this problem so that measurement of energy transfer is possible even under conditions such as in vivo when unbound probe can not be washed away.
- According to the present invention, the energy transfer device and method of the present invention, fluorescence generated by excitation light is measured after being divided using, for example, a wavelength divider into at least two different wavelength regions. Additionally, the fluorescence of each different wavelength region is measured over at least two different time periods. Therefore, even when molecules in which energy transfer does not occur are present in great amounts, the existence of only a small number of molecules in which energy transfer occurs can be detected. Also, according to the device for measuring energy transfer of the present invention, identification of a parameter that determines whether energy transfer is present or the mounts and nature of various substances in small quantities can be performed. Because energy transfer is particularly dependent on the distance between the fluorophores, nucleic acid base sequences can be determined with greater precision by measuring information on energy transfer or fluorophores tagged with hybridized complementary nucleic acids during analysis of genetic information such as the present or existence of genetic expression or change in the primary structure of DNA or RNA.
Claims (14)
Applications Claiming Priority (3)
| Application Number | Priority Date | Filing Date | Title |
|---|---|---|---|
| JP01950094A JP3448090B2 (en) | 1994-02-16 | 1994-02-16 | Energy transfer detection method and apparatus |
| JP1950094 | 1994-02-16 | ||
| JP19500/94 | 1994-02-16 |
Publications (3)
| Publication Number | Publication Date |
|---|---|
| EP0668498A2 true EP0668498A2 (en) | 1995-08-23 |
| EP0668498A3 EP0668498A3 (en) | 1995-10-25 |
| EP0668498B1 EP0668498B1 (en) | 2003-08-20 |
Family
ID=12001101
Family Applications (1)
| Application Number | Title | Priority Date | Filing Date |
|---|---|---|---|
| EP95300981A Expired - Lifetime EP0668498B1 (en) | 1994-02-16 | 1995-02-16 | Method and instrument for measuring fluorescence resonance energy transfer |
Country Status (4)
| Country | Link |
|---|---|
| US (2) | US5776782A (en) |
| EP (1) | EP0668498B1 (en) |
| JP (1) | JP3448090B2 (en) |
| DE (1) | DE69531515T2 (en) |
Cited By (13)
| Publication number | Priority date | Publication date | Assignee | Title |
|---|---|---|---|---|
| DE19722630A1 (en) * | 1997-05-30 | 1998-12-03 | Stiftung Fuer Lasertechnologie | In situ measurement of mitochondria |
| EP0903411A2 (en) * | 1997-09-18 | 1999-03-24 | Hitachi Software Engineering Co., Ltd. | Fluorescent material labeled-probe and method for detecting hybridization |
| DE19737562A1 (en) * | 1997-08-28 | 1999-05-06 | Otogene Biotechnologische Fors | Method for the identification of interactions between proteins or peptides |
| WO1999047702A2 (en) * | 1998-03-18 | 1999-09-23 | november Aktiengesellschaft Gesellschaft für Molekulare Medizin | Method and device for identifying a tag |
| DE19829495A1 (en) * | 1998-07-02 | 2000-01-05 | Jacques Paysan | Reagents and their application for the investigation of interactions between cellular molecules and their localization in cells |
| EP0971038A1 (en) * | 1996-09-27 | 2000-01-12 | Laboratory of Molecular Biophotonics | Probes for detecting polynucleotides and detection method |
| DE10144435A1 (en) * | 2001-09-06 | 2003-04-10 | Europhoton Gmbh Ges Fuer Optis | Method and arrangement for generating time and location-resolved as well as time and wavelength-resolved fluorescence images |
| WO2005017527A1 (en) * | 2003-08-11 | 2005-02-24 | MAX-PLANCK-Gesellschaft zur Förderung der Wissenschaften e.V. | Photochromic relaxation kinetic method |
| EP2315002A3 (en) * | 1998-05-16 | 2012-12-05 | Life Technologies Corporation | Filter module for an optical instrument used in particular for monitoring DNA polymerase chain reactions |
| US8557566B2 (en) | 1998-05-16 | 2013-10-15 | Applied Biosystems, Llc | Instrument for monitoring polymerase chain reaction of DNA |
| US9823195B2 (en) | 1998-05-16 | 2017-11-21 | Life Technologies Corporation | Optical instrument comprising multi-notch beam splitter |
| US10564088B2 (en) | 2014-10-09 | 2020-02-18 | Kinetic River Corp. | Particle analysis and sorting apparatus and methods |
| US11740174B2 (en) | 2014-10-09 | 2023-08-29 | Kinetic River Corp. | Apparatus and methods for particle analysis and autofluorescence discrimination |
Families Citing this family (64)
| Publication number | Priority date | Publication date | Assignee | Title |
|---|---|---|---|---|
| US6766183B2 (en) | 1995-11-22 | 2004-07-20 | Medtronic Minimed, Inc. | Long wave fluorophore sensor compounds and other fluorescent sensor compounds in polymers |
| AT405103B (en) * | 1996-10-16 | 1999-05-25 | Avl Verbrennungskraft Messtech | SENSOR LAYER FOR QUANTITATIVE DETERMINATION OF AT LEAST ONE CHEMICAL COMPONENT OF A GASEOUS OR LIQUID SAMPLE |
| US7875440B2 (en) | 1998-05-01 | 2011-01-25 | Arizona Board Of Regents | Method of determining the nucleotide sequence of oligonucleotides and DNA molecules |
| US6780591B2 (en) | 1998-05-01 | 2004-08-24 | Arizona Board Of Regents | Method of determining the nucleotide sequence of oligonucleotides and DNA molecules |
| GB9811483D0 (en) * | 1998-05-29 | 1998-07-29 | Photonic Research Systems Limi | Luminescence assay using cyclical excitation wavelength sequence |
| US6558945B1 (en) | 1999-03-08 | 2003-05-06 | Aclara Biosciences, Inc. | Method and device for rapid color detection |
| US6818395B1 (en) * | 1999-06-28 | 2004-11-16 | California Institute Of Technology | Methods and apparatus for analyzing polynucleotide sequences |
| AU7105300A (en) | 1999-09-03 | 2001-04-10 | Lifebeam Technologies, Inc. | Optical system for rapid polymer analysis |
| EP1089068A1 (en) * | 1999-09-28 | 2001-04-04 | Norbert Graf | Method and device for the determinination of contaminations |
| EP1305412A2 (en) | 1999-10-14 | 2003-05-02 | Clontech Laboratories Inc. | Anthozoa derived chromo/fluoroproteins and methods for using the same |
| US6426505B1 (en) | 2000-01-19 | 2002-07-30 | University Of Maryland Biotechnology Institute | Phase-modulation fluorometer and method for measuring nanosecond lifetimes using a lock-in amplifier |
| JP3460673B2 (en) * | 2000-02-04 | 2003-10-27 | 浜松ホトニクス株式会社 | Method for selective isolation of living cells expressing a specific gene |
| US6844154B2 (en) | 2000-04-04 | 2005-01-18 | Polygenyx, Inc. | High throughput methods for haplotyping |
| FR2809817B1 (en) * | 2000-06-02 | 2003-08-15 | Cis Bio Int | METHOD FOR DETECTING THE PRESENCE OF A LIQUID IN A MIXTURE |
| JP4593739B2 (en) * | 2000-07-27 | 2010-12-08 | 独立行政法人科学技術振興機構 | Multiphoton excited fluorescence lifetime imaging system |
| US7125660B2 (en) * | 2000-09-13 | 2006-10-24 | Archemix Corp. | Nucleic acid sensor molecules and methods of using same |
| AU2002251944A1 (en) | 2001-02-15 | 2002-09-04 | Medtronic Minimed, Inc. | Polymers functionalized with fluorescent boronate motifs |
| CA2440754A1 (en) * | 2001-03-12 | 2002-09-19 | Stephen Quake | Methods and apparatus for analyzing polynucleotide sequences by asynchronous base extension |
| US20030010931A1 (en) * | 2001-07-16 | 2003-01-16 | Pittaro Richard J. | Methods for analyzing arrays |
| US7045361B2 (en) | 2001-09-12 | 2006-05-16 | Medtronic Minimed, Inc. | Analyte sensing via acridine-based boronate biosensors |
| US6867005B2 (en) | 2001-10-24 | 2005-03-15 | Beckman Coulter, Inc. | Method and apparatus for increasing the dynamic range and accuracy of binding assays |
| US6696690B2 (en) * | 2001-12-17 | 2004-02-24 | The Boeing Company | Method and apparatus to correct for the temperature sensitivity of pressure sensitive paint |
| ATE439368T1 (en) * | 2001-12-19 | 2009-08-15 | Univ Chicago | RAPID-RIPE FLUORESCENT PROTEINS AND METHOD FOR USE THEREOF |
| AU2003285844A1 (en) | 2002-11-12 | 2004-06-03 | Zakrytoe Aktsionernoe Obschestvo "Evrogen" | Fluorescent proteins and chromoproteins from non-aequorea hydrozoa species and methods for using same |
| RU2345137C2 (en) | 2002-12-26 | 2009-01-27 | Закрытое акционерное общество "ЕВРОГЕН" | Fluorescing proteins from copepodas crustaceas and their application |
| US20050084867A1 (en) * | 2003-10-15 | 2005-04-21 | Caren Michael P. | Hybridization and scanning apparatus |
| US7169560B2 (en) * | 2003-11-12 | 2007-01-30 | Helicos Biosciences Corporation | Short cycle methods for sequencing polynucleotides |
| US7981604B2 (en) | 2004-02-19 | 2011-07-19 | California Institute Of Technology | Methods and kits for analyzing polynucleotide sequences |
| WO2005100387A1 (en) * | 2004-04-07 | 2005-10-27 | The University Of Chicago | Monomeric red fluorescent proteins |
| WO2006014494A2 (en) * | 2004-07-07 | 2006-02-09 | Corcoran Timothy C | Multiple-label fluorescence imaging using excitation-emission matrices |
| GB2416945A (en) * | 2004-08-04 | 2006-02-08 | Imp College Innovations Ltd | Imaging system for generating output images from a sequence of component images |
| JP4704052B2 (en) * | 2005-01-24 | 2011-06-15 | オリンパス株式会社 | Fluorescence lifetime measuring device |
| US7666593B2 (en) | 2005-08-26 | 2010-02-23 | Helicos Biosciences Corporation | Single molecule sequencing of captured nucleic acids |
| JP5512125B2 (en) | 2005-09-12 | 2014-06-04 | ザ リージェンツ オブ ザ ユニバーシティ オブ ミシガン | Recurrent gene fusion in prostate cancer |
| US9957569B2 (en) * | 2005-09-12 | 2018-05-01 | The Regents Of The University Of Michigan | Recurrent gene fusions in prostate cancer |
| RU2412250C2 (en) * | 2005-11-04 | 2011-02-20 | Закрытое акционерное общество "ЕВРОГЕН" | Modified green fluorescent proteins and methods of their application |
| WO2007070642A2 (en) * | 2005-12-15 | 2007-06-21 | Helicos Biosciences Corporation | Methods for increasing accuracy of nucleic acid sequencing |
| EP1994149B1 (en) | 2006-01-25 | 2010-09-29 | Evrogen IP | Novel fluorescent proteins and methods for using same |
| US8563703B2 (en) | 2006-01-25 | 2013-10-22 | Evrogen IP Joint Stock Company | Fluorescent proteins and methods for using same |
| US7397546B2 (en) | 2006-03-08 | 2008-07-08 | Helicos Biosciences Corporation | Systems and methods for reducing detected intensity non-uniformity in a laser beam |
| US8680235B2 (en) * | 2006-09-22 | 2014-03-25 | Stowers Institute For Medical Research | Branchiostoma derived fluorescent proteins |
| US20100129804A1 (en) * | 2006-11-08 | 2010-05-27 | Chinnaiyan Arul M | Spink1 as a prostate cancer marker and uses thereof |
| US9303291B2 (en) * | 2007-07-06 | 2016-04-05 | The Regents Of The University Of Michigan | MIPOL1-ETV1 gene rearrangements |
| EP2196795A4 (en) * | 2007-08-30 | 2014-04-02 | Mitsui Shipbuilding Eng | Fret detection method and device |
| WO2009028062A1 (en) * | 2007-08-30 | 2009-03-05 | Mitsui Engineering & Shipbuilding Co., Ltd. | Fret detection method and device |
| JP5124216B2 (en) * | 2007-09-14 | 2013-01-23 | オリンパス株式会社 | Optical signal observation method and optical signal observation system |
| WO2009059305A2 (en) * | 2007-11-01 | 2009-05-07 | The University Of Chicago | Red fluorescent proteins with enhanced bacterial expression, increased brightness and reduced aggregation |
| JP2009229387A (en) * | 2008-03-25 | 2009-10-08 | Kobelco Kaken:Kk | Spectroscopic analysis method and it device for unsteady luminescent |
| US9938582B2 (en) * | 2009-09-17 | 2018-04-10 | The Regents Of The University Of Michigan | Recurrent gene fusions in prostate cancer |
| US8945556B2 (en) | 2010-11-19 | 2015-02-03 | The Regents Of The University Of Michigan | RAF gene fusions |
| CN102175657A (en) * | 2011-01-04 | 2011-09-07 | 西南科技大学 | Online detector for key course products of waste water recycling |
| SE535980C2 (en) * | 2011-05-16 | 2013-03-12 | Andreas Ehn | Method and apparatus for determining decay times for pulse-stimulating signals. |
| US9863004B2 (en) | 2011-11-04 | 2018-01-09 | Gen-Probe Incorporated | Molecular assay reagents and methods |
| US9897543B2 (en) * | 2012-03-29 | 2018-02-20 | University Of Calcutta | Half-frequency spectral signatures |
| DE102012219136A1 (en) * | 2012-10-19 | 2014-05-28 | Leica Microsystems Cms Gmbh | Microscope and a method for examining a sample with a microscope |
| WO2014168734A1 (en) * | 2013-03-15 | 2014-10-16 | Cedars-Sinai Medical Center | Time-resolved laser-induced fluorescence spectroscopy systems and uses thereof |
| JP6247530B2 (en) * | 2013-12-27 | 2017-12-13 | キヤノン株式会社 | Imaging device |
| US9658148B2 (en) * | 2014-10-09 | 2017-05-23 | Kinetic River Corp. | Particle analysis and sorting apparatus and methods |
| US11965812B2 (en) | 2014-10-09 | 2024-04-23 | Kinetic River Corp. | Apparatus and methods for particle analysis and autofluorescence discrimination |
| JP6425242B2 (en) * | 2014-12-16 | 2018-11-21 | 国立大学法人静岡大学 | Method of improving SN ratio of modulated light detection |
| EP3159676B1 (en) * | 2015-10-23 | 2018-04-04 | Abberior Instruments GmbH | Method and device for high precision imaging of a structure of a sample marked with fluorescence markers |
| US10656089B2 (en) | 2016-04-01 | 2020-05-19 | Black Light Surgical, Inc. | Systems, devices, and methods for time-resolved fluorescent spectroscopy |
| JP7064315B2 (en) * | 2017-11-07 | 2022-05-10 | オリンパス株式会社 | Photodetector and laser scanning microscope |
| WO2023135485A1 (en) | 2022-01-13 | 2023-07-20 | Oslo Universitetssykehus Hf | Prostate cancer markers and uses thereof |
Citations (3)
| Publication number | Priority date | Publication date | Assignee | Title |
|---|---|---|---|---|
| GB2095822A (en) * | 1981-03-30 | 1982-10-06 | Ramley Engineering Co Ltd | Identifying objects by detecting decaying phosphorescence from phosphor coating thereon |
| EP0259951A2 (en) * | 1986-09-08 | 1988-03-16 | C.R. Bard, Inc. | Luminescent oxygen sensor based on a lanthanide complex |
| EP0263037A2 (en) * | 1986-10-02 | 1988-04-06 | Syracuse University | Multi-decay-time fluorescence imaging apparatus and method of resolving spatial relation with same |
Family Cites Families (5)
| Publication number | Priority date | Publication date | Assignee | Title |
|---|---|---|---|---|
| CA1190838A (en) * | 1981-07-17 | 1985-07-23 | Cavit Akin | Homogeneous nucleic acid hybridization diagnostics by non-radiative energy transfer |
| CA1273552A (en) * | 1985-12-23 | 1990-09-04 | Michael J. Heller | Fluorescent stokes shift probes for polynucleotide hybridization assays |
| US4868103A (en) * | 1986-02-19 | 1989-09-19 | Enzo Biochem, Inc. | Analyte detection by means of energy transfer |
| US5254477A (en) * | 1986-06-25 | 1993-10-19 | Trustees Of Tufts College | Flourescence intramolecular energy transfer conjugate compositions and detection methods |
| US4822746A (en) * | 1986-06-25 | 1989-04-18 | Trustees Of Tufts College | Radiative and non-radiative energy transfer and absorbance modulated fluorescence detection methods and sensors |
-
1994
- 1994-02-16 JP JP01950094A patent/JP3448090B2/en not_active Expired - Fee Related
-
1995
- 1995-02-16 DE DE69531515T patent/DE69531515T2/en not_active Expired - Fee Related
- 1995-02-16 EP EP95300981A patent/EP0668498B1/en not_active Expired - Lifetime
-
1996
- 1996-07-17 US US08/684,268 patent/US5776782A/en not_active Expired - Fee Related
-
1998
- 1998-04-24 US US09/065,585 patent/US5911952A/en not_active Expired - Fee Related
Patent Citations (3)
| Publication number | Priority date | Publication date | Assignee | Title |
|---|---|---|---|---|
| GB2095822A (en) * | 1981-03-30 | 1982-10-06 | Ramley Engineering Co Ltd | Identifying objects by detecting decaying phosphorescence from phosphor coating thereon |
| EP0259951A2 (en) * | 1986-09-08 | 1988-03-16 | C.R. Bard, Inc. | Luminescent oxygen sensor based on a lanthanide complex |
| EP0263037A2 (en) * | 1986-10-02 | 1988-04-06 | Syracuse University | Multi-decay-time fluorescence imaging apparatus and method of resolving spatial relation with same |
Non-Patent Citations (2)
| Title |
|---|
| BIOPHYSICAL JOURNAL, vol. 64, no. 3, March 1993 pages 676-685, TAKATOKU OIDA ET AL 'Fluorescence lifetime imaging microscopy (flimscopy)' * |
| MORRISON: 'Time-resolved detection of energy transfer: theory and application to immunoassays' ANALYTICAL BIOCHEMISTRY vol. 174, 1988, pages 101 - 120 * |
Cited By (27)
| Publication number | Priority date | Publication date | Assignee | Title |
|---|---|---|---|---|
| EP0971038A1 (en) * | 1996-09-27 | 2000-01-12 | Laboratory of Molecular Biophotonics | Probes for detecting polynucleotides and detection method |
| US6284462B1 (en) | 1996-09-27 | 2001-09-04 | Laboratory Of Molecular Biophotonics | Probes and methods for polynucleotide detection |
| EP0971038A4 (en) * | 1996-09-27 | 2000-03-29 | Lab Molecular Biophotonics | Probes for detecting polynucleotides and detection method |
| DE19722630C2 (en) * | 1997-05-30 | 1999-09-16 | Stiftung Fuer Lasertechnologie | Method for in situ measurement of mitochondrial metabolites |
| DE19722630A1 (en) * | 1997-05-30 | 1998-12-03 | Stiftung Fuer Lasertechnologie | In situ measurement of mitochondria |
| DE19737562A1 (en) * | 1997-08-28 | 1999-05-06 | Otogene Biotechnologische Fors | Method for the identification of interactions between proteins or peptides |
| EP0903411A2 (en) * | 1997-09-18 | 1999-03-24 | Hitachi Software Engineering Co., Ltd. | Fluorescent material labeled-probe and method for detecting hybridization |
| EP0903411A3 (en) * | 1997-09-18 | 2002-08-07 | Hitachi Software Engineering Co., Ltd. | Fluorescent material labeled-probe and method for detecting hybridization |
| WO1999047702A2 (en) * | 1998-03-18 | 1999-09-23 | november Aktiengesellschaft Gesellschaft für Molekulare Medizin | Method and device for identifying a tag |
| WO1999047702A3 (en) * | 1998-03-18 | 1999-11-04 | November Ag Molekulare Medizin | Method and device for identifying a tag |
| EP2315002A3 (en) * | 1998-05-16 | 2012-12-05 | Life Technologies Corporation | Filter module for an optical instrument used in particular for monitoring DNA polymerase chain reactions |
| US9823195B2 (en) | 1998-05-16 | 2017-11-21 | Life Technologies Corporation | Optical instrument comprising multi-notch beam splitter |
| US9671342B2 (en) | 1998-05-16 | 2017-06-06 | Life Technologies Corporation | Instrument for monitoring polymerase chain reaction of DNA |
| US8921098B2 (en) | 1998-05-16 | 2014-12-30 | Applied Biosystems, Llc | Instrument for monitoring DNA replication |
| US8557566B2 (en) | 1998-05-16 | 2013-10-15 | Applied Biosystems, Llc | Instrument for monitoring polymerase chain reaction of DNA |
| DE19829495A1 (en) * | 1998-07-02 | 2000-01-05 | Jacques Paysan | Reagents and their application for the investigation of interactions between cellular molecules and their localization in cells |
| DE10144435B4 (en) * | 2001-09-06 | 2005-03-24 | EuroPhoton GmbH Gesellschaft für optische Sensorik | Method for characterizing the properties of fluorescent samples, in particular living cells and tissues, in multi-well, in-vitro fluorescence assays, in DNA chips, devices for carrying out the method and their use |
| DE10144435A1 (en) * | 2001-09-06 | 2003-04-10 | Europhoton Gmbh Ges Fuer Optis | Method and arrangement for generating time and location-resolved as well as time and wavelength-resolved fluorescence images |
| DE10337108B3 (en) * | 2003-08-11 | 2005-05-04 | MAX-PLANCK-Gesellschaft zur Förderung der Wissenschaften e.V. | Photochromic relaxation kinetic method |
| WO2005017527A1 (en) * | 2003-08-11 | 2005-02-24 | MAX-PLANCK-Gesellschaft zur Förderung der Wissenschaften e.V. | Photochromic relaxation kinetic method |
| US10564088B2 (en) | 2014-10-09 | 2020-02-18 | Kinetic River Corp. | Particle analysis and sorting apparatus and methods |
| US10955330B2 (en) | 2014-10-09 | 2021-03-23 | Kinetic River Corp. | Particle analysis and sorting apparatus and methods |
| US11536642B2 (en) | 2014-10-09 | 2022-12-27 | Kinetic River Corp. | Particle analysis and imaging apparatus and methods |
| US11536641B2 (en) | 2014-10-09 | 2022-12-27 | Kinetic River Corp. | Particle analysis and imaging apparatus and methods |
| US11543339B2 (en) | 2014-10-09 | 2023-01-03 | Kinetic River Corp. | Particle analysis and imaging apparatus and methods |
| US11573165B2 (en) | 2014-10-09 | 2023-02-07 | Kinetic River Corp. | Particle analysis and imaging apparatus and methods |
| US11740174B2 (en) | 2014-10-09 | 2023-08-29 | Kinetic River Corp. | Apparatus and methods for particle analysis and autofluorescence discrimination |
Also Published As
| Publication number | Publication date |
|---|---|
| US5776782A (en) | 1998-07-07 |
| JPH07229835A (en) | 1995-08-29 |
| DE69531515D1 (en) | 2003-09-25 |
| JP3448090B2 (en) | 2003-09-16 |
| DE69531515T2 (en) | 2004-06-17 |
| EP0668498B1 (en) | 2003-08-20 |
| US5911952A (en) | 1999-06-15 |
| EP0668498A3 (en) | 1995-10-25 |
Similar Documents
| Publication | Publication Date | Title |
|---|---|---|
| EP0668498B1 (en) | Method and instrument for measuring fluorescence resonance energy transfer | |
| US20220154274A1 (en) | Method and System for Multiplex Genetic Analysis | |
| US4786170A (en) | Apparatus for the graphic representation and analysis of fluorescence signals | |
| US6140048A (en) | System for distinguishing fluorescent molecule groups by time resolved fluorescence measurement | |
| EP1746410B1 (en) | Apparatus and method for fluorescence lifetime imaging | |
| EP0823052B1 (en) | A multicapillary fluorescent detection system | |
| US5274240A (en) | Capillary array confocal fluorescence scanner and method | |
| DE69333502T2 (en) | Up-converting reporter molecule for biological and other testing using laser excitation techniques | |
| US6687000B1 (en) | Photon-sorting spectroscopic microscope system | |
| US8150636B2 (en) | System and method for time correlated multi-photon counting measurements | |
| EP0836090A1 (en) | Method of analysis of samples by determination of the distribution of specific brightnesses of particles | |
| EP0666473A1 (en) | Method for the excitation of dyes | |
| EP0294996A2 (en) | Scanning fluorescent detection system | |
| US20050164160A1 (en) | Method and device for the measurement of chemical and/or biological samples | |
| JPH09113448A (en) | Device for performing laser-induced two-photon flurescence-correlation spectrochemical analysis | |
| EP1974203A1 (en) | Improvements in and relating to imaging of biological samples | |
| US6384914B1 (en) | Method for optical detection of analyte molecules in a natural biological medium | |
| CN108463714A (en) | The emission lifetime measurement method and equipment of average life span for measuring excited electronic state | |
| US20050064427A1 (en) | Method and/or system for identifying fluorescent, luminescent and/or absorbing substances on and/or in sample carriers | |
| JP3692983B2 (en) | Fluorescence measurement method and fluorescence measurement apparatus | |
| JPH05118991A (en) | Method and device for determining on base arrangement | |
| DE19822452C2 (en) | Method for determining the density of luminescent molecules on a surface, use of the method for determining adsorption and binding kinetics and equilibrium and binding constants of molecules on a surface by luminescence measurements and device for carrying out the method | |
| DE19735144C2 (en) | Reflective fluorimeter | |
| EP0275440A2 (en) | Photo detection system for DNA base analysis | |
| Fultz et al. | Time-and wavelength-resolved fluorescence detection for capillary zone electrophoresis with axial excitation |
Legal Events
| Date | Code | Title | Description |
|---|---|---|---|
| PUAI | Public reference made under article 153(3) epc to a published international application that has entered the european phase |
Free format text: ORIGINAL CODE: 0009012 |
|
| AK | Designated contracting states |
Kind code of ref document: A2 Designated state(s): DE FR GB |
|
| PUAL | Search report despatched |
Free format text: ORIGINAL CODE: 0009013 |
|
| AK | Designated contracting states |
Kind code of ref document: A3 Designated state(s): DE FR GB |
|
| 17P | Request for examination filed |
Effective date: 19960412 |
|
| 17Q | First examination report despatched |
Effective date: 20011030 |
|
| GRAH | Despatch of communication of intention to grant a patent |
Free format text: ORIGINAL CODE: EPIDOS IGRA |
|
| GRAH | Despatch of communication of intention to grant a patent |
Free format text: ORIGINAL CODE: EPIDOS IGRA |
|
| GRAA | (expected) grant |
Free format text: ORIGINAL CODE: 0009210 |
|
| AK | Designated contracting states |
Designated state(s): DE FR GB |
|
| REG | Reference to a national code |
Ref country code: GB Ref legal event code: FG4D |
|
| REF | Corresponds to: |
Ref document number: 69531515 Country of ref document: DE Date of ref document: 20030925 Kind code of ref document: P |
|
| PGFP | Annual fee paid to national office [announced via postgrant information from national office to epo] |
Ref country code: DE Payment date: 20040226 Year of fee payment: 10 |
|
| ET | Fr: translation filed | ||
| PLBE | No opposition filed within time limit |
Free format text: ORIGINAL CODE: 0009261 |
|
| STAA | Information on the status of an ep patent application or granted ep patent |
Free format text: STATUS: NO OPPOSITION FILED WITHIN TIME LIMIT |
|
| 26N | No opposition filed |
Effective date: 20040524 |
|
| PG25 | Lapsed in a contracting state [announced via postgrant information from national office to epo] |
Ref country code: DE Free format text: LAPSE BECAUSE OF NON-PAYMENT OF DUE FEES Effective date: 20050901 |
|
| PGFP | Annual fee paid to national office [announced via postgrant information from national office to epo] |
Ref country code: GB Payment date: 20060215 Year of fee payment: 12 |
|
| PGFP | Annual fee paid to national office [announced via postgrant information from national office to epo] |
Ref country code: FR Payment date: 20060220 Year of fee payment: 12 |
|
| GBPC | Gb: european patent ceased through non-payment of renewal fee |
Effective date: 20070216 |
|
| REG | Reference to a national code |
Ref country code: FR Ref legal event code: ST Effective date: 20071030 |
|
| PG25 | Lapsed in a contracting state [announced via postgrant information from national office to epo] |
Ref country code: GB Free format text: LAPSE BECAUSE OF NON-PAYMENT OF DUE FEES Effective date: 20070216 Ref country code: FR Free format text: LAPSE BECAUSE OF NON-PAYMENT OF DUE FEES Effective date: 20070228 |