EP0845720B1 - Méthode d'analyse et de visualisation d'états transitoires d'un processus - Google Patents
Méthode d'analyse et de visualisation d'états transitoires d'un processus Download PDFInfo
- Publication number
- EP0845720B1 EP0845720B1 EP97120787A EP97120787A EP0845720B1 EP 0845720 B1 EP0845720 B1 EP 0845720B1 EP 97120787 A EP97120787 A EP 97120787A EP 97120787 A EP97120787 A EP 97120787A EP 0845720 B1 EP0845720 B1 EP 0845720B1
- Authority
- EP
- European Patent Office
- Prior art keywords
- map
- trajectory
- states
- neurons
- variables
- Prior art date
- Legal status (The legal status is an assumption and is not a legal conclusion. Google has not performed a legal analysis and makes no representation as to the accuracy of the status listed.)
- Expired - Lifetime
Links
Images



Classifications
-
- G—PHYSICS
- G06—COMPUTING OR CALCULATING; COUNTING
- G06N—COMPUTING ARRANGEMENTS BASED ON SPECIFIC COMPUTATIONAL MODELS
- G06N3/00—Computing arrangements based on biological models
- G06N3/02—Neural networks
- G06N3/04—Architecture, e.g. interconnection topology
-
- G—PHYSICS
- G05—CONTROLLING; REGULATING
- G05B—CONTROL OR REGULATING SYSTEMS IN GENERAL; FUNCTIONAL ELEMENTS OF SUCH SYSTEMS; MONITORING OR TESTING ARRANGEMENTS FOR SUCH SYSTEMS OR ELEMENTS
- G05B19/00—Program-control systems
- G05B19/02—Program-control systems electric
- G05B19/04—Program control other than numerical control, i.e. in sequence controllers or logic controllers
- G05B19/042—Program control other than numerical control, i.e. in sequence controllers or logic controllers using digital processors
- G05B19/0423—Input/output
- G05B19/0425—Safety, monitoring
-
- G—PHYSICS
- G06—COMPUTING OR CALCULATING; COUNTING
- G06N—COMPUTING ARRANGEMENTS BASED ON SPECIFIC COMPUTATIONAL MODELS
- G06N3/00—Computing arrangements based on biological models
- G06N3/02—Neural networks
- G06N3/04—Architecture, e.g. interconnection topology
- G06N3/0499—Feedforward networks
-
- Y—GENERAL TAGGING OF NEW TECHNOLOGICAL DEVELOPMENTS; GENERAL TAGGING OF CROSS-SECTIONAL TECHNOLOGIES SPANNING OVER SEVERAL SECTIONS OF THE IPC; TECHNICAL SUBJECTS COVERED BY FORMER USPC CROSS-REFERENCE ART COLLECTIONS [XRACs] AND DIGESTS
- Y10—TECHNICAL SUBJECTS COVERED BY FORMER USPC
- Y10S—TECHNICAL SUBJECTS COVERED BY FORMER USPC CROSS-REFERENCE ART COLLECTIONS [XRACs] AND DIGESTS
- Y10S706/00—Data processing: artificial intelligence
- Y10S706/902—Application using ai with detail of the ai system
- Y10S706/903—Control
- Y10S706/906—Process plant
-
- Y—GENERAL TAGGING OF NEW TECHNOLOGICAL DEVELOPMENTS; GENERAL TAGGING OF CROSS-SECTIONAL TECHNOLOGIES SPANNING OVER SEVERAL SECTIONS OF THE IPC; TECHNICAL SUBJECTS COVERED BY FORMER USPC CROSS-REFERENCE ART COLLECTIONS [XRACs] AND DIGESTS
- Y10—TECHNICAL SUBJECTS COVERED BY FORMER USPC
- Y10S—TECHNICAL SUBJECTS COVERED BY FORMER USPC CROSS-REFERENCE ART COLLECTIONS [XRACs] AND DIGESTS
- Y10S706/00—Data processing: artificial intelligence
- Y10S706/902—Application using ai with detail of the ai system
- Y10S706/903—Control
- Y10S706/906—Process plant
- Y10S706/907—Power plant
Definitions
- the invention relates to a method for analyzing and displaying process states and process operations of a technical system.
- the method is suitable for the analysis and display of process states and Operations of a power plant.
- the invention has for its object to provide a method that a simultaneous and coherent evaluation and display of relevant process states and Sequences of process states of a technical system enables.
- the analysis and display of transient process processes are made possible.
- an extension of the procedure for a diagnosis of transient processes can be specified.
- This task is accomplished through a process for analyzing and representing process states and process flows with those specified in claim 1 and claim 2, respectively Features resolved.
- Another possible solution would be a method based on the main component analysis, a mathematical process for reducing dimensions, with which the aim is to distribute data from a high-dimensional space to describe as well as possible in a low-dimensional space.
- the main component analysis analysis of variance is achieved by a linear projection in a space - which is spanned by the eigenvectors of the data distribution - realized.
- this linear approach means restrictions, which is why the main component analysis not seen as a satisfactory solution to the task at hand becomes.
- a projection onto nonlinear surfaces so-called main manifolds, carried out.
- These non-linear areas are represented by so-called topology-preserving Kohonen maps spanned in the state space of the plant.
- such a card is a "self-organizing one neural network ", in which all neurons are arranged side by side Self-organizing neural network is an established term for a special class of neural networks that structure themselves based on input signals, see. A. Zell "Simulation of Neural Networks", Addison-Wesley Verlag, 1994, pages 179 to 187.
- In contrast to conventional neural networks plays the spatial position of the individual neurons on the Kohonen cards important role.
- the process state calculated by the method is preserved on this topology Map of potential process states plotted and visualized and is continue directly with others, e.g. previous process states, comparable.
- the map thus provides a topology-preserving, two-dimensional window in the n-dimensional state space of the system Associated with this description that the points in the entrance space are close lie close together, also in the exit room, i.e. on the map will lie.
- the relevant n Process sizes offered In the method according to the invention, after appropriate data preprocessing a self-organizing network in a learning phase the relevant n Process sizes offered.
- the learning phase takes place in two steps: First unfolded the map in the status area of the system, then the system states visualized using a mathematical method.
- the unfolding of the self-organizing card in the state space of the plant will realized by the "neural algorithm according to T. Kohonen".
- the self-organizing neural algorithm was introduced by Kohonen in 1982; see. T. Kohonen, "Self-organized formation of topologically correct feature maps” in Biological Cybernetics, 43, 59-69, 1982, which is why these cards are also called Kohonen cards be designated.
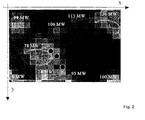
- the visualization of the physical system status is based on a static one Visualization process in which the differences in the weight vectors of a calculated each neuron to its neighbors and prepared it accordingly, e.g. color-coded. Contiguous areas (e.g. bright areas in Fig. 2) have a small difference because their neurons are in the state space were placed close to each other. There is between these individual clusters Limits characterized by a large difference in the respective weight vectors are, e.g. visualized as dark areas (see FIG. 2). In order to can be a good visualization of the cluster boundaries and thus the real plant conditions see also G. Whittington, C. Spracklen: The Application of Neural Network Model to Sensor Data Fusion in Proc. of Applications of ANN Conference, Orlando, USA, 1990.
- the winner-takes-all algorithm is a procedure in which always only the neuron is active that best fulfills a certain condition, everyone else Network or card neurons are inactive (1-out-of-m selection). This particular one The condition is e.g. minimum distance between the current input vector and the weight vector of the individual neurons, see S. Hafner, "Neural Networks in Automation Technology", Oldenbourg Verlag, 1994, in particular Pages 17 to 25.
- the process is automated by constructing and developing a hierarchical Kohonen map, in the sense that the procedure can automatically recognize deviations from process processes - represented as trajectories on a map - from a reference process and determine the underlying causes.
- Fig. 1 shows the structure of a system for performing the method for process analysis and diagnosis with a neural card. A description of the structure results from the description of the process steps.
- Process step 1 Recording and selection of the process variables
- a data acquisition and processing system for example a data server based on a computer in a control system, Cyclically records process values from a technical system, for example from a boiler of a power plant.
- a subsequent data analysis system subjects the selected and relevant data to a correlation analysis to determine the to determine independent, process-describing measurands.
- Process step 2 learning phase of the card (off-line)
- Step 2.1 Development of the self-organizing, neural network in the state space of the system, based on the algorithm by T. Kohonen.
- the weight vectors of the neurons on the map are adapted by the Kohonen algorithm, taking into account their neighborhood relationships and the input vector.
- Step 2.2 Representation of the unfolded network as a map - as a so-called map
- Application of a static visualization method by the differences of the Weight vectors of the neurons can be visualized.
- Fig. 2 shows an example - here in a black and white representation - the structured and color-coded, neural map for different system states of a boiler (bright contiguous areas). It shows the projection and visualization of several load states of the boiler on a neural map with 15 * 20 neurons. The current load of the power plant in megawatts is entered by hand for the respective clusters in the picture.
- the x axis indicates the number of neurons in the x direction
- the y axis the number of neurons in the y direction.
- the system states z and z + 1 represent two different load states of the system.
- the dark areas on the map form the boundaries between the different ones Plant states, since they represent neurons that are very far apart in the plant room are removed.
- the bright clusters of the map form neurons in the plant room are very close to each other, they correspond to the real load conditions the plant.
- each system state is based on 11 independent process variables is determined and thus 11-dimensional, can be a by the method Projection can be done on only two dimensions; this makes one significant better overview of the actual process states achieved than with the individual consideration of all 11 process variables.
- the number of simultaneously evaluated Process sizes are not limited to 11, they can be much larger.
- Process step 3 application - process analysis with the card (off-line / on-line)
- Step 3.1 Connection of the card to the process and representation of the current process status on the structured map.
- the current process state through a neural "winner-takes-all” algorithm evaluated and applied to the previously structured and color-coded map.
- the three black circles correspond to three plant states at different Times t.
- the current, generally high-dimensional system condition can be visualized in the context of other system states.
- the spatial location the current process status on the structured map provides information about the current status of the system.
- Step 3.2 Graphic connection of winning neurons
- the current winner neuron at time t 0 is marked, for example, by a black circle (cf. FIG. 2). If one connects these winning neurons with one another, a trajectory of the current process states develops on the structured map with the time t, which trajectory either grows continuously or moves on the map with a fixed predetermined length.
- FIG. 3 shows - here in a black and white representation - an example of such a trajectory course on a structured, color-coded, neural map with 15 * 20 neurons when starting up and changing the load of a boiler over a period of 250 minutes.
- the x-axis in FIG. 3 indicates the number of neurons in the x-direction, the y-axis the number of neurons in the y-direction.
- the various load conditions of the system are marked by bright clusters in the picture.
- Step 3.3 Superimposing trajectories of different process operations for visual comparison and analysis of complex dynamic processes
- FIG. 4 shows an example for two different boiler trips, the black trajectory t r corresponds to a 'good' reference approach, the white trajectory t u here represents a load change from 126 MW to 95 MW.
- the x-axis in FIG. 4 shows the number of neurons in the x direction, the y axis the number of neurons in the y direction.
- the potential load conditions of the system are marked by bright clusters in the picture.
- Step 4 Application - Diagnostic phase of the card
- Neuron 'N' is in the plant room placed virtually in the 28 MW state
- neuron 'M' speaks to the 130 MW load state
- their spatial position on the map is marked in Fig. 4 as a white circular area.
- FIG. 5 shows the weight distribution of these two map neurons.
- the x-axis in FIG. 5 corresponds to the weights w 1 , w 2 , .., w 11 of the neurons 'N' and 'M', the y-axis represent the normalized values of the individual weights. It can be seen that the neurons differ primarily in their weights w 10 , w 2 and w 3 . This is confirmed with a standard deviation calculation.
- the process analysis is made possible by calculating the correlation coefficient and the standard deviation of the weight distribution of selected (operator-selected) neurons.
- the operator can thus determine the cause of any two deviations on-line, because he only needs to 'click' on the map on the neurons in which the trajectories (visually) differ particularly, for example by distance a in FIG. 4.
- the cause of the Deviations ie the process variables with the largest standard deviations, are calculated below. This enables simple diagnosis options to be implemented with the card.
- Process step 5 Representation of process relationships with the map
- Step 5.1 Another possible processing step on the map leads to the use of data mining strategies in the power plant area, the weight distributions of individual process variables are shown over the entire map, FIGS. 6 and 7 illustrate this using an example. Since the process distribution in the weights of the neurons is coded on the map and the weight distribution can be shown on the map, this gives a clear statement about the distribution of the real process variables on the map and thus a distribution in the state space of the system.
- Fig. 6 shows the distribution of the feed water temperature (z-axis) over the map (x, y-axis)
- Fig. 7 shows the distribution of the coal feeder speed (z-axis) over the map (x, y-axis) .
- Step 5.2 By using the method for static visualization of weight differences (see previous chapter) for selected process variables there are correlations between these quantities and existing process states visualize that would not be recognizable if the complete weight distributions would be evaluated.
- Step 5.3 Future process values can be estimated by graphically extrapolating the trajectory curve t u at a predeterminable time t o in a predeterminable time segment ⁇ t along the reference curve t r to an expected process state at a second point in time t o + ⁇ t Process values are determined and output.
- Process step 6 automatic detection of process deviations
- the discrete trajectory positions t 1 , t 2 , ... t m to be learned are coded on the process card K1 in data vectors of dimension m and made available to the supervisor card K2 as input data.
- This supervisor card works again according to the Kohonen algorithm, ie the topological relationships of the trajectories on the process card are learned by using this algorithm on the supervisor card. The supervisor card thus learns the trajectory curves on the process card and the following functionalities can be implemented:
- Process map representation of the current and past process as a trajectory
- Supervisor card Coding and representation of the topology and location of relevant trajectory sections from the process card.
- the trajectory courses of the process card are coded on the supervisor card by a 'supervisor' neuron, which is active precisely when the respective trajectory section is displayed on the process card.
- the supervisor card thus realizes a further dimensional reduction is - as described - a sub-process of the process on the process map as a trajectory shown with m discrete trajectory positions on the supervisor card but this trajectory course becomes a single neuron, and thus summarized in a single point.
- the learning process According to Kohonen, neuron clusters are formed on the supervisor card, correspond to the similar trajectory sections on the process map.
- the trajectory section to be examined is on the process map - again from m discrete trajectory positions must exist - analyzed by the supervisor card and for similarity with compared previously learned trajectory sections.
- the similarity is shown in the Distance of the current winner neuron from the 'supervisor' neuron for the respective previously learned trajectory sections. This distance is therefore a measure of the similarity of two trajectory or partial trajectory courses.
- the diagnostic system recognizes automatically that the current trajectory course - e.g. a current one Can represent load changes - deviates from a previously learned reference curve.
- the system will then generate an error message and the cause of the trajectory deviation is automatically determined on the basis of method step 4, by calculating the causes for the respective trajectory deviations, through automatic analysis of the weight distribution of the underlying neurons.
- the advantage of the method described here is because you not only various process states to compare, but to record even complex and transient process operations such as complete on -or runs and automatically face can so that there is a powerful extension of current analysis systems for power plants.
- the process represents an automated diagnostic system for transient power plant processes.
- Another advantage of the process is the low engineering effort. There learning and structuring the maps and also recording the trajectories Automated and completely provided by the process, there is no need for time-consuming work Engineering of reference models. This engineering is more integral Part of the process itself.
Landscapes
- Engineering & Computer Science (AREA)
- Physics & Mathematics (AREA)
- Theoretical Computer Science (AREA)
- General Physics & Mathematics (AREA)
- General Health & Medical Sciences (AREA)
- General Engineering & Computer Science (AREA)
- Biophysics (AREA)
- Computational Linguistics (AREA)
- Data Mining & Analysis (AREA)
- Evolutionary Computation (AREA)
- Artificial Intelligence (AREA)
- Molecular Biology (AREA)
- Computing Systems (AREA)
- Biomedical Technology (AREA)
- Life Sciences & Earth Sciences (AREA)
- Mathematical Physics (AREA)
- Software Systems (AREA)
- Health & Medical Sciences (AREA)
- Automation & Control Theory (AREA)
- Testing And Monitoring For Control Systems (AREA)
- Management, Administration, Business Operations System, And Electronic Commerce (AREA)
Claims (7)
- Procédé d'analyse et de visualisation de grandeurs de processus, d'états de processus ou de suites d'états de processus d'une installation technique, suivant lequel toutes les grandeurs intéressant un processus sont réunies et, par une analyse neuronale sur la base de cartes de Kohonen, exploitées en relation mutuelle par une projection, avec conservation de la topologie, de données des grandeurs intéressantes du processus sur une carte de Kohonen bidimensionnelle, caractérisé par le fait quea) sur la carte de Kohonen est d'abord visualisée une suite d'états de processus (z, z+1), en tant que trajectoire de référence (tr), par mise en liaison graphique des neurones représentant les états de processus respectifs,b) pour l'évaluation du processus, au moins une trajectoire (tu) supplémentaire, formée par liaison graphique d'états de processus visualisés, est également représentée sur la carte, etc) après qu'un utilisateur ait sélectionné les parties de carte, donc les neurones, ayant le plus grand écart (distance a) de deux trajectoires (tr, tu), une analyse manuelle de processus est rendue possible par les dispositions supplémentaires suivantes :
calcul de l'écart standard de la distribution des poids (w1...w11) des neurones sélectionnés et édition des poids (par exemple w10, w3, w2) ayant les plus grands écarts entre eux, et par cela détermination des grandeurs de processus associées aux indices de poids (1...11, par exemple 10, 3, 2) provoquant le plus les écarts de la trajectoire respective (tu) par rapport à la trajectoire de référence (tr. - Procédé d'analyse et de visualisation de grandeurs de processus, d'états de processus ou de suites d'états de processus d'une installation technique, suivant lequel toutes les grandeurs intéressant un processus sont réunies et, par une analyse neuronale, sur la base de cartes de Kohonen, exploitées en relation mutuelle par une projection, avec conservation de la topologie, de données des grandeurs intéressantes du processus sur une carte de Kohonen bidimensionnelle, caractérisé par le fait quea) sur la carte de Kohonen est d'abord visualisée une suite d'états de processus (z, z+1), en tant que trajectoire de référence (tr), par mise en liaison graphique des neurones représentant les états de processus respectifs,b) pour l'évaluation du processus, au moins une trajectoire (tu) supplémentaire, formée par liaison graphique d'états de processus visualisés, est également représentée sur la carte, etc) un diagnostic automatique est effectué par des dispositions supplémentaires suivantes : reconnaissance automatisée des écarts de deux allures de trajectoire (tr, tu) sur une carte de processus (K1) à l'aide d'une carte superviseur (K2) par comparaison on-line des parties de trajectoires à étudier, composées d'un nombre prédéterminable (m) de positions de trajectoires (t1, t2, ...tm), avec des parties de référence, par projection des parties de trajectoires respectives sur la carte superviseur (K2) et comparaison des écarts des neurones gagnants (W) des deux allures de trajectoires (tr, tu) sur la carte superviseur (K2), et en cas d'écarts de valeur prédéterminable, génération d'une signalisation d'erreur et exécution automatique des étapes suivantes, en vue de la détermination de la cause :
calcul de l'écart standard de la distribution de poids des neurones respectifs (N, M, ou neurones à distance a) des deux trajectoires (tr, tu) sur la carte de processus (K1) et définition des poids ayant les plus grands écarts entre eux (w10, w3, w2), donc détermination des grandeurs de processus associées aux indices de poids (10, 3, 2) et, par là, détermination des grandeurs de processus ayant provoqué le plus l'écart de trajectoire sur la carte de Kohonen (K1). - Procédé suivant la revendication 1, caractérisé par le fait qu'une prédiction de grandeurs de processus est effectué par les dispositions supplémentaires suivantes :a) extrapolation graphique de l'allure de trajectoire (tu) à un premier instant (to) dans un intervalle de temps prédéterminable (Δt) pour la définition d'un état de processus à intervenir à un deuxième instant (to+Δt), l'extrapolation ayant lieu sur la base de l'allure ultérieure de la trajectoire de référence (tr),b) définition et édition des grandeurs de processus et valeurs de processus correspondant à l'état de processus respectif ainsi prédit, par retransformation, etc) mise à disposition des valeurs de processus prédites pour des grandeurs de processus sélectionnées, pour des systèmes de régulation et de commande montés à la suite.
- Procédé suivant l'une des revendications précédentes, caractérisé par le fait que l'installation technique est une centrale ou une partie d'une telle installation.
- Procédé suivant la revendication 4, caractérisé par le fait que les états de processus (z, z+1) déterminés sont des états de charge différents.
- Procédé suivant l'une des revendications précédentes 1 à 5, caractérisé par le fait que la distribution d'une grandeur de processus sélectionnée est représentée en codage de hauteur ou en codage de couleur dans la carte de Kohonen, la distribution de poids correspondant à la grandeur de processus étant portée en hauteur ou en couleur dans la carte.
- Procédé suivant l'une des revendications 1 à 5, caractérisé par le fait que la distribution de plusieurs grandeurs de processus sélectionnées est représentée dans la carte de Kohonen, la différence de poids d'un neurone par rapport à son neurone voisin pour des grandeurs de processus sélectionnées étant déterminée et représentée en codage de couleur.
Applications Claiming Priority (2)
| Application Number | Priority Date | Filing Date | Title |
|---|---|---|---|
| DE19649633A DE19649633A1 (de) | 1996-12-02 | 1996-12-02 | Verfahren zur Analyse und Darstellung von transienten Prozeßvorgängen |
| DE19649633 | 1996-12-02 |
Publications (2)
| Publication Number | Publication Date |
|---|---|
| EP0845720A1 EP0845720A1 (fr) | 1998-06-03 |
| EP0845720B1 true EP0845720B1 (fr) | 1999-11-17 |
Family
ID=7813205
Family Applications (1)
| Application Number | Title | Priority Date | Filing Date |
|---|---|---|---|
| EP97120787A Expired - Lifetime EP0845720B1 (fr) | 1996-12-02 | 1997-11-27 | Méthode d'analyse et de visualisation d'états transitoires d'un processus |
Country Status (3)
| Country | Link |
|---|---|
| US (1) | US6321216B1 (fr) |
| EP (1) | EP0845720B1 (fr) |
| DE (2) | DE19649633A1 (fr) |
Cited By (2)
| Publication number | Priority date | Publication date | Assignee | Title |
|---|---|---|---|---|
| EP3282399A1 (fr) * | 2016-08-11 | 2018-02-14 | Siemens Aktiengesellschaft | Procede de reconnaissance ameliore d'anomalies de processus d'une installation technique et systeme de diagnostic correspondant |
| CN110320880A (zh) * | 2019-07-31 | 2019-10-11 | 翔创科技(北京)有限公司 | 一种牲畜屠宰线监控方法、装置及设备 |
Families Citing this family (18)
| Publication number | Priority date | Publication date | Assignee | Title |
|---|---|---|---|---|
| US6785736B1 (en) * | 2000-09-12 | 2004-08-31 | International Business Machines Corporation | Method and system for optimizing the network path of mobile programs |
| ES2169009B1 (es) * | 2000-12-14 | 2003-11-01 | Alma Bioinformatics S L | Algoritmo auto-organizativo de datos de expresion genica |
| US20020123996A1 (en) * | 2001-02-06 | 2002-09-05 | O'brien Christopher | Data mining system, method and apparatus for industrial applications |
| GB0505396D0 (en) * | 2005-03-16 | 2005-04-20 | Imp College Innovations Ltd | Spatio-temporal self organising map |
| US20060247798A1 (en) * | 2005-04-28 | 2006-11-02 | Subbu Rajesh V | Method and system for performing multi-objective predictive modeling, monitoring, and update for an asset |
| US7536364B2 (en) * | 2005-04-28 | 2009-05-19 | General Electric Company | Method and system for performing model-based multi-objective asset optimization and decision-making |
| JP4201012B2 (ja) * | 2006-04-06 | 2008-12-24 | ソニー株式会社 | データ処理装置、データ処理方法、およびプログラム |
| US20080221395A1 (en) * | 2006-12-28 | 2008-09-11 | Potts Steven J | Self-organizing maps in clinical diagnostics |
| US20080161652A1 (en) * | 2006-12-28 | 2008-07-03 | Potts Steven J | Self-organizing maps in clinical diagnostics |
| DE102008027605B4 (de) | 2008-06-10 | 2010-04-08 | Optiming Gmbh | System und Verfahren zur rechnerbasierten Analyse großer Datenmengen |
| DE102008058016A1 (de) | 2008-11-19 | 2010-11-04 | Optiminig Gmbh | System und Verfahren zur rechnerbasierten Analyse großer Datenmengen |
| US8756180B2 (en) * | 2011-11-28 | 2014-06-17 | General Electric Company | Method and system for managing plant operation |
| DE102012015485A1 (de) | 2012-08-07 | 2014-05-15 | Prüftechnik Dieter Busch AG | Verfahren zum Überwachen von rotierenden Maschinen |
| US10229092B2 (en) | 2017-08-14 | 2019-03-12 | City University Of Hong Kong | Systems and methods for robust low-rank matrix approximation |
| JP7021052B2 (ja) * | 2018-11-06 | 2022-02-16 | 株式会社東芝 | 製品状態推定装置 |
| DE102019215016A1 (de) * | 2018-12-28 | 2020-07-02 | Robert Bosch Gmbh | Messanordnung, Verfahren zum Einrichten einer Messanordnung und Verfahren zum Betreiben einer Messanordnung |
| EP4060433A1 (fr) * | 2021-03-19 | 2022-09-21 | Siemens Aktiengesellschaft | Procédé et système de prévision du fonctionnement d'une installation technique |
| CN113344137B (zh) * | 2021-07-06 | 2022-07-19 | 电子科技大学成都学院 | 基于som的数据融合方法、装置、存储介质及电子设备 |
Family Cites Families (19)
| Publication number | Priority date | Publication date | Assignee | Title |
|---|---|---|---|---|
| CA2012702A1 (fr) * | 1989-04-10 | 1990-10-10 | Peter Breitkopf | Teledetection multispectrale de mineraux au moyen de reseaux neuronaux |
| SE463338B (sv) * | 1989-06-14 | 1990-11-05 | Ludwik Liszka | Saett att oevervaka och/eller diagnosticera aktuella drifttillstaand hos komplicerade maskiner |
| US5222210A (en) * | 1990-12-03 | 1993-06-22 | Motorola, Inc. | Method of displaying the state of an artificial neural network |
| JPH05130737A (ja) * | 1991-09-10 | 1993-05-25 | Toshiba Corp | 電力系統監視装置 |
| DE4132666A1 (de) * | 1991-10-01 | 1993-04-08 | Dieter Dr Vetterkind | Lernendes prozessnetz |
| DE4200260A1 (de) * | 1992-01-08 | 1993-07-22 | Dieter W Dr Ing Vetterkind | Prozess-evolutionsrechner |
| US5448681A (en) * | 1992-03-27 | 1995-09-05 | National Semiconductor Corporation | Intelligent controller with neural network and reinforcement learning |
| JPH05342191A (ja) * | 1992-06-08 | 1993-12-24 | Mitsubishi Electric Corp | 経済時系列データ予測及び解析システム |
| US5353207A (en) * | 1992-06-10 | 1994-10-04 | Pavilion Technologies, Inc. | Residual activation neural network |
| JP3138541B2 (ja) * | 1992-08-05 | 2001-02-26 | 株式会社神戸製鋼所 | 高炉炉熱制御装置 |
| EP0687369A1 (fr) * | 1993-03-02 | 1995-12-20 | Pavilion Technologies Inc. | Procede et dispositif d'analyse d'un reseau neuronal a l'interieur de contraintes relatives aux parametres operationnels souhaites |
| SE9304246L (sv) * | 1993-12-22 | 1995-06-23 | Asea Brown Boveri | Förfarande vid övervakning av multivariata processer |
| DE19518804A1 (de) * | 1994-05-27 | 1995-12-21 | Fraunhofer Ges Forschung | Verfahren zur Überwachung eines Produktionsprozesses |
| US5625751A (en) * | 1994-08-30 | 1997-04-29 | Electric Power Research Institute | Neural network for contingency ranking dynamic security indices for use under fault conditions in a power distribution system |
| US5602886A (en) * | 1995-10-10 | 1997-02-11 | The University Of Chicago | Neural net controlled tag gas sampling system for nuclear reactors |
| DE19538133A1 (de) * | 1995-10-13 | 1997-04-17 | Asoc Associative Computing Ag | Verfahren zur 3D-Visualisierung von Daten auf portierbare Dateien, insbesondere auf dem Bildschirm eines Computers |
| JPH1063634A (ja) * | 1996-04-05 | 1998-03-06 | Nec Corp | 時系列予測・分類のための方法及び装置 |
| US5809490A (en) * | 1996-05-03 | 1998-09-15 | Aspen Technology Inc. | Apparatus and method for selecting a working data set for model development |
| DE19637651A1 (de) * | 1996-09-16 | 1998-03-19 | Abb Patent Gmbh | Verfahren zur Prozeßvisualisierung |
-
1996
- 1996-12-02 DE DE19649633A patent/DE19649633A1/de not_active Withdrawn
-
1997
- 1997-11-27 EP EP97120787A patent/EP0845720B1/fr not_active Expired - Lifetime
- 1997-11-27 DE DE59700716T patent/DE59700716D1/de not_active Expired - Lifetime
- 1997-12-02 US US08/982,613 patent/US6321216B1/en not_active Expired - Lifetime
Cited By (3)
| Publication number | Priority date | Publication date | Assignee | Title |
|---|---|---|---|---|
| EP3282399A1 (fr) * | 2016-08-11 | 2018-02-14 | Siemens Aktiengesellschaft | Procede de reconnaissance ameliore d'anomalies de processus d'une installation technique et systeme de diagnostic correspondant |
| CN110320880A (zh) * | 2019-07-31 | 2019-10-11 | 翔创科技(北京)有限公司 | 一种牲畜屠宰线监控方法、装置及设备 |
| CN110320880B (zh) * | 2019-07-31 | 2021-03-02 | 翔创科技(北京)有限公司 | 一种牲畜屠宰线监控方法、装置及设备 |
Also Published As
| Publication number | Publication date |
|---|---|
| DE19649633A1 (de) | 1998-06-04 |
| DE59700716D1 (de) | 1999-12-23 |
| US6321216B1 (en) | 2001-11-20 |
| EP0845720A1 (fr) | 1998-06-03 |
Similar Documents
| Publication | Publication Date | Title |
|---|---|---|
| EP0845720A1 (fr) | Méthode d'analyse et de visualisation d'états transitoires d'un processus | |
| EP0789861B1 (fr) | Procede d'analyse des donnees d'operations d'une installation technique | |
| EP0789864B1 (fr) | Systeme de controle pour installation industrielle | |
| DE3587061T2 (de) | Bildverarbeitungseinrichtung und verfahren zu deren steuerung. | |
| EP3876060B1 (fr) | Procédé et unité de calcul destinés à l'analyse des causes d'un état anormal d'une machine | |
| EP3282399B1 (fr) | Procede de reconnaissance ameliore d'anomalies de processus d'une installation technique et systeme de diagnostic correspondant | |
| EP4193227A1 (fr) | Dispositif et procédé de détection d'anomalies dans une installation industrielle pour l'exécution d'un processus de production | |
| DE10241746B4 (de) | Verfahren zur zyklischen Qualitätsbewertung und Prozessüberwachung bei periodischen Produktionsprozessen | |
| DE19734947B4 (de) | Verfahren zur Steuerung von Prozeßvorgängen | |
| WO2002010866A2 (fr) | Procede de telediagnostic d'un processus technologique | |
| EP1145192B1 (fr) | Configuration d'elements informatiques interconnectes, procede de determination assistee par ordinateur d'une dynamique a la base d'un processus dynamique et procede d'apprentissage assiste par ordinateur d'une configuration d'elements informatiques interconnectes | |
| EP3232282A1 (fr) | Dispositif de diagnostic et procede de surveillance du fonctionnement d'une installation technique | |
| EP3696743A1 (fr) | Procédé et dispositif de surveillance permettant de surveiller un système technique au moyen de la détection des anomalies | |
| EP2414903A1 (fr) | Dispositif et procédé de réalisation d'un modèle de processus | |
| EP0875808A2 (fr) | Système et méthode pour la modélisation de processus d'une installation technique | |
| EP0829809B1 (fr) | Méthode de visualisation de processus | |
| EP4268029B1 (fr) | Procédé et système de supervision du fonctionnement d'une installation technique | |
| DE112019007889T5 (de) | Bearbeitungsprogramm-umwandlungseinrichtung, numerische-steuereinrichtung und bearbeitungsprogramm-umwandlungsverfahren | |
| AT522639B1 (de) | Vorrichtung und Verfahren zum Visualisieren oder Beurteilen eines Prozesszustandes | |
| DE10146901A1 (de) | Verfahren und System zur Bearbeitung von Fehlerhypothesen | |
| EP3121672B1 (fr) | Procede et dispositif de diagnostic destines a la surveillance du fonctionnement d'un circuit regulateur | |
| DE19742906A1 (de) | Verfahren zum Optimieren von Produkten und Produktionsprozessen | |
| DE102022214233B3 (de) | Bestimmen einer Ähnlichkeit von Verkehrsszenen zur Verbesserung maschineller Lernsysteme bzw. Algorithmen zur Trajektorienprädiktion oder Manöverplanung für automatisierte Fahrzeuge | |
| DE102019103257A1 (de) | Vorhersagesystem und -verfahren für anlagenanomalien | |
| EP3671576A1 (fr) | Procédé et dispositif de détermination des segments dans des données de séries temporelles reçues d'un composant de système |
Legal Events
| Date | Code | Title | Description |
|---|---|---|---|
| PUAI | Public reference made under article 153(3) epc to a published international application that has entered the european phase |
Free format text: ORIGINAL CODE: 0009012 |
|
| AK | Designated contracting states |
Kind code of ref document: A1 Designated state(s): DE FR GB |
|
| AX | Request for extension of the european patent |
Free format text: AL;LT;LV;MK;RO;SI |
|
| 17P | Request for examination filed |
Effective date: 19980713 |
|
| 17Q | First examination report despatched |
Effective date: 19981016 |
|
| AKX | Designation fees paid |
Free format text: DE FR GB |
|
| RBV | Designated contracting states (corrected) |
Designated state(s): DE FR GB |
|
| GRAG | Despatch of communication of intention to grant |
Free format text: ORIGINAL CODE: EPIDOS AGRA |
|
| GRAG | Despatch of communication of intention to grant |
Free format text: ORIGINAL CODE: EPIDOS AGRA |
|
| GRAH | Despatch of communication of intention to grant a patent |
Free format text: ORIGINAL CODE: EPIDOS IGRA |
|
| GRAH | Despatch of communication of intention to grant a patent |
Free format text: ORIGINAL CODE: EPIDOS IGRA |
|
| GRAA | (expected) grant |
Free format text: ORIGINAL CODE: 0009210 |
|
| AK | Designated contracting states |
Kind code of ref document: B1 Designated state(s): DE FR GB |
|
| REF | Corresponds to: |
Ref document number: 59700716 Country of ref document: DE Date of ref document: 19991223 |
|
| GBT | Gb: translation of ep patent filed (gb section 77(6)(a)/1977) |
Effective date: 19991206 |
|
| ET | Fr: translation filed | ||
| PLBE | No opposition filed within time limit |
Free format text: ORIGINAL CODE: 0009261 |
|
| STAA | Information on the status of an ep patent application or granted ep patent |
Free format text: STATUS: NO OPPOSITION FILED WITHIN TIME LIMIT |
|
| 26N | No opposition filed | ||
| REG | Reference to a national code |
Ref country code: GB Ref legal event code: IF02 |
|
| REG | Reference to a national code |
Ref country code: GB Ref legal event code: 732E |
|
| REG | Reference to a national code |
Ref country code: FR Ref legal event code: TP |
|
| REG | Reference to a national code |
Ref country code: DE Ref legal event code: R081 Ref document number: 59700716 Country of ref document: DE Owner name: TECDATA AG, CH Free format text: FORMER OWNER: OTTE, RALF, DR., 69469 WEINHEIM, DE Effective date: 20110823 |
|
| PGFP | Annual fee paid to national office [announced via postgrant information from national office to epo] |
Ref country code: GB Payment date: 20131122 Year of fee payment: 17 Ref country code: DE Payment date: 20131126 Year of fee payment: 17 Ref country code: FR Payment date: 20131119 Year of fee payment: 17 |
|
| REG | Reference to a national code |
Ref country code: DE Ref legal event code: R119 Ref document number: 59700716 Country of ref document: DE |
|
| GBPC | Gb: european patent ceased through non-payment of renewal fee |
Effective date: 20141127 |
|
| REG | Reference to a national code |
Ref country code: FR Ref legal event code: ST Effective date: 20150731 |
|
| PG25 | Lapsed in a contracting state [announced via postgrant information from national office to epo] |
Ref country code: GB Free format text: LAPSE BECAUSE OF NON-PAYMENT OF DUE FEES Effective date: 20141127 Ref country code: DE Free format text: LAPSE BECAUSE OF NON-PAYMENT OF DUE FEES Effective date: 20150602 |
|
| PG25 | Lapsed in a contracting state [announced via postgrant information from national office to epo] |
Ref country code: FR Free format text: LAPSE BECAUSE OF NON-PAYMENT OF DUE FEES Effective date: 20141201 |