EP0809194A2 - Universeller Schmalbandsignalgestalter - Google Patents
Universeller Schmalbandsignalgestalter Download PDFInfo
- Publication number
- EP0809194A2 EP0809194A2 EP97301892A EP97301892A EP0809194A2 EP 0809194 A2 EP0809194 A2 EP 0809194A2 EP 97301892 A EP97301892 A EP 97301892A EP 97301892 A EP97301892 A EP 97301892A EP 0809194 A2 EP0809194 A2 EP 0809194A2
- Authority
- EP
- European Patent Office
- Prior art keywords
- signal
- fft
- frequency
- spectral line
- sensor
- Prior art date
- Legal status (The legal status is an assumption and is not a legal conclusion. Google has not performed a legal analysis and makes no representation as to the accuracy of the status listed.)
- Withdrawn
Links
Images


Classifications
-
- G—PHYSICS
- G06—COMPUTING OR CALCULATING; COUNTING
- G06F—ELECTRIC DIGITAL DATA PROCESSING
- G06F17/00—Digital computing or data processing equipment or methods, specially adapted for specific functions
- G06F17/10—Complex mathematical operations
- G06F17/14—Fourier, Walsh or analogous domain transformations, e.g. Laplace, Hilbert, Karhunen-Loeve, transforms
- G06F17/141—Discrete Fourier transforms
- G06F17/142—Fast Fourier transforms, e.g. using a Cooley-Tukey type algorithm
-
- G—PHYSICS
- G06—COMPUTING OR CALCULATING; COUNTING
- G06F—ELECTRIC DIGITAL DATA PROCESSING
- G06F17/00—Digital computing or data processing equipment or methods, specially adapted for specific functions
- G06F17/10—Complex mathematical operations
- G06F17/14—Fourier, Walsh or analogous domain transformations, e.g. Laplace, Hilbert, Karhunen-Loeve, transforms
Definitions
- the present invention relates generally to a signal processing system. More specifically, the invention relates to a signal processing system such as a signal conditioner which utilizes the attributes of fast Fourier transform calculations without requiring substantial complex arithmetic.
- the fast Fourier transform is a known method of converting a signal into its spectral components for analysis and manipulation.
- the FFT has utility in a vast variety of applications including signal processing, image enhancement, etc.
- the conventional approach to FFTs requires a very large number of complex multiplications and complex additions.
- These FFT calculations generally require at least a microprocessor with a dedicated math coprocessor to allow execution of the FFT within a period of time suitable for use in real time applications.
- FFTs are particularly useful in the processing or conditioning of an output signal of a sensor or other type of detection device.
- sensors e.g., resistive, capacitive, inductive
- By taking the FFT of the output signal it is possible to condition the signal in order to obtain information such as phase and amplitude.
- phase and amplitude Unfortunately, it has not always been practical to provide such sensors with the necessary computational hardware.
- many aircraft have different sensors which require real time processing. Such sensors frequently require a high speed microprocessor with a dedicated math coprocessor in order to condition the signal using FFTs. This results in increased size and expense making such sensors less attractive in an aircraft environment.
- the present invention provides a system for processing a signal by calculating its FFT without necessarily requiring complex arithmetic operations. As a result, the FFT can be calculated easily in real time.
- a simple, low-cost microprocessor is suitable for carrying out the calculations. There is no need for expensive high-speed processors.
- the present invention has utility in connection with conditioning a sensor output signal.
- the invention exhibits a very narrow bandpass response useful for filtering out interference outside the excitation frequency of the sensor.
- an apparatus for processing a signal made up of at least one spectral component.
- the apparatus includes a sampling circuit for periodically sampling the signal to obtain a sequence of discrete data samples representing the signal; and a computational circuit for computing a fast Fourier transform (FFT) of the sequence of discrete data samples to an extent which the FFT is computed using substantially exclusively non-complex arithmetic operations, and for using a resultant portion of the FFT to obtain a phase and amplitude of the at least one spectral component making up the signal.
- FFT fast Fourier transform
- a narrow band signal conditioner for processing an output signal from a device, the output signal being made up of at least one spectral component.
- the signal conditioner includes a sampling circuit for periodically sampling the output signal to obtain a sequence of discrete data samples representing the output signal; and a computational circuit for computing a fast Fourier transform (FFT) of the sequence of discrete data samples to an extent which the FFT is computed using substantially exclusively non-complex arithmetic operations, and for using a resultant portion of the FFT to obtain a phase and amplitude of the at least one spectral component making up the output signal.
- FFT fast Fourier transform
- a method for processing a signal made up of at least one spectral component includes the steps of periodically sampling the signal to obtain a sequence of discrete data samples representing the signal; and computing a portion of a fast Fourier transform (FFT) of the sequence of discrete data samples to an extent which the FFT is computed using substantially exclusively non-complex arithmetic operations, and for using a resultant portion of the FFT to obtain a phase and amplitude of the at least one spectral component making up the signal.
- FFT fast Fourier transform
- an apparatus for processing a signal having a predetermined frequency includes a sampling circuit for sampling the signal to obtain a sequence of discrete data samples representing the signal; and a computational circuit for computing a portion of a fast Fourier transform (FFT) of the sequence of discrete data samples to obtain a value of a spectral line component of the FFT corresponding to the predetermined frequency, to the exclusion of computing values of spectral line components of the FFT corresponding to at least one other frequency.
- FFT fast Fourier transform
- a method of processing a signal including establishing a frequency of the signal; and obtaining a fast Fourier transform (FFT) of the signal by selecting a sampling frequency and total number of samples of the signal such that a spectral line component of the resulting FFT will correspond to the frequency of the signal, obtaining the samples, and computing the FFT of the signal by calculating a value of the spectral line component corresponding to the frequency of the signal while substantially omitting arithmetic operations associated with obtaining values of other spectral line components of the FFT.
- FFT fast Fourier transform
- a signal processing circuit 10 is provided for conditioning an output signal of a sensor 12 in accordance with the exemplary embodiment of the present invention.
- the sensor 12 can be any of a variety of different types of conventional sensors.
- the sensor 12 may be a capacitive sensor used to measure fuel height or quantity in an aircraft.
- the sensor 12 may be a resistive type which senses resistance in relation to pressure, temperature, etc., or an inductive type which senses inductance in relation to position, etc.
- the sensor 12 as described herein is not necessarily limited to a particular type sensor or application. It is only for sake of illustrating the advantages of the invention that the sensor 12 will be discussed primarily in the context of a capacitive sensor for measuring fuel height or quantity.
- the signal processing circuit 10 includes a microprocessor 14 for carrying out the various control and computational operations described herein.
- the microprocessor 14 in accordance with the invention computes at least a portion of the FFT of the sensor output signal using only real addition and multiplication operations. This enables the FFT to be computed quickly and in real time.
- the microprocessor 14 preferably is selected from any of a variety of low-cost microprocessors operating at relatively low clock speeds. As will be appreciated, a high-speed microprocessor is unnecessary as the FFT for the signal of interest can be calculated without requiring complex arithmetic operations.
- the microprocessor 14 is general purpose microprocessor such as an Intel 80186 running at 40MHz which is available from Intel Corporation.
- microprocessor 14 may be programmed to carry out the various operations described herein will be readily apparent to those having ordinary skill in the art of programming based on the disclosure provided herein. As a result, additional detail has been omitted for sake of brevity.
- the microprocessor 14 is nominally divided in Fig. 1 so as to include a central processing unit 16, a clock circuit 18, and an FFT data reduction section 20. In actuality, each of these components are included primarily within the central processing unit 16 itself but are illustrated separately for ease of understanding.
- the CPU 16 is responsible for carrying out the various control and arithmetic operations within the signal processing circuit 10.
- the CPU 16 is connected to a memory 22 which preferably includes random access memory (RAM) and read only memory (ROM).
- the memory 22 stores the operating code for the signal processing circuit 10 for carrying out the operations described herein.
- the memory 22 is used for storing data, etc. which is accessed by the CPU 16 via bus 24.
- the sensor 12 in the exemplary embodiment is excited by a sinewave or other arbitrary waveform. More particularly, the CPU 16 provides excitation waveform data on bus 26 to the input of a digital-to-analog converter (D/A) 28.
- the D/A 28 converts the digital waveform data into analog data which is provided to a low pass filter (LPF) 30.
- the LPF 30 filters the data to remove harmonics and clock frequencies and to convert the data into a continuous analog waveform.
- the output of the LPF 30 serves as the excitation waveform which is input to the sensor 12 .
- the excitation waveform is a sinusoid having a frequency of 18.24818 kilohertz (kHz), or a period of 54.8 microseconds.
- the D/A 28 is 16 bits wide and is updated every 3.425 microseconds during waveform generation.
- the LPF 30 has a 5-pole Butterworth response with a -3db frequency of 31.0946 kHz.
- the output of the LPF 30 is connected to the sensor driver or excitation circuitry (not shown) conventionally found within the sensor 12.
- the sensor 12 produces an analog output signal on line 32 which has the same frequency as the excitation waveform but which varies in amplitude and/or phase depending on the parameter being sensed. For example, the phase and/or amplitude of the sensor output changes in accordance with the amount/height of fuel within a fuel tank in which the sensor 12 is located. In such an example, the output signal of the sensor 12 represents the signal of interest. Signals at any other frequencies are attributable to noise or interference typically. By determining the FFT of the output signal, the signal processing circuit 10 is able to associate the phase and/or amplitude of the sensor output signal with the amount/height of fuel.
- the output of the sensor 12 on line 32 is provided to a voltage converter circuit 34 which converts the sensor output signal to a proportional voltage as is conventional.
- the proportional voltage from the voltage converter circuit 34 is then provided to an anti-alias filter 36 and then to an analog-to-digital converter (A/D) 38.
- the A/D 38 samples the output signal from the sensor 12 periodically, and the digitized signal is provided to the microprocessor 14 via bus 40.
- the digitized data is input to the FFT data reduction section 20 as part of the CPU 16 which, as is described in more detail below, calculates at least a portion of the FFT of the digitized sensor output signal using only real additions and real multiplications.
- such calculation of the FFT produces results identical to a normal FFT calculation involving numerous complex arithmetic operations at least with respect to the signal of interest, e.g., the sensor output signal.
- the FFT from the FFT data reduction section 20 is then further processed by the CPU 16 in order to determine the desired parameter such as fuel height or quantity.
- the desired parameter such as fuel height or quantity.
- the anti-alias filter 36 has a 9-pole Butterworth response with a -3db frequency of 26.6525 kHz.
- the A/D 38 is 16 bits wide and samples the filter output every 6.85 microseconds during measurement of the output signal of the sensor 12.
- the frequency at which the sensor output signal is sampled is exactly eight times the frequency of the sensor output signal.
- the clock circuit 18 included in the microprocessor 14 is controlled by the CPU 16 and provides the respective clock signals to the D/A 28 and the A/D 38 to update the excitation waveform data and sample the sensor output signal.
- the signal processing circuit 10 further includes a display 45 or other type of output coupled to the CPU 16 for displaying or otherwise outputting the information obtained by processing the sensor output signal.
- the signal processing circuit 10 may include an input section 47 such as a keypad for allowing an operator to input information according to a particular application.
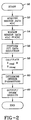
- a flowchart representing the operation of the signal processing circuit 10 is shown. Operation begins at step 50 when the circuit 10 initializes itself upon being powered up, for example.
- the circuit 10 acquires a set of sensor data, i.e., the digitized sensor output signal data s(n) from the A/D 38.
- the acquisition of such data is described in more detail below in connection with Figs. 4 and 5.
- the 2048 data samples represent 256 complete and consecutive cycles at a rate of eight data samples per cycle.
- the sensor data s(n) is windowed in step 54 using conventional techniques to eliminate Gibb's oscillations resulting from the finite sample time.
- a Blackman window function is used, although any standard window function may be selected as will be appreciated.
- Such window function is shown below whereby x(n) represents the windowed value, and s(n) represents the sampled value from the A/D 38:
- x(n) s(n)*[0.42 - 0.5*cos(2 ⁇ n/2047) + 0.08*cos(4 ⁇ n/2047)]*K
- the windowed value x(n) for each data point is calculated within the FFT data reduction section 20 (e.g., by the CPU 16) in accordance with the above equations, and the result is stored in the original data location in memory, thus preserving the data sample order.
- the array of windowed values is denoted by x(n) 2048 .
- FFT data reduction in accordance with the invention is performed in step 56 in order to calculate at least a portion the FFT of the sampled data.
- Figs. 3A and 3B In order to facilitate understanding as to how the FFT of the windowed sensor output signal is computed in step 56, reference is made to Figs. 3A and 3B, and initially to Fig. 3A.
- Fig. 3A there is shown a flow graph of a complete decimation-in-frequency decomposition of an eight-sample FFT computation. Such flow graph is described in detail, for example, in the book entitled "Digital Signal Processing" by Oppenheim, A.V. and Schaffer, R.W. (Prentice-Hall 1975).
- the points x(O) thru x(7) on the left hand side of the flow graph represent the data samples for which the FFT is to be computed.
- the points X(O) thru X(7) on the right hand side of the flow graph represent the corresponding spectral line components of the resultant FFT.
- the flow graph in Fig. 3A takes advantage of the inherent symmetry in FFT computations.
- Points x(0) thru x(7) are interconnected via a collection of FFT "butterflies".
- Each butterfly represents in the general case a set of complex arithmetic operations carried out on a pair of data points.
- a complex arithmetic operation is encountered during the calculation of the FFT only in those instances where a complex weighting factor W N is encountered along the flow path.
- those paths along the flow graph which do not include a complex weighting factor W N i.e., those paths highlighted by dashed lines, involve only real addition operations.
- the data points can be divided into two groups. Therefore, in step 1 the spectral line components corresponding to data points x(0) thru x(7) are divided into two groups x(0) thru x(3) and x(4) thru x(7). The first data point x(4) in the second group is then added to the first data point x(0) in the first group. Similarly, the second data point x(5) in the second group is added to the second data point x(1) in the first group, and so on. In step 2, the spectral line components corresponding to data points x(0) thru x(3) can again be divided into two groups x(0) thru x(1) and x(2) thru x(3). Corresponding values from each group are again added using only the paths based on real addition operations.
- an FFT for a set of data points can be calculated using exclusively real arithmetic operations.
- Each step along the flow graph results in a one-half reduction in the number of spectral line components represented only by real arithmetic operations.
- the operation is carried out completely from left to right in the flow graph, only the DC spectral line component X(0) is obtained.
- intermediate values for a portion of the spectral line components are available prior to the last step. The number of spectral line components for which values are available will depend on the initial number of data points and the number of times the real addition operations are carried out in order to reduce the number by half.
- FIG. 3B a flow graph similar to that shown in Fig. 3A is illustrated.
- the flow graph however represents only a portion of a decimation-in-frequency decomposition of a 2048-sample FFT compution. Shown are only the spectral line components corresponding to data points x(0) thru x(7) out of data points x(0) thru x(2047).
- the FFT for 2048 data points is calculated according to the flow graph only along those paths which involve real addition operations in the manner discussed above with respect to Fig. 3A, eventually the flow graph for the 2048 data points would be reduced to that portion shown in Fig. 3B. Applying the same reduction exemplified in Fig.
- the original 2048 spectral line components corresponding to data points x(0) thru x(2048) are reduced in number by a factor of 2 in each step.
- spectral line components (2048/2 8 ) remaining which are arrived at based only on real additions.
- Such spectral line components correspond to data points x(0) thru x(7) as shown in Fig. 3B.
- the specific spectral line components corresponding to the data points x(0) thru x(7) are known based on bit-reversed binary order.
- the spectral line component corresponding to data point x(1) i.e., x ⁇ 00000000001 ⁇
- X(1024) i.e., X ⁇ 10000000000 ⁇
- the respective corresponding spectral line components are X(0), X(1024), X(512), X(1536), X(256), X(1280), X(768) and X(1792) as shown in Fig. 3B.
- line component frequency line component number N * fs where N is the total number of samples, and fs is the sampling frequency.
- spectral line components X(1024), X(512) and X(256) are noteworthy as these lines represent frequencies which are an integral fraction of the sampling frequency.
- the sampling frequency fs is exactly eight times the frequency represented by spectral line component X(256).
- spectral line component X(256) represents a frequency which is exactly one-eighth the sampling frequency.
- the values of the spectral line components X(0), X(1024) ..., X(1792) can be calculated with only a small number of complex arithmetic operations compared to the number of complex operations which would ordinarily be performed had the FFT for all 2048 points been calculated.
- the particular frequency(s) of the signal of interest be limited to those spectral line components remaining after the above mentioned reduction, the FFT of the signal of interest can be determined substantially without any complex arithmetic operations.
- the weighting factor W k N in the remaining portion of the flow graph can be represented by a real number equal to either 1, 0, -1, ⁇ 2 or - ⁇ 2.
- the values of the spectral line components X(0, X(1024), ..., X(1792) can be calculated without any complex arithmetic operations based on this predetermined relationship.
- the FFT calculation has been identified by the inventor herein, and are used to simplify greatly the FFT computation.
- 2048 samples are obtained from the sensor output signal in the exemplary embodiment.
- the sensor output signal is sampled at a rate which is eight times the frequency of the sensor output signal.
- the signal of interest i.e., the sensor output signal
- the spectral line component X(256) which, as noted above, relates to the frequency component which is one-eighth the sampling frequency.
- the FFT of the sensor output signal can be calculated entirely with very few, or even zero, complex arithmetic operations.
- the present invention makes this possible by ensuring that the signal of interest corresponds to the frequency of one or more of the spectral line components remaining after the above-described reduction. Such aspect is described in more detail below in relation to Figs. 4 and 5.
- step 56 the relevant portion of the FFT of the windowed data is calculated in the FFT data reduction section 20 by the CPU 16 (Fig. 1). Such calculation is performed using the properties discussed above in relation to Figs. 3A and 3B. Specifically, the spectral line components corresponding to the data points are reduced by performing eight steps of reduction based on real addition operations as follows:
- one of the line components is the X(256) spectral line component.
- the spectral line component X(256) represents exactly the frequency of the sensor output signal.
- the complete FFT of the signal of interest is obtained.
- substantially fewer complex arithmetic operations are required as compared to the case where the entire FFT of the 2048 samples was performed. Since the signal of interest is confined to one particular frequency, numerous unnecessary complex calculations are avoided.
- the spectral line component X(256) In order to complete the calculation of the spectral line component X(256), it is recognized that the remaining eight spectral line components will be related by a weighting factor of either 1, 0, -1, ⁇ 2 or - ⁇ 2. Thus, it is then possible to complete the calculation of the spectral line component X(256) to obtain the real and imaginary components of the sampled signal without necessarily performing any complex arithmetic operations. More specifically, the real and imaginary components (representing the phase and amplitude) of the sampled sensor output signal s(n), i.e., S real and S imag , respectively, can then be calculated based on the reduced values of x(n) 8 as follows by the CPU 16 in step 58 of Fig. 2.
- the determination of the real and imaginary components of the sensor output signal as determined in steps 56 and 58 requires only 2032 unsigned real additions, 10 signed additions, and two real multiplies. Similar savings result if calculating one or more of the other remaining spectral line components. This is in stark contrast to the conventional FFT where a typical similar computation would require 11,264 complex multiplies and twice that number of complex adds as mentioned above. Hence, the present invention provides a vast improvement with respect to reducing the computing power necessary for processing the sensor output signal in real time.
- a switch S1 is utilized to selectively switch a calibration resistor R cal in place of the sensor 12.
- Such resistor is used to provide a phase and amplitude reference.
- the phase of the data provided by the CPU 16 on bus 26 to generate the excitation waveform is adjusted such that the value of S real will be ⁇ 0.
- the resistive and capacitive portions of the sensor output signal are easily measured simply by using the real (capacitance) or imaginary (resistance) part of the resultant S imag and S real components of the sensor output signal as determined by the FFT determined in step 56 (Fig. 2).
- the calibration resistor R cal having a known value can be periodically switched in place of the sensor 12 via the switch S1 to calibrate circuit operation.
- the calibration resistor R cal could be replaced by a known capacitor or inductor.
- step 60 the CPU 16 determines the desired parameters based on the sensor output signal.
- the capacitance of the sensor 12 is indicative of fuel height within a tank in the aircraft, i.e., the fuel quantity.
- step 60 the microprocessor 14 outputs and/or stores the calculated sensor parameters in step 62.
- the microprocessor 14 may calculate the fuel height based on the measured capacitance of the sensor 12 and display the results on the display output 45. The process described in Fig. 2 can then be repeated so as to update continuously the sensor reading as will be appreciated.
- Figs. 4 and 5 illustrate the excitation waveform generation and data acquisition process of the present invention as referred to in step 52 of Fig. 2.
- the signal of interest coincide with one of the remaining spectral line components following the FFT data reduction.
- One means for doing this is to phase lock the signal of interest with the sampling of the signal to achieve the corresponding proportional relationship.
- the exemplary embodiment of the present invention utilizes an algorithm which interlaces the provision of the sensor excitation waveform data with the sampling of the sensor output signal to ensure a fixed phase and frequency relationship between the excitation waveform frequency and the sampling rate.
- the CPU 16 at time t1 provides waveform data to the D/A 28.
- the CPU 16 reads and stores the data from the A/D 38.
- the CPU 16 provides the next waveform data to the D/A 28.
- the CPU 16 waits a predetermined time and then at time t5 the CPU 16 provides another waveform data to the D/A 28.
- the CPU 16 reads and stores the next sensor output data via the A/D 38. Thereafter, the CPU 16 at time t7 provides another waveform data to the D/A 28, and. at time t8 the CPU 16 again waits a predetermined time.
- times t1-t8 are as follows (in microseconds):
- This routine (t1-t8) is repeated four times in sequence to produce one complete cycle of the sensor excitation waveform. It is then repeated until 256 complete waveforms have been produced as determined in step 70 and the resulting 2048 data points are stored.
- the resulting waveform has a period of 54.8 microseconds, or a sensor excitation frequency of 18.24818 kHz as mentioned above.
- the sensor output signal is in turn sampled at eight times the signal frequency, or at 145.9854 kHz.
- the wait periods occurring at times t4 and t8 are periods which have no specific signal processing activity.
- Fig. 5 is a timing diagram illustrating the data acquisition procedure.
- the line D/A CLK represents the clock signal provided to the D/A 28 at times t1, t3, t5 and t7.
- the line A/D CLK represents the clock signal provided to the A/D 38 at times t2 and t6.
- the sensor data s(n) is output from the A/D 38 at times t2 and t6.
- the various timing of the respective signals can be provided via a dedicated clock circuit such as circuit 18 as shown in Fig. 1.
- the operating code carried out by the CPU 16 during the data acquisition process can be structured such that the time it takes to execute the code in relation to each step provides the appropriate timing. In such case the CPU 16 can issue the clock signals to the D/A 28 and A/D 38 directly.
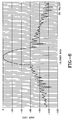
- the above described process for obtaining the FFT of the signal of interest is inherently very narrow band with an equivalent roll-off rate is over 5000 db per decade, and is therefore very immune to noise. Moreover, an even sharper roll-off is possible by increasing the number of data samples from 2048 to 4096.
- Processing the signal in the manner described can either provide very reliable signal measurements in a very noisy environment, or allow the reduction or elimination of interference shields in a somewhat quieter environment.
- the process only responds to the signal of interest, so changes in DC offsets of the processing circuitry have no effect. This aspect is particularly useful in applications subject to high electromagnetic fields, since such interfering signals tend to be rectified by the processing circuitry and change the circuit offsets.
- the process of the present invention is unresponsive to such interference.
- Fig. 6 is a plot showing the bandpass response of the above-described process for processing the output signal of the sensor 12.
- the horizontal frequency scale is 25 Hz per division and the vertical scale is in decibels.
- the present invention results in a very narrow response bandwidth which is ideal in noisy environments.
- the present invention provides the advantage that the FFT of the signal of interest can be calculated based substantially exclusively on real addition operations.
- the microprocessor can utilize its own basic software instructions and there is no need for a math coprocessor. Hence, even a low-speed microprocessor can be utilized resulting in a substantial cost savings, etc.
- microprocessor 14 can be responsible for processing the data obtained from each of the sensors.
- the spectral line components are reduced down to a total of eight using only real additions before attempting to compute the actual value of one or more of the spectral line components.
- eight spectral line components are considered optimum due to the ability to calculate the values of the spectral line components without any complex arithmetic operations, other numbers are possible.
- the reduction in step 56 Fig. 2
- calculation of the real and imaginary components of one or more of the spectral line component values would involve slightly more processing than the case where the FFT is reduced to eight values.
- a portion of the remaining calculations will require complex arithmetic operations.
- step 56 It is also possible to carry the reduction in step 56 down further to four spectral line components, for example. However, care must be taken to make sure the sampling rate satisfies the various sampling criterion, e.g., Nyquist, etc. Similarly, although the signal of interest is described herein as being sampled at an integral multiple equal to eight, other multiples are also possible. Again, however, care must be taken to ensure that the sampling criterion are satisfied as is conventional.
- the above described embodiment is based on an FFT of 2048 samples at a sampling frequency of eight times the signal of interest.
- the frequencies represented by the remaining spectral line components can be adjusted to virtually any frequency of interest.
- the sampling frequency is described herein- as being an integral multiple of the signal of interest, this is not necessary. Rather, in those applications which require an excitation signal, for example, an integral multiple facilitates generation of the excitation signal and sampling of the signal in a phase lock relationship. Also, there is no need for non-integral frequency dividers or multipliers. Even still, such non-integral frequency relationships are certainly possible.
- the frequency(s) represented by the calculated FFT can be varied or "swept" to some extent.
- the values of the FFTs can be updated quickly as the values are calculated without time consuming complex operations.
Landscapes
- Physics & Mathematics (AREA)
- Mathematical Physics (AREA)
- Engineering & Computer Science (AREA)
- General Physics & Mathematics (AREA)
- Theoretical Computer Science (AREA)
- Computational Mathematics (AREA)
- Mathematical Analysis (AREA)
- Mathematical Optimization (AREA)
- Pure & Applied Mathematics (AREA)
- Data Mining & Analysis (AREA)
- Algebra (AREA)
- Software Systems (AREA)
- General Engineering & Computer Science (AREA)
- Databases & Information Systems (AREA)
- Discrete Mathematics (AREA)
- Indication And Recording Devices For Special Purposes And Tariff Metering Devices (AREA)
- Complex Calculations (AREA)
Applications Claiming Priority (2)
| Application Number | Priority Date | Filing Date | Title |
|---|---|---|---|
| US1425996P | 1996-03-28 | 1996-03-28 | |
| US14259 | 1996-03-28 |
Publications (2)
| Publication Number | Publication Date |
|---|---|
| EP0809194A2 true EP0809194A2 (de) | 1997-11-26 |
| EP0809194A3 EP0809194A3 (de) | 1998-10-07 |
Family
ID=21764408
Family Applications (1)
| Application Number | Title | Priority Date | Filing Date |
|---|---|---|---|
| EP97301892A Withdrawn EP0809194A3 (de) | 1996-03-28 | 1997-03-20 | Universeller Schmalbandsignalgestalter |
Country Status (3)
| Country | Link |
|---|---|
| US (1) | US5912829A (de) |
| EP (1) | EP0809194A3 (de) |
| CA (1) | CA2200940A1 (de) |
Cited By (2)
| Publication number | Priority date | Publication date | Assignee | Title |
|---|---|---|---|---|
| WO2003079219A1 (en) * | 2002-03-20 | 2003-09-25 | Tropic Networks Inc. | Method and apparatus to reduce the comlexity of the calculation of the fast fourier transform of a signal containing tones |
| US6732058B2 (en) | 2002-03-20 | 2004-05-04 | Tropic Networks Inc. | Method and apparatus for computation reduction for tone detection |
Families Citing this family (9)
| Publication number | Priority date | Publication date | Assignee | Title |
|---|---|---|---|---|
| DE4420348C1 (de) * | 1994-06-01 | 1995-09-21 | Siemens Ag | Verfahren zum Ermitteln von harmonischen Oberschwingungen zu einer Grundschwingung eines elektrischen Signals |
| JP4562051B2 (ja) * | 1999-11-30 | 2010-10-13 | 独立行政法人産業技術総合研究所 | 損耗センサ付き切削工具の信号処理装置および信号処理方法 |
| US6604056B2 (en) * | 2001-02-01 | 2003-08-05 | Drs Power & Control Technologies, Inc. | Method and system of harmonic regulation |
| GB2384876A (en) * | 2002-01-31 | 2003-08-06 | Zarlink Semiconductor Inc | Simplifying a real fast Fourier transform using symmetry |
| US7199844B2 (en) * | 2002-05-28 | 2007-04-03 | Rfstream Corporation | Quadratic nyquist slope filter |
| US7548819B2 (en) * | 2004-02-27 | 2009-06-16 | Ultra Electronics Limited | Signal measurement and processing method and apparatus |
| CN101499987B (zh) * | 2008-02-02 | 2012-03-14 | 卓胜微电子(上海)有限公司 | 低复杂度通用时频变换实现方法及装置 |
| EP2370971B1 (de) * | 2008-12-30 | 2013-03-20 | Arcelik Anonim Sirketi | Audiogerät und signalverarbeitungsverfahren dafür |
| US10007017B2 (en) | 2014-11-14 | 2018-06-26 | Ultra Electronics Limited | Sensor core and sensor |
Family Cites Families (4)
| Publication number | Priority date | Publication date | Assignee | Title |
|---|---|---|---|---|
| US3754128A (en) * | 1971-08-31 | 1973-08-21 | M Corinthios | High speed signal processor for vector transformation |
| JPS60117976A (ja) * | 1983-11-30 | 1985-06-25 | Hitachi Ltd | サンプリングパルス発生装置 |
| EP0173243B1 (de) * | 1984-08-28 | 1991-01-16 | Hewlett-Packard Company | Vorrichtung zur Messung der Geschwindigkeit eines Stromes von Teilchen |
| CH682783A5 (de) * | 1991-09-24 | 1993-11-15 | Alcatel Str Ag | Verfahren zur Pegelbestimmung bei vorbestimmten Frequenzen eines Tonfrequenzsignales. |
-
1997
- 1997-03-20 EP EP97301892A patent/EP0809194A3/de not_active Withdrawn
- 1997-03-25 CA CA002200940A patent/CA2200940A1/en not_active Abandoned
- 1997-03-25 US US08/823,501 patent/US5912829A/en not_active Expired - Lifetime
Cited By (2)
| Publication number | Priority date | Publication date | Assignee | Title |
|---|---|---|---|---|
| WO2003079219A1 (en) * | 2002-03-20 | 2003-09-25 | Tropic Networks Inc. | Method and apparatus to reduce the comlexity of the calculation of the fast fourier transform of a signal containing tones |
| US6732058B2 (en) | 2002-03-20 | 2004-05-04 | Tropic Networks Inc. | Method and apparatus for computation reduction for tone detection |
Also Published As
| Publication number | Publication date |
|---|---|
| US5912829A (en) | 1999-06-15 |
| EP0809194A3 (de) | 1998-10-07 |
| CA2200940A1 (en) | 1997-09-28 |
Similar Documents
| Publication | Publication Date | Title |
|---|---|---|
| US5912829A (en) | Universal narrow band signal conditioner | |
| Fessler et al. | Nonuniform fast Fourier transforms using min-max interpolation | |
| Cook III et al. | Digital filtering: Background and tutorial for psychophysiologists | |
| EP0672997B1 (de) | Vorrichtung und Methode zur Positionsbestimmung | |
| Veronesi et al. | Nearfield acoustic holography (NAH) II. Holographic reconstruction algorithms and computer implementation | |
| US4660151A (en) | Multicomponent quantitative analytical method and apparatus | |
| JPS60152278A (ja) | 交直両用電動機のための速度検知方法および装置 | |
| Sundin et al. | Accurate quantification of 1H spectra: from finite impulse response filter design for solvent suppression to parameter estimation | |
| US4983906A (en) | Frequency estimation system | |
| Dudgeon | The computation of two-dimensional cepstra | |
| CN111631707A (zh) | 心电信号中基线漂移的滤除方法、装置、设备及存储介质 | |
| KR100911685B1 (ko) | 코히어런트하지 않게 샘플링된 데이타의 파워 스펙트럼을측정하기 위한 저누설 방법 | |
| Lindner | Singular behavior of the solution to the stochastic heat equation on a polygonal domain | |
| Pižeta | Deconvolution of non-resolved voltammetric signals | |
| Douglas et al. | Operator theory and algebraic geometry | |
| Havlicek et al. | Discrete quasi-eigenfunction approximation for am-fm image analysis | |
| Hawkins | FFT interpolation for arbitrary factors: a comparison to cubic spline interpolation and linear interpolation | |
| Beylkin | On applications of unequally spaced fast Fourier transform | |
| Scheeren et al. | A software package for the orthogonal polynomial approximation of analytical signals, including a simulation program for chromatograms and spectra | |
| Juhola | The effect of digital lowpass filters on the maximum velocity of saccadic eye movements | |
| Marco et al. | Improved multiexponential transient spectroscopy by iterative deconvolution | |
| Mann et al. | The use of Fourier deconvolution to correct for instrument slit function differences in measured spectra | |
| Hyslop et al. | Four-dimensional spectral-spatial imaging using projection reconstruction | |
| Kryzhniy | High-resolution exponential analysis via regularized numerical inversion of Laplace transforms | |
| Saad et al. | Time delay estimates of FMRI signals: efficient algorithm and estimate variance |
Legal Events
| Date | Code | Title | Description |
|---|---|---|---|
| PUAI | Public reference made under article 153(3) epc to a published international application that has entered the european phase |
Free format text: ORIGINAL CODE: 0009012 |
|
| AK | Designated contracting states |
Kind code of ref document: A2 Designated state(s): DE FR GB |
|
| PUAL | Search report despatched |
Free format text: ORIGINAL CODE: 0009013 |
|
| AK | Designated contracting states |
Kind code of ref document: A3 Designated state(s): DE FR GB |
|
| 17P | Request for examination filed |
Effective date: 19990126 |
|
| 17Q | First examination report despatched |
Effective date: 20040615 |
|
| STAA | Information on the status of an ep patent application or granted ep patent |
Free format text: STATUS: THE APPLICATION IS DEEMED TO BE WITHDRAWN |
|
| 18D | Application deemed to be withdrawn |
Effective date: 20041026 |