EP0673155A2 - Data correction subsystem and method for image processing - Google Patents
Data correction subsystem and method for image processing Download PDFInfo
- Publication number
- EP0673155A2 EP0673155A2 EP95301675A EP95301675A EP0673155A2 EP 0673155 A2 EP0673155 A2 EP 0673155A2 EP 95301675 A EP95301675 A EP 95301675A EP 95301675 A EP95301675 A EP 95301675A EP 0673155 A2 EP0673155 A2 EP 0673155A2
- Authority
- EP
- European Patent Office
- Prior art keywords
- data
- image
- colour
- calibration
- calibration data
- Prior art date
- Legal status (The legal status is an assumption and is not a legal conclusion. Google has not performed a legal analysis and makes no representation as to the accuracy of the status listed.)
- Granted
Links
Images


Classifications
-
- H—ELECTRICITY
- H04—ELECTRIC COMMUNICATION TECHNIQUE
- H04N—PICTORIAL COMMUNICATION, e.g. TELEVISION
- H04N1/00—Scanning, transmission or reproduction of documents or the like, e.g. facsimile transmission; Details thereof
- H04N1/46—Colour picture communication systems
- H04N1/56—Processing of colour picture signals
- H04N1/60—Colour correction or control
- H04N1/603—Colour correction or control controlled by characteristics of the picture signal generator or the picture reproducer
- H04N1/6033—Colour correction or control controlled by characteristics of the picture signal generator or the picture reproducer using test pattern analysis
Definitions
- the present invention relates to a data correction subsystem and method for improving the grey density of an image processing system and in particular the grey density and colour reproduction of a colour image processing system, such as a computer image processing device, a copying device, or a facsimile transmission system.
- a colour image processing system such as a computer image processing device, a copying device, or a facsimile transmission system.
- a typical colour image processing system comprises an image reading device, such as an image scanner, for producing image data from an original image, a host computer for processing the image data, and a colour printer for printing out images in response to the processed image data.
- image reading device such as an image scanner
- host computer for processing the image data
- colour printer for printing out images in response to the processed image data.
- a major reason for this problem is the discrepancy between the input/output characteristic of the image reading device and the input/output characteristic of the printer. Specifically, a non-linear input characteristic is generally observed in any type of device. While the input characteristic of the image reading device is generally relatively linear, that of the printer is relatively non-linear. As a result, the grey density and colours of the original image are not faithfully reproduced. Further, the printer cannot produce the entire density range of the original image and, in particular, cannot reproduce extremely high density regions. This is also one of the causes of impaired grey density and colour reproduction.
- the present invention has been made in view of the above circumstances and has as an object to provide a data correction subsystem which allows faithful reproduction of an original image even if there is a discrepancy between the input/output characteristic of an image reading device and that of a printer in a colour image processing system.
- Another object of the invention is to provide a data correction subsystem which allows faithful reproduction of an original image even if the printable density range is limited in the data correction subsystem.
- Still another object of the invention is to provide a simple processing procedure for executing data correction processing using a computer.
- Yet another object of the invention is to provide a colour image processing system having a flexible configuration.
- the invention provides a data correction subsystem for an image processing system having an image reading device and an image printing device is provided, the data correction subsystem being characterised by comprising: transmitting means for transmitting a chart file to the printing device so that the printing device produces a sample chart; calibration data calculation means for calculating calibration data from read sample data so that the read sample data can be corrected to corresponding data in the chart file, the read sample data being obtained by causing the reading device to read the sample chart; and calibration means for correcting printing data transmitted to the printing device using the calibration data.
- the calibration data includes ⁇ calibration data for correcting grey density and colour calibration data for correcting a colour.
- the y calibration data is, e.g., a conversion table for converting an inputted grey density value to another density value and outputting the converted density value.
- the colour calibration data is, e.g., a 3x3 matrix filter by which three primary colour components that indicate a colour are multiplied.
- a printing data is subjected first to grey density correction with the ⁇ calibration data and then to colour correction with the colour calibration data.
- the image processing system is a colour image processing system constructed of a colour printing device, a colour image reading device, and a computer.
- the calibration means is disposed within the reading device so that correction is made only to image data produced by the reading device.
- the system may be modified such that all data to be sent to the printing device can be corrected, whether or not the data is the image data produced by the reading device, by providing the calibration means within the computer.
- calibration data respectively dedicated to such a plurality of usable types of printing devices may be calculated and saved in advance, so that calibration data to be used for correction may be selected in accordance with the type of printing devices actually used.
- the read sample data is subjected to normalisation processing to expand a grey density distribution region toward a higher density side. Then, a point of change in a density value is detected by scanning grey density values of the normalised read sample data. Conversion data for converting the grey density value of the read sample data at the detected point of change into a grey density value of the chart file data corresponding to the point of change is prepared, and the prepared conversion data is made into the ⁇ calibration data.
- the colour calibration data To calculate the colour calibration data, first, only colour data in the charge file is sampled from the read sample data, the colour data corresponding to a predetermined colour within a range of colours that can be outputted by the printing device. Then, a 3x3 matrix filter is used to minimise an error between the sampled colour data and the corresponding colour data in the chart file. Normalisation processing is thereafter executed to make lightness components with respect to the three primary colours of the calculated matrix filter equal to one another, and the thus normalised matrix filter is made the colour calibration data. It may be noted that better results could be obtained, in some cases, by sampling only colour data corresponding to a predetermined colour outside the range of colours that can be outputted by the printer in the aforementioned sampling operation.
- the system first gives a predetermined chart file to the printing device and prints out a sample chart described by the chart file.
- the sample chart reflects the input/output characteristic of the printing device.
- the sample chart is read by the reading device.
- Data obtained by causing the reading device to read the sample chart reflects the input/output characteristic of the reading device superimposed upon the input/output characteristic of the printing device (since the input/output characteristic of the reading device is almost linear, it is the input/output characteristic of the printing device that is substantially reflected).
- calibration data is calculated from the read data, the calibration data being such as to correct the read data to the original chart file data.
- the calibration data becomes conversion data that has a substantially inverse characteristic with respect to the input/output characteristic of the printing device.
- Printing data with thereafter be corrected using the calibration data, and the corrected data will then be sent to the printing device.
- the correction made by the calibration data cancels out the input/output characteristic of the printing device, which in turn allows an image having faithful colour and grey density reproduction to be printed out.
- the calibration data conforms to the input/out characteristic of a printing device that is actually used, the best correction specific to the printing device can be implemented.
- the calibration data is freely changed in accordance with the type of printing device.
- Some conventional examples e.g., Unexamined Japanese Patent Publications Nos. Hei. 3-76471 and Hei. 5-183740
- the subsystem of the invention can provide a higher degree of freedom in handling optimisation of correction and change of the printing device.
- the subsystem of the invention is characterised as using a printout obtained by giving data to a printing device, which means that the subsystem can cover all colours that are to be possibly printed without being limited by the colour range specified in the sample chart that has been prepared in advance.
- the subsystem of the invention is applicable to future printing devices.
- the subsystem of the invention may function as a measuring instrument that measures the ⁇ characteristic and colour correction coefficient of a printing device if the calculated calibration data is made usable independently of the calibration means.
- a system formed of a printing device, a reading device, and a computer such as an embodiment that will be described below can incorporate the calibration means in the reading device, in the computer, or in the printing device.
- the calibration means is located in the reading device, there is an advantage that printing device changes and computer application software changes that take place relatively frequently can be handled with ease.
- the calibration means is located in the computer, there are a plurality of advantages: printer changes can be handled with ease; application changes can be handled if located in the operating system of the computer; and data inputted through means other than the reading device can also be corrected.
- the third advantage is also provided when the calibration means is located in the printing device.
- the calibration means be located in a component other than the reading device in this type of system.
- a system that can use a plurality of types of printing devices selectively or concurrently can enjoy an advantage that the subsystem of the invention is freely applicable to any type of printer as long as calibration data dedicated to each of a plurality printers is saved in the system and appropriate calibration data is selected from the saved calibration data in accordance with the type of printing device actually used.
- ⁇ calibration data for grey density correction and colour calibration data for colour correction are prepared as calibration data, and printing data is subjected first to grey density correction with the ⁇ calibration data, and then to colour correction with the colour calibration data, then satisfactory grey density and colour reproduction may, in some cases, be obtained only through relatively simple colour correction processing.
- conventionally known colour correction processing involves the three steps of: expanding the amount of data in the high density region by subjecting original data to luminance data conversion processing using a logarithmic conversion curve; colour-correcting the thus processed data using a 3x3 matrix filter; and correcting the grey density of the thus corrected data.
- the ⁇ calibration data has a conversion characteristic that is extremely close to the aforementioned logarithmic conversion curve. Therefore, only the grey density correction is enough to obtain the same effect as that provided by executing both the conventional luminance conversion processing and the grey density correction processing concurrently. Therefore, satisfactory grey density and colour reproduction that are substantially equivalent to that obtained by the conventional three-step processing can be obtained by the two step processing involving the grey density correction using the ⁇ calibration data and the colour correction processing using the 3x3 matrix filter.
- the ⁇ calibration data if the read sample data is subjected to normalisation processing that is designed to expand the grey density distribution range toward the high density side, then a dynamic range in the high density region in a reproduced image obtained by printing out the printing data is expanded, so that a reproduced image having a satisfactory appearance can be obtained.
- this invention provides a data correction method for an image processing system having an image reading device and an image printing device, comprising the steps of: transmitting a chart file to the printing device so that the printing device produces a sample chart; calculating calibration data from read sample data so that the read sample data can be corrected to corresponding data in the chart file, the read sample data being obtained by causing the reading device to read the sample chart; and correcting printing data to be transmitted to the printing device using the calibration data.
- this invention provides an image processing system, comprising: an image reading device; an image printing device; transmitting means for transmitting a chart file to the printing device so that the printing device produces a sample chart; calibration data calculation means for calculating calibration data from read sample data so that the read sample data can be corrected to corresponding data in the chart file, the read sample data being obtained by causing the reading device to read the sample chart; and calibration means for correcting printing data to be transmitted to the printing device using the calibration data.
- this invention provides an image processing method, comprising the steps of: printing a sample chart in accordance with a chart file; reading the chart file to produce first image data; comparing the first image data with the chart file; calculating calibration data in accordance with the comparison of the first image data with the chart file: reading an image to produce second image data; and correcting the second image data in accordance with the calibration data.
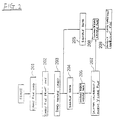
- Fig. 1 shows an exemplary configuration of a colour image processing system to which a data correction subsystem of the invention is applied.
- this system includes an image scanner 1, a host computer 3, and a colour printer 5.
- the image scanner 1 has the basic function of reading an original colour image to produce image data, and sending the image data to the host computer 3.
- the host computer 3 has the basic function of performing various operations corresponding to business applications with respect to the image data received from the image scanner 1 and outputting the thus processed image data to the colour printer 5.
- the colour printer 5 has the function of printing out a reproduced colour image based on the image data from the host computer 3.
- the image scanner 1 and the host computer 3 have some other functions including that of correcting the image data to improve reproduction of the grey density and colour of the original image.
- the correction operation (hereinafter referred to as "calibration") will be described in detail below.
- the calibration operation is roughly divided into two phases.
- the first phase although somewhat preliminary, forms the main part of the operation.
- a ⁇ curve table and a colour correction coefficient (a matrix filter), which are basic correction data, are calculated to prepare files corresponding to these data and the prepared files are saved in the system.
- the second phase (hereinafter referred to as the “calibration execution phase"), a regular data calibration operation is performed while a business application is being executed, i.e., image data produced by the scanner 1 when the scanner 1 reads an image is subjected to correction using the saved ⁇ curve table and colour correction coefficient.
- Fig. 1 also shows a general flow of the file preparation phase out of first and second phases. Further, Fig. 2 shows the processing flow thereof in the form of a flowchart.
- the file preparation phase starts with a chart file loading operation, step 201, in which the host computer 3 first loads a prestored, or externally inputted, chart file 31 to the main storage means thereof and then outputs the chart file 31 to the printer 5.
- the chart file 31 is an image data file specially designed for calibration, and represents a sample chart 51 (see Fig. 4) arranging standard samples of various grey densities and various colours.
- the printer 5 prints out the sample chart 51 upon reception of the chart file 31.
- a printout of the sample chart 51 exhibits impairment of grey density and colour reproduction attributable to a non-linear input/output characteristic inherent in the printer 5.
- step 203 the sample chart 51 is read by the scanner 1 and the read image data is fed back to the host computer 3.
- the fed-back image data 33 reflects a modification of the data as a result of an input/output characteristic of the scanner 1 being superimposed upon the input/output characteristic of the printer 5. It may be noted that in reality, the input/output characteristic of the scanner 1 is almost linear, and therefore what is substantially exhibited in the fed-back image data 33 is affected by the non-linear input/output characteristic of the printer 5 itself. Hence, the calibration for such image data will hereinafter be called the "printer calibration" in this sense.
- a comparison/editing process 35 is executed by the host computer 3. That is, in step 204 and 205 predetermined typical data is sampled from the fed-back image data 33 then in steps 206 and 208 the sampled data is compared with the corresponding data in the original chart data file 31 and edited and in steps 207 and 207 a ⁇ curve table and a colour correction coefficient are calculated to prepare files 37 and 39 respectively, hereinafter referred to as the " ⁇ curve file” and "colour correction coefficient file", respectively.
- These files 37 and 39 are not only saved in the host computer 3, but also are sent to the scanner 1.
- the scanner 1 saves both the ⁇ curve file 37 and the colour correction coefficient file 39.
- the file preparation phase is thus completed.
- the ⁇ curve file 37 is a data conversion table for performing the printer calibration operation with respect to grey density.
- the colour correction coefficient file 39 is a coefficient array consisting of a 3x3 dimensional matrix filter for performing the printer calibration operation with respect to colour.
- the scanner 1 effects the calibration execution phase using these files 37, 39 every time the scanner 1 reads an image, and sends the calibrated image data to the host computer 3.
- the content of this calibration operation substantially amounts to the inverse function of the input/output characteristic of the printer 5. Therefore, by sending the calibrated image data to the printer 5 to cause the printer to make a printout of the calibrated image data, the input/output characteristic of the printer 5 and the calibration content cancel each other out, thereby allowing a reproduced image having satisfactory grey density and colour reproduction to be printed out.
- this system is designed to save the calibration data files 37, 39 in the scanner 1 and to cause the scanner 1 to execute the printer calibration processing. Therefore, the host computer 3 and the printer 5 have nothing to do with the calibration processing while they are executing a business application program.
- this system provides an advantage that the host computer 3 is free to change business application programs.
- this system provides another advantage that the calibration processing is easily executed if the scanner 1 and the printer 5 are directly connected to each other to "emulate" a copying machine without interposing the host computer 3 therebetween. Still further, this system is ready to accommodate such possible needs as changing the type of the printer 5 or selecting a single printer out of a plurality of printers since the printer does not have to perform the printer calibration processing itself.
- calibration data files of all the types of printers that are possibly used are saved in the host computer 3 to allow the corresponding files to be loaded to the scanner 1 every time the printer type is changed, or if calibration data files of all the types of printers are saved in the scanner 1 in advance and the corresponding calibration data in the scanner 1 is specified and selected every time the printer type is changed.
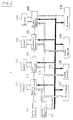
- a central processing unit 101 controls the entire part of the scanner 1 through an address bus 115.
- a density correction section 103, a colour correction section 104, an enlargement/reduction section 105, a binary processing section 106, a ROM section 107, an image memory 108, a motor driver 109, and an interface 110 are connected to the central processing unit 101 through the address bus 115 and a data bus 116.
- An image input section 102 generates image data from an input image by colour-separating the image into the three colour components red (R), green (G), and blue (B), while irradiating the image sent to the scanner 1 with a beam of light and receiving reflected light at an optical sensor such as an array of CCDs.
- the density correction section 103 receives the image data from the image input section 102 and subjects the received image data to density conversion.
- the density correction section 103 has a memory 111.
- the ⁇ curve file 37 sent from the host computer 3 through the interface 110 is saved in the memory 111.
- the density conversion processing is executed using the ⁇ curve file 37.
- the colour correction section 104 receives the density-corrected image data and subjects the received image data to colour correction.
- the colour correction section 104 has a memory 112.
- the colour correction coefficient file 39 sent from the host computer 3 through the interface 110 is saved in the memory 112.
- the colour correction processing is executed using the colour correction coefficient file 39.
- the enlargement/reduction section 105 receives the colour-corrected image data and subjects the received data to enlargement or reduction as the case may so require. Conversion data for executing this enlargement/reduction processing is stored in a memory 113.
- the binary processing section 106 receives the image data from the enlargement/reduction section 105 (e.g., 24-bit data) and converts the received image data into data consisting of a smaller number of bits as the case may so require. Conversion data for executing this conversion processing is saved in a memory 114.
- the image data from the enlargement/reduction section 105 e.g., 24-bit data
- Conversion data for executing this conversion processing is saved in a memory 114.
- the ROM section 107 stores programs including timing data of the whole unit, data for operating the central processing unit 101 by processing commands inputted from the interface 110, and the like. These programs are necessary for operating the central processing unit 101.
- the image memory 108 stores the image data processed by the density correction section 103, the colour correction section 104, the enlargement/reduction section 105, and the binary processing section 106, and holds such data until such data are outputted from the interface 110.
- the interface 110 is a communication interface with the host computer 3 and outputs image data, inputs commands, and inputs calibration data files, and the like.
- the scanner 1 upon reading the sample chart 51 in the file preparation phase, sends the read image data to the host computer 3 through the interface 110 without performing the operations at the density correction section 103 and the colour correction section 104.
- the scanner 1 stores the ⁇ curve file 37 in the memory 111 and the colour correction coefficient file 39 in the memory 112.
- the scanner 1 subjects the read image data to processing at the density correction section 103 and the colour correction section 104, and then either sends the thus processed image data to the host computer 3 or directly to the printer 5 through the interface 110.
- the memories 108, 111, 112, 113 and 114 are shown as discrete elements, but could be combined in a single memory device if desired.
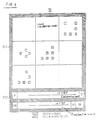
- Fig. 4 shows a configuration of the sample chart 51 that is printed out by the printer 4 at the initial stage of this phase.
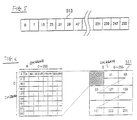
- This chart 51 includes a colour calibration chart 511 for calculating the colour correction coefficient and a ⁇ calibration chart 513, also called a "grey scale” for calculating the ⁇ curve table.
- the ⁇ calibration chart 513 is an array of rectangular regions (each being hereinafter referred to as a "batch") extending in a single direction. These batches are printed in 33 tones (0, 7, 15, ..., 239, 247, 255) selected as every eighth tone across the total tone range (0 to 255) of grey, where the tones of R, G. and B are the same. It may be noted that this grey scale 513 is arranged in two rows to save space in the printed sample chart 51.
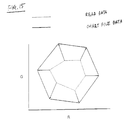
- the colour calibration chart 511 is divided into 9 large square regions, and as shown in detail in Fig. 6, each large square region is further divided into 81 small square regions (each small square region being hereinafter referred to as a "batch").
- the B component is changed in 9 tones selected as every thirty second tone (0, 31, ..., 223, 225) across the total tone range.
- the R component and the G component are also changed in 9 tones selected as every thirty second tone (0, 31, ..., 223, 225) across the total tone range in the horizontal direction and in the vertical direction, respectively. Therefore, the colour calibration chart 511 is constructed of a total of 729 colour batches.
- the thus constructed sample chart 51 is read by the scanner 1 to produce image data, and the image data is sent to the host computer 3.
- the host computer 3 then calculates the ⁇ curve table and the colour correction coefficient from the image data. In this case, the ⁇ curve table is calculated first, and the colour correction coefficient is calculated thereafter.
- Figs. 7 and 8 are graphical representations of the ⁇ curve table.
- the scanner 1 To provide an ideal grey density reproduction of a printed-out reproduced image by having the ⁇ characteristic curve of the printer 5 corrected by the scanner 1, what is required is only that the scanner 1 have a printer calibration ⁇ curve such as shown in Fig. 8 (an inverse function of the printer ⁇ characteristic curve shown in Fig. 7) as an input/output characteristic thereof. It is the ⁇ curve table that intentionally imparts this printer calibration ⁇ curve to the input/output characteristic of the scanner 1. That is, the ⁇ curve table is a description of the correspondence between inputs and outputs as shown in Fig. 14.
- Fig. 9 shows in detail a flow of the processing of calculating the printer calibration ⁇ curve table to be executed by the host computer 3. It may be noted that in Fig. 9 the same steps as in the general flow shown in Fig. 2 are denoted by the same reference numbers.
- step 204 data in the ⁇ calibration chart 513 is sampled from the image data in the sample chart 51 inputted from the scanner.
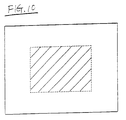
- the term "sampling" is intended to mean that data in a predetermined central region of each batch, the hatched region as shown in Fig. 10, is picked up. As a result of this sampling operation, data for as much as 33 tones is obtained. Since data at each tone consists of the three components R, G, B, a total of 99 pieces of data are obtained.
- step 301 final data for 256 tones is prepared by interpolating data between each two adjacent pieces of data sampled every 8 tones.
- the data interpolation can be carried out by an ordinary linear interpolation method.
- An example of how data interpolation is effected is shown in Fig. 11. As shown in Fig. 11, based on the RGB data of a sampled tone and that of the sampled tone next to said sampled tone, the RGB data for the 7 tones present between the two sampled tones are calculated by the linear interpolation method.
- normalisation processing with respect to the data for 256 tones is then executed in Step 302.
- Figs. 12 are a graphical representation of this normalisation processing.
- the curve indicated by the solid line on the graph of Fig. 12A represents the printer ⁇ characteristic curve, the aforementioned data for 256 tones.
- One of the features of the ⁇ characteristic curve is that tones close to tone 0 (pure black) and tones close to tone 256 (pure white) cannot be outputted. In other words, regions close to pure black and pure white cannot be printed.
- the normalisation processing modifies the printer ⁇ characteristic curve (the data for 256 tones) as if the region close to pure black within the regions that cannot be outputted could be outputted. That is, the curve indicated by the solid line on the graph of Fig. 12A is modified into a curve indicted by the broken line so as to expand toward the high density (black) side.
- the finally obtained printer calibration ⁇ curve becomes the curve indicated by the broken line on the graph of Fig. 12B.
- the printer calibration ⁇ curve becomes the curve indicated by the solid line on the graph of Fig. 12B.
- This calibration ⁇ curve indicated by the solid line means that black is outputted throughout a region A that is close to pure black.
- the printer calibration ⁇ curve indicated by the broken line on the graph of Fig. 12B obtained through the normalisation processing gives output tones that change in accordance with input tones even in the input region A that is close to pure black.
- this normalisation processing is not designed to ensure the dynamic range with respect to a region close to pure white in the printer ⁇ characteristic curve, but to only leave such region as a region that cannot be outputted.
- the reason for this is that a region close to pure white, such as a highlighted portion in an original image, looks natural if left pure white (the background colour of the sheet in actuality) in a reproduced image thereof and, if tones are given to such region (dotted in actuality), such region looks rather unnatural with the dots too conspicuous.
- Figs. 13 and 14 show a specific example of the ⁇ table preparation processing.
- a specific operation is as follows. Data in each column of a read data table shown in Fig. 13 is scanned in the order of tone and, upon change of the tone to a higher level, the column of the corresponding tone in the chart file table is referenced as shown by the arrow. The level of the tone in the read data table and level of the tone in the reference chart file table at the time are written as the input value and the output value to the calibration ⁇ curve table such as shown in Fig. 14. This operation is continued until the read data table is scanned to the last column thereof. Accordingly, the calibration ⁇ curve table shown in Fig. 14 can be prepared efficiently.
- This calibration ⁇ curve table makes up the calibration ⁇ file 37 and is not only saved in the host computer 3, but also sent to the scanner 1 so as to be saved in the memory 111 within the scanner 1.
- the colour correction coefficient is in the form of the following 3x3 matrix filter.
- Fig. 15 is a graphical representation of a colour correction coefficient in this system. It may be noted that two colour components, R and G, are indicated on a two-dimensional plane and the colour component B is omitted to simplify Fig. 15.
- the solid line indicates data in the colour calibration chart in the chart file 31, and the broken line indicates read data in the chart file 31 (i.e., data that has been modified by the input/output characteristic of the printer).
- the colour correction coefficient is calculated so that the function of recovering the read data indicated by the broken line to the colour calibration chart data indicated by the solid line can be performed. Therefore, when the scanner 1 calibrates the data obtained by reading an original image using this colour correction coefficient, a reproduced image having colours of the original image extremely faithfully reproduced by be obtained with the effect of the calibration and the input/output characteristic of the printer cancelling each other out.
- Fig. 16 shows a flow chart of the process of calculating a colour correction coefficient performed by the host computer 3. It may be noted that in Fig. 16, the same steps as those in Fig. 2 are denoted by the same reference numerals.
- the feature common to these 21 colours is that the tones range from 63 to 191.
- This range is determined by reference the aforementioned calibration ⁇ curve table or ⁇ curve file 37 so as to be within the range of tones that can be outputted by the printer 5. That is, data is sampled from the range of tones that can be outputted by the printer 5.
- the reason therefor is to allow faithful colour reproduction to be implemented within the range of tones that can be outputted by the printer 5.
- emphasis is placed on improving grey density and colour reproduction of half tones, not the primary colours (which are out of the range of tones that can be outputted by the printer 5).
- satisfactory grey density and colour reproduction can be ensured for an original image such as an ordinary photograph in which there are many half tone colours.
- the aforementioned sampling operation extracts data only in the central portion of the batch, as shown in Fig. 10, out of the read data for the 21 colours. A total of 63 pieces of data are sampled since each of the 21 colours includes the 3 colour components R, G and B.
- step 401 the sampled read data is subjected to ⁇ characteristic calibration using the previously obtained ⁇ curve table from Step 207.
- a colour correction coefficient is thereafter calculated in Step 402 from the ⁇ -calibrated read data.
- the colour correction coefficient is calculated in the following way using the least-squares method so that error between the colour calibration chart data in the chart file 31 and the corresponding read data is minimised.
- the colour correction coefficient is determined so that an average square error between both data for each of the R, G, B components, i.e.. is minimised.
- the coefficient is determined by solving the following equation.
- ⁇ is the abbreviation of and Rs, Gs, Bs, Rg, Gg, and Bg are the abbreviations of Rsi, Gsi, Bsi, Rgi, Ggi, and Bgi, respectively.
- the colour correction coefficient can be calculated by executing the following arithmetic operation.
- "-1" is the inverse matrix and "T” is the transposed matrix.
- the thus calculated colour correction coefficient is called a temporary colour correction coefficient.
- This temporary colour correction coefficient is subjected to normalisation processing in Step 403.
- each of coefficients kr, kg, kb of the column k is divided by the sum of the column k (kr + kg + kb)
- each of coefficients lr, lg, lb of the column 1 is divided by the sum of the column 1 (lr + lg + lb)
- each of coefficients mr, mg, mb of the column m is divided by the sum of the column m (mr + mg + mb).
- This normalisation processing provides an advantage that grey balance is not lost. That is, in the case where the read data indicating grey (R, G, B have the same tone) is multiplied by the colour correction coefficient (see Eq. 2), if the temporary colour correction coefficient is used without normalisation, then the data after the multiplication is such that R, G, B have different tone levels since the sums of the respective columns (lightness component) are usually different from one another. This means that the read data after such multiplication exhibits a colour other than grey (achromatic colour). In contrast thereto. if the normalised colour correction coefficient is used, the read data after multiplication exhibits grey since the sums of the respective columns are equal to 1, thereby allowing grey balance to be maintained.
- the thus normalised colour correction coefficient is not only saved in the host computer 3 as the final colour correction coefficient file 39, but also sent to the scanner 1 to be saved in the memory 112 within the scanner 1.
- the invention is not limited thereto, but may be embodied in various other modes without departing from the scope and spirit thereof.
- the invention may be embodied in copying machines and facsimile communication systems.
- the invention may be embodied for non-colour machines instead of the colour machines described above.
- the invention is characterised as obtaining satisfactory grey density and colour reproduction even if there is a discrepancy in input/output characteristic between an image reading device and a printing device in a colour image processing system.
- a single autonomously functioning system can be formed only of the image reading device and the printing device themselves thereafter, which is highly useful as well as applicable to a variety of fields.
- This invention provides a data correction method for a colour image processing system having a colour image reading device and a colour image printing device, comprising the steps of: transmitting a chart file to the printing device so that the printing device produces a sample chart; calculating calibration data from read sample data so that the read sample data can be corrected to corresponding data in the chart file, the read sample data being obtained by causing the reading device to read the sample chart; and correcting printing data to be transmitted to the printing device using the calibration data.
- This invention provides an image processing system, comprising: a colour image reading device; a colour image printing device; transmitting means for transmitting a chart file to the printing device so that the printing device produces a sample chart; calibration data calculation means for calculating calibration data from read sample data so that the read sample data can be corrected to corresponding data in the chart file, the read sample data being obtained by causing the reading device to read the sample chart; and calibration means for correcting printing data to be transmitted to the printing device using the calibration data.
- This invention provides a data correction subsystem for an image processing system having an image reading device and an image printing device, the data correction subsystem comprising: means for transmitting a chart file to the printing device such that the printing device produces a sample chart; means for comparing first image data with the chart file, the first image data being produced by the image reading device upon a reading of the sample chart by the image reading device; means for calculating calibration data in accordance with the comparison of the first image data with the chart file; and means for transmitting the calibration data to the image reading device so that second image data produced by the image reading device upon a reading of an image by the image reading device is corrected in accordance with the calibration data.
- This invention provides a data correction method for an image processing system having an image reading device and an image printing device, the data correction method comprising the steps of: transmitting a chart file to the printing device such that the printing device produces a sample chart; comparing first image data with the chart file, the first image data being produced by the image reading device upon a reading of the sample chart by the image reading device; calculating calibration data in accordance with the comparison of the first image data with the chart file; and transmitting the calibration data to the image reading device so that second image data produced by the image reading device upon a reading of an image by the image reading device is corrected in accordance with the calibration data.
- This invention provides an image processing method, comprising the steps of: printing a sample chart in accordance with a chart file; reading the chart file to produce first image data; comparing the first image data with the chart file; calculating calibration data in accordance with the comparison of the first image data with the chart file; reading an image to produce second image data; and correcting the second image data in accordance with the calibration data.
Landscapes
- Engineering & Computer Science (AREA)
- Multimedia (AREA)
- Signal Processing (AREA)
- Color Image Communication Systems (AREA)
- Facsimile Image Signal Circuits (AREA)
- Image Processing (AREA)
- Color, Gradation (AREA)
Abstract
Description
- The present invention relates to a data correction subsystem and method for improving the grey density of an image processing system and in particular the grey density and colour reproduction of a colour image processing system, such as a computer image processing device, a copying device, or a facsimile transmission system.
- A typical colour image processing system comprises an image reading device, such as an image scanner, for producing image data from an original image, a host computer for processing the image data, and a colour printer for printing out images in response to the processed image data. One of the problems encountered by such a system is that the grey density and colour of the original image are not faithfully reproduced.
- A major reason for this problem is the discrepancy between the input/output characteristic of the image reading device and the input/output characteristic of the printer. Specifically, a non-linear input characteristic is generally observed in any type of device. While the input characteristic of the image reading device is generally relatively linear, that of the printer is relatively non-linear. As a result, the grey density and colours of the original image are not faithfully reproduced. Further, the printer cannot produce the entire density range of the original image and, in particular, cannot reproduce extremely high density regions. This is also one of the causes of impaired grey density and colour reproduction.
- The present invention has been made in view of the above circumstances and has as an object to provide a data correction subsystem which allows faithful reproduction of an original image even if there is a discrepancy between the input/output characteristic of an image reading device and that of a printer in a colour image processing system.
- Another object of the invention is to provide a data correction subsystem which allows faithful reproduction of an original image even if the printable density range is limited in the data correction subsystem.
- Still another object of the invention is to provide a simple processing procedure for executing data correction processing using a computer.
- Yet another object of the invention is to provide a colour image processing system having a flexible configuration.
- Additional objects and advantages of the invention will be set forth in part in the description which follows and in parts will be obvious from the description, or may be learned by practice of the invention. The objects and advantages of the invention may be realised and attained by means of instrumentalities and combinations particularly pointed out in the appended claims.
- To achieve the objects and in accordance with the purpose of the invention, as embodied and broadly described herein. In a first embodiment, the invention provides a data correction subsystem for an image processing system having an image reading device and an image printing device is provided, the data correction subsystem being characterised by comprising: transmitting means for transmitting a chart file to the printing device so that the printing device produces a sample chart; calibration data calculation means for calculating calibration data from read sample data so that the read sample data can be corrected to corresponding data in the chart file, the read sample data being obtained by causing the reading device to read the sample chart; and calibration means for correcting printing data transmitted to the printing device using the calibration data.
- In a preferred embodiment, the calibration data includes γ calibration data for correcting grey density and colour calibration data for correcting a colour. The y calibration data is, e.g., a conversion table for converting an inputted grey density value to another density value and outputting the converted density value. The colour calibration data is, e.g., a 3x3 matrix filter by which three primary colour components that indicate a colour are multiplied. To correct printing data, a printing data is subjected first to grey density correction with the γ calibration data and then to colour correction with the colour calibration data.
- Preferably the image processing system is a colour image processing system constructed of a colour printing device, a colour image reading device, and a computer. Preferably, the calibration means is disposed within the reading device so that correction is made only to image data produced by the reading device. However, the system may be modified such that all data to be sent to the printing device can be corrected, whether or not the data is the image data produced by the reading device, by providing the calibration means within the computer. Further, in the case where a plurality of types of printing devices can be used selectively or concurrently as the printing device, calibration data respectively dedicated to such a plurality of usable types of printing devices may be calculated and saved in advance, so that calibration data to be used for correction may be selected in accordance with the type of printing devices actually used.
- To calculate the γ calibration data, first, the read sample data is subjected to normalisation processing to expand a grey density distribution region toward a higher density side. Then, a point of change in a density value is detected by scanning grey density values of the normalised read sample data. Conversion data for converting the grey density value of the read sample data at the detected point of change into a grey density value of the chart file data corresponding to the point of change is prepared, and the prepared conversion data is made into the γ calibration data.
- To calculate the colour calibration data, first, only colour data in the charge file is sampled from the read sample data, the colour data corresponding to a predetermined colour within a range of colours that can be outputted by the printing device. Then, a 3x3 matrix filter is used to minimise an error between the sampled colour data and the corresponding colour data in the chart file. Normalisation processing is thereafter executed to make lightness components with respect to the three primary colours of the calculated matrix filter equal to one another, and the thus normalised matrix filter is made the colour calibration data. It may be noted that better results could be obtained, in some cases, by sampling only colour data corresponding to a predetermined colour outside the range of colours that can be outputted by the printer in the aforementioned sampling operation.
- The system first gives a predetermined chart file to the printing device and prints out a sample chart described by the chart file. The sample chart reflects the input/output characteristic of the printing device. Then, the sample chart is read by the reading device. Data obtained by causing the reading device to read the sample chart reflects the input/output characteristic of the reading device superimposed upon the input/output characteristic of the printing device (since the input/output characteristic of the reading device is almost linear, it is the input/output characteristic of the printing device that is substantially reflected). Then, calibration data is calculated from the read data, the calibration data being such as to correct the read data to the original chart file data.
- In this way, the calibration data becomes conversion data that has a substantially inverse characteristic with respect to the input/output characteristic of the printing device. Printing data with thereafter be corrected using the calibration data, and the corrected data will then be sent to the printing device. As a result, the correction made by the calibration data cancels out the input/output characteristic of the printing device, which in turn allows an image having faithful colour and grey density reproduction to be printed out.
- Further, since the calibration data conforms to the input/out characteristic of a printing device that is actually used, the best correction specific to the printing device can be implemented. In addition, the calibration data is freely changed in accordance with the type of printing device. Some conventional examples (e.g., Unexamined Japanese Patent Publications Nos. Hei. 3-76471 and Hei. 5-183740) are designed so that appropriate calibration data is selected from a calibration data set prepared in a ROM in advance. However, compared with such conventional examples, the subsystem of the invention can provide a higher degree of freedom in handling optimisation of correction and change of the printing device. In addition, while the aforementioned two conventional examples employ the sample chart that has been prepared in advance, the subsystem of the invention is characterised as using a printout obtained by giving data to a printing device, which means that the subsystem can cover all colours that are to be possibly printed without being limited by the colour range specified in the sample chart that has been prepared in advance. Hence, the subsystem of the invention is applicable to future printing devices.
- Still further, the subsystem of the invention may function as a measuring instrument that measures the γ characteristic and colour correction coefficient of a printing device if the calculated calibration data is made usable independently of the calibration means.
- A system formed of a printing device, a reading device, and a computer such as an embodiment that will be described below can incorporate the calibration means in the reading device, in the computer, or in the printing device. If the calibration means is located in the reading device, there is an advantage that printing device changes and computer application software changes that take place relatively frequently can be handled with ease. On the other hand, if the calibration means is located in the computer, there are a plurality of advantages: printer changes can be handled with ease; application changes can be handled if located in the operating system of the computer; and data inputted through means other than the reading device can also be corrected. The third advantage is also provided when the calibration means is located in the printing device.
- Since a system that frequently prints out data inputted through means other than the image reading device connected thereto such as a copying machine and a facsimile transmission/reception system, each serving also as a printer, can particularly enjoy the aforementioned three advantages, it is preferred that the calibration means be located in a component other than the reading device in this type of system.
- A system that can use a plurality of types of printing devices selectively or concurrently can enjoy an advantage that the subsystem of the invention is freely applicable to any type of printer as long as calibration data dedicated to each of a plurality printers is saved in the system and appropriate calibration data is selected from the saved calibration data in accordance with the type of printing device actually used.
- In the subsystem of the invention, if γ calibration data for grey density correction and colour calibration data for colour correction are prepared as calibration data, and printing data is subjected first to grey density correction with the γ calibration data, and then to colour correction with the colour calibration data, then satisfactory grey density and colour reproduction may, in some cases, be obtained only through relatively simple colour correction processing. That is, conventionally known colour correction processing (e.g., Unexamined Japanese Patent Publication No. Hei. 5-122513) involves the three steps of: expanding the amount of data in the high density region by subjecting original data to luminance data conversion processing using a logarithmic conversion curve; colour-correcting the thus processed data using a 3x3 matrix filter; and correcting the grey density of the thus corrected data. However, when the grey density correction using the γ calibration data is performed first as described above, particularly in the case of a system using a printing device whose input/output characteristic is noticeably nonlinear (e.g., an ink jet printer), the γ calibration data has a conversion characteristic that is extremely close to the aforementioned logarithmic conversion curve. Therefore, only the grey density correction is enough to obtain the same effect as that provided by executing both the conventional luminance conversion processing and the grey density correction processing concurrently. Therefore, satisfactory grey density and colour reproduction that are substantially equivalent to that obtained by the conventional three-step processing can be obtained by the two step processing involving the grey density correction using the γ calibration data and the colour correction processing using the 3x3 matrix filter.
- In the case of calibration the γ calibration data, if the read sample data is subjected to normalisation processing that is designed to expand the grey density distribution range toward the high density side, then a dynamic range in the high density region in a reproduced image obtained by printing out the printing data is expanded, so that a reproduced image having a satisfactory appearance can be obtained.
- In the case of calculating the γ calibration data, if the steps of: first detecting a point of change in the density value by scanning the grey density values of read sample data; then preparing conversion data for converting the grey density values of the read sample data at the detected point of change into the grey density values of the corresponding chart file data; and making the prepared conversion data the γ calibration data, are performed, then this processing can actually be executed by such a simple operation as to reference the read sample data and the chart file stored in memory.
- In calculating the colour calibration data if only colour data in the chart file corresponding to colours within the range of colours that can be outputted by the printing device is sampled and calculated, then grey density and colour reproduction for half tone colours that can be outputted by the printing device improves, which in turn allows ordinary photographs consisting of many half tone colours to be reproduced faithfully. On the other hand, in the case of using data corresponding to colours outside the range of colours that can be outputted by the printing device by means of sampling, then the colours are corrected so as to be close to the primary colours. Therefore, this subsystem is suitably applied to cases where original images using many primary colours such as posters are to be reproduced clearly.
- In the case of using a 3x3 matrix filter as the colour calibration data, if such normalisation processing as to make the lightness components of the matrix filter equal to one another for the three colours is executed, then an advantage that grey balance is not lost in colour correction can be obtained.
- In a second embodiment, this invention provides a data correction method for an image processing system having an image reading device and an image printing device, comprising the steps of:
transmitting a chart file to the printing device so that the printing device produces a sample chart;
calculating calibration data from read sample data so that the read sample data can be corrected to corresponding data in the chart file, the read sample data being obtained by causing the reading device to read the sample chart; and
correcting printing data to be transmitted to the printing device using the calibration data. - In a third embodiment, this invention provides an image processing system, comprising:
an image reading device;
an image printing device;
transmitting means for transmitting a chart file to the printing device so that the printing device produces a sample chart;
calibration data calculation means for calculating calibration data from read sample data so that the read sample data can be corrected to corresponding data in the chart file, the read sample data being obtained by causing the reading device to read the sample chart; and
calibration means for correcting printing data to be transmitted to the printing device using the calibration data. - In a fourth embodiment, this invention provides an image processing method, comprising the steps of:
printing a sample chart in accordance with a chart file;
reading the chart file to produce first image data;
comparing the first image data with the chart file;
calculating calibration data in accordance with the comparison of the first image data with the chart file:
reading an image to produce second image data; and
correcting the second image data in accordance with the calibration data. - The accompanying drawings, which are incorporated in and constitute a part of this specification, illustrate exemplary embodiments of the invention and, together with the description, serve to explain the objects, advantages and principles of the invention. In the drawings:
- Fig. 1 is a block diagram of a colour image processing system to which a data correction subsystem of the invention is applied;
- Fig. 2 is a flowchart of a file preparation process;
- Fig. 3 is a block diagram of an image scanner;
- Fig. 4 is a diagram of a sample chart;
- Fig. 5 is a diagram of a γ calibration chart in the sample chart;
- Fig. 6 is a diagram of a colour calibration chart in the sample chart;
- Fig. 7 is a graph of an input/output characteristic of a printer;
- Fig. 8 is a graph of a printer calibration γ curve, an inverse function of the printer γ characteristic curve of Fig. 7;
- Fig. 9 is a flowchart of the process for calculating the printer calibration γ curve table;
- Fig. 10 is a diagram showing a position at which data is picked up from each batch of the sample chart;
- Fig. 11 is a diagram showing exemplary data interpolation based on a linear interpolation method effected during the γ curve table calculation process;
- Figs. 12A and 12B are a graphical representation of normalisation processing performed in the γ curve table calculation process;
- Fig. 13 is a table of read data and a table of chart file data after the read data and the chart file data have been subjected to normalisation processing, the tables being developed in a main memory;
- Fig. 14 is a calibration γ curve table;
- Fig. 15 is a graphical representation of a colour correction coefficient; and
- Fig. 16 is a flowchart showing a flow of the process for calculating the colour correction coefficient.
- Fig. 1 shows an exemplary configuration of a colour image processing system to which a data correction subsystem of the invention is applied.
- As shown in Fig. 1, this system includes an
image scanner 1, ahost computer 3, and acolour printer 5. Theimage scanner 1 has the basic function of reading an original colour image to produce image data, and sending the image data to thehost computer 3. Thehost computer 3 has the basic function of performing various operations corresponding to business applications with respect to the image data received from theimage scanner 1 and outputting the thus processed image data to thecolour printer 5. Thecolour printer 5 has the function of printing out a reproduced colour image based on the image data from thehost computer 3. - In addition to the aforementioned basic functions, the
image scanner 1 and thehost computer 3 have some other functions including that of correcting the image data to improve reproduction of the grey density and colour of the original image. The correction operation (hereinafter referred to as "calibration") will be described in detail below. - The calibration operation is roughly divided into two phases. The first phase, although somewhat preliminary, forms the main part of the operation. In the first phase (hereinafter referred to as the "file preparation phase"), a γ curve table and a colour correction coefficient (a matrix filter), which are basic correction data, are calculated to prepare files corresponding to these data and the prepared files are saved in the system. In the second phase (hereinafter referred to as the "calibration execution phase"), a regular data calibration operation is performed while a business application is being executed, i.e., image data produced by the
scanner 1 when thescanner 1 reads an image is subjected to correction using the saved γ curve table and colour correction coefficient. - Fig. 1 also shows a general flow of the file preparation phase out of first and second phases. Further, Fig. 2 shows the processing flow thereof in the form of a flowchart.
- As shown in fig. 2, the file preparation phase starts with a chart file loading operation,
step 201, in which thehost computer 3 first loads a prestored, or externally inputted,chart file 31 to the main storage means thereof and then outputs thechart file 31 to theprinter 5. Thechart file 31 is an image data file specially designed for calibration, and represents a sample chart 51 (see Fig. 4) arranging standard samples of various grey densities and various colours. In thenext step 202, theprinter 5 prints out thesample chart 51 upon reception of thechart file 31. A printout of thesample chart 51 exhibits impairment of grey density and colour reproduction attributable to a non-linear input/output characteristic inherent in theprinter 5. - Then, in
step 203, thesample chart 51 is read by thescanner 1 and the read image data is fed back to thehost computer 3. The fed-back image data 33 reflects a modification of the data as a result of an input/output characteristic of thescanner 1 being superimposed upon the input/output characteristic of theprinter 5. It may be noted that in reality, the input/output characteristic of thescanner 1 is almost linear, and therefore what is substantially exhibited in the fed-back image data 33 is affected by the non-linear input/output characteristic of theprinter 5 itself. Hence, the calibration for such image data will hereinafter be called the "printer calibration" in this sense. - Subsequently, a comparison/
editing process 35 is executed by thehost computer 3. That is, instep back image data 33 then insteps steps 207 and 207 a γ curve table and a colour correction coefficient are calculated to preparefiles files host computer 3, but also are sent to thescanner 1. Thescanner 1 saves both theγ curve file 37 and the colourcorrection coefficient file 39. The file preparation phase is thus completed. - The
γ curve file 37 is a data conversion table for performing the printer calibration operation with respect to grey density. The colourcorrection coefficient file 39 is a coefficient array consisting of a 3x3 dimensional matrix filter for performing the printer calibration operation with respect to colour. These two data files 37, 39 will hereinafter be referred to collectively as "calibration data files". These calibration data files have calibration contents substantially amounting to an inverse function of the input/output characteristic of theprinter 5. - Once the calibration data files 37, 39 have been saved in this way, the
scanner 1 effects the calibration execution phase using thesefiles scanner 1 reads an image, and sends the calibrated image data to thehost computer 3. As has already been described, the content of this calibration operation substantially amounts to the inverse function of the input/output characteristic of theprinter 5. Therefore, by sending the calibrated image data to theprinter 5 to cause the printer to make a printout of the calibrated image data, the input/output characteristic of theprinter 5 and the calibration content cancel each other out, thereby allowing a reproduced image having satisfactory grey density and colour reproduction to be printed out. - As described above, this system is designed to save the calibration data files 37, 39 in the
scanner 1 and to cause thescanner 1 to execute the printer calibration processing. Therefore, thehost computer 3 and theprinter 5 have nothing to do with the calibration processing while they are executing a business application program. As a result, this system provides an advantage that thehost computer 3 is free to change business application programs. Further, this system provides another advantage that the calibration processing is easily executed if thescanner 1 and theprinter 5 are directly connected to each other to "emulate" a copying machine without interposing thehost computer 3 therebetween. Still further, this system is ready to accommodate such possible needs as changing the type of theprinter 5 or selecting a single printer out of a plurality of printers since the printer does not have to perform the printer calibration processing itself. It may be noted that further improved flexibility can be provided if calibration data files of all the types of printers that are possibly used are saved in thehost computer 3 to allow the corresponding files to be loaded to thescanner 1 every time the printer type is changed, or if calibration data files of all the types of printers are saved in thescanner 1 in advance and the corresponding calibration data in thescanner 1 is specified and selected every time the printer type is changed. - A configuration of the
scanner 1 of this system will be described next with reference to the block diagram of Fig. 3. - As shown in Fig. 3, a
central processing unit 101 controls the entire part of thescanner 1 through anaddress bus 115. Adensity correction section 103, acolour correction section 104, an enlargement/reduction section 105, abinary processing section 106, aROM section 107, animage memory 108, amotor driver 109, and aninterface 110 are connected to thecentral processing unit 101 through theaddress bus 115 and adata bus 116. - An
image input section 102 generates image data from an input image by colour-separating the image into the three colour components red (R), green (G), and blue (B), while irradiating the image sent to thescanner 1 with a beam of light and receiving reflected light at an optical sensor such as an array of CCDs. - The
density correction section 103 receives the image data from theimage input section 102 and subjects the received image data to density conversion. Thedensity correction section 103 has a memory 111. Theγ curve file 37 sent from thehost computer 3 through theinterface 110 is saved in the memory 111. The density conversion processing is executed using theγ curve file 37. - The
colour correction section 104 receives the density-corrected image data and subjects the received image data to colour correction. Thecolour correction section 104 has amemory 112. The colourcorrection coefficient file 39 sent from thehost computer 3 through theinterface 110 is saved in thememory 112. The colour correction processing is executed using the colourcorrection coefficient file 39. - The enlargement/
reduction section 105 receives the colour-corrected image data and subjects the received data to enlargement or reduction as the case may so require. Conversion data for executing this enlargement/reduction processing is stored in amemory 113. - The
binary processing section 106 receives the image data from the enlargement/reduction section 105 (e.g., 24-bit data) and converts the received image data into data consisting of a smaller number of bits as the case may so require. Conversion data for executing this conversion processing is saved in amemory 114. - The
ROM section 107 stores programs including timing data of the whole unit, data for operating thecentral processing unit 101 by processing commands inputted from theinterface 110, and the like. These programs are necessary for operating thecentral processing unit 101. - The
image memory 108 stores the image data processed by thedensity correction section 103, thecolour correction section 104, the enlargement/reduction section 105, and thebinary processing section 106, and holds such data until such data are outputted from theinterface 110. - The
interface 110 is a communication interface with thehost computer 3 and outputs image data, inputs commands, and inputs calibration data files, and the like. - The
scanner 1, upon reading thesample chart 51 in the file preparation phase, sends the read image data to thehost computer 3 through theinterface 110 without performing the operations at thedensity correction section 103 and thecolour correction section 104. When the calibration data files 37, 39 have been sent from thehost computer 3, thescanner 1 stores theγ curve file 37 in the memory 111 and the colourcorrection coefficient file 39 in thememory 112. - On the other hand, in the calibration execution phase in which a business application is being executed, the
scanner 1 subjects the read image data to processing at thedensity correction section 103 and thecolour correction section 104, and then either sends the thus processed image data to thehost computer 3 or directly to theprinter 5 through theinterface 110. - The
memories - The foregoing is an overall description of the calibration operation performed by his system. The file preparation file, which forms the main part of the calibration operation, will now be described in detail.
- Fig. 4 shows a configuration of the
sample chart 51 that is printed out by theprinter 4 at the initial stage of this phase. Thischart 51 includes acolour calibration chart 511 for calculating the colour correction coefficient and aγ calibration chart 513, also called a "grey scale" for calculating the γ curve table. As shown in Fig. 5, theγ calibration chart 513 is an array of rectangular regions (each being hereinafter referred to as a "batch") extending in a single direction. These batches are printed in 33 tones (0, 7, 15, ..., 239, 247, 255) selected as every eighth tone across the total tone range (0 to 255) of grey, where the tones of R, G. and B are the same. It may be noted that thisgrey scale 513 is arranged in two rows to save space in the printedsample chart 51. - As shown in Fig. 5, the
colour calibration chart 511 is divided into 9 large square regions, and as shown in detail in Fig. 6, each large square region is further divided into 81 small square regions (each small square region being hereinafter referred to as a "batch"). in each of the 9 large square regions, the B component is changed in 9 tones selected as every thirty second tone (0, 31, ..., 223, 225) across the total tone range. In each large square region, the R component and the G component are also changed in 9 tones selected as every thirty second tone (0, 31, ..., 223, 225) across the total tone range in the horizontal direction and in the vertical direction, respectively. Therefore, thecolour calibration chart 511 is constructed of a total of 729 colour batches. - The thus constructed
sample chart 51 is read by thescanner 1 to produce image data, and the image data is sent to thehost computer 3. Thehost computer 3 then calculates the γ curve table and the colour correction coefficient from the image data. In this case, the γ curve table is calculated first, and the colour correction coefficient is calculated thereafter. - The procedure for calculating the γ curve table will be described in detail below.
- Figs. 7 and 8 are graphical representations of the γ curve table. Fig. 7 shows an input/output characteristic of the
printer 5. While the input/output characteristic of theprinter 5 more or less varies depending on the components R, G, B, there is a common tendency that the input/output characteristic of theprinter 5 exhibits a non-linear characteristic curving toward the low output side with respect to a linear characteristic (Y = X). This curve is generally called a γ characteristic curve. - To provide an ideal grey density reproduction of a printed-out reproduced image by having the γ characteristic curve of the
printer 5 corrected by thescanner 1, what is required is only that thescanner 1 have a printer calibration γ curve such as shown in Fig. 8 (an inverse function of the printer γ characteristic curve shown in Fig. 7) as an input/output characteristic thereof. It is the γ curve table that intentionally imparts this printer calibration γ curve to the input/output characteristic of thescanner 1. That is, the γ curve table is a description of the correspondence between inputs and outputs as shown in Fig. 14. - Fig. 9 shows in detail a flow of the processing of calculating the printer calibration γ curve table to be executed by the
host computer 3. It may be noted that in Fig. 9 the same steps as in the general flow shown in Fig. 2 are denoted by the same reference numbers. - First, in
step 204, data in theγ calibration chart 513 is sampled from the image data in thesample chart 51 inputted from the scanner. The term "sampling" is intended to mean that data in a predetermined central region of each batch, the hatched region as shown in Fig. 10, is picked up. As a result of this sampling operation, data for as much as 33 tones is obtained. Since data at each tone consists of the three components R, G, B, a total of 99 pieces of data are obtained. - Then, in
step 301, final data for 256 tones is prepared by interpolating data between each two adjacent pieces of data sampled every 8 tones. The data interpolation can be carried out by an ordinary linear interpolation method. An example of how data interpolation is effected is shown in Fig. 11. As shown in Fig. 11, based on the RGB data of a sampled tone and that of the sampled tone next to said sampled tone, the RGB data for the 7 tones present between the two sampled tones are calculated by the linear interpolation method. After the data for 256 tones has been obtained in this way, normalisation processing with respect to the data for 256 tones is then executed inStep 302. - Figs. 12 are a graphical representation of this normalisation processing. The curve indicated by the solid line on the graph of Fig. 12A represents the printer γ characteristic curve, the aforementioned data for 256 tones. One of the features of the γ characteristic curve is that tones close to tone 0 (pure black) and tones close to tone 256 (pure white) cannot be outputted. In other words, regions close to pure black and pure white cannot be printed. The normalisation processing modifies the printer γ characteristic curve (the data for 256 tones) as if the region close to pure black within the regions that cannot be outputted could be outputted. That is, the curve indicated by the solid line on the graph of Fig. 12A is modified into a curve indicted by the broken line so as to expand toward the high density (black) side.
- As a result of the modification made by the normalisation processing, the finally obtained printer calibration γ curve becomes the curve indicated by the broken line on the graph of Fig. 12B. If the normalisation processing is not executed, the printer calibration γ curve becomes the curve indicated by the solid line on the graph of Fig. 12B. This calibration γ curve indicated by the solid line means that black is outputted throughout a region A that is close to pure black. In contrast, the printer calibration γ curve indicated by the broken line on the graph of Fig. 12B obtained through the normalisation processing gives output tones that change in accordance with input tones even in the input region A that is close to pure black. As a result, when the data thus calibrated by this γ curve indicated by the broken line on the graph of Fig. 12B is printed out by the printer, a change in tones close to pure black in an original image can be reproduced as a change in tones close to the black side edge of the printable tone range. That is, the dynamic range close to the pure black region can be ensured. Accordingly, an unnatural solid black region is no longer present in a reproduced image, thereby allowing a natural reproduced image to be obtained.
- On the other hand, this normalisation processing is not designed to ensure the dynamic range with respect to a region close to pure white in the printer γ characteristic curve, but to only leave such region as a region that cannot be outputted. The reason for this is that a region close to pure white, such as a highlighted portion in an original image, looks natural if left pure white (the background colour of the sheet in actuality) in a reproduced image thereof and, if tones are given to such region (dotted in actuality), such region looks rather unnatural with the dots too conspicuous.
- This normalisation processing is executed using, e.g., the following operation expression for the respective RGB data:

where X' is the normalised data, X is the data before being normalised, Min is the minimum value of the data before being normalised, and Max is the maximum value of the data before being normalised. - After the normalisation processing, the grey scale data in the chart file 31 (meaning the Y = X linear characteristic) is loaded to the main memory in
Step 303, and inStep 304 the chart file data is referenced to the previously normalised read data so that acalibration γ file 37 is prepared. - Figs. 13 and 14 show a specific example of the γ table preparation processing. Fig. 13 schematically shows a table of normalised read data and a table of chart file data (Y = X) in upper and lower sides, respectively, where both data are developed in the main memory.
- The γ table preparation processing is designed to reverse the read data with Y = X as the central axis. A specific operation is as follows. Data in each column of a read data table shown in Fig. 13 is scanned in the order of tone and, upon change of the tone to a higher level, the column of the corresponding tone in the chart file table is referenced as shown by the arrow. The level of the tone in the read data table and level of the tone in the reference chart file table at the time are written as the input value and the output value to the calibration γ curve table such as shown in Fig. 14. This operation is continued until the read data table is scanned to the last column thereof. Accordingly, the calibration γ curve table shown in Fig. 14 can be prepared efficiently. This calibration γ curve table makes up the
calibration γ file 37 and is not only saved in thehost computer 3, but also sent to thescanner 1 so as to be saved in the memory 111 within thescanner 1. - The operation of calculating a colour
correction coefficient file 39 will be described next. The colour correction coefficient is in the form of the following 3x3 matrix filter.
- Defining data before passing through this matrix filter as Rn, Gn, Bn and data after passing therethrough as Rm, Gm, Bm, then

is given. - Fig. 15 is a graphical representation of a colour correction coefficient in this system. It may be noted that two colour components, R and G, are indicated on a two-dimensional plane and the colour component B is omitted to simplify Fig. 15. In Fig. 15, the solid line indicates data in the colour calibration chart in the
chart file 31, and the broken line indicates read data in the chart file 31 (i.e., data that has been modified by the input/output characteristic of the printer). The colour correction coefficient is calculated so that the function of recovering the read data indicated by the broken line to the colour calibration chart data indicated by the solid line can be performed. Therefore, when thescanner 1 calibrates the data obtained by reading an original image using this colour correction coefficient, a reproduced image having colours of the original image extremely faithfully reproduced by be obtained with the effect of the calibration and the input/output characteristic of the printer cancelling each other out. - Fig. 16 shows a flow chart of the process of calculating a colour correction coefficient performed by the
host computer 3. It may be noted that in Fig. 16, the same steps as those in Fig. 2 are denoted by the same reference numerals. - In Fig. 16, the following data for 21 colours is first sampled from the data obtained by reading the
colour calibration chart 511 in thesample chart 51 inStep 205. It may be noted that the position of each batch of these 21 colours in thesample chart 51 is indicated in Fig. 4.[TABLE 1] (R, G, B) (R, G, B) 1. ( 63, 63, 63) 11. (191, 63, 127) 2. (191, 63, 63) 12. (127, 127, 127) 3. (191, 127, 63) 13. (191, 127 127) 4. ( 63, 191, 63) 14. ( 63, 191, 127) 5. (127, 191, 63) 15. (127, 191, 127) 6. (191, 191, 63) 16. (191, 191, 127) 7. (191, 95, 95) 17. (191, 63, 191) 8. (127, 127, 95) 18. (191, 127, 191) 9. (223, 127, 95) 19. ( 63, 191, 191) 10. (191, 95, 95) 20. (127, 191, 191) 21. (191, 191, 191) - The feature common to these 21 colours is that the tones range from 63 to 191. This range is determined by reference the aforementioned calibration γ curve table or
γ curve file 37 so as to be within the range of tones that can be outputted by theprinter 5. That is, data is sampled from the range of tones that can be outputted by theprinter 5. The reason therefor is to allow faithful colour reproduction to be implemented within the range of tones that can be outputted by theprinter 5. In other words, emphasis is placed on improving grey density and colour reproduction of half tones, not the primary colours (which are out of the range of tones that can be outputted by the printer 5). As a result of this design, satisfactory grey density and colour reproduction can be ensured for an original image such as an ordinary photograph in which there are many half tone colours. - On the other hand, with respect to the original image such as an artificially depicted poster using many primary colours, there is a demand that the primary colours be reproduced as clearly as possible. To meet such a demand, it is necessary that data be sampled from regions close to the primary colours which is outside of the range of tones that can be outputted by the
printer 5. Therefore, if a mode that performs the operation of sampling data from outside of the range of tones that can be outputted by theprinter 5 is added to this embodiment, then two kinds of colour correction coefficients which satisfy the aforementioned two demands can be obtained, and these colour correction coefficients can be used in accordance with the application, thereby improving user-friendliness. - The aforementioned sampling operation extracts data only in the central portion of the batch, as shown in Fig. 10, out of the read data for the 21 colours. A total of 63 pieces of data are sampled since each of the 21 colours includes the 3 colour components R, G and B.
- Then, in
step 401, the sampled read data is subjected to γ characteristic calibration using the previously obtained γ curve table fromStep 207. A colour correction coefficient is thereafter calculated inStep 402 from the γ-calibrated read data. The colour correction coefficient is calculated in the following way using the least-squares method so that error between the colour calibration chart data in thechart file 31 and the corresponding read data is minimised. - If it is assumed that the read data for the 21 colours are defined as (Rgi, Ggi, Bgi) (i = 1, ..., 21) and that the corresponding data for the 21 colours in the chart file are defined as (Rsi, Gsi, Bsi) (i = 1, ..., 21), then the colour correction coefficient is determined so that an average square error between both data for each of the R, G, B components, i.e..

is minimised. - The coefficient is determined by solving the following equation.

where Σ is the abbreviation ofand Rs, Gs, Bs, Rg, Gg, and Bg are the abbreviations of Rsi, Gsi, Bsi, Rgi, Ggi, and Bgi, respectively.
- That is, the colour correction coefficient can be calculated by executing the following arithmetic operation.

where "-1" is the inverse matrix and "T" is the transposed matrix. - The thus calculated colour correction coefficient is called a temporary colour correction coefficient. This temporary colour correction coefficient is subjected to normalisation processing in
Step 403. The normalisation processing modifies the temporary colour correction coefficient so that the sum of each column (kr + kg + kb), (lr + lg + lb), (mr + mg + mb), which is the lightness component of the temporary colour correction coefficient, becomes equal to one another ( = 1). More specifically, each of coefficients kr, kg, kb of the column k is divided by the sum of the column k (kr + kg + kb), each of coefficients lr, lg, lb of thecolumn 1 is divided by the sum of the column 1 (lr + lg + lb), and each of coefficients mr, mg, mb of the column m is divided by the sum of the column m (mr + mg + mb). - This normalisation processing provides an advantage that grey balance is not lost. That is, in the case where the read data indicating grey (R, G, B have the same tone) is multiplied by the colour correction coefficient (see Eq. 2), if the temporary colour correction coefficient is used without normalisation, then the data after the multiplication is such that R, G, B have different tone levels since the sums of the respective columns (lightness component) are usually different from one another. This means that the read data after such multiplication exhibits a colour other than grey (achromatic colour). In contrast thereto. if the normalised colour correction coefficient is used, the read data after multiplication exhibits grey since the sums of the respective columns are equal to 1, thereby allowing grey balance to be maintained. The thus normalised colour correction coefficient is not only saved in the
host computer 3 as the final colourcorrection coefficient file 39, but also sent to thescanner 1 to be saved in thememory 112 within thescanner 1. - While a preferred embodiment of the invention has been described above, the invention is not limited thereto, but may be embodied in various other modes without departing from the scope and spirit thereof. For example, the invention may be embodied in copying machines and facsimile communication systems. Also the invention may be embodied for non-colour machines instead of the colour machines described above.
- As described in the foregoing, the invention is characterised as obtaining satisfactory grey density and colour reproduction even if there is a discrepancy in input/output characteristic between an image reading device and a printing device in a colour image processing system. In addition, once the calibration data has been obtained, a single autonomously functioning system can be formed only of the image reading device and the printing device themselves thereafter, which is highly useful as well as applicable to a variety of fields.
- The foregoing description of preferred embodiments of the invention has been presented for purposes of illustration and description. It is not intended to be exhaustive or to limit the invention to the precise form disclosed, and modifications and variations are possible in light of the above teachings or may be acquired from practice of the invention. The embodiments were chosen and described in order to explain the principles of the invention and its practical application to enable one skilled in the art to utilise the invention in various embodiments and with various modifications as are suited to the particular use contemplated. It is intended that the scope of the invention be defined by the claims appended hereto, and their equivalents.
- This invention provides a data correction method for a colour image processing system having a colour image reading device and a colour image printing device, comprising the steps of:
transmitting a chart file to the printing device so that the printing device produces a sample chart;
calculating calibration data from read sample data so that the read sample data can be corrected to corresponding data in the chart file, the read sample data being obtained by causing the reading device to read the sample chart; and
correcting printing data to be transmitted to the printing device using the calibration data. - This invention provides an image processing system, comprising:
a colour image reading device;
a colour image printing device;
transmitting means for transmitting a chart file to the printing device so that the printing device produces a sample chart;
calibration data calculation means for calculating calibration data from read sample data so that the read sample data can be corrected to corresponding data in the chart file, the read sample data being obtained by causing the reading device to read the sample chart; and
calibration means for correcting printing data to be transmitted to the printing device using the calibration data. - This invention provides a data correction subsystem for an image processing system having an image reading device and an image printing device, the data correction subsystem comprising:
means for transmitting a chart file to the printing device such that the printing device produces a sample chart;
means for comparing first image data with the chart file, the first image data being produced by the image reading device upon a reading of the sample chart by the image reading device;
means for calculating calibration data in accordance with the comparison of the first image data with the chart file; and
means for transmitting the calibration data to the image reading device so that second image data produced by the image reading device upon a reading of an image by the image reading device is corrected in accordance with the calibration data. - This invention provides a data correction method for an image processing system having an image reading device and an image printing device, the data correction method comprising the steps of:
transmitting a chart file to the printing device such that the printing device produces a sample chart;
comparing first image data with the chart file, the first image data being produced by the image reading device upon a reading of the sample chart by the image reading device;
calculating calibration data in accordance with the comparison of the first image data with the chart file; and
transmitting the calibration data to the image reading device so that second image data produced by the image reading device upon a reading of an image by the image reading device is corrected in accordance with the calibration data. - This invention provides an image processing method, comprising the steps of:
printing a sample chart in accordance with a chart file;
reading the chart file to produce first image data;
comparing the first image data with the chart file;
calculating calibration data in accordance with the comparison of the first image data with the chart file;
reading an image to produce second image data; and
correcting the second image data in accordance with the calibration data. - The aforegoing description has been given by way of example only and it will be appreciated by a person skilled in the art that modifications can be made without departing from the scope of the present invention.
Claims (21)
- A data correction subsystem for an image processing system having an image reading device and an image printing device, the data correction subsystem being characterised by comprising:
transmitting means for transmitting a chart file to the printing device so that the printing device produces a sample chart;
calibration data calculation means for calculating calibration data from read sample data so that the read sample data can be corrected to corresponding data in the chart file, the read sample data being obtained by causing the reading device to read the sample chart; and
calibration means for correcting printing data transmitted to the printing device using the calibration data. - A data correction subsystem according to claim 1 wherein the read sample data is first image data being produced by the image reading device upon a reading of the sample chart by the image reading device;
the calibration data calculation means calculating calibration data in accordance with the comparison of the first image data with the chart file; and further comprising
means for transmitting the calibration data to the image reading device so that second image data produced by the image reading device upon a reading of an image by the image reading device is corrected in accordance with the calibration data. - A data correction subsystem according to claim 1 or claim 2 wherein the image processing system is a colour image processing system having a colour image reading device and a colour image printing device.
- A data correction subsystem according to claim 3, wherein the calibration data includes γ calibration data for correcting grey density and colour calibration data for correcting a colour, and the calibration means subjects the printing data first to grey density correction using the γ calibration data and then to colour correction using the colour calibration data.
- A data correction subsystem according to claim 4, wherein the colour calibration data is a 3x3 matrix filter by which three primary colour components of the printing data are multiplied.
- A data correction subsystem according to any preceding claim, wherein a plurality of different types of printing devices can be used selectively or concurrently as the printing device, and wherein the data correction subsystem further comprises:
calibration data storing means for storing calibration data calculated respectively for each of the plurality of types of Drinting devices; and
calibration data selection means for selecting calibration data for a type of printing device to be used from the stored calibration data and for supplying the selected calibration data to the calibration means. - A data correction subsystem according to any preceding claim, wherein the calibration data includes γ calibration data for correcting a grey density, and wherein the calibration data calculation means comprises:
grey density normalisation means for subjecting the read sample data to normalisation processing to expand a grey density distribution region of the read sample data toward a higher density side; and
conversion data calculation means for calculating conversion data for correcting a grey density of the normalised read sample data to a grey density of the chart file data and making the calculated conversion data the γ calibration data. - A data correction subsystem according to any preceding claim, wherein the calibration data includes γ calibration data for correcting a grey density, and wherein the calibration data calculation means comprises:
density change detection means for detecting a point of change in a density value by scanning grey density values of the read sample data in a single direction; and
conversion data preparation means for preparing conversion data for converting the grey density value of the read sample data at the detected point of change into a grey density value of the chart file data corresponding to the point of change and making the prepared conversion data the γ calibration data. - A data correction subsystem according to any one of claims 3 to 5, wherein the calibration data includes colour calibration data for correcting a colour, and wherein the calibration data calculation means comprises:
colour sampling means for sampling only colour data in the chart file from the read sample data, the colour data corresponding to a predetermined colour within a range of colours that can be output by the printing device; and
conversion data calculation means for calculating conversion data for correcting the colour data sampled from the read sample data to corresponding data in the chart file and making the conversion data the colour calibration data. - A data correction subsystem according to any one of claims 3 to 5 or 9, wherein the calibration data includes colour calibration data for correcting a colour, and wherein the calibration data calculation means comprises:
colour sampling means for sampling only colour data in the chart file from the read sample data, the colour data corresponding to a predetermined colour outside a range of colours that can be output by the printing device; and
conversion data calculation means for calculating conversion data for correcting the colour data sampled from the read sample data to corresponding data in the chart file and making the conversion data the colour calibration data. - A data correction subsystem according to any one of claims 3 to 5, 9 or 10, wherein the calibration data includes colour calibration data for correcting a colour, and wherein the calibration data calculation means comprises:
matrix filter calculation means for calculating a 3x3 matrix filter to minimise an error between three primary colour component values of the read sample data and three primary colour component values of the chart file data; and
matrix normalisation means for executing normalisation processing to make lightness components with respect to the three primary colours of the calculated matrix filter equal to one another and making the thus normalised matrix filter the colour calibration data. - A data correction method for an image processing system having an image reading device and an image printing device, comprising the steps of:
transmitting a chart file to the printing device so that the printing device produces a sample chart;
calculating calibration data from read sample data so that the read sample data can be corrected to corresponding data in the chart file, the read sample data being obtained by causing the reading device to read the sample chart; and
correcting printing data to be transmitted to the printing device using the calibration data. - A data correction method according to claim 12, wherein the read sample data is first image data being produced by the image reading device upon a reading of the sample chart by the image reading device; and comprising the steps of:
calculating calibration data in accordance with the comparison of the first image data with the chart file; and
transmitting the calibration data to the image reading device so that second image data produced by the image reading device upon a reading of an image by the image reading device is corrected in accordance with the calibration data. - A data correction method according to claim 12 or claim 13, wherein the image processing system is a colour image processing system having a colour image reading device and a colour image printing device.
- An image processing system, comprising:
an image reading device;
an image printing device;
transmitting means for transmitting a chart file to the printing device so that the printing device produces a sample chart;
calibration data calculation means for calculating calibration data from read sample data so that the read sample data can be corrected to corresponding data in the chart file, the read sample data being obtained by causing the reading device to read the sample chart; and
calibration means for correcting printing data to be transmitted to the printing device using the calibration data. - An image processing system according to claim 15 and comprising:
a data correction subsystem, the data correction subsystem including
said transmitting means;
said calibration data calculation means comprising;
means for comparing first image data with the chart file, the first image data being produced by the image reading device upon a reading of the sample chart by the image reading device, and
means for calculating calibration data in accordance with the comparison of the first image data with the chart file, and the data correction subsystem also including;
means for transmitting the calibration data to the image reading device so that second image data produced by the image reading device upon a reading of an image by the image reading device is corrected in accordance with the calibration data. - An image processing system according to claim 15 or claim 16, wherein the image reading device comprises a calibration data storage means for storing the calibration data obtained by the calibration data calculation means, and wherein the calibration means is provided in the image reading device.
- Am image processing system according to any one of claims 15 to 17, wherein said system is a colour image processing system comprising a colour image reading device and a colour image printing device.
- An image processing method comprising the steps of:
printing a sample chart in accordance with a chart file;
reading the chart file to produce first image data;
comparing the first image data with the chart file;
calculating calibration data in accordance with the comparison of the first image data with the chart file;
reading an image to produce second image data; and
correcting the second image data in accordance with the calibration data. - An image processing method according to claim 19, wherein the step of calculating the calibration data includes the steps of calculating γ calibration data and calculating colour calibration data, and wherein the step of correcting the second image data includes the steps of correcting a grey density of the second image data in accordance with the γ calibration data and correcting a colour of the second image data in accordance with the colour calibration data.
- An image processing method according to claim 19 or claim 20, wherein the printing step, the first reading step, the comparing step, and the calculating step are performed a plurality of times to produce calibration data for a plurality of corresponding printing devices, and wherein the method further comprises the step of storing the calibration data for at least one of the plurality of printing devices.
Applications Claiming Priority (3)
| Application Number | Priority Date | Filing Date | Title |
|---|---|---|---|
| JP04414394A JP3520550B2 (en) | 1994-03-15 | 1994-03-15 | Color image processing system and its data correction method |
| JP44143/94 | 1994-03-15 | ||
| JP4414394 | 1994-03-15 |
Publications (3)
| Publication Number | Publication Date |
|---|---|
| EP0673155A2 true EP0673155A2 (en) | 1995-09-20 |
| EP0673155A3 EP0673155A3 (en) | 1996-01-17 |
| EP0673155B1 EP0673155B1 (en) | 2001-06-06 |
Family
ID=12683426
Family Applications (1)
| Application Number | Title | Priority Date | Filing Date |
|---|---|---|---|
| EP95301675A Expired - Lifetime EP0673155B1 (en) | 1994-03-15 | 1995-03-14 | Data correction subsystem and method for image processing |
Country Status (4)
| Country | Link |
|---|---|
| US (1) | US5710871A (en) |
| EP (1) | EP0673155B1 (en) |
| JP (1) | JP3520550B2 (en) |
| DE (1) | DE69521166T2 (en) |
Cited By (3)
| Publication number | Priority date | Publication date | Assignee | Title |
|---|---|---|---|---|
| EP0825552A2 (en) * | 1996-08-23 | 1998-02-25 | Canon Kabushiki Kaisha | Image forming apparatus, and control apparatus and method therefor |
| EP1158778A1 (en) * | 2000-05-26 | 2001-11-28 | AGFA-GEVAERT naamloze vennootschap | Calibration method for digital camera and printer. |
| WO2005036869A1 (en) * | 2003-10-13 | 2005-04-21 | Kikuze Solutions Pte Ltd | Method and apparatus for calibrating colour print engines |
Families Citing this family (31)
| Publication number | Priority date | Publication date | Assignee | Title |
|---|---|---|---|---|
| JPH09172547A (en) * | 1995-10-19 | 1997-06-30 | Ricoh Co Ltd | Color image forming device |
| JPH09135354A (en) * | 1995-11-10 | 1997-05-20 | Canon Inc | Device and method for processing image |
| JP3436851B2 (en) * | 1995-12-11 | 2003-08-18 | 大日本スクリーン製造株式会社 | How to change the data conversion table |
| US6072513A (en) * | 1996-03-11 | 2000-06-06 | Fuji Photo Film Co., Ltd. | Method of density correction and an image recording apparatus |
| JP3943167B2 (en) * | 1996-09-10 | 2007-07-11 | 富士フイルム株式会社 | Color conversion method |
| JP3787427B2 (en) * | 1997-11-28 | 2006-06-21 | キヤノン株式会社 | Data processing method and storage medium for printer server |
| JP2000190573A (en) * | 1998-12-28 | 2000-07-11 | Canon Inc | Method for controlling printing and printing system |
| US20040008381A1 (en) * | 1999-07-16 | 2004-01-15 | Jacob Steve A. | System and method for converting color data to gray data |
| US6873433B1 (en) * | 2000-03-09 | 2005-03-29 | Eastman Kodak Company | Calibration of color reproduction apparatus |
| JP4049966B2 (en) * | 2000-03-09 | 2008-02-20 | 富士フイルム株式会社 | Image output method and apparatus, and recording medium |
| JP2001275003A (en) | 2000-03-24 | 2001-10-05 | Fuji Photo Film Co Ltd | Method and device for image correction and recording medium |
| US6681041B1 (en) * | 2000-04-24 | 2004-01-20 | Microsoft Corporation | System and method for converting color data |
| US7072072B1 (en) * | 2000-05-02 | 2006-07-04 | Xerox Corporation | Color rendering optimized for text and line art |
| US20010045980A1 (en) * | 2000-05-26 | 2001-11-29 | Jacques Leonard | Calibration method for digital camera and printer |
| JP2002027260A (en) * | 2000-07-12 | 2002-01-25 | Riso Kagaku Corp | Gray converting method for color picture and device for the same |
| US6999213B2 (en) * | 2000-09-29 | 2006-02-14 | Canon Kabushiki Kaisha | Image processing system, image processing apparatus, image processing method, and storage medium thereof |
| KR20020041697A (en) * | 2000-11-28 | 2002-06-03 | 정정휘 | Method for correcting color difference influenced by printer characteristic and computer readable medium stored thereon computer executable instruction for performing the method |
| KR20020053981A (en) * | 2000-12-26 | 2002-07-06 | 오길록 | Color printer gamma correction system with monitor |
| US6771839B2 (en) | 2001-02-20 | 2004-08-03 | Sharp Laboratories Of America, Inc. | Efficient method of computing gamma correction tables |
| US7355748B2 (en) | 2001-02-27 | 2008-04-08 | Seiko Epson Corporation | Color matching server, color matching client, print control server, print control client, print control system, print control process, medium on which print control program is stored profile providing server and profile demanding client |
| US20030042399A1 (en) * | 2001-06-19 | 2003-03-06 | Umax Data Systems Inc. | Calibration method of an image-capture apparatus |
| JP4007035B2 (en) * | 2002-03-29 | 2007-11-14 | ブラザー工業株式会社 | Image forming apparatus and image reading apparatus |
| JP3984858B2 (en) * | 2002-05-01 | 2007-10-03 | キヤノン株式会社 | Image processing apparatus and control method thereof |
| US7564602B2 (en) * | 2003-07-28 | 2009-07-21 | Hoya Corporation | Color chart for adjustment of a color printer and a color monitor utilized with an endoscope |
| US7574335B1 (en) | 2004-02-11 | 2009-08-11 | Adobe Systems Incorporated | Modelling piece-wise continuous transfer functions for digital image processing |
| US7430318B2 (en) * | 2004-07-13 | 2008-09-30 | Toshiba Corporation | System and method for color correction for electronic printing |
| JP4821142B2 (en) * | 2005-03-09 | 2011-11-24 | 富士ゼロックス株式会社 | Image processing system |
| JP2007259123A (en) * | 2006-03-23 | 2007-10-04 | Konica Minolta Business Technologies Inc | Image reading apparatus, image processing method and computer-readable program |
| JP5505366B2 (en) * | 2010-06-09 | 2014-05-28 | コニカミノルタ株式会社 | Profile set storage method, profile set storage program, profile set storage system, and color conversion processing apparatus |
| JP6576018B2 (en) * | 2013-12-26 | 2019-09-18 | キヤノン株式会社 | Image processing apparatus and imaging apparatus |
| US10009588B2 (en) | 2013-12-26 | 2018-06-26 | Canon Kabushiki Kaisha | Image processing apparatus and imaging apparatus |
Citations (1)
| Publication number | Priority date | Publication date | Assignee | Title |
|---|---|---|---|---|
| US4929978A (en) | 1987-10-23 | 1990-05-29 | Matsushita Electric Industrial Co., Ltd. | Color correction method for color copier utilizing correction table derived from printed color samples |
Family Cites Families (12)
| Publication number | Priority date | Publication date | Assignee | Title |
|---|---|---|---|---|
| US4500919A (en) * | 1982-05-04 | 1985-02-19 | Massachusetts Institute Of Technology | Color reproduction system |
| JPH0785572B2 (en) * | 1987-09-22 | 1995-09-13 | 大日本スクリーン製造株式会社 | Color component conversion method in color reproduction of original color image |
| JP2746939B2 (en) * | 1988-09-26 | 1998-05-06 | 株式会社リコー | Color converter |
| US5107332A (en) * | 1989-05-17 | 1992-04-21 | Hewlett-Packard Company | Method and system for providing closed loop color control between a scanned color image and the output of a color printer |
| JP2633024B2 (en) * | 1989-06-26 | 1997-07-23 | セイコー電子工業株式会社 | Color image processing equipment |
| JPH0376471A (en) * | 1989-08-18 | 1991-04-02 | Seiko Instr Inc | Color picture input device |
| JPH0795814B2 (en) * | 1990-07-18 | 1995-10-11 | 富士ゼロックス株式会社 | Color recording device, color signal output device, color signal editing device, color signal storage device, color network system and color copying machine |
| US5157506A (en) * | 1990-08-29 | 1992-10-20 | Savitar, Inc. | Standardized color calibration of electronic imagery |
| US5185673A (en) * | 1991-06-12 | 1993-02-09 | Hewlett-Packard Company | Automated image calibration |
| JPH05122513A (en) * | 1991-10-25 | 1993-05-18 | Canon Inc | Recorder |
| JPH05183740A (en) * | 1991-12-26 | 1993-07-23 | Toppan Printing Co Ltd | Color converter |
| US5408342A (en) * | 1993-02-25 | 1995-04-18 | Canon Kabushiki Kaisha | Color image processing apparatus, method, and printer driver |
-
1994
- 1994-03-15 JP JP04414394A patent/JP3520550B2/en not_active Expired - Fee Related
-
1995
- 1995-03-14 EP EP95301675A patent/EP0673155B1/en not_active Expired - Lifetime
- 1995-03-14 US US08/403,442 patent/US5710871A/en not_active Expired - Lifetime
- 1995-03-14 DE DE69521166T patent/DE69521166T2/en not_active Expired - Fee Related
Patent Citations (1)
| Publication number | Priority date | Publication date | Assignee | Title |
|---|---|---|---|---|
| US4929978A (en) | 1987-10-23 | 1990-05-29 | Matsushita Electric Industrial Co., Ltd. | Color correction method for color copier utilizing correction table derived from printed color samples |
Cited By (5)
| Publication number | Priority date | Publication date | Assignee | Title |
|---|---|---|---|---|
| EP0825552A2 (en) * | 1996-08-23 | 1998-02-25 | Canon Kabushiki Kaisha | Image forming apparatus, and control apparatus and method therefor |
| EP0825552A3 (en) * | 1996-08-23 | 1999-02-24 | Canon Kabushiki Kaisha | Image forming apparatus, and control apparatus and method therefor |
| US5933676A (en) * | 1996-08-23 | 1999-08-03 | Canon Kabushiki Kaisha | Image forming apparatus, and control apparatus and method therefor |
| EP1158778A1 (en) * | 2000-05-26 | 2001-11-28 | AGFA-GEVAERT naamloze vennootschap | Calibration method for digital camera and printer. |
| WO2005036869A1 (en) * | 2003-10-13 | 2005-04-21 | Kikuze Solutions Pte Ltd | Method and apparatus for calibrating colour print engines |
Also Published As
| Publication number | Publication date |
|---|---|
| EP0673155B1 (en) | 2001-06-06 |
| US5710871A (en) | 1998-01-20 |
| JP3520550B2 (en) | 2004-04-19 |
| DE69521166T2 (en) | 2001-09-27 |
| JPH07254988A (en) | 1995-10-03 |
| DE69521166D1 (en) | 2001-07-12 |
| EP0673155A3 (en) | 1996-01-17 |
Similar Documents
| Publication | Publication Date | Title |
|---|---|---|
| EP0673155B1 (en) | Data correction subsystem and method for image processing | |
| US6853400B1 (en) | System and method for correcting aberration of lenses through which images are projected | |
| US6975437B2 (en) | Method, apparatus and recording medium for color correction | |
| US5553171A (en) | Apparatus and method for arbitrary binary resolution conversion | |
| JP4018755B2 (en) | Method and apparatus for creating tone curve for color signal conversion | |
| EP0482790A1 (en) | Method and apparatus for generating representation of an image | |
| US20040036898A1 (en) | Image processing method and apparatus, and color conversion table generation method and apparatus | |
| WO1991010330A1 (en) | A method to extend the linear range of images captured on film | |
| EP0402162B1 (en) | Image processing with noise enhancing operators for moiré reduction and/or random dot generation | |
| US20080018920A1 (en) | Image processing apparatus | |
| EP0366427B1 (en) | Image processing | |
| EP0812104A2 (en) | Image processing apparatus and method | |
| US5359436A (en) | Black recalculation for arbitrary HSL corrections in CMY color space | |
| JP3671616B2 (en) | Image processing device | |
| EP0949807B1 (en) | Transforms for digital images | |
| US20060232797A1 (en) | Image processing for expressing gradation | |
| JPH02148037A (en) | Transmission image engraving system | |
| JP2000078421A (en) | Device, method and system for processing image | |
| US7119925B2 (en) | Image processing, image reading apparatus and image processing method | |
| WO1996008913A1 (en) | Black recalculation for arbitrary hsl corrections in cmy color space | |
| Bhachech et al. | Improved color table inversion near the gamut boundary | |
| JPH07184036A (en) | Image processor | |
| JPH08265589A (en) | Picture processor | |
| JP3445847B2 (en) | Image processing device | |
| JP3434395B2 (en) | Image processing device |
Legal Events
| Date | Code | Title | Description |
|---|---|---|---|
| PUAI | Public reference made under article 153(3) epc to a published international application that has entered the european phase |
Free format text: ORIGINAL CODE: 0009012 |
|
| AK | Designated contracting states |
Kind code of ref document: A2 Designated state(s): DE FR GB |
|
| PUAL | Search report despatched |
Free format text: ORIGINAL CODE: 0009013 |
|
| AK | Designated contracting states |
Kind code of ref document: A3 Designated state(s): DE FR GB |
|
| 17P | Request for examination filed |
Effective date: 19960618 |
|
| 17Q | First examination report despatched |
Effective date: 19980512 |
|
| GRAG | Despatch of communication of intention to grant |
Free format text: ORIGINAL CODE: EPIDOS AGRA |
|
| GRAG | Despatch of communication of intention to grant |
Free format text: ORIGINAL CODE: EPIDOS AGRA |
|
| GRAH | Despatch of communication of intention to grant a patent |
Free format text: ORIGINAL CODE: EPIDOS IGRA |
|
| GRAH | Despatch of communication of intention to grant a patent |
Free format text: ORIGINAL CODE: EPIDOS IGRA |
|
| GRAA | (expected) grant |
Free format text: ORIGINAL CODE: 0009210 |
|
| AK | Designated contracting states |
Kind code of ref document: B1 Designated state(s): DE FR GB |
|
| REF | Corresponds to: |
Ref document number: 69521166 Country of ref document: DE Date of ref document: 20010712 |
|
| ET | Fr: translation filed | ||
| REG | Reference to a national code |
Ref country code: GB Ref legal event code: IF02 |
|
| PLBE | No opposition filed within time limit |
Free format text: ORIGINAL CODE: 0009261 |
|
| STAA | Information on the status of an ep patent application or granted ep patent |
Free format text: STATUS: NO OPPOSITION FILED WITHIN TIME LIMIT |
|
| 26N | No opposition filed | ||
| PGFP | Annual fee paid to national office [announced via postgrant information from national office to epo] |
Ref country code: GB Payment date: 20080312 Year of fee payment: 14 |
|
| PGFP | Annual fee paid to national office [announced via postgrant information from national office to epo] |
Ref country code: FR Payment date: 20080311 Year of fee payment: 14 Ref country code: DE Payment date: 20080306 Year of fee payment: 14 |
|
| GBPC | Gb: european patent ceased through non-payment of renewal fee |
Effective date: 20090314 |
|
| REG | Reference to a national code |
Ref country code: FR Ref legal event code: ST Effective date: 20091130 |
|
| PG25 | Lapsed in a contracting state [announced via postgrant information from national office to epo] |
Ref country code: DE Free format text: LAPSE BECAUSE OF NON-PAYMENT OF DUE FEES Effective date: 20091001 |
|
| PG25 | Lapsed in a contracting state [announced via postgrant information from national office to epo] |
Ref country code: GB Free format text: LAPSE BECAUSE OF NON-PAYMENT OF DUE FEES Effective date: 20090314 Ref country code: FR Free format text: LAPSE BECAUSE OF NON-PAYMENT OF DUE FEES Effective date: 20091123 |