EP0520463B1 - A high-resolution spectroscopy system - Google Patents
A high-resolution spectroscopy system Download PDFInfo
- Publication number
- EP0520463B1 EP0520463B1 EP92110768A EP92110768A EP0520463B1 EP 0520463 B1 EP0520463 B1 EP 0520463B1 EP 92110768 A EP92110768 A EP 92110768A EP 92110768 A EP92110768 A EP 92110768A EP 0520463 B1 EP0520463 B1 EP 0520463B1
- Authority
- EP
- European Patent Office
- Prior art keywords
- filter
- radiation
- conversion means
- wavelength
- outgoing
- Prior art date
- Legal status (The legal status is an assumption and is not a legal conclusion. Google has not performed a legal analysis and makes no representation as to the accuracy of the status listed.)
- Expired - Lifetime
Links
- 238000004611 spectroscopical analysis Methods 0.000 title description 7
- 230000005855 radiation Effects 0.000 claims description 25
- 238000006243 chemical reaction Methods 0.000 claims description 14
- 230000003287 optical effect Effects 0.000 claims description 14
- 238000012545 processing Methods 0.000 claims description 14
- 238000001228 spectrum Methods 0.000 claims description 13
- 230000003595 spectral effect Effects 0.000 claims description 11
- 230000007704 transition Effects 0.000 claims description 6
- 238000002834 transmittance Methods 0.000 claims description 6
- 238000000411 transmission spectrum Methods 0.000 claims description 4
- 238000001514 detection method Methods 0.000 claims description 2
- 238000010183 spectrum analysis Methods 0.000 claims 1
- 238000001069 Raman spectroscopy Methods 0.000 description 6
- 238000006073 displacement reaction Methods 0.000 description 4
- 238000004458 analytical method Methods 0.000 description 3
- 239000000463 material Substances 0.000 description 3
- 238000005259 measurement Methods 0.000 description 3
- 230000035945 sensitivity Effects 0.000 description 3
- 238000003379 elimination reaction Methods 0.000 description 2
- 238000001237 Raman spectrum Methods 0.000 description 1
- 230000000417 anti-transforming effect Effects 0.000 description 1
- 239000011248 coating agent Substances 0.000 description 1
- 238000000576 coating method Methods 0.000 description 1
- 230000001419 dependent effect Effects 0.000 description 1
- 239000006185 dispersion Substances 0.000 description 1
- 239000011521 glass Substances 0.000 description 1
- 239000000758 substrate Substances 0.000 description 1
Images
Classifications
-
- G—PHYSICS
- G01—MEASURING; TESTING
- G01J—MEASUREMENT OF INTENSITY, VELOCITY, SPECTRAL CONTENT, POLARISATION, PHASE OR PULSE CHARACTERISTICS OF INFRARED, VISIBLE OR ULTRAVIOLET LIGHT; COLORIMETRY; RADIATION PYROMETRY
- G01J3/00—Spectrometry; Spectrophotometry; Monochromators; Measuring colours
- G01J3/12—Generating the spectrum; Monochromators
- G01J3/26—Generating the spectrum; Monochromators using multiple reflection, e.g. Fabry-Perot interferometer, variable interference filters
-
- G—PHYSICS
- G01—MEASURING; TESTING
- G01J—MEASUREMENT OF INTENSITY, VELOCITY, SPECTRAL CONTENT, POLARISATION, PHASE OR PULSE CHARACTERISTICS OF INFRARED, VISIBLE OR ULTRAVIOLET LIGHT; COLORIMETRY; RADIATION PYROMETRY
- G01J3/00—Spectrometry; Spectrophotometry; Monochromators; Measuring colours
- G01J3/12—Generating the spectrum; Monochromators
- G01J2003/1226—Interference filters
Definitions
- the present invention relates to optical spectroscopy systems, and more particularly to a high-resolution spectroscopy system.
- Optical spectroscopy systems commonly used to analyse the spectrum of a light radiation generally utilise prisms or gratings which give rise to a spatial dispersion of the various wavelengths present in the radiation to be analysed.
- very high resolutions are required, in order to separate wavelengths which differ e.g. by some nanometers, as it may be necessary to characterise a monochromatic or quasi-monochromatic source (namely an LED or a laser diode), or in Raman or Brillouin spectroscopy.
- Interference filters consist of a transparent dielectric substrate, with suitable refractive index, onto which a complex multilayer coating has been deposited.
- a light radiation traversing the filter undergoes multiple reflections at the interfaces between the various layers: by an appropriate choice of the refractive indices and thicknesses of the layers, a certain portion of the incident radiation spectrum can be transmitted or eliminated by interference.
- the cut-off wavelength in case of high-pass or low-pass filter
- the central wavelength of the transmitted or eliminated band in case of bandpass or band-elimination filters
- That document discloses a Raman spectroscopy apparatus where a sample is illuminated by light from a laser source, which is reflected to it by a dichroic mirror, and a bidimensional image of the illuminated area is formed on a detector through a suitable optical system. On the way to the detector, the light passes through an interference filter which selects a desired line from Raman spectrum scattered by the sample.
- the filter is arranged for pivotal movement about an axis perpendicular to the optical axis, to scan in wavelength the scattered spectrum.
- the rays or beams which give origin to the image traverse the interference filter at different angles.
- the image is a nonmonochromatic image of the sample, and each point on the detector will be associated with a point of the sample and a wavelength.
- a computer measures the frequencies and the relative intensities of the peaks present in the signals supplied by the various detector points and associates the results with the spectra of the various molecules. The same computer can control the filter movements.
- the interference filter is used basically as a monochromator, and hence its resolution is strictly dependent on the width of the filter passband: more particularly, to obtain a good resolution not only the band must be very narrow, but the corresponding peak must also be isolated from adjacent secondary peaks, if any. It is rather complicated and hence expensive to fabricate interference filters meeting these requirements.
- the resolution also depends on the accuracy with which the amplitude of the filter angular displacements can be determined. Since the cost of angular position measuring devices increases with sensitivity, also such requirement causes an increase in the system costs. Finally the presence of moving parts generally gives rise to reliability problems.
- a spectroscopy system based on the use of interference filters is proposed, which allows high resolution and high sensitivity to be achieved without particular filter band requirements and without exploiting filter movement to obtain wavelength scanning.
- a system in accordance with the invention comprises a source of the radiation to be analysed, means for the photoelectric conversion of said radiation, an interference filter arranged between the source and the photoelectric conversion means to select different wavelength intervals in the radiation emitted by the source, and a measuring and data processing device connected to the conversion means, which memorises the intensity values of the output signals of the conversion means as the selected wavelength interval varies and obtains the information on the spectrum from said signals, characterised in that the interference filter is a filter with such a transmittance spectrum that the spectrum Fourier transform presents a high content at high frequencies and is associated with a first optical system focusing the radiation to be analysed on such a filter, and with a second optical system collimating the radiation outgoing from the filter and sending the radiation portions outgoing from the filter at different angles to different points of a detection plane, where the photoelectric conversion means is arranged, and in that the measuring and data processing device is designed to obtain the spectral density values at the various wavelengths from the intensity values of the signals outgoing from the conversion means and from the transfer function
- the interference filter is a filter with very steep transitions from transmittance maxima to minima.
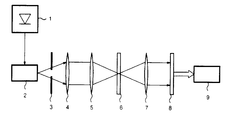
- the light scattered by sample 2 is partly collected by an optical system, schematically represented by pin-hole diaphragm 3 and lenses 4, 5, and focused on an interference filter 6.
- the beam outgoing from the filter is then collimated by an optical system 7 and sent towards a detector 8, which either comprises an array of sensitive elements, or is a single element scanning the beam.
- the different rays of the focused beam impinge on the filter at different angles and for each angle the filter is tuned to a different wavelength.
- the different sensitive elements of the array (or the single photodetector in its different positions) will then receive radiations comprising correspondingly different wavelength intervals.
- the output signal of detector 8 is sent to a measuring and data processing system 9, which memorises the intensity values in function of the detector position or of the arrival position of the various radiations on the detector and carries out the processings necessary to obtain the spectral characteristics of the radiation scattered by the sample from the values obtained and from the filter characteristics, memorised inside it.
- the filter used is preferably a bandpass or band-elimination filter, of a type whose transmittance characteristics, apart from the wavelength shift of the passband or the eliminated band, remain basically unchanged as the incidence angle of the radiation varies: this simplifies signal processing, as it will be better seen hereinafter.
- the filter needs not to have a very narrow band, with a single peak, but it can present a spectrum of whatever shape, provided the transitions from the transmittance maxima to the minima (meaning by minimum the fraction of the peak value which is taken into account to define the filter band limits) are very steep, i. e. the band widening in transition region(s) is very small.
- the Fourier transform of the filter transmittance spectrum has a high content at high frequencies, what is important for the completeness of the spectral information obtained, as it will be better understood hereinafter.
- the actual values of the filter bandwidth and of the transmitted (or eliminated) wavelengths will be obviously chosen depending on the applications.
- a bandpass filter can be used, with a passband of some ten nanometers (e.g. 80 nm) and widening of about 1.5% from the peak value to a value equal to one hundredth the peak value. Filters with those characteristics are commercially available and relatively cheap.
- the only unknown quantity in (1) is f( ⁇ ), since h( ⁇ 0) is measured with the apparatus described and g( ⁇ - ⁇ 0) is known since it is communicated by the filter manufacturer or can be experimentally determined.
- the operations carried out by processing system 9 consist in solving (1) with respect to f( ⁇ ); relation (1) is a normal convolution integral and will be solved e.g. by calculating the Fourier or Laplace transform.
- a system as described allows an easy obtention of high resolutions, since a filter with the above mentioned characteristics (considering as limit wavelength of the passband that at which the transmittance reduces down to 1% the peak value) can separate wavelengths whose difference is of the order of the tenths of nanometer (e. g. 0.15 to 0.5 nm). Still with reference to the use of the invention for Raman spectroscopy and supposing that source 1 emits radiations at a wavelength of about 500 nm, Raman scattering peaks for most materials of interest in glass technology are shifted, with respect to the source line, by an amount ranging between some nanometers and about 20 nanometers.
- Optical system 7 must be chosen taking into account the size of the available sensors.
- detector 8 is a detector with an array of photosensitive elements, where the elements have as a rule a linear size of the order of 15 »m, with about one thousand elements for row/column (and hence total linear size not far exceeding 1 cm, so that cumbersome optical systems with high focal lengths not required) each element collects a total band which basically corresponds to filter sensitivity. No difficulties are encountered also in case of use of a single sensor scanning the output beam. It is to be noted in this respect that linear displacements, such as those necessary to such scanning, can be controlled more easily and with greater precision than angular movements, as required by the filter of the system described in the above mentioned patent application.
- Information on the wavelength can be obtained from the measurement results with a precision depending on the performance of processing system 9 and on the precision with which the functions in (1) can be approximated: a simple personal computer is sufficient to perform the calculations necessary to obtain resolutions of the order of the tenths of nanometer.
- the filter passband is considerably wider than the spectrum portion of interest. For that reason the steepness of the transitions between transmittance maxima and minima is important, rather than the passband width, since this steepness determines the efficiency with which the information relevant to the spectrum under test is obtained from the signals measured. To realise that, it is enough to consider two very narrow peaks spaced by ⁇ ; if the filter transition region has narrower amplitude than ⁇ , the contributions of each peak to the signal measured do not overlap (there is first the contribution of only one of them and then that of both) and hence they are easier to distinguish.
- the Fourier transform of the filter transmittance spectrum must have a high content at high frequencies. Since spectral information of greater interest is represented by high frequency components of function f( ⁇ ) of (1), their contributions to the measured signals are actually present and high if the condition above is satisfied: this is clear for relation (2), and can be easily seen also for (3), by developing both members in Fourier series.
- the radiation emitted by source 1 can be directly analysed, by collecting with diaphragm 3 the beam it emits instead of that scattered by the sample.
Description
- The present invention relates to optical spectroscopy systems, and more particularly to a high-resolution spectroscopy system.
- Optical spectroscopy systems commonly used to analyse the spectrum of a light radiation generally utilise prisms or gratings which give rise to a spatial dispersion of the various wavelengths present in the radiation to be analysed. In certain applications very high resolutions are required, in order to separate wavelengths which differ e.g. by some nanometers, as it may be necessary to characterise a monochromatic or quasi-monochromatic source (namely an LED or a laser diode), or in Raman or Brillouin spectroscopy.
- Obtaining such high resolutions by spatially dispersive means with satisfactory results demands use of very cumbersome, complicated and expensive systems. To overcome this problem, spectroscopy systems have been proposed which exploit different means for the selection of the frequency range of interest, such as for instance interference filters.
- Interference filters, as known, consist of a transparent dielectric substrate, with suitable refractive index, onto which a complex multilayer coating has been deposited. A light radiation traversing the filter undergoes multiple reflections at the interfaces between the various layers: by an appropriate choice of the refractive indices and thicknesses of the layers, a certain portion of the incident radiation spectrum can be transmitted or eliminated by interference. The cut-off wavelength (in case of high-pass or low-pass filter), or the central wavelength of the transmitted or eliminated band (in case of bandpass or band-elimination filters) varies with the incidence angle, since the optical paths of the various rays inside the filter change.
- An example of system using an interference filter is described in WO-A-90/07108 published on 28 June 1990.
- That document discloses a Raman spectroscopy apparatus where a sample is illuminated by light from a laser source, which is reflected to it by a dichroic mirror, and a bidimensional image of the illuminated area is formed on a detector through a suitable optical system. On the way to the detector, the light passes through an interference filter which selects a desired line from Raman spectrum scattered by the sample. The filter is arranged for pivotal movement about an axis perpendicular to the optical axis, to scan in wavelength the scattered spectrum.
- For each position of the filter, the rays or beams which give origin to the image traverse the interference filter at different angles. Hence the image is a nonmonochromatic image of the sample, and each point on the detector will be associated with a point of the sample and a wavelength. A computer measures the frequencies and the relative intensities of the peaks present in the signals supplied by the various detector points and associates the results with the spectra of the various molecules. The same computer can control the filter movements.
- The known system presents a number of drawbacks which limit its performance. More particularly, the interference filter is used basically as a monochromator, and hence its resolution is strictly dependent on the width of the filter passband: more particularly, to obtain a good resolution not only the band must be very narrow, but the corresponding peak must also be isolated from adjacent secondary peaks, if any. It is rather complicated and hence expensive to fabricate interference filters meeting these requirements. Besides, the resolution also depends on the accuracy with which the amplitude of the filter angular displacements can be determined. Since the cost of angular position measuring devices increases with sensitivity, also such requirement causes an increase in the system costs. Finally the presence of moving parts generally gives rise to reliability problems.
- In accordance with the invention a spectroscopy system based on the use of interference filters is proposed, which allows high resolution and high sensitivity to be achieved without particular filter band requirements and without exploiting filter movement to obtain wavelength scanning.
- A system in accordance with the invention comprises a source of the radiation to be analysed, means for the photoelectric conversion of said radiation, an interference filter arranged between the source and the photoelectric conversion means to select different wavelength intervals in the radiation emitted by the source, and a measuring and data processing device connected to the conversion means, which memorises the intensity values of the output signals of the conversion means as the selected wavelength interval varies and obtains the information on the spectrum from said signals, characterised in that the interference filter is a filter with such a transmittance spectrum that the spectrum Fourier transform presents a high content at high frequencies and is associated with a first optical system focusing the radiation to be analysed on such a filter, and with a second optical system collimating the radiation outgoing from the filter and sending the radiation portions outgoing from the filter at different angles to different points of a detection plane, where the photoelectric conversion means is arranged, and in that the measuring and data processing device is designed to obtain the spectral density values at the various wavelengths from the intensity values of the signals outgoing from the conversion means and from the transfer function of the interference filter.
- Preferably the interference filter is a filter with very steep transitions from transmittance maxima to minima.
- The invention will be now described with reference to the annexed drawing, which shows an example of embodiment of the invention, applied to material analysis.
- In the drawing, double lines denote the electrical signal paths.
- The light emitted by a source 1, e. g. a laser, is sent onto a
sample 2 of the material to be analysed, possibly through a suitable optical system, not shown. The light scattered bysample 2 is partly collected by an optical system, schematically represented by pin-hole diaphragm 3 andlenses interference filter 6. The beam outgoing from the filter is then collimated by anoptical system 7 and sent towards adetector 8, which either comprises an array of sensitive elements, or is a single element scanning the beam. The different rays of the focused beam impinge on the filter at different angles and for each angle the filter is tuned to a different wavelength. The different sensitive elements of the array (or the single photodetector in its different positions) will then receive radiations comprising correspondingly different wavelength intervals. The output signal ofdetector 8 is sent to a measuring anddata processing system 9, which memorises the intensity values in function of the detector position or of the arrival position of the various radiations on the detector and carries out the processings necessary to obtain the spectral characteristics of the radiation scattered by the sample from the values obtained and from the filter characteristics, memorised inside it. - The filter used is preferably a bandpass or band-elimination filter, of a type whose transmittance characteristics, apart from the wavelength shift of the passband or the eliminated band, remain basically unchanged as the incidence angle of the radiation varies: this simplifies signal processing, as it will be better seen hereinafter. The filter needs not to have a very narrow band, with a single peak, but it can present a spectrum of whatever shape, provided the transitions from the transmittance maxima to the minima (meaning by minimum the fraction of the peak value which is taken into account to define the filter band limits) are very steep, i. e. the band widening in transition region(s) is very small. In this way the Fourier transform of the filter transmittance spectrum has a high content at high frequencies, what is important for the completeness of the spectral information obtained, as it will be better understood hereinafter. The actual values of the filter bandwidth and of the transmitted (or eliminated) wavelengths will be obviously chosen depending on the applications.
- By way of example, for Raman spectroscopy measurements, a bandpass filter can be used, with a passband of some ten nanometers (e.g. 80 nm) and widening of about 1.5% from the peak value to a value equal to one hundredth the peak value. Filters with those characteristics are commercially available and relatively cheap.
- Processing of the photodetector output signal by taking into account the filter transfer function is necessary since the signal corresponding to any incidence angle always comprises contribution from a certain wavelength range, owing to filter bandwidth. More particularly, taking into account the simplest case in which incidence angle variation solely causes a shift of the central wavelength of the passband and indicating by:
- f(λ) the spectrum to be determined (λ = wavelength);
- λ₀ the central wavelength of
filter 6; - g(λ-λ₀) the filter transfer function,
- The only unknown quantity in (1) is f(λ), since h(λ₀) is measured with the apparatus described and g(λ-λ₀) is known since it is communicated by the filter manufacturer or can be experimentally determined. The operations carried out by
processing system 9 consist in solving (1) with respect to f(λ); relation (1) is a normal convolution integral and will be solved e.g. by calculating the Fourier or Laplace transform. Thus relation

is obtained, wherefrom the desired function f(λ) can be obtained by solving with respect to F and antitransforming. - The assumption of using a filter where the incidence angle variation solely causes a passband shift is not practically limitative, since filters of this kind are generally commercially available. However, if such constraint is not desired, the only difference with respect to the previous case is that the processing system is to solve the following integral equation

ϑ being the incidence angle. - A system as described allows an easy obtention of high resolutions, since a filter with the above mentioned characteristics (considering as limit wavelength of the passband that at which the transmittance reduces down to 1% the peak value) can separate wavelengths whose difference is of the order of the tenths of nanometer (e. g. 0.15 to 0.5 nm). Still with reference to the use of the invention for Raman spectroscopy and supposing that source 1 emits radiations at a wavelength of about 500 nm, Raman scattering peaks for most materials of interest in glass technology are shifted, with respect to the source line, by an amount ranging between some nanometers and about 20 nanometers. Considering a linear passband shift, with incidence angle, by about 1 nm/degree, for the analysis of such a spectrum the light cone incident on the filter should have an aperture of 10 to 20 degrees.
Optical system 7 must be chosen taking into account the size of the available sensors. E.g. ifdetector 8 is a detector with an array of photosensitive elements, where the elements have as a rule a linear size of the order of 15 »m, with about one thousand elements for row/column (and hence total linear size not far exceeding 1 cm, so that cumbersome optical systems with high focal lengths not required) each element collects a total band which basically corresponds to filter sensitivity. No difficulties are encountered also in case of use of a single sensor scanning the output beam. It is to be noted in this respect that linear displacements, such as those necessary to such scanning, can be controlled more easily and with greater precision than angular movements, as required by the filter of the system described in the above mentioned patent application. - Information on the wavelength can be obtained from the measurement results with a precision depending on the performance of
processing system 9 and on the precision with which the functions in (1) can be approximated: a simple personal computer is sufficient to perform the calculations necessary to obtain resolutions of the order of the tenths of nanometer. - To obtain resolutions of this kind with conventional devices, sophisticated apparatus are required, which are much more expensive than the whole of an interference filter and a personal computer. Moreover, the latter needs not be dedicated to the system.
- It is also worth noting that, in case a filter with the band characteristics mentioned above is used for Raman spectroscopy measurements, the filter passband is considerably wider than the spectrum portion of interest. For that reason the steepness of the transitions between transmittance maxima and minima is important, rather than the passband width, since this steepness determines the efficiency with which the information relevant to the spectrum under test is obtained from the signals measured. To realise that, it is enough to consider two very narrow peaks spaced by Δλ; if the filter transition region has narrower amplitude than Δλ, the contributions of each peak to the signal measured do not overlap (there is first the contribution of only one of them and then that of both) and hence they are easier to distinguish.
- Besides, as mentioned, to obtain spectral information as complete as possible, the Fourier transform of the filter transmittance spectrum must have a high content at high frequencies. Since spectral information of greater interest is represented by high frequency components of function f(λ) of (1), their contributions to the measured signals are actually present and high if the condition above is satisfied: this is clear for relation (2), and can be easily seen also for (3), by developing both members in Fourier series.
- Hereinbefore a single point of the sample has been considered; if a wide area is of interest, the sample is to be scanned with the beam emitted by source 1. The remarks about the control of linear displacements instead of angular displacements are valid also in this case.
- Of course, the radiation emitted by source 1 can be directly analysed, by collecting with
diaphragm 3 the beam it emits instead of that scattered by the sample.

where λ₁, λ₂ are the extreme wavelengths of the spectral interval of interest.
Claims (4)
- A system for the spectral analysis of a light radiation, comprising a source (1, 2) of the radiation to be analysed, means (8) for the photoelectric conversion of said radiation, an interference filter (6) arranged between the source (1, 2) and the photoelectric conversion means (8) for selecting different wavelength intervals in said radiation and separately supplying the conversion means (8) with the radiation portions corresponding to the different wavelength intervals, and a measuring and data processing device (9), connected to the conversion means (8), which memorises the intensity values of the signals outgoing from the conversion means (8) as the wavelength interval selected changes and obtains spectral information from said signals; characterised in that the interference filter (6) is a filter with such a transmittance spectrum that the spectrum Fourier transform presents a high content at high frequencies and is associated with a first optical system ((4, 5) focusing the radiation to be analysed onto such filter (6), and with a second optical system (7) collimating the radiation outgoing from the filter and sending the radiation portions outgoing from the filter at different angles to different points of a detection plane, where the conversion means (8) are located, and in that the measuring and data processing device (9) is arranged to obtain spectral density values relevant to the various wavelengths by processing the transfer function of the interference filter and the intensity values of the signals outgoing from the conversion means.
- A system as claimed in claim 1, characterised in that the measuring and data processing device (9) is arranged to obtain spectral density values relevant to the various wavelength values by solving the integral equation
 - ϑ = incidence angle;- λ = wavelength ;- λ₁, λ₂ = extreme wavelengths of the spectral interval of interest;- h(ϑ) = signal outgoing from the conversion means;- f(λ) = spectrum to be determined ,- g(λ, ϑ) = filter transfer function .
 - A system as claimed in claim 2, characterised in that the interference filter (6) is a filter in which the variation in the incidence angle of the light radiation solely causes a shift of the central wavelength of the passband, and the measuring and data processing device (9) is arranged to obtain spectral density values relevant to the various wavelengths by calculating Fourier or Laplace transform of the convolution integral

- A system as claimed in any of claims 1 to 3, characterised in that the interference filter (6) is a filter with very steep transitions between transmittance maxima and minima.
Applications Claiming Priority (2)
| Application Number | Priority Date | Filing Date | Title |
|---|---|---|---|
| ITTO910492 | 1991-06-28 | ||
| ITTO910492A IT1249939B (en) | 1991-06-28 | 1991-06-28 | HIGH RESOLUTION SPECTROSCOPY SYSTEM. |
Publications (2)
| Publication Number | Publication Date |
|---|---|
| EP0520463A1 EP0520463A1 (en) | 1992-12-30 |
| EP0520463B1 true EP0520463B1 (en) | 1995-04-05 |
Family
ID=11409445
Family Applications (1)
| Application Number | Title | Priority Date | Filing Date |
|---|---|---|---|
| EP92110768A Expired - Lifetime EP0520463B1 (en) | 1991-06-28 | 1992-06-26 | A high-resolution spectroscopy system |
Country Status (5)
| Country | Link |
|---|---|
| US (1) | US5305077A (en) |
| EP (1) | EP0520463B1 (en) |
| CA (1) | CA2070330C (en) |
| DE (2) | DE520463T1 (en) |
| IT (1) | IT1249939B (en) |
Families Citing this family (15)
| Publication number | Priority date | Publication date | Assignee | Title |
|---|---|---|---|---|
| JP3318397B2 (en) * | 1992-08-27 | 2002-08-26 | 興和株式会社 | Particle measurement device |
| US5440388A (en) * | 1993-08-02 | 1995-08-08 | Erickson; Jon W. | Chemical analysis and imaging by discrete fourier transform spectroscopy |
| IT1280841B1 (en) * | 1995-04-05 | 1998-02-11 | Cselt Centro Studi Lab Telecom | PROCEDURE AND EQUIPMENT FOR MEASURING THE REFRACTION INDEX OF GLASS SLABS |
| GB9511490D0 (en) * | 1995-06-07 | 1995-08-02 | Renishaw Plc | Raman microscope |
| ES2134699B1 (en) * | 1996-07-30 | 2000-05-16 | Investiagaciones Energeticas M | SPECTRAL DECOMPOSITION METHOD THROUGH LIQUID SPINKLING SPECTROMETERS FOR RADIONUCLEID MIXTURES. |
| JP3792374B2 (en) * | 1997-10-29 | 2006-07-05 | 倉敷紡績株式会社 | Optical density measuring device |
| ES2134164B1 (en) * | 1997-12-10 | 2000-05-16 | Univ Malaga | COMPUTERIZED METHOD OF ANALYSIS BY SPECTROSCOPY OF LASER PRODUCED PLASMAS FOR THE QUALITY CONTROL OF SOLAR CELLS. |
| EP1150106A1 (en) * | 2000-04-27 | 2001-10-31 | Krieg, Gunther, Prof.Dr.Ing. | Method and apparatus for precise quantitative material analysis in liquids, gases and solids |
| EP2783193A4 (en) | 2011-11-03 | 2015-08-26 | Verifood Ltd | Low-cost spectrometry system for end-user food analysis |
| JP2016528496A (en) | 2013-08-02 | 2016-09-15 | ベリフード, リミテッドVerifood, Ltd. | Spectrometer system and method, spectroscopic analysis device and method |
| JP2017505901A (en) | 2014-01-03 | 2017-02-23 | ベリフード, リミテッドVerifood, Ltd. | Spectroscopic system, method and application |
| EP3209983A4 (en) | 2014-10-23 | 2018-06-27 | Verifood Ltd. | Accessories for handheld spectrometer |
| WO2016125164A2 (en) | 2015-02-05 | 2016-08-11 | Verifood, Ltd. | Spectrometry system applications |
| WO2016125165A2 (en) | 2015-02-05 | 2016-08-11 | Verifood, Ltd. | Spectrometry system with visible aiming beam |
| WO2018015951A1 (en) | 2016-07-20 | 2018-01-25 | Verifood, Ltd. | Accessories for handheld spectrometer |
Family Cites Families (5)
| Publication number | Priority date | Publication date | Assignee | Title |
|---|---|---|---|---|
| US4008961A (en) * | 1975-04-21 | 1977-02-22 | Allied Chemical Corporation | Monochromatic detection of plural rotational Raman spectra generated by multiple frequency excitation |
| US4081215A (en) * | 1976-05-18 | 1978-03-28 | General Electric Company | Stable two-channel, single-filter spectrometer |
| US4084909A (en) * | 1976-07-19 | 1978-04-18 | International Business Machines Corporation | Drum monochromator |
| GB8830039D0 (en) * | 1988-12-22 | 1989-02-15 | Renishaw Plc | Raman microscope |
| DE3923831A1 (en) * | 1989-07-19 | 1991-01-31 | Hartmann & Braun Ag | INTERFEROMETRIC DEVICE |
-
1991
- 1991-06-28 IT ITTO910492A patent/IT1249939B/en active IP Right Grant
-
1992
- 1992-03-30 US US07/859,822 patent/US5305077A/en not_active Expired - Lifetime
- 1992-06-03 CA CA002070330A patent/CA2070330C/en not_active Expired - Fee Related
- 1992-06-26 DE DE199292110768T patent/DE520463T1/en active Pending
- 1992-06-26 EP EP92110768A patent/EP0520463B1/en not_active Expired - Lifetime
- 1992-06-26 DE DE69201917T patent/DE69201917T2/en not_active Expired - Fee Related
Also Published As
| Publication number | Publication date |
|---|---|
| CA2070330A1 (en) | 1992-12-29 |
| EP0520463A1 (en) | 1992-12-30 |
| ITTO910492A1 (en) | 1992-12-28 |
| US5305077A (en) | 1994-04-19 |
| CA2070330C (en) | 1996-02-13 |
| DE69201917T2 (en) | 1995-09-07 |
| DE520463T1 (en) | 1993-08-12 |
| DE69201917D1 (en) | 1995-05-11 |
| ITTO910492A0 (en) | 1991-06-28 |
| IT1249939B (en) | 1995-03-30 |
Similar Documents
| Publication | Publication Date | Title |
|---|---|---|
| US11313721B2 (en) | Compact spectrometer | |
| US6862092B1 (en) | Spectrometer | |
| US6870619B1 (en) | Spectrometer and method for measuring optical spectrum | |
| EP0520463B1 (en) | A high-resolution spectroscopy system | |
| US7397561B2 (en) | Spectroscopy system | |
| US7564547B2 (en) | Spectroscopy system | |
| US7157711B1 (en) | Microspectrometer gas analyzer | |
| US8130380B2 (en) | Spectrometer and interferometric method | |
| US4060327A (en) | Wide band grating spectrometer | |
| EP2510323B1 (en) | Fabry-perot fourier transform spectrometer | |
| Herrala et al. | Imaging spectrometer for process industry applications | |
| EP0190310B1 (en) | Spectral analyzer and direction indicator | |
| US5973780A (en) | Echelle spectroscope | |
| JPH07128144A (en) | Spectral measuring apparatus | |
| US4936684A (en) | Spectrometer with photodetector array detecting uniform bandwidth intervals | |
| US7061609B2 (en) | Measuring wavelength change | |
| Schlemmer et al. | Diode array spectrometer: an optimised design | |
| US20050088657A1 (en) | Optical measurment device and spectroscopic device | |
| Stark et al. | NIR instrumentation technology | |
| US6697159B2 (en) | Optical domain signal analyzer | |
| US7440107B2 (en) | Sampling spectrophotometer comprising an interferometer | |
| Zhang et al. | Miniature spectrometer based on linear variable interference filters | |
| JP3632825B2 (en) | Wavelength measuring device | |
| JPH076840B2 (en) | High resolution spectrometer | |
| JP2001296181A (en) | Spectrograph |
Legal Events
| Date | Code | Title | Description |
|---|---|---|---|
| PUAI | Public reference made under article 153(3) epc to a published international application that has entered the european phase |
Free format text: ORIGINAL CODE: 0009012 |
|
| AK | Designated contracting states |
Kind code of ref document: A1 Designated state(s): DE FR GB IT NL SE |
|
| ITCL | It: translation for ep claims filed |
Representative=s name: STUDIO TORTA SOCIETA' SEMPLICE |
|
| EL | Fr: translation of claims filed | ||
| 17P | Request for examination filed |
Effective date: 19930305 |
|
| TCNL | Nl: translation of patent claims filed | ||
| DET | De: translation of patent claims | ||
| 17Q | First examination report despatched |
Effective date: 19940407 |
|
| GRAA | (expected) grant |
Free format text: ORIGINAL CODE: 0009210 |
|
| ITF | It: translation for a ep patent filed |
Owner name: CSELT S.P.A. |
|
| AK | Designated contracting states |
Kind code of ref document: B1 Designated state(s): DE FR GB IT NL SE |
|
| REF | Corresponds to: |
Ref document number: 69201917 Country of ref document: DE Date of ref document: 19950511 |
|
| ET | Fr: translation filed | ||
| PLBE | No opposition filed within time limit |
Free format text: ORIGINAL CODE: 0009261 |
|
| STAA | Information on the status of an ep patent application or granted ep patent |
Free format text: STATUS: NO OPPOSITION FILED WITHIN TIME LIMIT |
|
| 26N | No opposition filed | ||
| NLS | Nl: assignments of ep-patents |
Owner name: OTC-OPTICAL TECHNOLOGIES CENTER S.R.L. |
|
| REG | Reference to a national code |
Ref country code: GB Ref legal event code: 732E |
|
| REG | Reference to a national code |
Ref country code: FR Ref legal event code: TP |
|
| REG | Reference to a national code |
Ref country code: GB Ref legal event code: 732E |
|
| PGFP | Annual fee paid to national office [announced via postgrant information from national office to epo] |
Ref country code: SE Payment date: 20010601 Year of fee payment: 10 |
|
| PGFP | Annual fee paid to national office [announced via postgrant information from national office to epo] |
Ref country code: NL Payment date: 20010611 Year of fee payment: 10 |
|
| REG | Reference to a national code |
Ref country code: FR Ref legal event code: TP |
|
| REG | Reference to a national code |
Ref country code: GB Ref legal event code: IF02 |
|
| PG25 | Lapsed in a contracting state [announced via postgrant information from national office to epo] |
Ref country code: SE Free format text: LAPSE BECAUSE OF NON-PAYMENT OF DUE FEES Effective date: 20020627 |
|
| PG25 | Lapsed in a contracting state [announced via postgrant information from national office to epo] |
Ref country code: NL Free format text: LAPSE BECAUSE OF NON-PAYMENT OF DUE FEES Effective date: 20030101 |
|
| EUG | Se: european patent has lapsed | ||
| NLV4 | Nl: lapsed or anulled due to non-payment of the annual fee |
Effective date: 20030101 |
|
| PGFP | Annual fee paid to national office [announced via postgrant information from national office to epo] |
Ref country code: DE Payment date: 20030630 Year of fee payment: 12 |
|
| PGFP | Annual fee paid to national office [announced via postgrant information from national office to epo] |
Ref country code: FR Payment date: 20040618 Year of fee payment: 13 |
|
| PG25 | Lapsed in a contracting state [announced via postgrant information from national office to epo] |
Ref country code: DE Free format text: LAPSE BECAUSE OF NON-PAYMENT OF DUE FEES Effective date: 20050101 |
|
| PG25 | Lapsed in a contracting state [announced via postgrant information from national office to epo] |
Ref country code: IT Free format text: LAPSE BECAUSE OF NON-PAYMENT OF DUE FEES;WARNING: LAPSES OF ITALIAN PATENTS WITH EFFECTIVE DATE BEFORE 2007 MAY HAVE OCCURRED AT ANY TIME BEFORE 2007. THE CORRECT EFFECTIVE DATE MAY BE DIFFERENT FROM THE ONE RECORDED. Effective date: 20050626 |
|
| PG25 | Lapsed in a contracting state [announced via postgrant information from national office to epo] |
Ref country code: FR Free format text: LAPSE BECAUSE OF NON-PAYMENT OF DUE FEES Effective date: 20060228 |
|
| REG | Reference to a national code |
Ref country code: FR Ref legal event code: ST Effective date: 20060228 |
|
| PGFP | Annual fee paid to national office [announced via postgrant information from national office to epo] |
Ref country code: GB Payment date: 20060626 Year of fee payment: 15 |
|
| REG | Reference to a national code |
Ref country code: GB Ref legal event code: 732E |
|
| GBPC | Gb: european patent ceased through non-payment of renewal fee |
Effective date: 20070626 |
|
| PG25 | Lapsed in a contracting state [announced via postgrant information from national office to epo] |
Ref country code: GB Free format text: LAPSE BECAUSE OF NON-PAYMENT OF DUE FEES Effective date: 20070626 |