EP0430150B1 - Method for testing quality and quality changes of biological systems and organochemical compositions interacting with these systems using measurements of ultraweak photon emission - Google Patents
Method for testing quality and quality changes of biological systems and organochemical compositions interacting with these systems using measurements of ultraweak photon emission Download PDFInfo
- Publication number
- EP0430150B1 EP0430150B1 EP90122586A EP90122586A EP0430150B1 EP 0430150 B1 EP0430150 B1 EP 0430150B1 EP 90122586 A EP90122586 A EP 90122586A EP 90122586 A EP90122586 A EP 90122586A EP 0430150 B1 EP0430150 B1 EP 0430150B1
- Authority
- EP
- European Patent Office
- Prior art keywords
- quality
- photon emission
- excitation
- anyone
- samples
- Prior art date
- Legal status (The legal status is an assumption and is not a legal conclusion. Google has not performed a legal analysis and makes no representation as to the accuracy of the status listed.)
- Expired - Lifetime
Links
Classifications
-
- G—PHYSICS
- G01—MEASURING; TESTING
- G01N—INVESTIGATING OR ANALYSING MATERIALS BY DETERMINING THEIR CHEMICAL OR PHYSICAL PROPERTIES
- G01N21/00—Investigating or analysing materials by the use of optical means, i.e. using sub-millimetre waves, infrared, visible or ultraviolet light
- G01N21/62—Systems in which the material investigated is excited whereby it emits light or causes a change in wavelength of the incident light
- G01N21/63—Systems in which the material investigated is excited whereby it emits light or causes a change in wavelength of the incident light optically excited
-
- G—PHYSICS
- G01—MEASURING; TESTING
- G01N—INVESTIGATING OR ANALYSING MATERIALS BY DETERMINING THEIR CHEMICAL OR PHYSICAL PROPERTIES
- G01N21/00—Investigating or analysing materials by the use of optical means, i.e. using sub-millimetre waves, infrared, visible or ultraviolet light
- G01N21/62—Systems in which the material investigated is excited whereby it emits light or causes a change in wavelength of the incident light
- G01N21/71—Systems in which the material investigated is excited whereby it emits light or causes a change in wavelength of the incident light thermally excited
-
- G—PHYSICS
- G01—MEASURING; TESTING
- G01N—INVESTIGATING OR ANALYSING MATERIALS BY DETERMINING THEIR CHEMICAL OR PHYSICAL PROPERTIES
- G01N37/00—Details not covered by any other group of this subclass
- G01N37/005—Measurement methods not based on established scientific theories
Definitions
- the invention relates to a method for checking the quality and / or change in quality of biological systems and / or foods and / or organic-chemical compounds interacting with them with the aid of ultra-weak photon emission.
- the method consists in measuring a very weak light emission from biological systems and / or a weak afterglow after a defined excitation of the test objects with modern technology and to correlate them with known quality standards.
- the method should offer the possibility to reproducibly reproduce the quality of a biological system in the sense of Erwin Schrödinger's overarching concept of quality with the help of measurement parameters, but on the other hand, it should also immediately indicate changes in the quality of biological systems caused by environmental influences or unexpected interactions with specifically used chemical products .
- Erwin Schrödinger assumes that life represents a state of high order (E. Schrödinger: "What is life? Looking at the living cell with the eyes of the physicist”. Francke, Bern 1946, Dalp Collection, Vol. 1). Food is primarily an order factor that helps the living being to build up and stabilize its specific order status.
- the quality of a food is then only a measure of the ability of the food to fulfill this task for the consumer.
- the quality of a biological system is therefore a function of this state of order. If the orderly state of a biological system is impaired by environmental influences or other undesirable interactions with foreign substances, the quality content of this system drops.
- DE-OS 30 38 255 describes the biological effects of external influences on cell groups from the previous analysis methods using the biophoton emission.
- the ultra-weak photon emission of a healthy and dying cell collective is measured before exposure to external influences using the photon count statistics. Then, from the change in the photon emission after the influence of the external influence in comparison with the different emissions of healthy and dying cell collective, it is concluded that the external influence is damaging or regenerating.
- US Pat. No. 4,458,531 describes how the influence of external factors on cell groups in the sense of a damaging or regenerating influence can be determined by measuring the intensity and / or the photon counting statistics.
- the aim of the present invention is therefore to provide a method which makes it possible to reproducibly determine the quality of biological systems in accordance with Schrödinger's comprehensive concept of quality or to track changes in quality. This is achieved by correlating measurement parameters of the ultra-weak photon emission with the methods of comparative statistical analysis with specified quality criteria for the condition parameters of the biological system and / or food.
- External stimulation can be done by means of electromagnetic radiation, ultrasound, thermal influence, chemical agents or under the influence of organisms.
- Radiation excitation can take place in white light or in different spectral ranges at discrete wavelengths.
- the excitation power is usually in the range of 100 to 300 watts.
- the ultrasound excitation can be done at discrete wavelengths, usually with powers between 10 and 100 watts.
- thermal excitation it is best to move in the temperature range from 0 ° to 60 ° C. If external excitation is used, the variance of the measured photon emission is determined within a certain measuring interval and the mean value of the first 20 to 50 measured values after the excitation is used as the measuring parameter.
- the measurement parameters obtained in this way are recorded together with predefined state and influence parameters in a data matrix and examined according to the usual methods of statistical analysis (correlation, factor and variance analysis).
- the influencing parameters are obtained through comparative measurements of samples that were subject to various influences such as breeding, cultivation, keeping, treatment, soil conditions, climate and other environmental factors, while the condition parameters are obtained through comparative measurements from samples of different types, consistency, durability, vitality and the like. be won.
- the classification of these samples into a quality category was carried out according to the previously known methods of nutritional physiology, food chemistry, sensor technology, etc. Additional parameters can also be used the dependence of the photon emission on the amount of the sample material and after simulated digestion can be obtained by in vitro treatment with enzymes.
- the present invention now offers the possibility of defining the quality categories of an examined sample, once defined after the influence of certain influencing parameters, also for samples, the unknown influencing parameters being subject to their correlation with the ultra-weak photon emission determined from the statistical analysis, and thus drawing conclusions about the unknown, the quality category to enable determining influencing parameters.
- the light emissions of two separate but neighboring biological systems correlate with each other.
- the emission rates of the respective systems are measured via separate light paths with their own photomultiplier arrangement.
- the slightest fluctuations in the light emission of one system for example due to the influence of foreign substances, can be detected using a fine analysis of the correlated photon emission of the other system. This offers the possibility of synchronously tracking immediately occurring environmental influences or even irreversible damage in one system via the correlated change in the emission behavior of the other biological system.
- the decay behavior after previous suggestion forms a particularly important criterion for assessing the vitality of a living system, in particular when assessing environmental damage and for prognostic consequences. If one assumes that biophotons have a large part in the regulation of cellular activity, then it can be expected that the measurement of the photon emission of biological systems can also be used to draw conclusions about the constitution of the respective biological systems. As a criterion The reversibility of a change in the biophoton emission after removal of the damaging influencing variable could then be defined for environmental pollution, while environmental damage causes irreversible changes in the photon emission. It is obvious that preferably the decay parameters of the photon emission of the Food and biological systems are compared and related in terms of coherence and incoherence.
- a structural parameter is available that is directly related to the life processes of the living system on which the food or biological system or biological organism is based, or to the interaction processes of the living system and organic chemical compound. Every little change in the structure of a food or biological system can be detected significantly with the help of extremely sensitive equipment.
- the sensitivity required to carry out such measurements is in the power range from 10 ⁇ 15 to 10 ⁇ 17 watts.
- the present invention offers numerous possibilities in industrial use. It is an ideal process for incoming and outgoing goods inspection, e.g. B. in the food trade. Furthermore, there is the possibility of determining "organically” grown goods with a view to checking this product name. With sufficient knowledge of a product, it is possible to identify “organic” and “non-organic” goods. Conversely, a systematic improvement in agricultural production methods can also be achieved. In this way, specific quality characteristics such as the shelf life of a food or the vitality of seeds can be recorded and controlled. This not only offers new perspectives for quality assurance and optimization for producers and retailers, but also for consumers the possibility of greater security when choosing the food offer. Due to the almost immediate responsiveness of the system to environmental influences, environmental protection is not only able to record and classify any damage that has occurred as quickly as possible, but also to trigger an alarm in good time and prevent further damage at an early stage using the option of automation.
- the decay behavior can not only be used to provide the current quality content or, after correlating the dynamic measurement parameters with suitable phenotypic state variables of the biological systems, predictions for the further quality behavior. Due to the induction of adequate chemical reactions between biological systems and complex organic-chemical compounds and the resulting biophoton radiation, predictions can be made about the compatibility of the biological system and organic-chemical compounds. This offers possible uses of the method, which can range from the assessment of packaging materials for food to predictions of the tissue compatibility of plastics when used in surgery to prognoses of the expected side effects of new drugs.
- the shelf life of four different types of grain is determined using the data matrix. 10 samples each of grains, flour and flakes are measured in summer (Sun) and then in winter (Wi) and examined for their pentane and oxygen values. These form the condition parameters for the durability of the samples. High pentane values (and accordingly low oxygen values) are a criterion for low durability and vice versa.
- the pentane and oxygen values are only correlative to durability (99.9%). They only correlate much less with type and condition. (Variety: approx. 60%; condition: approx. 10%).
- the individual measured values from the data matrix can be broken down into several components x1f1 + x2f2 + ... + x7f7 using the factor analysis.
- f1 to f7 mean the factors with which the grain samples can be identified correlatively. Their different importance are shown in Table 5.
- the main conclusion to be drawn from the statistical results given is the fact that the properties of the flakes, including their durability, can be determined from the data of the grains, as well as from the data obtained on the properties of the grains from which they were derived , can be concluded.
- the sample x of the grain is characterized by the measurable components x1 f1 + x2 f2, where f1 and f2 represent the fators for the grains specified in Table 5, then the flakes are approximately determined by the components x1 f1 ′ - x2 f2 ′, where f1 'and f2' by the sign reversal of the components NB, A, X H and X EH in the case of the transition from f1 to f1 'and the components pentane and NB in the transition from f2 to f2' emerge from f1 and f2.
- Table 8a shows randomly selected measurements of 1 g of the grain type Blé Alimentaire, which were determined four times in succession at intervals of 5 days. Control measurements on polystyrene with a fully filled cuvette are shown in Table 8b.
- Figure 2 shows the respective regression lines of the different grain types from Example 1. Wheat shows the least dependence of the storage content on the shelf life, rice the strongest.
- FIG. 4 shows the dependencies of photon emissions after excitation with white light on the mass of the grains used, in Figure 4a with high quality oat grains, in Figure 4b with low quality oat grains, in Figure 4c with high quality wheat flakes and in Figure 4d with low quality wheat flakes.
- the quality criterion was the vitality of the seeds, which was determined in parallel with the measurement using known methods (germination test, biochemical germ test / tetrazolium staining). These germ tests showed a germ loss of approx. 30% for the inferior batch, which corresponded exactly to the percentage of autoclaved seeds added. The accuracy of the germ test was ⁇ 2-3%. Samples of 4, 8 and 12 g were measured from these two batches.
- the sample material is weighed and, after filling into a quartz cuvette, placed in the measuring apparatus 10 minutes before the start of the measurement. After the dark-adapted mean value of the sample has been registered, it is excited two or three times over a period of one second with white light and then the decay behavior is registered. The time period between the individual suggestions must be selected so that complete decay is ensured in each case. The time resolution for all measurements is 500 ms.
- Figure 5 shows the initial intensities of the two batches of cress seeds over the sample amount. The first value was measured and evaluated 150 ms after excitation with a 150 W tungsten lamp. The values of the two repeat measurements are so close together that the error bars could no longer be resolved.
- Figure 6 shows the initial intensities of the two batches of maize after excitation with white light.
- the individual data points are based on three measured values.
- the entered error bars correspond to the standard deviations.
- the series of measurements was taken three days after the seeds had been autoclaved.
- the measured value above the sample mass 0 g is to be understood as a reference value for the excitability of the measuring chamber with an empty cuvette.
- the measurement results show. that the method used to check the quality of seeds and seeds can be used.
- the quality of seeds particularly with regard to their vitality, is clearly correlated with a property that can be described by the ability to store white light. Less vital seed emits the radiated light significantly more immediately after switching off the light source than higher quality, vital seed.
- the data obtained show sufficiently large even with small quality differences. statistically significant deviations. which also meet the demand for reproducibility.
- the measurements presented in this example should only serve to demonstrate the trend in the decay behavior of samples of different vitality and quality. For fine analysis, with which a high resolution can still be achieved with minimal differences, it is advantageous to measure with a much larger time resolution and also as a function of spectral excitation. Measuring time intervals below 25 ms are preferred.
- the bar marked with * represents the mean of the suggestions already described and two additional suggestions after mixing the sample and a one-day waiting period. Both samples with 2 mixed autoclaved corn kernels differ significantly from the sample with 12 g untreated Seed, as can be seen from the standard deviations placed on the bars.
- the dependence of the photon emission on different spectral ranges in light excitation is shown in Figure 8 on the basis of the emission rates of milk.
- the mean values NB of the first 20 measurement data were evaluated at intervals of 500 ms after an irradiation time of 60 s in the respective spectral range.
- the filter RG 610 and in the case of blue excitation were connected between a 150 watt tungsten lamp from Osram and the sample.
- milk is cell-free sample material.
- the emission of coherent light is not dependent on the presence of cell structures.
- Figures 10a and 10b show the mean values of the intrinsic intensities DA and the first 20 measured values after excitation NB from 20 measurements each in 10 measurement intervals in counts / 500 ms.
- Figure 10c shows the corresponding respective mean values of the mean error deviation QE from the best-matched exponential decay behavior from the mean values NB of the first 20 measured values after excitation.
- the sensitivity of the photon emission with regard to the decay behavior after excitation becomes particularly clear when measuring the photon emission from foods after gamma radiation. Even after one year, irradiated goods can be significantly differentiated from unirradiated goods via the intensity of the biophoton radiation.
- Figure 11 shows the intensity of the photon emission (in arbitrary units) from irradiated pepper ( Piper nigrum L. ) compared to unirradiated.
- the gamma radiation was carried out using a cobalt source customary for food preservation for 5 seconds with an energy dose of 5 gray.
- the measurement of the photon emission of the pepper excited in this way and of a blank sample with pepper not exposed to the radiation source was carried out one year after the irradiation.
- the photon emission of irradiated goods is about 30% higher than the emission of unirradiated goods even after one year.
- Figure 12 shows the percentage increase in the photon emission of the algae after adding the poison against the logarithm of the atrazine concentration in the measuring cuvette.
- Figure 13a shows the course of the photon emission of 9 ml algae (6.3 * 106 cells / ml, darkened for 22 hours) after the addition of 1 ml atrazine solution (10 mg / l) and the emission of 9 in Figure 13b ml algae (4.0 * 106 cells / ml, darkened for 26.5 hours) when adding an atrazine concentration of 3.3 mg / l.
- Figure 13c shows the photon emission as a reference measurement of 9 ml algae (6.3 * 106 cells / ml, dark adapted for 25 hours) after adding 1 ml aqua dest. The additions of atrazine or aqua dest. each took place with an abscissa value of 0.35 * 103.
- This example demonstrates the effects of toxins on various bio-indicators.
- the following were used as such: the slipper animal Paramecium caudatum , the unicellular algae Scenedesmus subspicatus already used in Example 10 and seedlings of the cress Lepidium sativum.
- Figure 14a shows the change in the photon intensity of 13 ml of the unicellular ciliate Paramecium caudatum with a cell density of 103 / ml in an 18 ml quartz cuvette after adding 2 ml of dilute acetic acid (0.1 ml 99% HAc / liter). The addition took place after 116 sec.
- Figure 14b shows the intensity curve after adding 2 ml of distilled water. 103 sec after the start of the measurement.
- the photon intensity increases after adding the acetic acid by approximately 40% of the value before the addition and then slowly drops to the initial value over approximately 125 seconds. After adding the solvent aqua dest. the photon intensity practically does not change.
- Figure 15a shows the change in the photon intensity of 13 ml of the unicellular algae Scenedesmus subspicatus with a cell density of 4 * 106 / ml in an 18 ml quartz cuvette after adding 2 ml of cadmium chloride solution (0.5 mg / liter). The addition took place after 107 sec.
- Figure 15b shows the intensity curve after adding 2 ml of distilled water. 104 sec after the start of the measurement.
- the photon intensity increases after adding the cadmium chloride by approx. 32% of the value before the addition and then slowly drops to the initial value over approx. 110 sec. After adding the solvent aqua dest. the photon intensity remains unchanged.
- Correlations are formed between the light emissions from two neighboring biological systems. An analysis of these correlations as a function of foreign substances in one of the systems allows precise and quick statements about an occurring environmental pollution or environmental damage.
- Figure 17 shows the correlations in the spontaneous light emissions from two separate populations of the luminous bacterium Bacterium phosphorescens . The light quanta emitted in the specified time interval are plotted against time.
Landscapes
- Health & Medical Sciences (AREA)
- Nuclear Medicine, Radiotherapy & Molecular Imaging (AREA)
- Physics & Mathematics (AREA)
- Life Sciences & Earth Sciences (AREA)
- Chemical & Material Sciences (AREA)
- Analytical Chemistry (AREA)
- Biochemistry (AREA)
- General Health & Medical Sciences (AREA)
- General Physics & Mathematics (AREA)
- Immunology (AREA)
- Pathology (AREA)
- Measuring Or Testing Involving Enzymes Or Micro-Organisms (AREA)
- Investigating, Analyzing Materials By Fluorescence Or Luminescence (AREA)
Description
Die Erfindung betrifft ein Verfahren zur Prüfung der Qualität und/oder Qualitätsänderung biologischer Systeme und/oder Lebensmittel und/oder mit diesen wechselwirkenden organisch-chemischen Verbindungen mit Hilfe der ultraschwachen Photonenemission. Die Methode besteht darin, eine sehr schwache Lichtemission aus biologischen Systemen und/oder ein schwaches Nachleuchten nach definierter Anregung der Probeobjekte mit moderner Technik meßbar darzustellen und mit bekannten Qualitätsnormen zu korrelieren.The invention relates to a method for checking the quality and / or change in quality of biological systems and / or foods and / or organic-chemical compounds interacting with them with the aid of ultra-weak photon emission. The method consists in measuring a very weak light emission from biological systems and / or a weak afterglow after a defined excitation of the test objects with modern technology and to correlate them with known quality standards.
Das Verfahren soll einerseits die Möglichkeit bieten, die Qualität eines biologischen Systems im Sinne von Erwin Schrödingers übergreifendem Qualitätsbegriff mit Hilfe von Meßparametern reproduzierbar wiederzugeben, andererseits aber auch durch Umwelteinflüsse auftretende oder durch unerwartete Wechselwirkungen mit gezielt eingesetzten chemischen Produkten verursachte Änderungen am Qualitätsinhalt biologischer Systeme unmittelbar anzuzeigen. Erwin Schrödinger geht von der Auffasung aus, daß Leben einen Zustand hoher Ordnung darstellt (E. Schrödinger: "Was ist Leben? Die lebende Zelle mit den Augen des Physikers betrachtet". Francke, Bern 1946, Sammlung Dalp, Bd. 1). Nahrung ist dabei in erster Linie ein Ordnungsfaktor, der dem Lebewesen hilft, seinen spezifischen Ordnungszustand aufzubauen und zu stabilisieren. Die Qualität eines Lebensmittels ist dann im Sinne Erwin Schrödingers lediglich ein Maß für die Fähigkeit der Nahrung, diese Aufgabe am Verbraucher zu erfüllen. Die Qualität eines biologischen Systems ist demgemäß eine Funktion dieses Ordnungszustandes. Wird der Ordnungszustand eines biologischen Systems durch Umwelteinflüsse oder sonstige unerwünschte Wechselwirkungen mit Fremdstoffen beeinträchtigt, so sinkt der Qualitätsinhalt dieses Systems.On the one hand, the method should offer the possibility to reproducibly reproduce the quality of a biological system in the sense of Erwin Schrödinger's overarching concept of quality with the help of measurement parameters, but on the other hand, it should also immediately indicate changes in the quality of biological systems caused by environmental influences or unexpected interactions with specifically used chemical products . Erwin Schrödinger assumes that life represents a state of high order (E. Schrödinger: "What is life? Looking at the living cell with the eyes of the physicist". Francke, Bern 1946, Dalp Collection, Vol. 1). Food is primarily an order factor that helps the living being to build up and stabilize its specific order status. In Erwin Schrödinger's sense, the quality of a food is then only a measure of the ability of the food to fulfill this task for the consumer. The quality of a biological system is therefore a function of this state of order. If the orderly state of a biological system is impaired by environmental influences or other undesirable interactions with foreign substances, the quality content of this system drops.
Bisher bekannte Verfahren zur Erfassung der Qualität und der Feststellung von Qualitätsänderungen biologischer Systeme beruhten auf der subjektiven sensorischen Beurteilung einzelner Personen, auf chemischen und biochemischen Analyseverfahren sowie auf physikalischen Verfahren, die sich u.a. bereits der Photonenemission aus biologischen Systemen bedienten. (DE-OS 3 038 255, DE-OS 3 040 855 und US-PS 4.458.531)Previously known methods for recording the quality and the determination of quality changes in biological systems were based on the subjective sensory assessment of individual people chemical and biochemical analysis methods as well as on physical methods that already use photon emission from biological systems. (DE-OS 3 038 255, DE-OS 3 040 855 and US-PS 4,458,531)
Sensorische Verfahren haben zwar den Vorteil, alle Einflußfaktoren berücksichtigen zu können, weisen aber den großen Nachteil auf, subjektiv und zumindest im Vergleich verschiedener prüfender Personen nur bedingt reproduzierbar zu sein. Im Falle von Lebensmittelprüfungen ist es sehr schwierig, vorurteilsfreie Kriterien für die Qualität verarbeiteter Produkte zu erstellen. Bei Frischprodukten ist eine Beurteilung nach überkommenen Normen eher möglich. So wurden DIN-Normen zur Schulung von Sensorikern erstellt, um diesen die Möglichkeit zu geben, mit Hilfe festgelegter statistischer Verfahren eine in gewissen Grenzen reproduzierbare Lebensmittelqualitätsprüfung zu ermöglichen. Diese Normen erstrecken sich sowohl auf Parameter wie Prüfraum, Prüfgut und Prüfverfahren, als auch auf die durch Geschmacksstoffe, Geruchsstoffe und Mikro- sowie Makrostruktur hervorgerufenen auslösenden Faktoren und Einzeleindrücke. Es hat sich aber auch gezeigt, daß sich die dabei verwendeten sensorischen Parameter bisher nicht durch chemische und physikalische Untersuchungsmethoden quantifizieren ließen.Although sensory methods have the advantage of being able to take all influencing factors into account, they have the great disadvantage of being subjectively reproducible, at least when comparing different test persons. In the case of food testing, it is very difficult to create unbiased criteria for the quality of processed products. For fresh products, an assessment based on traditional standards is rather possible. For example, DIN standards for the training of sensor technicians were created in order to give them the opportunity to use certain statistical methods to enable food quality testing to be reproduced within certain limits. These standards extend to parameters such as the test room, test material and test methods, as well as to the triggering factors and individual impressions caused by flavors, fragrances and micro and macro structure. However, it has also been shown that the sensory parameters used here have not hitherto been able to be quantified by chemical and physical examination methods.
Verfahren zur Erfassung von Qualitätsänderungen aufgrund äußerer Einflußfaktoren, insbesondere von Umweltschädigungen, beruhen auf dem Eisatz von Bioindikatoren, wobei deren Aussehen und Verhaltensweise beobachtet und registriert wird. Auch hier ist die Interpretation mehr oder weniger subjektiv. Ökotoxologische Prüfungen finden in mehreren Stufen statt und sind außerdem sehr zeitaufwendig (siehe Tabelle 1). In der Grundstufe wird die akute Toxizität einer Verbindung z.B. an einer Fischart und einer Wasserflohart nach einmaliger Applikation während eines Zeitraumes von 1 bis 4 Tagen bestimmt. In Stufe 1 wird die langfristige Toxizität anhand von Prüfparametern wie der Schwellenkonzentration, der No-observed-Effect-Concentration (NOEC-Werte) und letalen Dosen ermittelt, wobei u. U. über einen Zeitraum von vier Wochen beobachtet werden muß. Die Stufe 2 schließlich bildet ein individuelles stoffspezifisches Prüfprogramm, wobei versucht wird, aufgetretene Schädigungen im Vergleich mit einer Liste von 25 toxischen Verbindungen ("25-Stoffe-Programm", Tabelle 2) mehr oder weniger einzuordnen und dadurch qualitativ zu erfassen.Methods for recording quality changes due to external factors, in particular environmental damage, are based on the use of bioindicators, their appearance and behavior being observed and registered. Here too, the interpretation is more or less subjective. Ecotoxological tests take place in several stages and are also very time-consuming (see Table 1). In the basic level, the acute toxicity of a compound, for example on a fish species and a water flea species, is determined after a single application over a period of 1 to 4 days. In stage 1, long-term toxicity is determined using test parameters such as the threshold concentration, the no-observed effect concentration (NOEC values) and lethal doses. U. must be observed over a period of four weeks. Finally, level 2 forms an individual substance-specific test program, in which an attempt is made to more or less classify any damage that has occurred compared to a list of 25 toxic compounds ("25-substance program", Table 2) and thereby to record it qualitatively.
Die chemische und biochemische Analytik dagegen liefert eindeutig reproduzierbare Ergebnisse. Mit den unterschiedlichsten chemischen Analyseverfahren können damit schon geringste Spuren einzelner Stoffe nachgewiesen werden. Eine quantitative Auswertung und eine damit verbundene kausale Zuordnung für die Bewertung der Qualität eines biologischen Systems ist aber nur dann möglich, wenn gezielt nach dem jeweiligen Stoff gesucht wird. Synergistische Effekte solcher Stoffe (z.B. ein nicht-additives Verhalten) oder gar kooperatives Verhalten in Verbindung mit unbekannten Stoffen können damit nicht wahrgenommen werden. Zudem ist die quantitative Erfassung aller relevanten Einzelstoffe für eine Schadensbegutachtung außerordentlich zeitaufwendig.In contrast, chemical and biochemical analysis provides clearly reproducible results. With the most varied chemical analysis methods, even the slightest traces of individual substances can be detected. A quantitative evaluation and a related causal assignment for the evaluation of the quality of a biological system is only possible if a specific search is made for the respective substance. Synergistic effects of such substances (e.g. non-additive behavior) or even cooperative behavior in connection with unknown substances cannot be perceived. In addition, the quantitative recording of all relevant individual substances for damage assessment is extremely time-consuming.
Eine allgemein verbindliche Aussage zur Qualität von Ernteprodukten ist nur bedingt möglich. Sie hängt nämlich vom Prüfzeitpunkt nach der Ernte ab. So zeigen Pflanzen, die durch hohe Düngegaben jung gehalten wurden nach ihrer Ernte noch erhebliche Enzymaktivitäten. Dies schlägt dann bei der Lagerhaltung zu Buche und äußert sich in schneller Qualitätsabnahme während der Lagerung. Dazu kommen bei überdüngten Pflanzen noch labile Gewebestrukturen, die einem Befall mit Schadpilzen weniger Widerstand entgegensetzen. Ein zusätzlicher Nachteil besteht in der Tatsache, daß es sich bei den chemischbiochemischen Verfahren in der Regel um "zerstörende Verfahren" handelt.A generally binding statement on the quality of harvested products is only possible to a limited extent. It depends on the time of inspection after the harvest. Plants that have been kept young by high fertilization show considerable enzyme activities after harvesting. This then has an impact on warehousing and manifests itself in a rapid decrease in quality during storage. In addition, there are unstable tissue structures in over-fertilized plants, which offer less resistance to infestation with harmful fungi. An additional disadvantage is the fact that the chemical biochemical processes are usually "destructive processes".
Von den bisherigen Analyseverfahren unter Ausnutzung der Biophotonenemission beschreibt die DE-OS 30 38 255 die biologischen Wirkungen von äußeren Einflüssen auf Zellkollektive. Dabei wird die ultraschwache Photonenemission eines jeweils gesunden und sterbenden Zellkollektivs vor der Einwirkung des äußeren Einflusses mittels der Photonenzählstatistik gemessen. Sodann wird aus der Änderung der Photonenemission nach Einwirkung des äußeren Einflußes im Vergleich mit den unterschiedlichen Emissionen von gesundem und sterbendem Zellkollektiv auf einen schädigenden oder regenerierenden Charakter des äußeren Einflußes rückgeschlossen.DE-OS 30 38 255 describes the biological effects of external influences on cell groups from the previous analysis methods using the biophoton emission. The ultra-weak photon emission of a healthy and dying cell collective is measured before exposure to external influences using the photon count statistics. Then, from the change in the photon emission after the influence of the external influence in comparison with the different emissions of healthy and dying cell collective, it is concluded that the external influence is damaging or regenerating.
Die US-PS 4.458.531 beschreibt, wie mittels Messung der Intensität und/oder der Photonenzählstatistik die Einwirkung äußerer Faktoren auf Zellkollektive im Sinne von schädigendem oder regenerierendem Einfluß bestimmt werden kann.US Pat. No. 4,458,531 describes how the influence of external factors on cell groups in the sense of a damaging or regenerating influence can be determined by measuring the intensity and / or the photon counting statistics.
In einer früheren Veröffentlichung (F.-A. Popp, Biophotonen-analyse der Lebensmittelqualität, in: A. Meier-Ploeger, H. Vogtmann (Hrsg.), Lebensmittelqualität - ganzheitliche Methoden und Konzepte, Alternative Konzepte Bd. 66, Verlag C.F. Müller, Karlsruhe, Seiten 87 - 112) wurde bereits dargelegt, daß es prinzipiell möglich ist, minimale Unterschiede im Zustand biologischer Systeme, die durch äußere Einflußparameter hervorgerufen wurden mit Hilfe der ultraschwachen Photonenemission zu erfassen. So wurde gezeigt, daß z.B. verschiedene Gemüsearten unterschiedliche Photonenemissionsraten in Abhängigkeit von ihrer Anbauweise oder Eier unterschiedliche Emissionsraten in Abhängigkeit vom Haltungssystem der jeweiligen Hühner aufweisen. Das dabei verwendete Verfahren basierte aber lediglich auf der Prüfung einer unterschiedlichen Photonenzählstatistik und ließ somit nur Interpretationen über die Reaktion des jeweiligen biologischen Sytems auf die entsprechenden Einfluß- und Umweltfaktoren zu. Eine eindeutige Aussage aber über die Qualität im Sinne Schrödingers und damit über den Ordnungszustand des Systems war damit aber noch nicht möglich.In an earlier publication (F.-A. Popp, biophoton analysis of food quality, in: A. Meier-Ploeger, H. Vogtmann (ed.), Food Quality - Holistic Methods and Concepts, Alternative Concepts Vol. 66, Verlag CF Müller , Karlsruhe, pages 87-112) has already shown that it is possible in principle to detect minimal differences in the state of biological systems which were caused by external influencing parameters with the aid of the ultra-weak photon emission. It has been shown that e.g. different types of vegetables have different photon emission rates depending on their cultivation method or eggs have different emission rates depending on the husbandry system of the respective chickens. However, the method used was only based on the testing of different photon count statistics and thus only allowed interpretations about the reaction of the respective biological system to the corresponding influencing and environmental factors. However, a clear statement about the quality in the sense of Schrödinger and thus about the orderly state of the system was not yet possible.
Die vorliegende Erfindung hat daher zum Ziel, ein Verfahren zur Verfügung zu stellen, das es erlaubt, die Qualität biologischer Systeme nach dem umfassenden Qualitätsbegriff von Schrödinger reproduzierbar zu bestimmen bzw. Qualitätsänderungen zu verfolgen. Dies wird erreicht, indem Meßparameter der ultraschwachen Photonenemission mit den Methoden der vergleichenden statistischen Analyse mit vorgegebenen Qualitätskriterien für die Zustandsparameter des biologischen Systems und/oder Lebensmittels korreliert werden.The aim of the present invention is therefore to provide a method which makes it possible to reproducibly determine the quality of biological systems in accordance with Schrödinger's comprehensive concept of quality or to track changes in quality. This is achieved by correlating measurement parameters of the ultra-weak photon emission with the methods of comparative statistical analysis with specified quality criteria for the condition parameters of the biological system and / or food.
Als Meßparameter für die ultraschwache Photonenemisson können dabei sowohl statische als auch dynamische Kennwerte herangezogen werden. Als statische Kennwerte können z.B. dienen:
- die Eigenintensitäten DA der Proben ohne externe Anregung,
- die Intensitäten NB nach externer Anregung, ausgedrückt z.B. als Mittelwerte der ersten 20 - 50 Meßwerte nach der Anregung.
- the intrinsic intensities DA of the samples without external excitation,
- the intensities NB after external excitation, expressed, for example, as mean values of the first 20-50 measured values after the excitation.
Die externe Anregung kann mittels elektromagnetischer Strahlung, Ultraschall, thermischer Beeinflussung, chemischer Agenzien oder unter der Einwirkung von Organismen erfolgen. Strahlungsanregung kann im weißen Licht oder in verschiedenen Spektralbereichen bei diskreten Wellenlängen stattfinden. Die Anregungsleistung liegt dabei in der Regel im Bereich von 100 bis 300 Watt. Auch die Ultraschallanregung kann bei diskreten Wellenlängen erfolgen, üblicherweise mit Leistungen zwischen 10 bis 100 Watt. Bei Einsatz von thermischer Anregung bewegt man sich am günstigsten im Temperaturintervall von 0° bis 60°C. Bei Verwendung von externer Anregung wird die Varianz der gemessenen Photonenemission innerhalb eines bestimmten Meßintervalls bestimmt und der Mittelwert der ersten 20 bis 50 Meßwerte nach der Anregung als Meßparameter verwendet.External stimulation can be done by means of electromagnetic radiation, ultrasound, thermal influence, chemical agents or under the influence of organisms. Radiation excitation can take place in white light or in different spectral ranges at discrete wavelengths. The excitation power is usually in the range of 100 to 300 watts. Also the ultrasound excitation can be done at discrete wavelengths, usually with powers between 10 and 100 watts. When using thermal excitation, it is best to move in the temperature range from 0 ° to 60 ° C. If external excitation is used, the variance of the measured photon emission is determined within a certain measuring interval and the mean value of the first 20 to 50 measured values after the excitation is used as the measuring parameter.
Neben den stationären Kennwerten bieten dynamische Kennwerte die Möglichkeit das Abklingverhalten der Photonenemission aus den Proben exakt zu beschreiben. Hierfür dienen z.B. folgende Parameter:
- die Abklingfaktoren A einer angepaßten hyperbolischen Zerfallsfunktion i = io/tA, worin i die aktuelle Intensität, io die Anfangsintensität (erster Meßwert nach Anregung) und t die Zeit (in sec) bedeuten,
- die Fehlerabweichung Q H vom bestangepaßten hyperbolischen Abklingverhalten,
- Die normierte X²-Fehlerabweichung (X H ) vom bestangepaßten hyperbolischen Abklingverhalten,
- Das Verhältnis (X EH ) von der normierten X²-Fehlerabweichung von der bestangepaßten exponentiellen Abklingfunktion (X E ) zur normierten Fehlerabweichung von der bestangepaßten hyperbolischen Abklingfunktion (X H ),
- das gleiche Verhältnis für nicht normierte Abweichungen (Q EH )
- the decay factors A of an adapted hyperbolic decay function i = i o / t A , where i is the current intensity, i o is the initial intensity (first measured value after excitation) and t is time (in sec),
- the error deviation Q H from the best-matched hyperbolic decay behavior,
- The standardized X² error deviation ( X H ) from the best-matched hyperbolic decay behavior,
- The ratio ( X EH ) of the normalized X² error deviation from the best-matched exponential decay function ( X E ) to the normalized error deviation of the best-matched hyperbolic decay function ( X H ),
- the same ratio for non-standardized deviations ( Q EH )
Die so gewonnenen Meßparameter werden zusammen mit vorgegebenen Zustands- und Einflußparametern in einer Datenmatrix erfaßt und nach den üblichen Methoden der statistischen Analyse (Korrelations-, Faktoren- und Varianzanalyse) untersucht. Die Einflußparameter erhält man durch vergleichende Messungen von Proben, die verschiedenen Einflüssen wie z.B. Zucht, Anbau, Haltung, Behandlung, Bodenbeschaffenheit, Klima und anderen Umweltfaktoren unterlagen, während die Zustandsparameter durch Vergleichsmessungen aus Proben verschiedener Sorten, Konsistenz, Haltbarkeit, Vitalität u.ä. gewonnen werden. Die Einordnung dieser Proben in eine Qualitätskategorie erfolgte dabei nach den bisher bekannten Methoden der Ernährungsphysiologie, Lebensmittelchemie, Sensorik u.a. Zusätzliche Parameter können auch aus der Abhängigkeit der Photonenemission von der Menge des Probematerials sowie nach simulierter Verdauung durch in-vitro-Behandlung mit Enzymen gewonnen werden. Die vorliegende Erfindung bietet nun die Möglichkeit, die einmal nach der Einwirkung bestimmter Einflußparameter definierten Qualitätskategorien einer untersuchten Probe auch für Proben, die unbekannten Einflußparametern unterlagen über ihre aus der statistischen Analyse bestimmte Korrelation mit der ultraschwachen photonenemission festzulegen und so Rückschlüsse auf die unbekannten, die Qualitätskategorie bestimmenden Einflußparameter zu ermöglichen.The measurement parameters obtained in this way are recorded together with predefined state and influence parameters in a data matrix and examined according to the usual methods of statistical analysis (correlation, factor and variance analysis). The influencing parameters are obtained through comparative measurements of samples that were subject to various influences such as breeding, cultivation, keeping, treatment, soil conditions, climate and other environmental factors, while the condition parameters are obtained through comparative measurements from samples of different types, consistency, durability, vitality and the like. be won. The classification of these samples into a quality category was carried out according to the previously known methods of nutritional physiology, food chemistry, sensor technology, etc. Additional parameters can also be used the dependence of the photon emission on the amount of the sample material and after simulated digestion can be obtained by in vitro treatment with enzymes. The present invention now offers the possibility of defining the quality categories of an examined sample, once defined after the influence of certain influencing parameters, also for samples, the unknown influencing parameters being subject to their correlation with the ultra-weak photon emission determined from the statistical analysis, and thus drawing conclusions about the unknown, the quality category to enable determining influencing parameters.
Zur Bestimmung der Korrelationsfaktoren für die Erfassung umweltschädigender Einflüsse wählt man als Einflußparameter naheliegenderweise die vom Umweltbundesamt der Bundesrepublik Deutschland zusammengestellte 25-Stoffe Liste (Tabelle 2) und als Zustandsparameter die in den einzelnen Stufen der bisherigen Prüfmethode des Umweltbundesamts verwendeten Prüfparameter (Tabelle 1). Daraus kann dann die Korrelation der Photonenemission mit und ohne vorherige Anregung des biologischen Systems (Bioindikator oder Prüforganismus) sowie des Abklingverhaltens der Photonenemission mit den nach der bisherigen Methode gemessenen Schwankungsbreiten der stoffspezifischen Ergebnisse des jeweiligen Testsystems und der jeweiligen Prüfstufe erhalten werden. Ist diese Methode einmal in Bezug auf einen Prüforganismus standardisiert, können bestimmte Umweltgifte in Abhängigkeit von ihrer Konzentration nach spektraler Messung über die charakteristische Veränderung der Photonenemission des jeweiligen spezifischen Bioindikators erkannt oder zumindest eingegrenzt werden.In order to determine the correlation factors for the recording of environmentally harmful influences, one obviously selects the 25-substance list (Table 2) compiled by the Federal Environment Agency of the Federal Republic of Germany as the influencing parameter and the test parameters used in the individual stages of the previous testing method of the Federal Environment Agency (Table 1) as the status parameter. From this, the correlation of the photon emission with and without prior stimulation of the biological system (bio-indicator or test organism) and the decay behavior of the photon emission with the fluctuation ranges of the substance-specific results of the respective test system and the respective test level measured according to the previous method can be obtained. Once this method has been standardized with regard to a test organism, certain environmental toxins can be detected or at least limited depending on their concentration after spectral measurement via the characteristic change in the photon emission of the respective specific bio-indicator.
Darüber hinaus konnte beobachtet werden, daß die Lichtemissionen zweier voneinander getrennter, aber benachbarter biologischer Syteme miteinander in Korrelation treten. Die Emissionsraten der jeweiligen Systeme werden dabei über separate Lichtwege mit eigener Photomultiplieranordnung gemessen. Geringste Schwankungen in der Lichtemission des einen Systems, etwa über Beeinflussung durch Fremdstoffe, können über eine Feinstanalyse der korrelierten Photonenemission des anderen Systems nachgewiesen werden. Dies bietet die Möglichkeit, unmittelbar auftretende Umwelteinflüsse oder gar irreversible Schädigungen in dem einen Sytem über die korrelierte Veränderung im Emissionsverhalten des anderen biologischen Systems synchron zu verfolgen.

Das Abklingverhalten nach vorheriger Anregung bildet ein besonders wichtiges Kriterium zur Beurteilung der Vitalität eines lebenden Systems, insbesondere bei der Bewertung von Umweltschädingungen sowie für prognostische Folgerungen. Geht man davon aus, daß Biophotonen u.a. einen großen Anteil an der Regulation des Zellgeschehens haben, dann ist zu erwarten, daß aus der Messung der Photonenemission biologischer Systeme auch Rückschlüsse auf die Konstitution der jeweiligen biologischen Systeme möglich sind. Als Kriterium

für eine Umweltbelastung könnte dann die Reversibilität einer Änderung der Biophotonenemission nach Entfernung der schädigenden Einflußgröße definiert werden, während Umweltschädigungen irreversible Photonenemissionsänderungen hervorrufen. Es ist einleuchtend, daß vorzugsweise die Abklingparameter der Photonenemission der Lebensmittel und biologischen Systeme unter dem Aspekt der Kohärenz und Inkohärenz miteinander verglichen und in Beziehung gesetzt werden. Dies ist umso einfacher, als seit kurzem bekannt ist, daß allein der hyperbolische Verlauf einer Abklingkurve eine hinreichende Bedingung für die Kohärenz des Lichtspeichers darstellt (F.A.POPP. K.H. LI, 1989). Das Abklingverhalten ist dabei umso besser zu interpretieren, je kürzer die Meßintervalle der Photonenemission gewählt werden. Diese liegen in der Größenordnung von ms bis us. für Feinstmessungen vorzugsweise unter 25 ms.The decay behavior after previous suggestion forms a particularly important criterion for assessing the vitality of a living system, in particular when assessing environmental damage and for prognostic consequences. If one assumes that biophotons have a large part in the regulation of cellular activity, then it can be expected that the measurement of the photon emission of biological systems can also be used to draw conclusions about the constitution of the respective biological systems. As a criterion
The reversibility of a change in the biophoton emission after removal of the damaging influencing variable could then be defined for environmental pollution, while environmental damage causes irreversible changes in the photon emission. It is obvious that preferably the decay parameters of the photon emission of the Food and biological systems are compared and related in terms of coherence and incoherence. This is all the easier since it has recently become known that the hyperbolic course of a decay curve alone is a sufficient condition for the coherence of the light store (FAPOPP. KH LI, 1989). The decay behavior is to be interpreted better the shorter the measuring intervals of the photon emission are chosen. These range from ms to us. for very fine measurements, preferably less than 25 ms.
Die Vorteile des oben beschriebenen Verfahrens liegen in der Verfügbarkeit einer Methode für eine umfassende Qualitätsprüfung, mit der der übergreifende Qualitätsbegriff im Sinne Erwin Schrödingers quantifizierbar wird. Im Gegensatz zu anderen "ganzheitlichen" Verfahren der Qualitätsprüfung erweist sich dieses Verfahren als objektiv reproduzierbar. Das Verfahren ist unabhängig von der bedienenden Person, nur von den Parametern der Messung selbst abhängig und führt immer wieder zu denselben Meßergebnissen innerhalb eines angebbaren Meßfehlerbereichs. Im Falle von Eigenemissionsmessungen überschreitet die Reproduzierbarkeit der Methode auch bei Messungen über längere Zeiträume nicht die Fehlergrenze von 10% und im Falle von Anregungsexperimenten nicht von 5%.The advantages of the procedure described above lie in the availability of a method for a comprehensive quality inspection with which the overarching concept of quality can be quantified in the sense of Erwin Schrödinger. In contrast to other "holistic" quality inspection procedures, this procedure proves to be objectively reproducible. The method is independent of the operator, only dependent on the parameters of the measurement itself and always leads to the same measurement results within a specified measurement error range. In the case of self-emission measurements, the reproducibility of the method does not exceed the error limit of 10%, even in the case of measurements over longer periods, and not more than 5% in the case of excitation experiments.
Mit der Photonenemission der Proben steht ein Strukturparameter zur Verfügung, der in unmittelbarem Zusammenhang mit den Lebensprozessen des dem Lebensmittel bzw. biologischen System bzw. biologischen Organismus zugrundeliegenden lebenden Systems steht bzw. mit den Wechselwirkungsprozessen von lebendem System und organisch-chemischer Verbindung. Jede noch so kleine Änderung der Struktur eines Lebensmittels oder biologischen Systems kann mit Hilfe einer äußerst empfindlichen Apparatur signifikant erfaßt werden. Die für die Durchführung solcher Messungen erforderliche Empfindlichkeit liegt im Leistungsbereich von 10⁻¹⁵ bis 10⁻¹⁷ Watt.With the photon emission of the samples, a structural parameter is available that is directly related to the life processes of the living system on which the food or biological system or biological organism is based, or to the interaction processes of the living system and organic chemical compound. Every little change in the structure of a food or biological system can be detected significantly with the help of extremely sensitive equipment. The sensitivity required to carry out such measurements is in the power range from 10⁻¹⁵ to 10⁻¹⁷ watts.
Die mit der Erfindung erzielbaren Vorteile in der praktischen Anwendung beruhen
- auf der hohen Reproduzierbarkeit des Verfahrens,
- auf der hohen Sensitivität der Methode gegenüber Veränderungen in der Qualität biologischer Systeme, gleichgültig ob es sich dabei um Alterungsprozesse, Sortenwahl, Aufbereitung, Konservierung oder Schadstoffbelastung handelt,
- auf der Möglichkeit, prospektive Aussagen über zu erwartende Qualitätsänderungen zu machen, z. B. bei bestimmter Lagerhaltung. Konservierung, Verarbeitung, Schadstoffbelastung u.ä.,
- auf der Aussieht, für die Qualität nachteilige oder schädliche Komponenten zu erkennen, sie zumindest teilweise zu identifizieren und zu entfernen,
- auf der im Vergleich mit herkömmlichen Verfahren äußerst kurzen Auswertungszeit, wobei schon innerhalb weniger Minuten aussagekräftige Ergebnisse erhalten werden können,
- auf der Möglichkeit, schnelle und präzise Aussagen über die Bioverträglichkeit neu konzipierter organisch-chemischer Verbindungen zu treffen,
- auf dem fast unmittelbaren Ansprechen auf Umweltschädigungen, die eine äußerst frühzeitige Schadensbegrenzung bzw. Schadensverhinderung erlauben,
- auf der Möglichkeit, das Verfahren mit Hilfe von Computerprogrammen oder Softwarepaketen zu automatisieren und somit eine standardisierte Auswertung der statischen und dynamischen Meßparameter zu ermöglichen.
- on the high reproducibility of the process,
- on the high sensitivity of the method to changes in the quality of biological systems, irrespective of whether these are aging processes, variety selection, preparation, preservation or pollution,
- on the possibility of making prospective statements about expected quality changes, e.g. B. in certain warehousing. Conservation, processing, pollution, etc.,
- on the appearance of recognizing components which are disadvantageous or harmful to the quality, at least partially identifying and removing them,
- on the extremely short evaluation time in comparison to conventional methods, meaningful results can be obtained within a few minutes,
- the possibility of making quick and precise statements about the biocompatibility of newly designed organic chemical compounds,
- on the almost immediate response to environmental damage, which allows extremely early damage limitation or prevention,
- on the possibility of automating the process with the aid of computer programs or software packages and thus enabling standardized evaluation of the static and dynamic measurement parameters.
Die vorliegende Erfindung bietet vielfache Möglichkeiten im industriellen Einsatz. Sie ist ein ideales Verfahren bei der Wareneingangs- und -ausgangskontrolle z. B. im Lebensmittelhandel. Weiterhin ergibt sich die Möglichkeit einer Feststellung von "biologisch" angebauter Ware im Hinblick auf eine Kontrolle dieser Waren-bezeichnung. Bei ausreichender Kenntnis eines Produkts ist eine Identifizierung von "biologischer" und "nicht-biologischer" Ware möglich. Umgekehrt läßt sich aber auch eine systematische Verbesserung landwirtschaftlicher Produktionsmethoden erreichen. So können gezielt bestimmte Qualitätsmerkmale wie z.B die Haltbarkeit eines Lebensmittels oder die Vitalität von Samen erfaßt und kontrolliert werden. Dies bietet nicht nur für Produzenten und Händler neue Perspektiven der Qualitätssicherung und - optimierung, sondern auch für den Verbraucher eröffnet sich die Möglichkeit einer größeren Sicherheit bei der Auswahl des Nahrungsangebots. Aufgrund der fast unmittelbaren Ansprechbarkeit des Systems auf Umwelteinflüsse, wird der Umweltschutz in die Lage versetzt, nicht nur aufgetretene Schädigungen möglichst schnell zu erfassen und einzuordnen, sondern über die Möglichkeit einer Automatisierung sowohl rechtzeitig Alarm auszulösen als auch eine weitere Schädigung frühzeitig zu unterbinden.The present invention offers numerous possibilities in industrial use. It is an ideal process for incoming and outgoing goods inspection, e.g. B. in the food trade. Furthermore, there is the possibility of determining "organically" grown goods with a view to checking this product name. With sufficient knowledge of a product, it is possible to identify "organic" and "non-organic" goods. Conversely, a systematic improvement in agricultural production methods can also be achieved. In this way, specific quality characteristics such as the shelf life of a food or the vitality of seeds can be recorded and controlled. This not only offers new perspectives for quality assurance and optimization for producers and retailers, but also for consumers the possibility of greater security when choosing the food offer. Due to the almost immediate responsiveness of the system to environmental influences, environmental protection is not only able to record and classify any damage that has occurred as quickly as possible, but also to trigger an alarm in good time and prevent further damage at an early stage using the option of automation.
Über das Abklingverhalten kann aber nicht nur der jeweils aktuelle Qualitätsinhalt bzw. nach Korrelation der dynamischen Meßparameter mit geeigneten phänotypischen Zustandgrößen der biologischen Systeme auch Prognosen für das weitere Qualitätsverhalten abgegeben werden. Infolge Induzierung adäquater chemischer Reaktionen zwischen biologischen Systemen und komplexen organisch-chemischen Verbindungen und der daraus resultierenden Biophotonenabstrahlung lassen sich Voraussagen treffen über die Verträglichkeit von biologischem System und organisch-chemischen Verbindungen. Dies bietet Einsatzmöglichkeiten des Verfahrens, die sich von der Beurteilung von Verpackungsmaterialien für Lebensmittel über Voraussagen der Gewebeverträglichkeit von Kunststoffen bei der Verwendung in der Chirurgie bis hin zu Prognosen über zu erwartende Nebenwirkungen neuer Arzneimittel erstrecken können.The decay behavior can not only be used to provide the current quality content or, after correlating the dynamic measurement parameters with suitable phenotypic state variables of the biological systems, predictions for the further quality behavior. Due to the induction of adequate chemical reactions between biological systems and complex organic-chemical compounds and the resulting biophoton radiation, predictions can be made about the compatibility of the biological system and organic-chemical compounds. This offers possible uses of the method, which can range from the assessment of packaging materials for food to predictions of the tissue compatibility of plastics when used in surgery to prognoses of the expected side effects of new drugs.
Die Leistungsfähigkeit der Erfindung soll nun anhand der nachfolgenden Beispiele näher erläutert werden. Es zeigen:
- Beispiel 1
- eine Datenmatrix zur Erstellung einer Korrelations-, Varianz- und Faktorenanalyse für verschiedene Getreideproben (Körner, Mehl und Flocken),
- Beispiel 2
- die Reproduzierbarkeit des Verfahrens anhand willkürlich herausgegriffener Meßwerte einer Getreidesorte über einen Zeitraum von 5 Tagen,
- Beispiel 3
- die Lichtspeicherfähigkeit biologischer Systeme in Abhängigkeit von deren Qualität bzw. Haltbarkeit,
- Beispiel 4
- die Abhängigkeit der Lichtspeicherfähigkeit von Qualität und Menge des eingesetzten Probematerials,
- Beispiel 5
- die Korrelation des Abklingverhaltens der Photonenemission zu Vitalität bzw. Keimfähigkeit von Saatgut,
- Beispiel 6
- die Trennschärfe der Methode anhand der Qualitätsbestimmung von Saatgut,
- Beispiel 7
- die Abhängigkeit der Photonenemission von unterschiedlichen Spektralbereichen bei der Lichtanregung,
- Beispiel 8
- die Abhängigkeit der Photonenemission von unterschiedlichen Spektralbereichen bei der Messung,
- Beispiel 9
- das langfristige Lumineszenzverhalten eines Lebensmittels nach Anregung (Wurst),
- Beispiel 10
- Unterschiede in der Photonenemission bestrahlter Ware am Beispiel von Pfeffer, gemessen ein Jahr nach der Bestrahlung,
- Beispiel 11
- den Verlauf der Photonenemission eines Bioindikators unter der Einwirkung zunehmender Konzentrationen eines Herbizids,
- Beispiel 12
- die Änderung der Photonenemission verschiedener Bioindikatoren nach Zugabe verschiedener Giftstoffe,
- Beispiel 13
- Korrelationen der spontanen Lichtemission zweier benachbarter biologischer Systeme.
- example 1
- a data matrix to create a correlation, variance and factor analysis for different grain samples (grains, flour and flakes),
- Example 2
- the reproducibility of the method based on randomly selected measured values of a cereal type over a period of 5 days,
- Example 3
- the light storage capacity of biological systems depending on their quality or durability,
- Example 4
- the dependence of the ability to store light on the quality and quantity of the sample material used,
- Example 5
- the correlation of the decay behavior of the photon emission to the vitality or germination capacity of seeds,
- Example 6
- the selectivity of the method based on the quality determination of seeds,
- Example 7
- the dependence of the photon emission on different spectral ranges during light excitation,
- Example 8
- the dependence of the photon emission on different spectral ranges during the measurement,
- Example 9
- the long-term luminescence behavior of a food after stimulation (sausage),
- Example 10
- Differences in the photon emission of irradiated goods using the example of pepper, measured one year after the irradiation,
- Example 11
- the course of the photon emission of a bio-indicator under the influence of increasing concentrations of a herbicide,
- Example 12
- the change in the photon emission of various bioindicators after the addition of various toxins,
- Example 13
- Correlations of the spontaneous light emission of two neighboring biological systems.
Für eine Korrelationsanalyse wird die Haltbarkeit von vier verschiedenen Getreidesorten anhand der Datenmatrix bestimmt. Je 10 Proben von Körnern, Mehl und Flocken werden im Sommer (So) und anschliessend im Winter (Wi) gemessen und auf ihre Pentan- und Sauerstoffwerte untersucht. Diese bilden die Zustansparameter für die Haltbarkeit der Proben. Hohe Pentanwerte (und dementsprechend niedrige Sauerstoffwerte) sind ein Kriterium für geringe Haltbarkeit und umgekehrt.For a correlation analysis, the shelf life of four different types of grain is determined using the data matrix. 10 samples each of grains, flour and flakes are measured in summer (Sun) and then in winter (Wi) and examined for their pentane and oxygen values. These form the condition parameters for the durability of the samples. High pentane values (and accordingly low oxygen values) are a criterion for low durability and vice versa.
Als Meßparameter werden herangezogen:
- Die Eigenintensität DA der Proben ohne externe Anregung in counts/sec,
- die Intensitätsmittelwerte NB der ersten 20 Meßwerte nach externer Anregung in counts/sec
- die Abklingfaktoren A einer angepaßten hyperbolischen Zerfallsfunktion nach externer Anregung
- die Fehlerabweichung Q H vom bestangepaßten hyperbolischen Abklingverhalten
- die normierte Fehlerabweichung X H vom bestangepaßten hyperbolischen Abklingverhalten
- das Verhältnis X EH der normierten Fehlerabweichungen von der bestangepaßten exponentiellen Abklingfunktion XE zur bestangepaßten hyperbolischen Abklingfunktion XH
- das gleiche Verhältnis Q EH für nicht normierte Fehlerabweichungen
- der erste Meßwert NB o nach Anregung in 1000 counts/sec
- The intrinsic intensity DA of the samples without external excitation in counts / sec,
- the mean intensity values NB of the first 20 measured values after external excitation in counts / sec
- the decay factors A of an adapted hyperbolic decay function after external excitation
- the error deviation Q H from the best matched hyperbolic decay behavior
- the normalized error deviation X H from the best-matched hyperbolic decay behavior
- the ratio X EH of the normalized error deviations from the best matched exponential decay function X E to the best matched hyperbolic decay function X H
- the same ratio Q EH for non-standard error deviations
- the first measured value NB o after excitation in 1000 counts / sec
Die Datenmatrix ist in Tabelle 3 wiedergegeben.The data matrix is shown in Table 3.
In Abbildung 1 sind die Pentan- und Sauerstoffwerte der entsprechenden Probenummern einander gegenübergestellt. Wie ersichtlich verhalten sich die beiden Parameter antikorrelativ, d.h. zunehmenden Pentanwerten und damit abnehmender Haltbarkeit entsprechen abnehmende Sauerstoffwerte.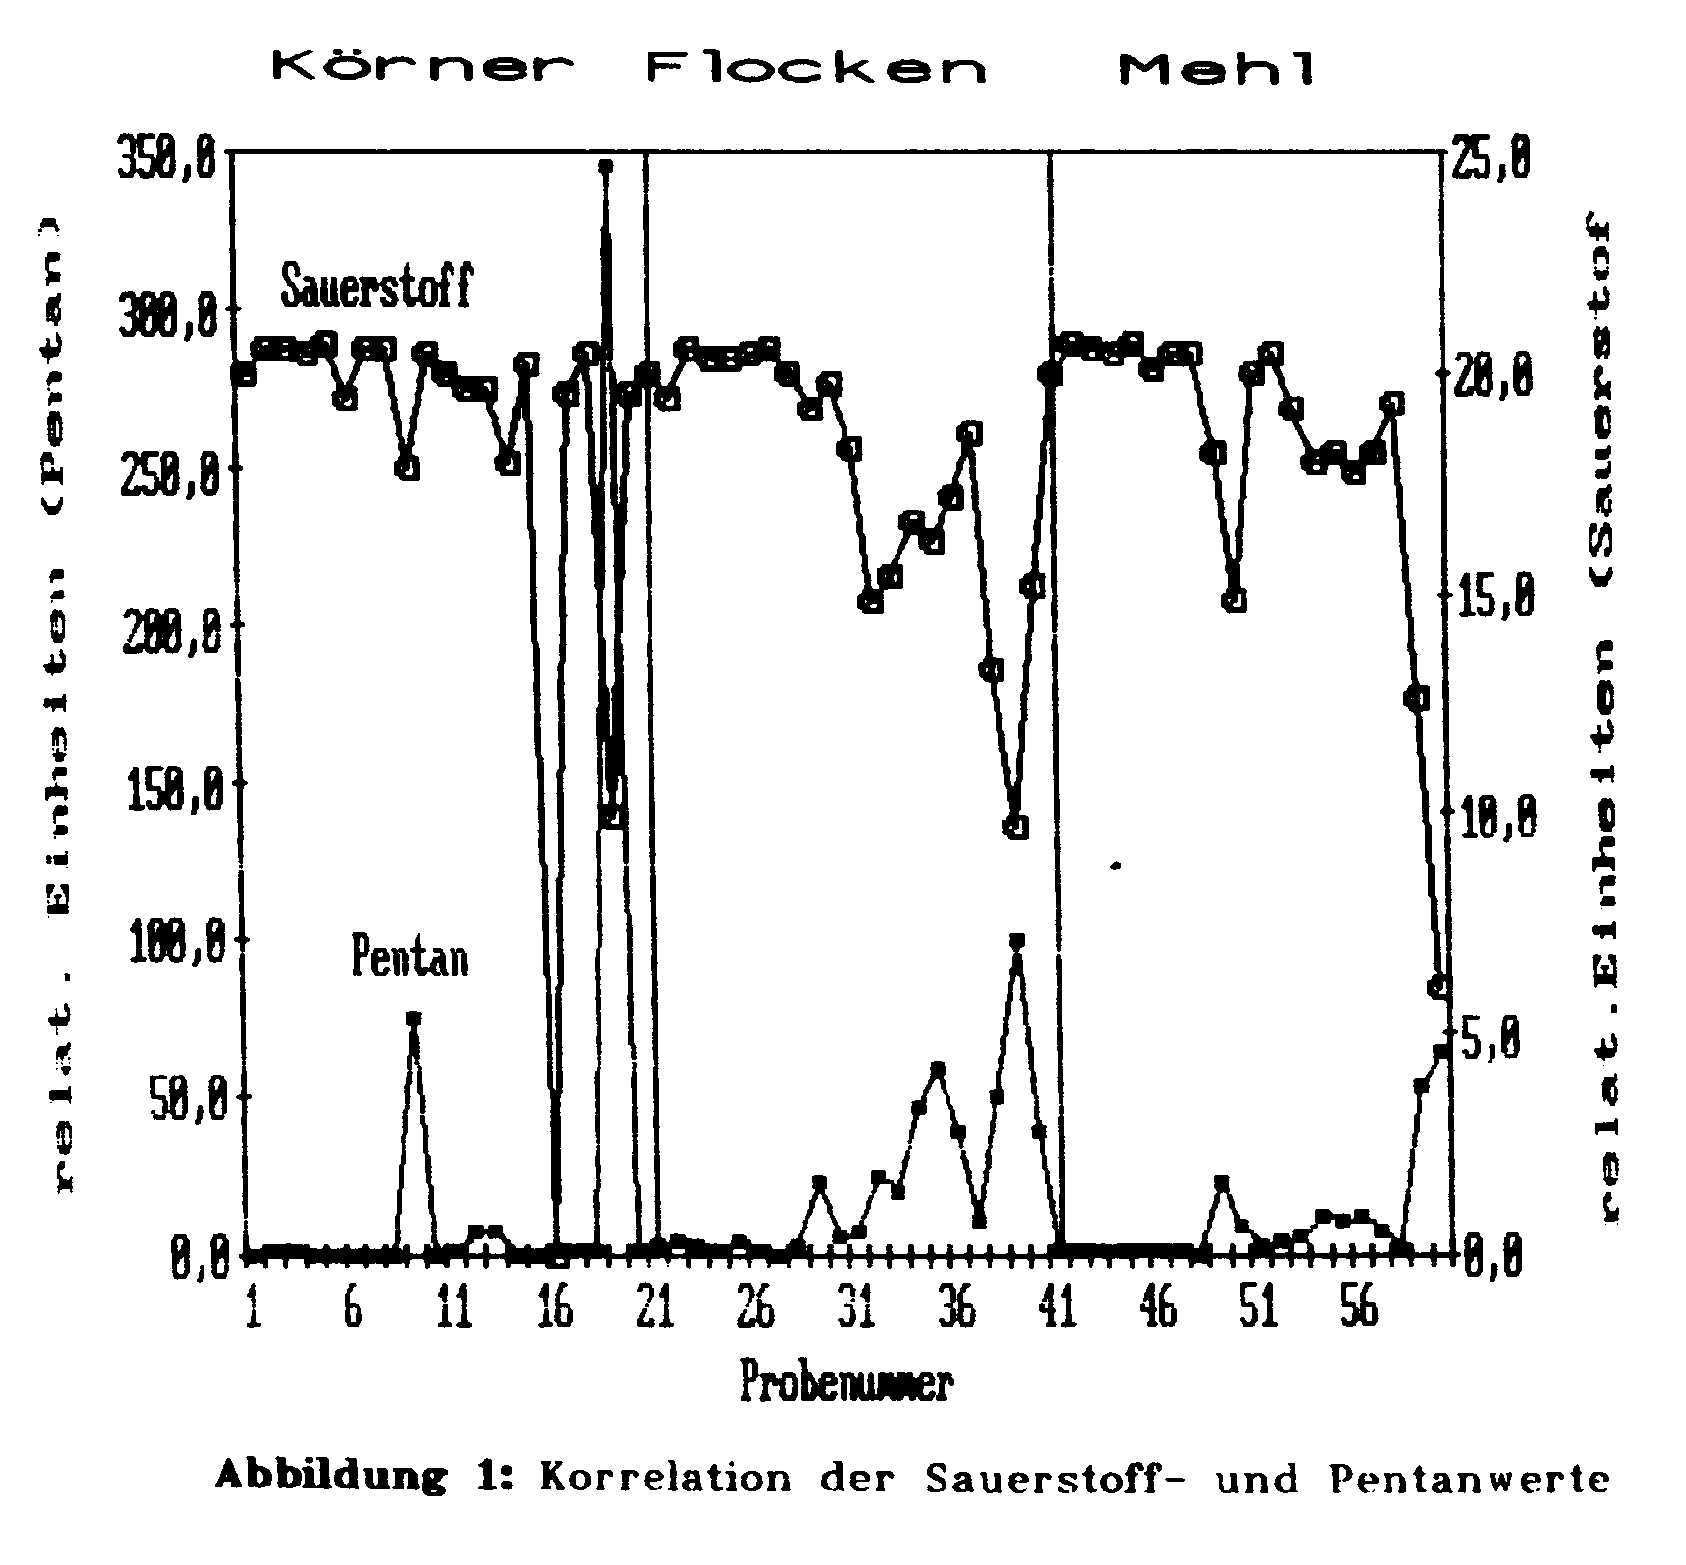


Schon ohne Korrelationsanalyse läßt sich aus der Datenmatrix erkennen, daß bei Körnern (schwächer ausgeprägt bei Mehl) mit zunehmendem Pentanwert und entsprechend abnehmendem Sauerstoffwert die Werte für DA, NB, NBo, XH, XEH, und A ansteigen und daß bei Flocken mit zunehmendem Pentanwert nur DA ansteigt, während die Werte für NB, NBo, XH und XEH abfallen.Even without a correlation analysis, it can be seen from the data matrix that the values for DA, NB, NB o , X H , X EH , and A for grains (less pronounced for flour) increase with increasing pentane value and correspondingly decreasing oxygen value, and that with flakes, too increasing pentane value only increases DA, while the values for NB, NB o , X H and X EH decrease.
Eine genaue Korrelationsanalyse aus der Datenmatrix ergibt die in Tabelle 4 wiedergegebenen Korrelierbarkeiten zwischen den Einflußgrößen und den Meßparametern:
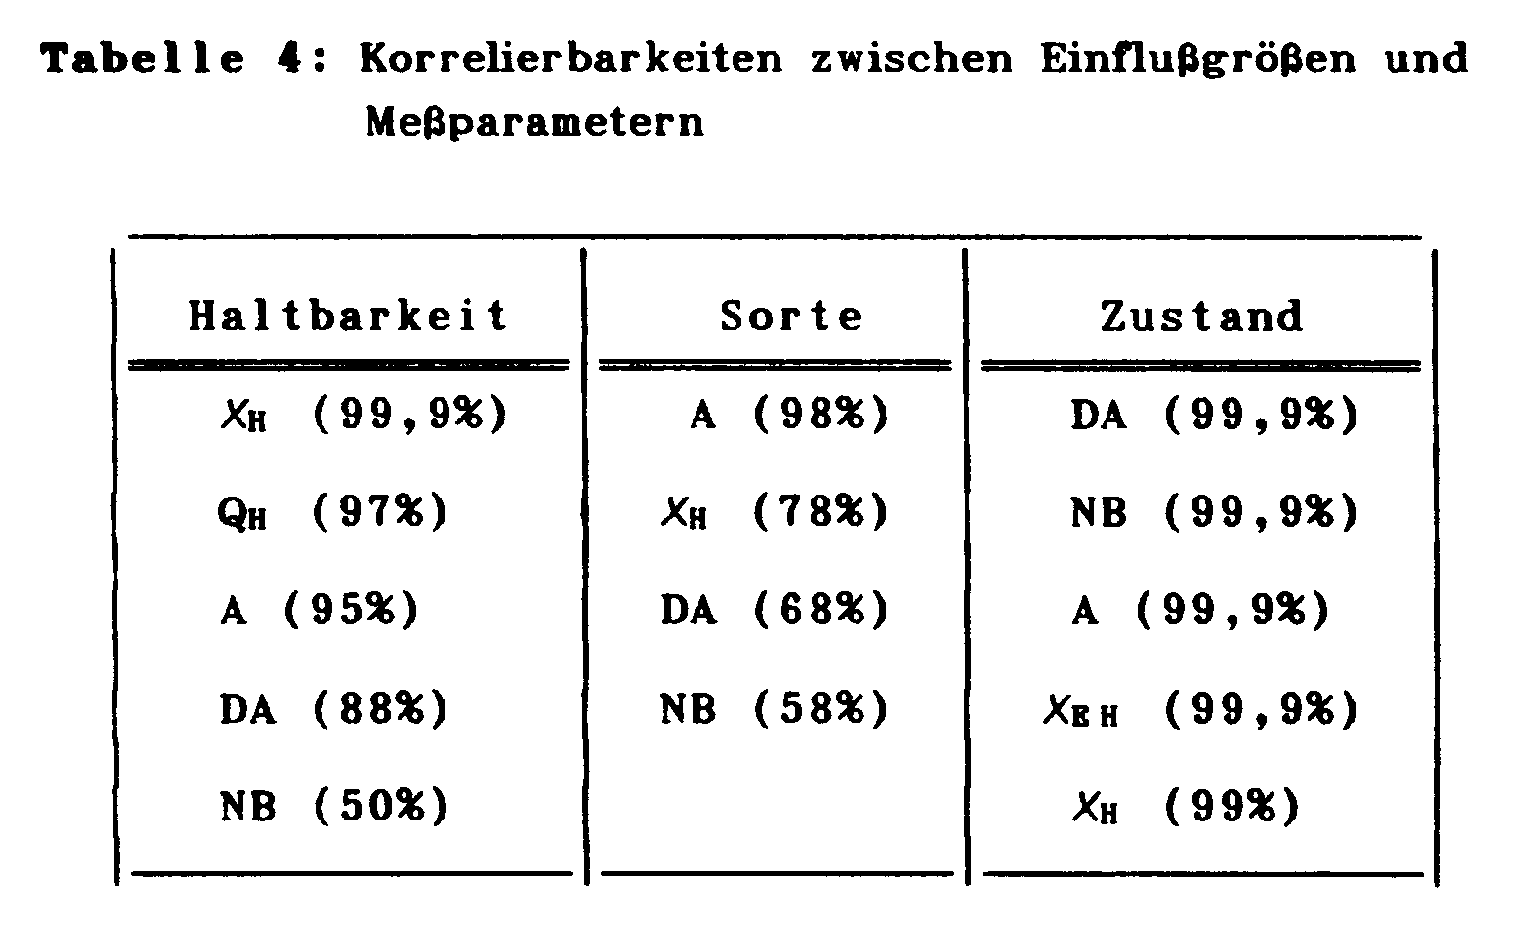
Die Pentan- und Sauerstoffwerte verhalten sich nur zur Haltbarkeit korrelativ (99,9%). Mit Sorte und Zustand treten sie nur in wesentlich geringerem Maße in Korrelation. (Sorte: ca. 60%; Zustand: ca. 10%).The pentane and oxygen values are only correlative to durability (99.9%). They only correlate much less with type and condition. (Variety: approx. 60%; condition: approx. 10%).
Die einzelnen Meßwerte aus der Datenmatrix lassen sich über die Faktorenanalyse in mehrere Komponenten x₁f₁ + x₂f₂ + ...+ x₇f₇ zerlegen. Dabei bedeuten f₁ bis f₇ die Faktoren, mit denen die Getreideproben korrelativ gekennzeichnet werden können. Ihre unterschiedlichen Wichtigkeiten sind in Tabelle 5 wiedergegeben.

Den Beitrag der Faktoren f₃ bis f₇ zum jeweiligen Meßwert der einzelnen Parameter zeigt Tabelle 6.

Daraus geht hervor, daß sich Körner (Mehl) und Flocken im wesentlichen nur durch die zwei Faktoren f₁ und f₂ kennzeichnen lassen, die zusammen mehr als 95% der Eigenschaften bestimmen. Aus Tabelle 5 läßt sich entnehmen, daß sich ihre Wichtigkeiten |f₁|:|f₂| etwa wie 4:1 verhalten.It follows that grains (flour) and flakes can essentially only be characterized by the two factors f 1 and f 2, which together determine more than 95% of the properties. It can be seen from Table 5 that their importance | f₁ |: | f₂ | behave like 4: 1.
Für Körner und Flocken ergeben sich nach Rotation die in Tabelle 7 wiedergegebenen idealisierten Werte für die beiden Faktoren.

Aus Tabelle 7 läßt sich entnehmen, daß die Faktoren von Körnern und Flocken durch Transformationen ineinander übergehen, indem teilweise bestimmte Korrelationen in Antikorrelationen umgewandelt werden. So ändert sich beim Übergang vom Zustand "Korn" zum Zustand "Flocke" in Bezug auf den Faktor 1 die Korrelation <f₁, NB> in <-f₁, NB>, <f₁, A> in <-f₁, A>, <f₁, XH> in <-f₁, XH> und <f₁, XEH> in <-f₁, XEH>. Beim Faktor 2 ändern sich entsprechend <f₂, Pentan> in <-f₂, Pentan> und <f₂, NB> in <-f₂, NB>.It can be seen from Table 7 that the factors of grains and flakes merge into one another by transformations, in some cases by converting certain correlations into anti-correlations. Thus, in the transition from the "grain" state to the "flake" state, the correlation <f 1, NB> in <-f 1, NB>, <f 1, A> in <-f 1, A>, <in relation to the factor 1 changes f₁, X H > in <-f₁, X H > and <f₁, X EH > in <-f₁, X EH >. In the factor 2 change accordingly <f₂, pentane> in <-f₂, pentane> and <f₂, NB> in <-f₂, NB>.
Das bedeutet, daß bei Körnern die Eigenintensität sowie die Intensität nach Anregung stets mit der Haltbarkeit korrelieren, nicht aber bei Flocken. Beim Übergang von Körnern zu Flocken dreht sich, entsprechend der Vorzeichenumkehr von Faktor 1, der Einfluß der Zerfallskinetik gerade um.This means that with grains the intrinsic intensity and the intensity after stimulation always correlate with the shelf life, but not with flakes. At the transition from grains to flakes, the influence of the decay kinetics is reversed in accordance with the sign reversal of factor 1.
Offenbar gibt es zwei, teilweise gegenläufige Mechanismen im Korn, von denen der eine, dem der Faktor 1 zugeordnet werden kann, Licht rasch abgibt. Es könnte sich dabei um geordnete oxidative Prozesse handeln. Die Antikorrelation zu XH beweist, daß es sich nicht um spontane Lichtemission handeln kann. Der zweite Wirkungsprozeß, dem f₂ zugeordnet werden kann, läßt sich als eine gewisse Aufnahmebereitschaft für Licht deuten. Auch dieser Faktor führt nach Anregung zu einem raschen Abklingen. Er könnte als eine geordnete Lichtspeicherung gedeutet werden. Mit der Speicherfähigkeit sinkt der Pentanwert, entsprechend einer höheren Haltbarkeit. Mit Ausnahme der Körner mit hohen Pentanwerten zeigen fast alle Proben eine starke Beteiligung des Faktors f₂.Apparently there are two, partly opposing mechanisms in the grain, of which the one to which the factor 1 can be assigned emits light quickly. These could be ordered oxidative processes. The anti-correlation to X H proves that it cannot be about spontaneous light emission. The second process of action, which can be assigned to f₂, can be interpreted as a certain willingness to take in light. This factor also leads to a rapid decay after stimulation. It could be interpreted as an orderly storage of light. With the storage capacity, the pentane value decreases, corresponding to a higher durability. With the exception of the grains with high pentane values, almost all samples show a strong involvement of the factor f₂.
Die Umkehrung von Komponenten des Faktors f₁ beim Übergang vom Korn zur Flocke weist darauf hin. daß der gleiche Prozeß, der im Korn als aktive chemische Reaktion abläuft, nur noch durch Licht oder andere Einflüsse (z.B. Ultraschall, Temperatur etc.) von außen angeregt werden kann, sobald die Vitalität des Korns verloren geht. Auch bei Betrachtung der Komponenten des Faktors f₂ liegt eine ähnliche Umorientierung, z.B. von aktiver Lichtspeicherfähigkeit zu passiver, sehr langsamer Lichtabgabe vor. Da die Faktorenanalyse aber keine physikalische Interpretation erlaubt, dürfen diese hypothetischen Schlußfolgerungen nicht überinterpretiert werden.The reversal of components of the factor f 1 at the transition from the grain to the flake indicates this. that the same process that takes place in the grain as an active chemical reaction can only be stimulated from outside by light or other influences (e.g. ultrasound, temperature, etc.) as soon as the vitality of the grain is lost. When looking at the components of factor f₂ there is a similar reorientation, e.g. from active light storage capability to passive, very slow light emission. However, since factor analysis does not allow physical interpretation, these hypothetical conclusions must not be over-interpreted.
Als wesentliche Folgerung aus den angeführten statistischen Ergebnissen läßt sich die Tatsache ableiten, daß die Eigenschaften der Flocken einschließlich ihrer Haltbarkeit aus den Daten der Körner vorherbestimmt werden können, ebenso, wie aus den gewonnen Daten der Flocken auf die Eigenschaft der Körner, aus denen sie hervorgingen, rückgeschlossen werden kann.The main conclusion to be drawn from the statistical results given is the fact that the properties of the flakes, including their durability, can be determined from the data of the grains, as well as from the data obtained on the properties of the grains from which they were derived , can be concluded.
Ganz allgemein gilt. Wenn die Probe x des Korns durch die meßbaren Komponenten x₁ f₁ + x₂ f₂ gekennzeichnet wird, worin f₁ und f₂ die in Tabelle 5 benannten Fatoren für die Körner darstellen, dann sind die Flocken näherungsweise durch die Komponenten x₁ f₁ ′ - x₂ f₂ ′ bestimmt, wobei f₁′ und f₂′ durch die Vorzeichenumkehr der Komponenten NB, A, XH und XEH im Falle des Übergangs von f₁ nach f₁′ und der Komponenten Pentan und NB beim Übergang von f₂ nach f₂′ aus f₁ bzw. f₂ hervorgehen.Generally applies. If the sample x of the grain is characterized by the measurable components x₁ f₁ + x₂ f₂, where f₁ and f₂ represent the fators for the grains specified in Table 5, then the flakes are approximately determined by the components x₁ f₁ ′ - x₂ f₂ ′, where f₁ 'and f₂' by the sign reversal of the components NB, A, X H and X EH in the case of the transition from f₁ to f₁ 'and the components pentane and NB in the transition from f₂ to f₂' emerge from f₁ and f₂.
Dieses Beispiel dient zur Demonstration der Reproduzierbarkeit der Meßwerte. In Tabelle 8a werden willkürlich herausgegriffene Meßwerte von 1 g der Getreidesorte Blé Alimentaire gezeigt, die im Abstand von 5 Tagen jeweils viermal hintereinander bestimmt wurden. In Tabelle 8b sind Kontrollmessungen an Styropor mit einer vollgefüllten Küvette wiedergegeben.This example serves to demonstrate the reproducibility of the measured values. Table 8a shows randomly selected measurements of 1 g of the grain type Blé Alimentaire, which were determined four times in succession at intervals of 5 days. Control measurements on polystyrene with a fully filled cuvette are shown in Table 8b.
Durch Vergleich des prozentualen Fehlers aus Tabelle 8a und 8b läßt sich ersehen, daß die Streuungen durch Inhomogenitäten des Probematerials wesentlich höher liegen als die Meßfehler. Die Unterschiede, die grundsätzlich noch sicher mit der Methode erkannt werden können liegen in der Größenordnung von 5% der Meßgröße.


In der hyperbolischen Abfallkinetik nach Anregung unterscheiden sich Energieinhalt und Speichervermögen von Flocken und Körnern in ihrer Korrelation zur Haltbarkeit. Stochastische Abhängigkeiten können dabei durch Regressionsgeraden veranschaulicht werden.In hyperbolic waste kinetics after excitation, the energy content and storage capacity of flakes and grains differ in their correlation to the shelf life. Stochastic dependencies can be illustrated using regression lines.
Der Speicherinhalt von Flocken erweist sich als umso höher, je niedriger der Pentanwert ist. In Abbildung 2 sind die jeweiligen Regressionsgeraden der verschiedenen Getreidesorten aus Beispiel 1 wiedergegeben. Weizen zeigt demnach die geringste Abhängigkeit des Speicherinhalts von der Haltbarkeit, Reis die stärkste.The storage content of flakes proves to be higher the lower the pentane value. Figure 2 shows the respective regression lines of the different grain types from Example 1. Wheat shows the least dependence of the storage content on the shelf life, rice the strongest.
Bei Körnern ist der Speicherinhalt in der hyperbolischen Abfallkinetik negativ zur Lichtspeicherfähigkeit korreliert, entsprechend einer negativen linearen Regression zwischen Speichervermögen und Pentanwerten. Mit wachsendem verfügbaren Speicherinhalt sinkt die Haltbarkeit im Gegensatz zu den Flocken. Die Korrelation scheint dabei relativ unabhängig von der Sorte zu sein. Die Regressionsgerade ist in Abbildung 3 wiedergegeben.

Um die Lichtspeicherfähigkeit der Proben, die mit Haltbarkeit und anderen Qualitätsmerkmalen korreliert sind, technisch noch besser zu erfassen, wurde die Abhängigkeit NB der ersten 20 Meßwerte von der Menge des verwendeten Probematerials sowie das Abklingverhalten getestet.In order to determine technically the light storage capacity of the samples, which are correlated with durability and other quality features, the dependence NB of the first 20 measured values on the amount of sample material used and the decay behavior were tested.
Körner und Flocken höherer Qualität zeigen nach Anregung mit zunehmender Masse eher eine Sättigung in der Intensität der Photonenemission als minderwertige Körner und Flocken. Der Vorgang kann als Lichtspeichervermögen des Ensembles gedeutet werden. In den Abbildungen 4 werden die Abhängigkeiten der Photonenemissionen nach Anregung mit weißem Licht von der Masse der eingesetzten Körner wiedergegeben, und zwar in Abbildung 4a mit Haferkörnern hoher Qualität, in Abbildung 4b mit Haferkörnern niederer Qualität, in Abbildung 4c mit Weizenflocken hoher Qualität und in Abbildung 4d mit Weizenflocken niedriger Qualität.


Wesentliche Unterschiede der Photonenintensität in Abhängigkeit von der Dauer der Anregung zeigen sich im Vergleich von Weizenflocken hoher Qualität mit Weizenflocken niedriger Qualität. Wie aus Abbildung 4e mit Weizenflocken hoher Qualität deutlich wird, fällt die Intensität mit zunehmender Bestrahlungsdauer ab, entsprechend einer langsamer werdenden "Entleerung" von gespeicherten Photonen.
Der Anstieg der Photonenemission mit zunehmender Bestrahlungsdauer bei Weizenflocken niedriger Qualität, der in Abbildung 4f wiedergegeben wird, ist offensichtlich mehr auf geordnete chemische Prozesse zurückzuführen, die nach der Weißlichtanregung induziert wurden und mit zunehmender Dauer der Anregung einen Sättigungsgrad erreichen.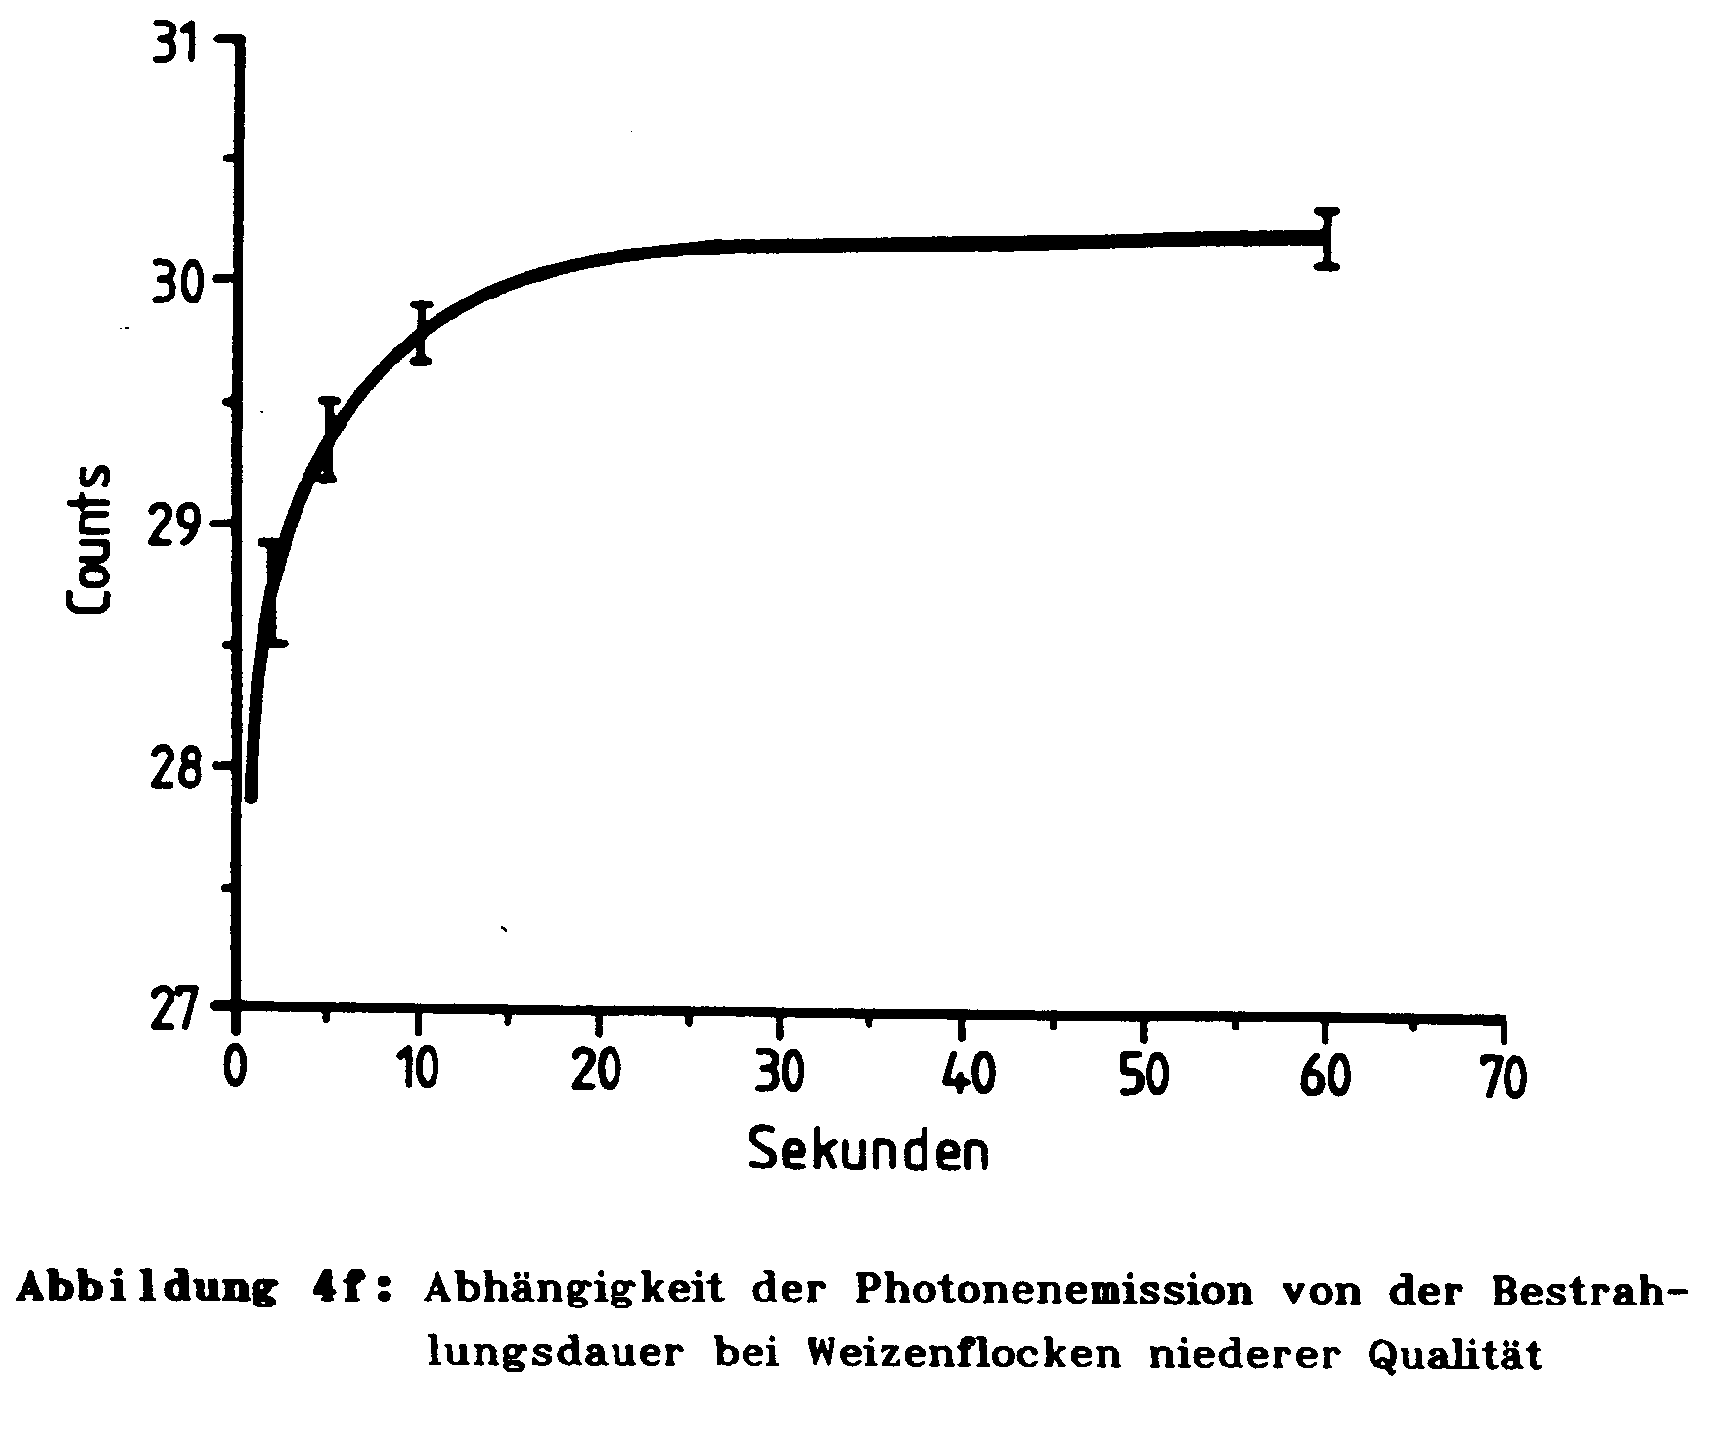
Die Korrelation des Abklingverhaltens der Photonenemission nach Lichtanregung mit Vitalität bzw. Keimfähigkeit des Probematerials wird anhand zweier unterschiedlicher Arten von Samenkörnern demonstriert. Gemessen wurden
- a) Zwei verschieden alte Chargen handelsüblicher Gartenkresse (Lepidum sativum); der Altersunterschied zwischen den Chargen betrug 1 Jahr. Von jeder der beiden Chargen wurden jeweils Proben von 2.5, 5.0, 7.5 und 10.0 g gemessen.
- b) Eine Charge handelsüblicher Saatmais (Zea mais), wobei ein Teil der Charge durch kurzes Erhitzen (10 Minuten) im Autoklaven künstlich gealtert wurde. Den autoklavierten Körnern war diese Behandlung äußerlich nicht anzusehen. Es wurden nun künstlich zwei Chargen unterschiedlicher Qualität hergestellt: die qualitativ höherwertigere Charge enthielt nur unbehandeltes Saatgut, während die qualitativ niederwertigere Charge zu 70% aus unbehandeltem und zu 30% aus autoklaviertem Saatgut bestand.
- a) Two batches of garden cress ( Lepidum sativum ) of different ages ; the age difference between the batches was 1 year. Samples of 2.5, 5.0, 7.5 and 10.0 g were measured from each of the two batches.
- b) A batch of commercially available seed maize ( Zea mais ), part of the batch being artificially aged by briefly heating (10 minutes) in an autoclave. This treatment could not be seen externally from the autoclaved grains. Two batches of different quality were now artificially produced: the batch of higher quality only contained untreated seeds, while the lower quality batch consisted of 70% untreated and 30% autoclaved seeds.
Als Qualitätskriterium wurde in diesem Falle die Vitalität der Samen herangezogen, die parallel zur Messung nach bekannten Methoden bestimmt wurde (Keimfähigkeitsprüfung, biochemischer Keimtest/Tetrazoliumfärbung). Diese Keimprüfungen ergaben einen Keimausfall von ca. 30% bei der minderwertigeren Charge, was genau dem Prozentsatz an beigemischtem autoklaviertem Saatgut entsprach. Die Genauigkeit des Keimtests lag bei ± 2-3%. Von diesen beiden Chargen wurden jeweils Proben von 4, 8 und 12 g gemessen.In this case, the quality criterion was the vitality of the seeds, which was determined in parallel with the measurement using known methods (germination test, biochemical germ test / tetrazolium staining). These germ tests showed a germ loss of approx. 30% for the inferior batch, which corresponded exactly to the percentage of autoclaved seeds added. The accuracy of the germ test was ± 2-3%. Samples of 4, 8 and 12 g were measured from these two batches.
Das Probematerial wird abgewogen und nach Abfüllen in eine Quarzküvette 10 Minuten vor Beginn der Messung in die Meßapparatur gebracht. Nach Registrierung des dunkeladaptierten Mittelwertes der Probe wird zwei- bzw. dreimal über einen Zeitraum von einer Sekunde mit weißem Licht angeregt und sodann das Abklingverhalten registriert. Die Zeitspanne zwischen den einzelnen Anregungen muß so gewählt sein, daß jeweils ein vollständiges Abklingen gewährleistet ist. Die Zeitauflösung beträgt bei allen Messungen 500 ms.The sample material is weighed and, after filling into a quartz cuvette, placed in the measuring apparatus 10 minutes before the start of the measurement. After the dark-adapted mean value of the sample has been registered, it is excited two or three times over a period of one second with white light and then the decay behavior is registered. The time period between the individual suggestions must be selected so that complete decay is ensured in each case. The time resolution for all measurements is 500 ms.
In Abbildung 5 sind die Anfangsintensitäten der beiden Chargen von Kressesamen über der Probemenge aufgetragen. Gemessen und ausgewertet wurde der erste Wert 150 ms nach Anregung mit einer 150 W Wolframlampe. Die Werte der beiden Wiederholungsmessungen liegen dabei so dicht beieinander, daß die Fehlerbalken nicht mehr aufzulösen waren.Figure 5 shows the initial intensities of the two batches of cress seeds over the sample amount. The first value was measured and evaluated 150 ms after excitation with a 150 W tungsten lamp. The values of the two repeat measurements are so close together that the error bars could no longer be resolved.
Außer in den deutlichen Intensitätsunterschieden, die als unterschiedliche Lichtspeicherfähigkeit zu interpretieren sind steigt die Photonenemission bei neuem Saatgut nicht in der Weise an, wie es bei altem Saatgut zu beobachten ist. Ab einer Menge von 7,5 g Probematerial tritt bei neuem Saatgut Sättigung auf.Except for the clear differences in intensity, which can be interpreted as different light storage capacity, the photon emission does not increase in the case of new seeds in the same way as can be observed with old seeds. From a quantity of 7.5 g sample material, saturation occurs with new seeds.
In Abbildung 6 werden die Anfangsintensitäten der beiden Mais-Chargen nach Anregung mit weißem Licht wiedergegeben. Den einzelnen Datenpunkten liegen jeweils drei Meßwerte zugrunde. Die eingetragenen Fehlerbalken entsprechen den Standardabweichungen. Die Meßreihe wurde drei Tage nach dem Autoklavieren des Saatgutes aufgenommen. Der Meßwert über der Probemasse 0 g ist als Referenzwert für die Anregbarkeit der Meßkammer mit leerer Küvette aufzufassen.

Auch in dieser Meßreihe tritt der bei der Messung unterschiedlicher Kressesamen zu beobachtende Effekt auf, daß die qualitativ höherwertigere im Vergleich zur minderwertigeren Probe mit zunehmender Masse einen Sättigungszustand erreicht.In this series of measurements, too, the effect that can be observed when measuring different cress seeds occurs, that the qualitatively higher quality compared to the inferior sample reaches a saturation state with increasing mass.
Die Meßergebnisse zeigen. daß die eingesetzte Methode zur Qualitätsprüfung von Samen und Saatgut eingesetzt werden kann. Die Qualität von Samenkörnern, insbesondere in Bezug auf ihre Vitalität, ist deutlich mit einer durch Speicherfähigkeit für weißes Licht beschreibbaren Eigenschaft korreliert. Weniger vitales Saatgut gibt das eingestrahlte Licht unmittelbar nach Abschalten der Lichtquelle deutlich stärker ab als qualitativ höherwertigeres, vitales Saatgut. Die erhaltenen Daten zeigen selbst bei geringen Qualitätsunterschieden genügend große. statistisch signifikante Abweichungen. die auch der Forderung nach Reproduzierbarkeit genügen.The measurement results show. that the method used to check the quality of seeds and seeds can be used. The quality of seeds, particularly with regard to their vitality, is clearly correlated with a property that can be described by the ability to store white light. Less vital seed emits the radiated light significantly more immediately after switching off the light source than higher quality, vital seed. The data obtained show sufficiently large even with small quality differences. statistically significant deviations. which also meet the demand for reproducibility.
Die in diesem Beispiel dargelegten Messungen sollten nur dazu dienen, den Trend im Abklingverhalten von Proben unterschiedlicher Vitalität und Qualität zu demonstrieren. Für Feinanalysen, mit denen eine hohe Auflösung noch bei minimalen Unterschieden erzielt werden kann, ist es vorteilhaft, mit einer wesentlich größeren Zeitauflösung und zusätzlich in Abhängigkeit von spektraler Anregung zu messen. Bevorzugt sind hierbei Meßzeitintervalle unterhalb 25 ms.The measurements presented in this example should only serve to demonstrate the trend in the decay behavior of samples of different vitality and quality. For fine analysis, with which a high resolution can still be achieved with minimal differences, it is advantageous to measure with a much larger time resolution and also as a function of spectral excitation. Measuring time intervals below 25 ms are preferred.
Zur Demonstration der Trennschärfe der Methode wurden die Anfangsintensitäten nach Anregung an einer Charge von 12 keimfähiger Maiskörner gemessen, denen 2 autoklavierte, nicht keimfähige Maiskörner zugemischt waren. Die Ergebnisse sind in Abbildung 7 wiedergegeben. Die beiden rechten Balken in dem Diagramm zeigen die Anfangsintensitäten der Probe mit den beiden autoklavierten Körnern, wobei der linke der beiden Balken den Mittelwert aus 3 Anregungen zeigt, bei denen die autoklavierten Körner ins Zentrum der Probe gebracht worden waren und somit nicht direkt bestrahlt werden konnten.To demonstrate the selectivity of the method, the initial intensities were measured after excitation on a batch of 12 germinable maize kernels, to which 2 autoclaved, non-germinable maize kernels were mixed. The results are shown in Figure 7. The two bars on the right in the diagram show the initial intensities of the sample with the two autoclaved grains, the left one of the two bars showing the mean of 3 excitations in which the autoclaved grains had been brought into the center of the sample and therefore could not be irradiated directly .
Der mit * gekennzeichnete Balken stellt den Mittelwert aus den bereits beschriebenen Anregungen und noch 2 zusätzlichen Anregungen nach Durchmischen der Probe und einer eintägigen Wartezeit dar. Beide Proben mit 2 zugemischten autoklavierten Maiskörnern unterscheiden sich deutlich von der Probe mit 12 g unbehandeltem Saatgut, wie man aus den auf die Balken aufgesetzten Standardabweichungen ersehen kann.
Die Abhängigkeit der Photonenemission von unterschiedlichen Spektralbereichen bei der Lichtanregung wird in Abbildung 8 anhand der Emissionsraten von Milch wiedergegeben. Ausgewertet wurden die Mittelwerte NB der ersten 20 Meßdaten im Abstand von 500 ms nach einer Bestrahlungszeit von 60 s im jeweiligen Spektralbereich. Dazu wurden im Falle der Rotanregung das Filter RG 610 und im Falle der Blauanregung das Filter BG 25 der Firma Schott zwischen eine 150 Watt Wolframlampe der Firma Osram und die Probe geschaltet.The dependence of the photon emission on different spectral ranges in light excitation is shown in Figure 8 on the basis of the emission rates of milk. The mean values NB of the first 20 measurement data were evaluated at intervals of 500 ms after an irradiation time of 60 s in the respective spectral range. For this purpose, in the case of red excitation, the filter RG 610 and in the case of blue excitation, the filter BG 25 from Schott were connected between a 150 watt tungsten lamp from Osram and the sample.
Gleichzeitig wurden die Messungen an zwei Milchchargen durchgeführt, die unterschiedlichen Behandlungsverfahren unterzogen waren: zum einen mit H-Milch (ultrahocherhitzt, homogenisiert) der Firma Hofgut, Schwäbisch Hall, zum anderen mit Frischmilch (pasteurisiert, homogenisiert) der Firma Landliebe Mannheim. Beide hatten einen Mindestfettgehalt von 3.8%.At the same time, the measurements were carried out on two batches of milk that were subjected to different treatment processes: firstly with UHT milk (ultra-high heat, homogenized) from Hofgut, Schwäbisch Hall, and secondly with fresh milk (pasteurized, homogenized) from Landliebe Mannheim. Both had a minimum fat content of 3.8%.
Bemerkenswert ist hierbei, daß es sich bei Milch um zellfreies Probematerial handelt. Die Abstrahlung von kohärentem Licht ist nicht an das Vorhandensein von Zellstrukturen gebunden.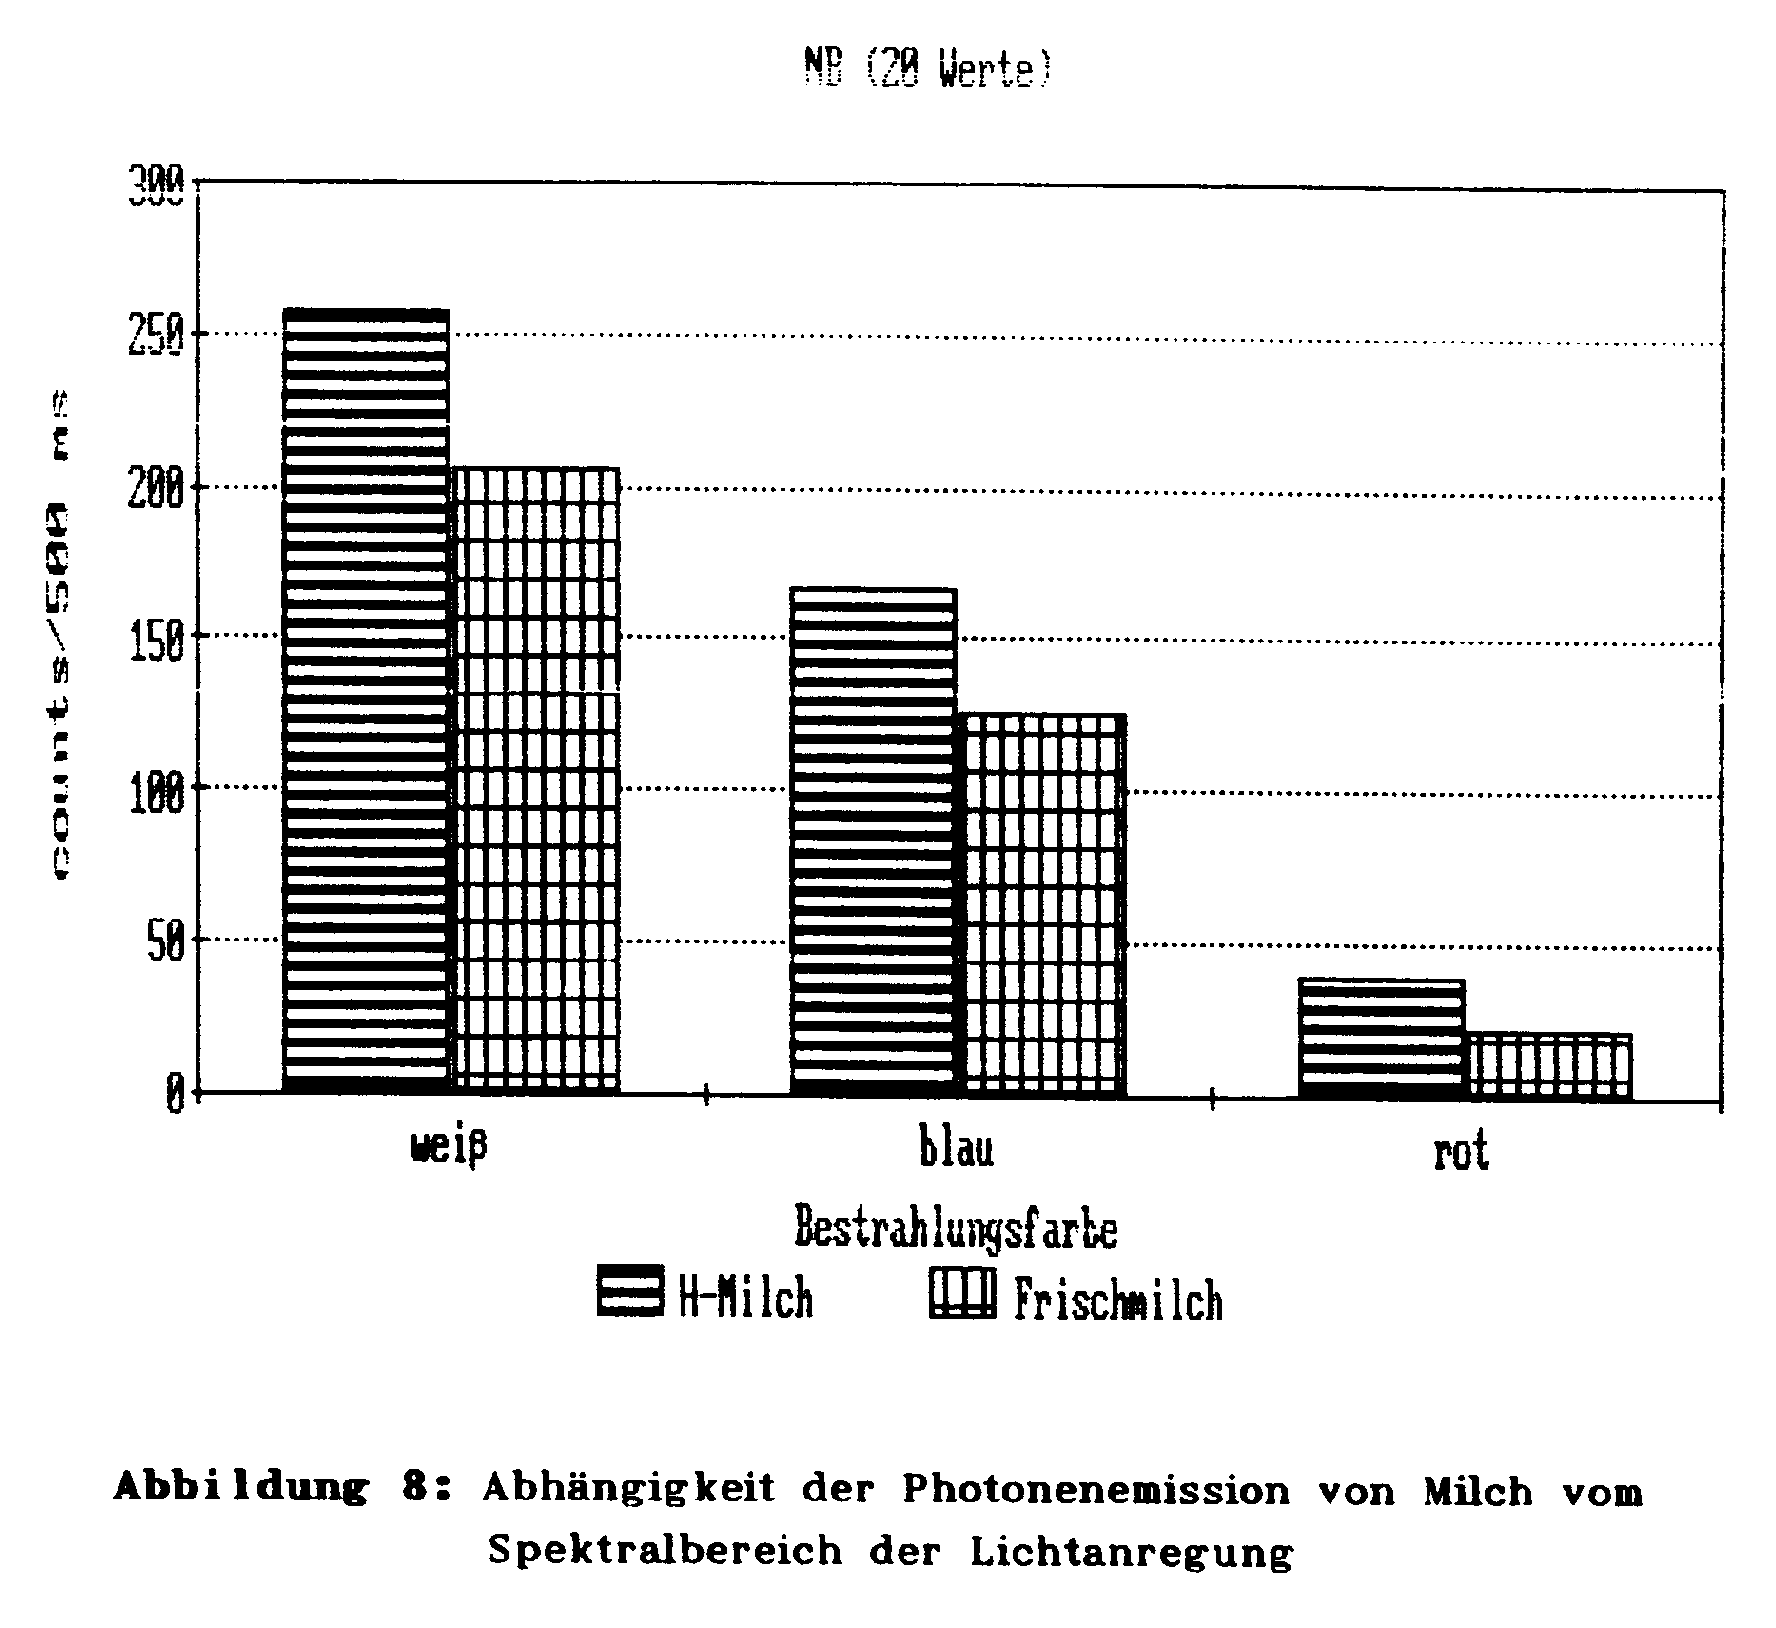
Wie auf Seite 31, Zeilen 15-21 dargelegt, ist die Trennschärfe der Methode bei der Analyse des Abklingverhaltens umso besser, je kleiner die Zeitintervalle der Photonenemissionsmessungen gewählt werden. Diese können sich bis in den µs-Bereicherstrecken. Analoge Überlegungen gelten auch für das folgende Beispiel.As shown on page 31, lines 15-21, the smaller the time intervals of the photon emission measurements, the better the method's selectivity when analyzing the decay behavior. These can range up to the µs range. Analogous considerations also apply to the following example.
Dieses Beispiel demonstriert die Erfassung der Photonenemission der Proben in Abhängigkeit der Messung in verschiedenen definierten Spektralbereichen. Hierzu wurde jeweils ein Filter zwischen Probe und Meßgerät gebracht. Abbildung 9 zeigt das Emissionsverhalten verschiedener Getreideproben nach Rotlichtanregung in den verschiedenen Spektralbereichen der Filter BG3. BG39 und RG 610 der Firma Schott. Die Messung und Auswertung wurden analog Beispiel 7 durchgeführt. Das verschiedene spektrale Emissionsverhalten der Proben wird deutlich sichtbar.
In diesem Beispiel wird das mit der Haltbarkeit korrelierte Lumineszenzverhalten von Wurst (Salami) dokumentiert, wobei die Messungen über einen Zeitraum von 2-3 Monaten systematisch verfolgt wurden.In this example, the luminescence behavior of sausage (salami) correlated with the shelf life is documented, the measurements being systematically monitored over a period of 2-3 months.
In Abbildung 10a und 10b werden die Mittelwerte der Eigenintensitäten DA bzw. der ersten 20 Meßwerte nach Anregung NB aus je 20 Messungen in 10 Meßintervallen in counts/500 ms wiedergegeben.Figures 10a and 10b show the mean values of the intrinsic intensities DA and the first 20 measured values after excitation NB from 20 measurements each in 10 measurement intervals in counts / 500 ms.
In Abbildung 10c werden die dazugehörigen jeweiligen Mittelwerte der mittleren Fehlerabweichung QE vom bestangepaßten exponentiellen Abklingverhalten aus den Mittelwerten NB der ersten 20 Meßwerte nach Anregung wiedergegeben.


Die Empfindlichkeit der Photonenemission im Hinblick auf das Abklingverhalten nach Anregung wird besonders deutlich bei der Messung der Photonenemission von Lebensmitteln nach Gamma-Bestrahlung. Noch nach einem Jahr läßt sich bestrahlte Ware über die Intensität der Biophotonenabstrahlung signifikant von unbestrahlter Ware unterscheiden.The sensitivity of the photon emission with regard to the decay behavior after excitation becomes particularly clear when measuring the photon emission from foods after gamma radiation. Even after one year, irradiated goods can be significantly differentiated from unirradiated goods via the intensity of the biophoton radiation.
In Abbildung 11 ist die Intensität der Photonenemission (in willkürlichenEinheiten) von bestrahltem Pfeffer (Piper nigrum L.) im Vergleichzu unbestrahltem wiedergegeben. Die Gamma-Bestrahlung erfolgte mittels einer für die Lebensmittelkonservierung üblichen Kobaltquelle während 5 sec mit einer Energiedosis von 5 Gray. Die Messung der Photonenemission des so angeregten Pfeffers sowie einer Blindprobe mit nicht der Strahlenquelle ausgesetztem Pfeffer wurde ein Jahr nach der Bestrahlung durchgeführt.Figure 11 shows the intensity of the photon emission (in arbitrary units) from irradiated pepper ( Piper nigrum L. ) compared to unirradiated. The gamma radiation was carried out using a cobalt source customary for food preservation for 5 seconds with an energy dose of 5 gray. The measurement of the photon emission of the pepper excited in this way and of a blank sample with pepper not exposed to the radiation source was carried out one year after the irradiation.
Wie aus Abbildung 11 ersehen werden kann, liegt die Photonenemission bestrahlter Ware selbst nach einem Jahr ca. 30% über der Emission unbestrahlter Ware.
Um die Abhängigkeit der Biophotonenemission eines lebenden Systems von äußeren Einflußgrößen sowie seine Empfindlichkeit zu demonstrieren, wurde die Einwirkung des Herbizids Atrazin (2-Chlor-4-ethylamino-6-isopropylamino-s-triazin) auf die Grünalge Scenedesmus subspicatus als Bioindikator untersucht. Sowohl der Bioindikator als auch das Herbizid werden in den herkömmlichen ökotoxikologischen Prüfverfahren verwendet. Die Grünalge wird als Prüforganismus in Stufe 1 eingesetzt (Tabelle 2) und Atrazin ist in der 25-Stoffe-Liste an Position Nr. 13 angeführt (Tabelle 1).In order to demonstrate the dependence of the biophoton emission of a living system on external factors and its sensitivity, the effect of the herbicide atrazine (2-chloro-4-ethylamino-6-isopropylamino-s-triazine) on the green algae Scenedesmus subspicatus as a bioindicator was investigated. Both the bioindicator and the herbicide are used in conventional ecotoxicological test methods. The green alga is used as a test organism in stage 1 (table 2) and atrazine is listed in position 25 in the list of 25 substances (table 1).
Gesucht wird die Atrazinkonzentration, von der ab ein akuter Anstieg der Photonenemission signifikant nachweisbar ist. Dazu werden pro Messung je 9 ml Algen ca. 24 Stunden vor der Messung in offenen Gefäßen und das in aqua dest. gelöste Gift eine Stunde vor der Messung dunkel gestellt. Die Meßkammer wird unter Rotlicht eingerichtet. Die Referenzmessung erfolgt sodann mit gereinigter Quarzküvette und eingeschaltetem Magnetrührer (dieser muß auch mindestens 1 Stunde vor Meßbeginn im Dunkeln aufbewahrt werden). wird die Photonenemission (gemessen in counts) von Algen, Küvette und Rührer samt Kammer alle 3,6 sec aufsummiert. Es werden so insgesamt 1800 Werte (ca. 1 3/4 Stunden) aufgenommen. Nach 350 Werten (18 Minuten) erfolgt die Einspritzung von 1 ml Herbizidlösung im Dunkeln. Nach der Messung werden die Küvetten mit Alkohol und aqua dest. gereinigt. Daran anschließend kann eine zweite Referenzmessung gefolgt von einer weiteren Algenmessung mit erhöhter Herbizidkonzentration stattfinden. Während der Messungen müssen Temperatur und Luftfeuchtigkeit konstant gehalten werden.We are looking for the atrazine concentration from which an acute increase in photon emission can be significantly demonstrated. For this purpose, 9 ml algae per measurement are taken approx. 24 hours before the measurement in open vessels and in distilled water. dissolved poison darkened one hour before the measurement. The measuring chamber is set up under red light. The reference measurement is then carried out with a cleaned quartz cuvette and a switched on magnetic stirrer (this must also be kept in the dark at least 1 hour before the start of the measurement). the photon emission (measured in counts) from algae, cuvette and stirrer including chamber is added up every 3.6 seconds. A total of 1800 values (approx. 1 3/4 hours) are recorded. After 350 values (18 minutes), 1 ml herbicide solution is injected in the dark. After the measurement, the cuvettes are washed with alcohol and distilled water. cleaned. This can be followed by a second reference measurement followed by a further algae measurement with an increased herbicide concentration. Temperature and humidity must be kept constant during the measurements.
Für jede Meßreihe wird jeweils der Mittelwert der Meßwerte 100-300 (vor Einspritzung des Herbizids) und 500-1000 (nach Einspritzung) nach Abzug der jeweiligen Referenzmessung ausgewertet. In Abbildung 12 sind der prozentuale Anstieg der Photonenemission der Algen nach Zugabe des Giftes gegen den Logarithmus der Atrazin-Konzentration in der Meßküvette aufgetragen.
In Abbildung 13a wird der Verlauf der Photonenemission von 9 ml Algen (6,3*10⁶ Zellen/ml, 22 Stunden dunkel gestellt) nach Zugabe von 1 ml Atrazin-Lösung (10 mg/l) wiedergegeben und in Abbildung 13b die Emission von 9 ml Algen (4,0*10⁶ Zellen/ml, 26,5 Stunden dunkel gestellt) bei Zugabe einer Atrazin-Konzentration von 3,3 mg/l. Abbildung 13c schließlich zeigt als Referenzmessung die Photonenemission von 9 ml Algen (6,3*10⁶ Zellen/ml, 25 Stunden dunkel adaptiert) nach Zugabe von 1 ml Aqua dest. Die Zugaben von Atrazin bzw. Aqua dest. erfolgten jeweils bei einem Abszissenwert von 0,35*10³.


In diesem Beispiel wird die Wirkung von Giftstoffen auf verschiedene Bioindikatoren demonstriert. Als solche wurden verwendet: das Pantoffeltierchen Paramecium caudatum, die bereits in Beispiel 10 verwendete einzellige Alge Scenedesmus subspicatus und Keimlinge der Kresse Lepidium sativum.This example demonstrates the effects of toxins on various bio-indicators. The following were used as such: the slipper animal Paramecium caudatum , the unicellular algae Scenedesmus subspicatus already used in Example 10 and seedlings of the cress Lepidium sativum.
In Abbildung 14a ist die Änderung der Photonenintensität von 13 ml des einzelligen Ziliaten Paramecium caudatum mit einer Zelldichte von 10³/ml in einer 18 ml fassenden Quarzküvette nach Zugabe von 2 ml verdünnter Essigsäure (0,1 ml 99% HAc / Liter) wiedergegeben. Die Zugabe erfolgte nach 116 sec. Als Referenzmessung zeigt Abbildung 14b den Intensitätsverlauf nach Zugabe von 2ml aqua dest. 103 sec nach Meßbeginn.Figure 14a shows the change in the photon intensity of 13 ml of the unicellular ciliate Paramecium caudatum with a cell density of 10³ / ml in an 18 ml quartz cuvette after adding 2 ml of dilute acetic acid (0.1 ml 99% HAc / liter). The addition took place after 116 sec. As a reference measurement, Figure 14b shows the intensity curve after adding 2 ml of distilled water. 103 sec after the start of the measurement.
Wie ersichtlich steigt die Photonenintensität nach Zugabe der Essigsäure um ca. 40% des Wertes vor der Zugabe und fällt dann langsam während ca. 125 sec auf den Anfangswert ab. Nach Zugabe des Lösungsmittels aqua dest. ändert sich die Photonenintensität praktisch nicht.

In Abbildung 15a ist die Änderung der Photonenintensität von 13 ml der einzelligen Alge Scenedesmus subspicatus mit einer Zelldichte von 4*10⁶/ml in einer 18 ml fassenden Quarzküvette nach Zugabe von 2 ml Cadmiumchlorid-Lösung (0,5 mg / Liter) wiedergegeben. Die Zugabe erfolgte nach 107 sec. Als Referenzmessung zeigt Abbildung 15b den Intensitätsverlauf nach Zugabe von 2ml aqua dest. 104 sec nach Meßbeginn.Figure 15a shows the change in the photon intensity of 13 ml of the unicellular algae Scenedesmus subspicatus with a cell density of 4 * 10⁶ / ml in an 18 ml quartz cuvette after adding 2 ml of cadmium chloride solution (0.5 mg / liter). The addition took place after 107 sec. As a reference measurement, Figure 15b shows the intensity curve after adding 2 ml of distilled water. 104 sec after the start of the measurement.
Auch hier steigt die Photonenintensität nach Zugabe des Cadmiumchlorids um ca. 32% des Wertes vor der Zugabe und fällt dann langsam während ca. 110 sec auf den Anfangswert ab. Nach Zugabe des Lösungsmittels aqua dest. bleibt die Photonenintensität wiederum unverändert.

Die Wirkung von Giftstoffen auf die verzögerte Lichtemission nach Anregung wird anhand der Zugabe von Cadmiumchlorid zu Keimlingen der Gartenkresse Lepidium sativum in Abbildung 16 gezeigt.The effect of toxins on the delayed light emission after excitation is shown in Figure 16 by adding cadmium chloride to seedlings of the garden cress Lepidium sativum .
Etwa 60 Kressesamen wurden in einer Petrischale 3 Tage lang bei Zimmertemperatur keimen gelassen. Die ausgekeimten Jungpflanzen wurden nach einer Dunkeladaptation von ca. 30 Minuten zur Messung in die Meßkammer gebracht. Zunächst wurde die Probe viermal hintereinander für die Dauer von 1 Sekunde mit Rotlicht bestrahlt, sodann jeweils über 500 Zeitintervalle von 1 Sekunde das Abklingverhalten registriert. Danach wird die Probe mit 2 ml einer Cadmiumchlorid-Lösung der Konzentration 6 pg/l vergiftet und erneut viermal das Abklingverhalten nach Anregung mit Rotlicht gemessen.About 60 cress seeds were allowed to germinate in a petri dish for 3 days at room temperature. The germinated young plants were brought into the measuring chamber for measurement after a dark adaptation of about 30 minutes. First the sample was irradiated with red light four times in succession for 1 second, then the decay behavior was recorded over 500 time intervals of 1 second each. Then the sample is poisoned with 2 ml of a cadmium chloride solution with a concentration of 6 pg / l and the decay behavior after excitation with red light is measured four times.
Um die deutlichen Unterschiede im Abklingverhalten nach der Vergiftung sowie die gute Reproduzierbarkeit der Messungen zu veranschaulichen, wurde für jedes Meßintervall der Mittelwert aus den 4 Abklingkurven vor (obere Kurve) und nach der Vergiftung (untere Kurve) berechnet und zusammen mit der jeweiligen Standardabweichung aufgetragen. In Abbildung 16 werden die ersten 60 Meßwerte dieser Auftragung wiedergegeben.
Zwischen den Lichtemissionen zweier benachbarter biologischer Systeme bilden sich Korrelationen aus. Eine Analyse dieser Korrelationen in Abhängigkeit von Fremdstoffen in einem der Systeme erlaubt genaue und schnelle Aussagen über eine auftretende Umweltbelastung bzw. Umweltschädigung. In Abbildung 17 werden die Korrelationen in den spontanen Lichtemissionen von zwei separaten Populationen des Leuchtbakteriums Bacterium phosphorescens wiedergegeben. Aufgetragen sind die im vorgegebenen Zeitintervall emittierten Lichtquanten gegen die Zeit. Correlations are formed between the light emissions from two neighboring biological systems. An analysis of these correlations as a function of foreign substances in one of the systems allows precise and quick statements about an occurring environmental pollution or environmental damage. Figure 17 shows the correlations in the spontaneous light emissions from two separate populations of the luminous bacterium Bacterium phosphorescens . The light quanta emitted in the specified time interval are plotted against time.
Claims (15)
- A method for determining and testing the quality and/or quality changes of biological systems in using measurements of ultraweak photon emissions, characterized in that,
out of a multitude of dispensed differently conditioned samples of a respective biological system, static characteristic values as well as dynamic characteristic values obtained from the damping behaviour of the ultraweak photonemission after previous excitation are evaluated together with previously determined test results characterizing the various quality properties of the respective biological system and/or with state parameters from the respective dispensed samples, by means of the comparative statistic analysis, that is to say by means of multivariant analysis method, and that, in using the obtained results, the quality of the respective biological system is standardized by means of the correlation of the test results and/or the state parameters of the various samples with the corresponding static and dynamic characteristic values obtained from said ultraweak photon emission of the various samples, and the quality of an arbitrary sample of the respective biological system is determined by comparing the characteristic values obtained therefrom by the ultraweak photon emission with the standardized characteristic values. - A method according to claim 1, characterized in that the intensities of the self-emission of the samples without external excitation and/or the mean values of the first 20-50 measured values of the intensity after external excitation serve as static characteristic values, and in that the damping factors of a matched hyperbolic decay function and/or the error deviation from the optimally matched hyperbolic damping behaviour and/or the standardized X²-error deviation from the optimally matched hyperbolic damping behaviour and/or the ratio of the standardized X²-error deviation of the optimally matched exponential decay function to the standardized error deviation of the optimally matched hyperbolic decay function and/or the ratio of the error deviation of the optimally matched exponential decay function to the error deviation of the optimally matched hyperbolic decay function serve as the dynamic characteristic values.
- A method according to claims 1 and 2, characterized in that a photometer having a delicacy of at least 10⁻¹⁵ Watt is used as metering device to determine the ultraweak photon emission of the samples.
- A method according to claims 1 to 3, characterized in that the damping behaviour of the photon emission after excitation is measured over a defined period of time, the measuring intervals being preferably less than 25 mili m.s.
- A method according to one of claims 1 to 4, characterized in that the biological systems are exited by means of electromagnetic radiation, the excitation being preferably executed at a performance in the range between 100 and 300 Watt using an excitation preferably at discrete wave lengths, or by means of ultrasonics preferably at discrete wave lengths and with energies between 10 and 100 Watt, or thermically, preferably in the temperature interval of 0°C - 60°C.
- A method according to claim 1, characterized in that the intensity of the self-emission is measured in the range of 300-800 nm.
- A method according to anyone of the previous claims, characterized in that the ultraweak photon emission of the samples is determined in different regions of the spectrum.
- A method according to anyone of the previous claims, characterized in that the dependency of the ultraweak photon emission from the amount of the biological systems is determined.
- A method according to anyone of the previous claims, characterized in that, before the determination of the ultraweak photon emission, the biological system is subjected to an enzymatical in-vitro digestion.
- A method according to anyone of the previous claims, characterized in that the ultraweak photon emission of a consumer of the biological system is determined.
- A method according to anyone of the previous claims, characterized in that the characteristic values of a respective biological system are evaluated by means of correlation analysis, variance analysis and factor analysis.
- A method according to anyone of the previous claims for the determination of the biotolerance of organochemical compounds.
- A method according to anyone of claims 1 to 11 for the determination of an environmental load and/or an environmental damage.
- A method according to anyone of claims 1 to 11, characterized in that the correlation of the photon emission of two adjoining biological systems is determined and used to detect environmental influences and/or environmental damages.
- A method according to anyone of claims 1 to 11 to distinguish food being irradiated for purposes of conservation from non-irradiated food.
Applications Claiming Priority (2)
| Application Number | Priority Date | Filing Date | Title |
|---|---|---|---|
| DE3939411A DE3939411A1 (en) | 1989-11-29 | 1989-11-29 | METHOD FOR THE EXAMINATION OF THE QUALITY AND QUALITY CHANGES OF BIOLOGICAL SYSTEMS AND INTERACTIVE ORGANIC CHEMICAL COMPOUNDS THEREOF BY MEASUREMENT OF THE ULTRA-CHANGING PHOTON EMISSION |
| DE3939411 | 1989-11-29 |
Publications (3)
| Publication Number | Publication Date |
|---|---|
| EP0430150A2 EP0430150A2 (en) | 1991-06-05 |
| EP0430150A3 EP0430150A3 (en) | 1992-06-17 |
| EP0430150B1 true EP0430150B1 (en) | 1995-09-27 |
Family
ID=6394391
Family Applications (1)
| Application Number | Title | Priority Date | Filing Date |
|---|---|---|---|
| EP90122586A Expired - Lifetime EP0430150B1 (en) | 1989-11-29 | 1990-11-27 | Method for testing quality and quality changes of biological systems and organochemical compositions interacting with these systems using measurements of ultraweak photon emission |
Country Status (2)
| Country | Link |
|---|---|
| EP (1) | EP0430150B1 (en) |
| DE (2) | DE3939411A1 (en) |
Families Citing this family (25)
| Publication number | Priority date | Publication date | Assignee | Title |
|---|---|---|---|---|
| DE4308520A1 (en) * | 1993-03-17 | 1994-09-22 | Popp Fritz Albert Dr | Method for differentiating between homozygotes, heterozygotes and normal cells of an organism |
| GB2291707B (en) * | 1993-04-24 | 1997-04-16 | Univ Glasgow | Detection of irradiated samples |
| GB9308542D0 (en) * | 1993-04-24 | 1993-06-09 | Univ Glasgow | Detection of irradiated samples |
| DE4401169C2 (en) * | 1994-01-17 | 2003-01-09 | Buehler Ag | Process for distinguishing the quality of liquids |
| DE4439451A1 (en) * | 1994-11-04 | 1996-05-09 | Popp Fritz Albert Dr | Examining changes in the condition of biological tissue |
| DE9417845U1 (en) * | 1994-11-08 | 1995-04-20 | Popp Fritz Albert Dr | System for measuring ultra-weak photon emission (photon measuring system) |
| DE19538768C2 (en) * | 1995-10-18 | 2003-02-27 | Buehler Ag | Procedure for the detection of a microbial infection |
| DE19606207A1 (en) | 1996-02-21 | 1997-08-28 | Univ Duesseldorf H Heine | Method for determining the phototoxicity and / or photosensitivity of substances or mixtures of substances and their use |
| AT414275B (en) * | 1998-06-09 | 2006-10-15 | Bernard Ing Douet | Determining condition of biological material, particularly foodstuffs, involves measuring emission radiation directly to analyze product by using coherent beams |
| DE19840100A1 (en) * | 1998-09-03 | 2000-03-09 | Beiersdorf Ag | Process for the detection of ultra-weak photon emission and its use |
| DE19841400A1 (en) * | 1998-09-10 | 2000-03-16 | Beiersdorf Ag | Process for the detection of triboluminescence and its use |
| DE19928768C1 (en) * | 1999-06-23 | 2000-07-13 | Buehler Ag | Process and apparatus for determining the germination characteristics of seed corn by bio-photon and water moisture detection |
| EP1126271A1 (en) * | 2000-02-14 | 2001-08-22 | Fritz-Albert Dr.rer.nat.habil. Visiting Professor Popp (mult.) | Method and device for determining the malignancy of tumor tissue and for choosing substances beneficial to the tissue |
| DE10145249B4 (en) * | 2001-09-06 | 2009-01-15 | Klaus-Dieter Holzrichter | Device for generating a test signal |
| DE10319042A1 (en) * | 2003-04-25 | 2004-11-11 | Popp, Fritz Albert, Prof. Dr. habil. | Procedure for the rapid determination of qualities / quality changes of any system |
| DE10319043A1 (en) * | 2003-04-25 | 2004-11-11 | Popp, Fritz Albert, Prof. Dr. habil. | Procedure for testing external influences on biological tissue |
| NL2000465C2 (en) | 2007-02-01 | 2008-08-04 | Joseph Maria Tol | Device for generating a coherence-increasing energy field and system of such a device and one or more treatment instruments. |
| US7950349B1 (en) | 2008-01-18 | 2011-05-31 | Jack Dean Rollins | Avian egg fertility and gender detection |
| US9678015B2 (en) | 2014-09-26 | 2017-06-13 | Frito-Lay North America, Inc. | Method for elemental analysis of a snack food product in a dynamic production line |
| US11243190B2 (en) | 2015-09-24 | 2022-02-08 | Frito-Lay North America, Inc. | Quantitative liquid texture measurement method |
| US10070661B2 (en) | 2015-09-24 | 2018-09-11 | Frito-Lay North America, Inc. | Feedback control of food texture system and method |
| US9541537B1 (en) | 2015-09-24 | 2017-01-10 | Frito-Lay North America, Inc. | Quantitative texture measurement apparatus and method |
| US10107785B2 (en) | 2015-09-24 | 2018-10-23 | Frito-Lay North America, Inc. | Quantitative liquid texture measurement apparatus and method |
| US10969316B2 (en) | 2015-09-24 | 2021-04-06 | Frito-Lay North America, Inc. | Quantitative in-situ texture measurement apparatus and method |
| US10598648B2 (en) | 2015-09-24 | 2020-03-24 | Frito-Lay North America, Inc. | Quantitative texture measurement apparatus and method |
Family Cites Families (2)
| Publication number | Priority date | Publication date | Assignee | Title |
|---|---|---|---|---|
| CH654108A5 (en) * | 1980-10-10 | 1986-01-31 | Wolfgang Prof Dr Mehlhardt | METHOD AND DEVICE FOR TESTING BIOLOGICAL EFFECTS IN CELL COLLECTIVES. |
| DE3339750A1 (en) * | 1983-11-03 | 1985-05-23 | Battelle-Institut E.V., 6000 Frankfurt | Process and apparatus for detecting radioactively irradiated organic materials |
-
1989
- 1989-11-29 DE DE3939411A patent/DE3939411A1/en not_active Withdrawn
-
1990
- 1990-11-27 DE DE59009716T patent/DE59009716D1/en not_active Expired - Lifetime
- 1990-11-27 EP EP90122586A patent/EP0430150B1/en not_active Expired - Lifetime
Also Published As
| Publication number | Publication date |
|---|---|
| EP0430150A3 (en) | 1992-06-17 |
| EP0430150A2 (en) | 1991-06-05 |
| DE59009716D1 (en) | 1995-11-02 |
| DE3939411A1 (en) | 1991-06-06 |
Similar Documents
| Publication | Publication Date | Title |
|---|---|---|
| EP0430150B1 (en) | Method for testing quality and quality changes of biological systems and organochemical compositions interacting with these systems using measurements of ultraweak photon emission | |
| Dyer | The effects of red-winged blackbirds (Agelaius phoeniceus L.) on biomass production of corn grains (Zea mays L.) | |
| Drewes et al. | The effect of a plant-derived smoke extract on the germination of light-sensitive lettuce seed | |
| Oomen et al. | Method for honeybee brood feeding tests with insect growth‐regulating insecticides | |
| AT403641B (en) | PLANT SEEDLINGS AND METHOD FOR THE PRODUCTION THEREOF | |
| DD201372A5 (en) | MEANS FOR REGULATING PLANT GROWTH | |
| Altshuler | Ultraviolet reflectance in fruits, ambient light composition and fruit removal in a tropical forest | |
| WO2013135889A1 (en) | Volatile biomarkers for the detection of mycotoxin-producing fungal pathogens in maize plants | |
| Wall | A study of color and color-variation in Aphis gossypii Glover. | |
| DE2054303A1 (en) | Method and device for investigating the effectiveness of stabilizers in resin samples | |
| EP0457789B1 (en) | Process for rapid testing of the effect of agents on micro-organisms | |
| CH654108A5 (en) | METHOD AND DEVICE FOR TESTING BIOLOGICAL EFFECTS IN CELL COLLECTIVES. | |
| DE69818109T2 (en) | FACTORS FOR CONTROLLING POTATO CYSTE NOMATODES AND THEIR USE IN AGRICULTURE | |
| DE3038255A1 (en) | Examining biological effects on foodstuffs of seeds - by measuring intensity of ultra-weak photon radiation in vitro | |
| Mandl et al. | The response of sweet corn to HF and SO2 under field conditions | |
| DE19930865C2 (en) | Method for determining the phytoplankton content of natural water samples and for differentiating different groups of algae by means of chlorophyll fluorescence measurements and measuring device for carrying out the method | |
| Miller | The significance of preference in laboratory bait acceptance studies | |
| EP1188041B1 (en) | Method, system and use of measuring devices for determining the germinability of seeds | |
| Brown | A new screening procedure for detecting plant growth regulating compounds | |
| DE102019123332A1 (en) | Process for the risk-adapted analysis of crops for chemical residues | |
| Schwabe et al. | Effects of Photoperiod on the Apparent Viscosity of Leaf Cytoplasm in Kalanchoe blossfeldiana: 2. Some Long-and Short-term Effects of Daylength and Spectral Composition of Light | |
| Tetlie | Evaluation of native bee nesting rates and beetle community assemblages in the presence of clothianidin in the soil of natural areas | |
| WO2024074345A1 (en) | Method for estimating the germination properties of plant seeds and test kits | |
| EJETA | SELECTION FOR GENETIC MODIFIERS THAT IMPROVE THE OPAQUE KERNEL PHENOTYPE OF P-721, HIGH LYSINE SORGHUM (SORGHUM BICOLOR (L.) MOENCH). | |
| DE112006000480B4 (en) | Method for evaluating the vitality of chlorophyll-bearing biological samples |
Legal Events
| Date | Code | Title | Description |
|---|---|---|---|
| PUAI | Public reference made under article 153(3) epc to a published international application that has entered the european phase |
Free format text: ORIGINAL CODE: 0009012 |
|
| AK | Designated contracting states |
Kind code of ref document: A2 Designated state(s): BE DE FR LU NL |
|
| PUAL | Search report despatched |
Free format text: ORIGINAL CODE: 0009013 |
|
| AK | Designated contracting states |
Kind code of ref document: A3 Designated state(s): BE DE FR LU NL |
|
| 17P | Request for examination filed |
Effective date: 19921015 |
|
| 17Q | First examination report despatched |
Effective date: 19940310 |
|
| GRAA | (expected) grant |
Free format text: ORIGINAL CODE: 0009210 |
|
| AK | Designated contracting states |
Kind code of ref document: B1 Designated state(s): BE DE FR LU NL |
|
| REF | Corresponds to: |
Ref document number: 59009716 Country of ref document: DE Date of ref document: 19951102 |
|
| PG25 | Lapsed in a contracting state [announced via postgrant information from national office to epo] |
Ref country code: LU Free format text: LAPSE BECAUSE OF NON-PAYMENT OF DUE FEES Effective date: 19951130 |
|
| ET | Fr: translation filed | ||
| PLBE | No opposition filed within time limit |
Free format text: ORIGINAL CODE: 0009261 |
|
| STAA | Information on the status of an ep patent application or granted ep patent |
Free format text: STATUS: NO OPPOSITION FILED WITHIN TIME LIMIT |
|
| 26N | No opposition filed | ||
| NLS | Nl: assignments of ep-patents |
Owner name: BUEHLER AG |
|
| REG | Reference to a national code |
Ref country code: FR Ref legal event code: TP |
|
| PGFP | Annual fee paid to national office [announced via postgrant information from national office to epo] |
Ref country code: LU Payment date: 20041111 Year of fee payment: 15 |
|
| PGFP | Annual fee paid to national office [announced via postgrant information from national office to epo] |
Ref country code: FR Payment date: 20041112 Year of fee payment: 15 |
|
| PG25 | Lapsed in a contracting state [announced via postgrant information from national office to epo] |
Ref country code: FR Free format text: LAPSE BECAUSE OF NON-PAYMENT OF DUE FEES Effective date: 20060731 |
|
| REG | Reference to a national code |
Ref country code: FR Ref legal event code: ST Effective date: 20060731 |
|
| NLS | Nl: assignments of ep-patents |
Owner name: BIPHO PATENTVERWERTUNG GMBH Effective date: 20061023 |
|
| PGFP | Annual fee paid to national office [announced via postgrant information from national office to epo] |
Ref country code: DE Payment date: 20091130 Year of fee payment: 20 |
|
| PGFP | Annual fee paid to national office [announced via postgrant information from national office to epo] |
Ref country code: NL Payment date: 20091110 Year of fee payment: 20 |
|
| PGFP | Annual fee paid to national office [announced via postgrant information from national office to epo] |
Ref country code: BE Payment date: 20091231 Year of fee payment: 20 |
|
| BE20 | Be: patent expired |
Owner name: *BIPHO PATENTVERWERTUNG G.M.B.H. Effective date: 20101127 |
|
| REG | Reference to a national code |
Ref country code: NL Ref legal event code: V4 Effective date: 20101127 |
|
| PG25 | Lapsed in a contracting state [announced via postgrant information from national office to epo] |
Ref country code: NL Free format text: LAPSE BECAUSE OF EXPIRATION OF PROTECTION Effective date: 20101127 |
|
| PG25 | Lapsed in a contracting state [announced via postgrant information from national office to epo] |
Ref country code: DE Free format text: LAPSE BECAUSE OF EXPIRATION OF PROTECTION Effective date: 20101127 |