EP0325441B1 - A method for measuring thermal conductivity - Google Patents
A method for measuring thermal conductivity Download PDFInfo
- Publication number
- EP0325441B1 EP0325441B1 EP19890300473 EP89300473A EP0325441B1 EP 0325441 B1 EP0325441 B1 EP 0325441B1 EP 19890300473 EP19890300473 EP 19890300473 EP 89300473 A EP89300473 A EP 89300473A EP 0325441 B1 EP0325441 B1 EP 0325441B1
- Authority
- EP
- European Patent Office
- Prior art keywords
- temperature
- thermal conductivity
- specimen
- measuring
- heat
- Prior art date
- Legal status (The legal status is an assumption and is not a legal conclusion. Google has not performed a legal analysis and makes no representation as to the accuracy of the status listed.)
- Expired - Lifetime
Links
- 238000000034 method Methods 0.000 title claims description 23
- 238000004364 calculation method Methods 0.000 claims description 18
- 239000000463 material Substances 0.000 claims description 10
- 238000012546 transfer Methods 0.000 description 48
- 238000005259 measurement Methods 0.000 description 36
- 239000007789 gas Substances 0.000 description 27
- 239000012212 insulator Substances 0.000 description 22
- 238000001816 cooling Methods 0.000 description 7
- 239000002826 coolant Substances 0.000 description 6
- 238000012733 comparative method Methods 0.000 description 5
- 238000012937 correction Methods 0.000 description 4
- 239000011810 insulating material Substances 0.000 description 3
- 238000012887 quadratic function Methods 0.000 description 2
- 230000005855 radiation Effects 0.000 description 2
- XLYOFNOQVPJJNP-UHFFFAOYSA-N water Substances O XLYOFNOQVPJJNP-UHFFFAOYSA-N 0.000 description 2
- OKTJSMMVPCPJKN-UHFFFAOYSA-N Carbon Chemical compound [C] OKTJSMMVPCPJKN-UHFFFAOYSA-N 0.000 description 1
- ZOKXTWBITQBERF-UHFFFAOYSA-N Molybdenum Chemical compound [Mo] ZOKXTWBITQBERF-UHFFFAOYSA-N 0.000 description 1
- 229910000831 Steel Inorganic materials 0.000 description 1
- 238000009529 body temperature measurement Methods 0.000 description 1
- 229910052799 carbon Inorganic materials 0.000 description 1
- 238000007796 conventional method Methods 0.000 description 1
- 230000003247 decreasing effect Effects 0.000 description 1
- 239000012530 fluid Substances 0.000 description 1
- 229910002804 graphite Inorganic materials 0.000 description 1
- 239000010439 graphite Substances 0.000 description 1
- 238000000691 measurement method Methods 0.000 description 1
- 238000013208 measuring procedure Methods 0.000 description 1
- 229910052750 molybdenum Inorganic materials 0.000 description 1
- 239000011733 molybdenum Substances 0.000 description 1
- 230000002093 peripheral effect Effects 0.000 description 1
- 238000012545 processing Methods 0.000 description 1
- 239000010959 steel Substances 0.000 description 1
- 238000012360 testing method Methods 0.000 description 1
Images




Classifications
-
- G—PHYSICS
- G01—MEASURING; TESTING
- G01N—INVESTIGATING OR ANALYSING MATERIALS BY DETERMINING THEIR CHEMICAL OR PHYSICAL PROPERTIES
- G01N25/00—Investigating or analyzing materials by the use of thermal means
- G01N25/18—Investigating or analyzing materials by the use of thermal means by investigating thermal conductivity
Definitions
- This invention relates to a measurement method for thermal conductivity under steady state conditions at high temperatures which can be appropriately applied to various kinds of materials such as heat insulating materials.
- the thermal conductivity of insulating materials varies depending on the temperature. As shown in Figure 14, it is a general characteristics that the higher the temperature, the higher the heat conductivity. In other words, heat is more easily conducted through a material at a higher temperature than at lower temperature. For heat insulating materials to be used at over 1,000°C, it is necessary to test them at the temperatures at which they will be used.
- a conventional method for measurement of thermal conductivity is prescribed in ASTM C177-84 etc., for example, as shown in Figure 15.
- a conventional apparatus for measuring thermal conductivity consists of a main heater b and an auxiliary heater c which are disposed respectively in the upper and lower parts of the enclosure a and are designed to generate a downward steady heat flow.
- a heat flow meter d is disposed above the auxiliary heater c and is used to measure the steady heat flow.
- specimen S is first placed at the center of the enclosure a, and standard heat transfer plates S1 and S2 of known thermal conductivity are positioned on and under the specimen S. Second, the main heater b and the auxiliary heater c are controlled to create a steady state heat flow in the enclosure. The average temperature of specimen S is maintained at the temperature T°C at which the heat conductivity is to be measured whereas the temperature within the specimen varies as shown in Fig. 15.
- the steady state temperatures of the upper and lower surfaces of the specimen S are accurately measured with thermometers e.
- the thermal conductivity of the specimen S at temperature T °C (the average temperature of specimen S) can then be calculated from the temperature difference between the upper and lower surfaces of the specimen S and the value of the steady state heat flow which is measured by a heat flow meter d.
- the following equation relates the heat flow Q (Kcal/h) at a state where the temperatures at the upper and lower surfaces of specimen S are, ⁇ 1 and ⁇ 2 respectively, the thickness ⁇ (meters) of specimen S, the effective area A (square meters) of specimen S, and the thermal conductivity ⁇ (Kcal/m ⁇ h ⁇ deg) at temperature T °C.
- Q ( ⁇ / ⁇ ) ⁇ A( ⁇ 1 - ⁇ 2 )
- the standard heat transfer plates S1 and S2 in the above mentioned conventional thermal conductivity measurement apparatus are designed to keep the specimen S at a high temperature as well as to check the thermal conductivity of the specimen against the known thermal conductivity of the standard heat transfer plates S1 and S2.
- This thermal conductivity can be obtained from the surface temperatures which are measured by thermometers f, and heat flow Q.
- Heaters g for compensating the temperature of the inner surface of the enclosure 'a' maintain the surface temperature as shown by the line B in Fig. 15. Thus, the heat transfer between enclosure 'a' and its internal space is suppressed. This arrangement is for the purpose of preventing the heat flow through the peripheral part of the enclosure.
- the upper surface temperature ⁇ 1 of specimen S should be set slightly higher than measuring temperature T and the lower surface temperature ⁇ 2 should be set slightly lower than temperature T.
- the mean temperature of ⁇ 1 and ⁇ 2 is then considered to be the average internal temperature of specimen S and can be regarded as the measuring temperature T at which the measuring will be conducted.
- the object of the present invention is to provide an accurate, easy method for measuring the thermal conductivity of a specimen at any desired temperature. According to the present invention, there is provide a method for measuring thermal conductivity of a material as defined in claim 1 below.
- Figure 1 is a vertical sectional view of a thermal conductivity measuring apparatus.
- Figure 2 is a schematic view which defines the parameters for measuring thermal conductivity of standard heat transfer plates.
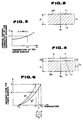
- Figure 3 shows the relationship between thermal conductivity and surface temperatures of standard heat transfer plates.
- Figure 4 defines the parameters for measuring thermal conductivity of a specimen laid on a standard heat transfer plate.
- Figure 5 is a vertical sectional view of a means for measuring thermal conductivity based on a first embodiment of this invention.
- Figure 6 shows the internal temperature distribution of a specimen based upon the first embodiment of this invention.
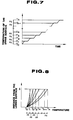
- Figure 7 shows the surface temperature of a specimen based upon a second embodiment of this invention.
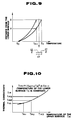
- Figures 8 and 9 show the internal temperature distribution of specimen based upon the second embodiment of this invention.
- Figure 10 shows a functional relationship between the upper surface temperature and thermal conductivity of a specimen.
- Figure 11 is a view used to explain the correction of measurement errors which arise due to radial heat flow in the above mentioned embodiments of this invention.
- Figure 12 is an enlarged view of a part of Figure 11.
- Figure 13 is a view used to explain the correction of measurement errors which arise due to heat transfer between heat flow meters and the auxiliary heater.
- Figure 14 shows the relationship between thermal conductivity and temperatures of various materials.
- Figure 15 is a vertical sectional view which shows a schematic structure of a conventional means of measuring thermal conductivity.
- Figure 16 shows an internal thermal state of a specimen when the thermal conductivity of the specimen is being measured.
- FIG. 1 is a vertical sectional view of a thermal conductivity measuring apparatus which is appropriately used to illustrate the comparative method.
- housing 1 consists of a main body 2 and a cap 4 which is connected to the main body 2 with a hinge 3.
- the main body 2 has a water cooled jacket.
- measuring chamber 8 is defined by a lower heat insulator 5 and an upper heat insulator 6 and a cylindrical heat insulator 7.
- a main heater 9 is installed at the upper part of the measuring chamber 8 in order to keep the internal temperature of the chamber at a particular temperature.
- an auxiliary heater 10 is embedded to keep the internal temperature of the lower heat insulator at the same temperature as the heat flow meter 15 (to be described later).
- Electric terminals 11 and 12, passing through the cap 4 and the main body 2 are connected to the main heater 9 and the auxiliary heater 10, respectively.
- a radiation type thermometer 13 is used to measure the internal temperature of the measuring chamber 8.
- the internal surface of the cylindrical heat insulator 7, which forms the side walls of the measuring chamber 8, is coated with a heat compensating plate 14 which is made of a material with sufficient heat resistance and high thermal conductivity, such as graphite, heat resistant steel or molybdenum.
- the high thermal conductivity of the heat compensating plate 14 allows the heat to flow downward from the chamber 8, maintaining a temperature distribution similar to that through the specimen S and also through the standard heat transfer plate 24.
- the internal temperature of the cylindrical heat insulator 7 can therefore be kept the same as that of specimen S or standard heat transfer plate 24 (described later).
- a heater g which is used in a conventional measuring means (Fig. 15) for the purpose of temperature compensation of the side walls is not necessary, and thus the structure can be simplified and its size can be reduced.
- a disc-shaped heat flow meter 15 is positioned with a ring-shaped auxiliary cooling plate 16 disposed around its periphery.
- a spiral passage is formed inside the heat flow meter 15 so as to measure the heat flow.
- a lead-in duct 17 and lead-out duct 18 are connected to the spiral passage to carry the temperature detecting gas flow to and from the spiral passage in the direction indicated by the arrow in the figure.
- a spiral passage through which gas coolant runs, is formed inside the auxiliary cooling plate 16.
- a lead-in duct 19 and a lead-out duct 20 are connected to the spiral passage so as to carry the coolant gas to and from the spiral passage in the direction indicated by the arrow in the figure.
- the heat detecting gas and the coolant gas are heated to a certain temperature by gas pre-heaters 21 and 22 which are embedded at a lower part of the heat insulator 5 and then pass to the heat flow meter 15 and the auxiliary cooling plate 16 respectively.
- thermometers are installed in order to measure the temperatures of the two gases at the spiral passage inlet and outlet.
- Heat flow meter 15 is designed to enable the quantity of heat received by the heat detecting gas to be determined, that is, the heat flow through specimen S, from the temperature difference between the detecting gas temperature at the spiral inlet and outlet, and the flow rate of the gas.
- the auxiliary cooling plate 16 is placed around the heat flow meter 15 and kept at the same temperature as the heat flow meter so as to prevent heat transfer between the two.
- the lower temperature measuring plate 23 Placed upon the upper surface of the said heat flow meter 15 and the auxiliary cooling plate 16 is the lower temperature measuring plate 23.
- the standard heat transfer plate 24 which has heat insulating properties, is placed.
- the specimen S is placed upon the upper surface of the standard heat transfer plate 24 for measurement of its thermal conductivity.
- upper temperature measuring plate 25 is placed.
- Thermocouples are located on the top face of the lower temperature measuring plate 23 and the lower face of the upper temperature measuring plate 25 (not illustrated in the figure).
- the lower surface temperature of the standard heat transfer plate 24 and the upper surface temperature of specimen S are measured with these thermocouples and the upper surface temperature of the upper temperature measuring plate 25 is measured with radiation thermometer 13.
- Element 26 in the figure is a thermal insulator.
- T°C is the mean temperature which is determined from (T + t 1 ')/2 for cases where the difference between T and t 1 ' is small)
- Standard heat transfer plate 24 is placed on the upper surface of the lower temperature measuring plate 23.
- the upper temperature measuring plate 25 is then, directly placed upon the upper surface of the standard heat transfer plate 24 without this specimen S.
- the measuring chamber 8 is closed and hermetically sealed with the upper heat insulator 6 and the cap 4 of the housing 1.
- Heat conductivity of the standard heat transfer plate 24 is then be measured according to the steps described below.
- the main heater 9 and an auxiliary heater 10 are adjusted in order to generate a steady heat flow in the measuring chamber 8 in the same way as the conventional means.
- the heat detecting gas and the gas coolant are then warmed to a certain temperature by gas pre-heaters 21 and 22 respectively.
- the two respective gases are passed through the heat flow meter 15 and the auxiliary cooling plate 16 to maintain the temperature of those plates at the same temperature as that of the two gases.
- the inlet and outlet temperatures and rate of flow of the heat detecting gas through the heat flow meter 15 are measured. From the temperature difference between the inlet and outlet temperatures, flow rate and gas properties, the rate of heat flow through standard heat transfer plate 24 can be obtained.
- the average thermal conductivity of the standard heat transfer plate 24 is determined by formula (2).
- the effective area A of the standard heat transfer plate 24 is the area of the heat flow meter 15.
- the next step is to keep the lower surface temperature t 0 at a certain temperature while the upper surface temperature t 1 is heated until it becomes higher than the measurement temperature T.
- ⁇ 1 ⁇ (t 1 )
- Frction ⁇ can be determined approximately by computer processing of as much data as possible. This function differs depending upon the material of standard heat transfer plate 24.
- specimen S is laid upon the upper surface of the standard heat transfer plate 24 and upper temperature measuring plate 25 is lain upon the upper surface of the specimen.
- the lower surface temperature of the standard heat transfer plate 24 is kept at temperature t 0 and the upper surface temperature of specimen S is kept at measuring temperature T. Once steady state conditions are established, the heat flow Q t is measured.
- ⁇ s is the final value for the thermal conductivity of specimen S at temperature T. More precisely, the thermal conductivity ⁇ s corresponds to a state wherein the upper and the lower surfaces are T and t 1 ' respectively.
- ⁇ 1 ' and t 1 ' are unknown values, the following relationship can be obtained because ⁇ 1 ' is the average thermal conductivity of the standard heat transfer plate 24 when the upper surface temperature is t 1 ' and the lower surface temperature is t 0 .
- ⁇ 1 ' ⁇ (t 1 ')
- the thermal conductivity ⁇ s of specimen S can be obtained by calculation without measuring the lower surface temperature t 1 ' of specimen S. It was difficult to measure the lower surface temperature of specimen S because it was laid directly upon the upper surface of standard heat transfer plate 24 in the conventional measuring means.
- This measuring means can be appropriately applied for the measurement of thermal conductivity at very high temperatures in which case standard heat transfer plate 24 cannot be omitted.
- the thermal conductivity ⁇ s obtained by the above method is an average thermal conductivity at a state wherein the temperature of the upper and the lower surface of the specimen S is T°C and t'°C respectively. But, in the condition that T and t' are close to each other, the observation approximately gives a thermal conductivity at the temperature T°C.
- a standard heat transfer plate which is referred to as standard heat transfer plate 24 in the comparative method, is omitted from this embodiment.
- specimen S is directly placed.
- upper temperature measuring plate 25 is placed upon the upper surface of the specimen S.
- This embodiment of the invention is designed to obtain the average thermal conductivity ⁇ of the specimen S at the measuring temperature T°C wherein the temperature difference between the upper and lower surface of the specimen is supposed to be small, without using the standard heat transfer plate 24.
- the thermal conductivity ⁇ of the specimen S at T°C in other words, is the thermal conductivity when the internal mean temperature of the specimen S is T°C.
- the lower surface temperature of specimen S is kept at T 0 which is considerably lower than measuring temperature T and the upper surface temperature of specimen S is maintained at T 1 which is lower than T by ⁇ T (degrees).
- ⁇ T degrees
- the value of ⁇ T should be as small as possible.
- the upper surface temperature T 1 is controlled to be as follows with the lower surface temperature T 0 at 100°C and ⁇ T at 50 degrees.
- the heat measuring gas and coolant gas are heated up to a certain temperature by gas pre-heaters 21 and 22, in the same manner as with the comparative method, and then led to heat flow meter 15 and auxiliary cooling plate 16 in order to keep them at the same temperature.
- the inlet and outlet temperatures of the heat detecting gas are measured. From the difference of the temperatures and the flow rate, the heat flow through specimen S is obtained.
- the average thermal conductivity ⁇ s1 of the specimen S in this state is obtained by formula (6) using the heat flow Q 1 , the upper and lower surface temperatures of the specimen S and the thickness ⁇ of the specimen S.
- effective area A of the specimen S is the area of heat flow meter 15.
- Q 1 ( ⁇ s1 / ⁇ )A(T 1 -T 0 )
- T 1 T- ⁇ T
- formula (7) can be developed as follows: (Because heat flow Q 2 is the same in the two parts as long as they are in a steady state condition.)
- Formula (7)' represents the heat balance of the part from the lower surface of the specimen to x hereof. Since the upper surface temperature (the temperature at x) is T 1 , and the lower surface temperature T 0 , the value of average thermal conductivity obtained hereupon is ⁇ s1 which is obtained by formula (6).
- Formula (7)'" represents the heat balance of the part from x to the upper surface of the specimen. Since the upper surface temperature is T 2 and the lower surface temperature (the temperature at x) is T 1 , the value of thermal conductivity ⁇ is the final value for the thermal conductivity.
- thermal conductivity ⁇ s1 is measured at upper surface temperature T 1 , which is slightly lower than the measuring temperature and ⁇ s2 at T 2 , which is slightly higher than the measuring temperature while the lower surface of the specimen is kept at T 0 which is considerably lower than the measuring temperature, From the values of ⁇ s1 and ⁇ s2 , thermal conductivity ⁇ is dalculated for measuring temperature T.
- T 1 upper surface temperature
- T 2 lower surface temperature
- thermal conductivity ⁇ is dalculated for measuring temperature T.
- the specimen temperature can be easily controlled an measurement errors can be minimized.
- T 0 and T n-1 T 0 +(N-1) ⁇ t at (N-1)th measurement as shown in Figure 9.
- the difference between T 0 and T n-1 is (N-1) ⁇ t.
- the heat flow is designated as Q n-1 and the average thermal conductivity as ⁇ n-1 :
- Q n-1 ( ⁇ n-1 / ⁇ )A ⁇ (N-1) ⁇ t
- ⁇ n N ⁇ n -(N-1) ⁇ n-1
- the average thermal conductivity, while the upper surface temperature is T n s and the lower surface temperatures T n-1 , will be obtained from the measurement results ⁇ n of the n-th measurement and ⁇ n-1 of the (N-1)th measurement.
- T n can be regarded as the internal mean temperature of a specimen by reducing ⁇ t or by reducing the difference between T n-1 and T n .
- thermal conductivity of a specimen at various temperatures can be easily obtained.
- a continuous graph as shown in Figure 14 can be created to show the relationship between thermal conductivity and temperatures.
- this method of the third embodiment also keeps the lower surface temperature of specimen S at T 0 which is considerably lower than calculation temperature T in the first and second embodiments.
- upper surface temperature T m of specimen S is set substantially higher than lower surface temperature T 0 and measured at least three times. Applying formula (9) which was introduced in the first embodiment, this method is designed to obtain the thermal conductivity La at calculation temperature T by calculation.
- T m1 through T m3 are determined so as to be sufficient to plot the graph shown in Figure 10. Then the heat flow Q m3 is measured and the average thermal conductivity ⁇ m3 is obtained by the following formula.
- Q m3 ( ⁇ m3 / ⁇ )A(T m3 -T 0 )
- the three different temperatures of the upper surface of the specimen T m1 , T m2 and T m3 should be set considerably higher than the lower surface temperature T 0 , for example, at an appropriate temperature such that the graph described in Fig. 10 can be applied near the calculation temperature T. Likewise, the differences among them can be freely chosen.
- a graph is drawn with the upper surface temperature of specimen S as abscissa, and average thermal conductivity ⁇ m as ordinate, and a quadratic function which represents the relationship between ⁇ m f and T m .
- the values of a, b, and c are determined by the least squares approximation method.
- the average thermal conductivity can be obtained by formula (15) or read from Figure 10.
- ⁇ s2 aT 2 2 +bT 2 +c
- the thermal conductivity ⁇ where the lower surface temperature is T 1 , and the upper surface temperature is T 2 (in which case the internal mean temperature of specimen S is the calculation temperature T), can be calculated from only the values of T 1 and T 2 , the values of a, b and c in function ⁇ of formula (15), and the value of lower surface temperature T 0 of specimen S obtained during the measurement for determining the function ⁇ .
- a subsequent calculation of ⁇ at any desired temperature T can be carried out by formula (19). Since a graph similar to Figure 14 can be easily drawn from the formula, the thermal conductivity ⁇ at the desired calculation temperature T can be read from the graph.
- thermal conductivity is measured three times by changing the upper surface temperature T m while keeping the lower surface temperature at the same temperature T 0 .
- function ⁇ which represents the relationship between the upper surface temperature T and thermal conductivity ⁇ can be determined.
- the thermal conductivity ⁇ at a desired calculation temperature T can finally be calculated based upon the determined function ⁇ .
- the value of thermal conductivity ⁇ at any desired calculation temperature T can be easily and accurately obtained.
- the function in the third embodiment is a quadratic function and the thermal conductivity measurement is carried out three times. However, it is not limited to a quadratic. Any type of function, a function of higher degrees or an exponential function, for instance, can be applied as long as it accurately represents the measurement results. If another type of function is applied, then measurement of thermal conductivity should be done as many times as necessary to precisely determine function ⁇ .
- Each step in the measuring procedures of the embodiments can be conducted manually. However, it is highly recommended to equip the measuring means of thermal conductivity with a microcomputer and to program in advance all steps of the measurement to an electronic device so that all procedures of control and calculation of average thermal conductivity from measurement values can be immediately processed by the microcomputer.
- heat may flow from the side part of specimen S through heat insulator 26 (see Figures 1 and 5) when conducting measurement through the above described procedures with the said measuring means of thermal conductivity and that this heat flow may create measurement errors.
- the radial flow quantity is determined by measuring the internal and external temperatures of heat insulator 26, then the measured value of heat flow which is obtained by the heat flow meter 15 is corrected.
- heat insulator 26 it is recommended to divide heat insulator 26 into several parts with thicknesses of ⁇ 1 , ⁇ 2 , ..., ⁇ n and to measure the internal and external temperatures of each part. Based upon these temperatures, Qb' can be obtained.
- Qb' ⁇ b /(R 3 -R 2 ) ⁇ (R 1 /R 2 ) 4 ⁇ 2 ⁇ Rm ⁇ n (t 1n -t 2n ) ⁇
- Rm (R 3 -R 2 )/ln(R 3 /R 2 )
- the heat transfer may be prevented or the following correction can be applied.
- lower surface temperature T 0 of specimen S is always maintained at a fixed temperature regardless of the upper surface temperature.
- the quantity of heat detecting gas led into heat flow meter 15 should be adjustable.
- the gas flow quantity can be controlled so as not to allow the temperature of heat detecting gas to increase excessively due to heat reception from specimen S.
- the temperature rise should be limited within 5 to 10 degrees because minimum measurement errors arise within that range.
- the coolant to circulate through the heat flow meter was a gas.
- any fluid such as water or oil may be employed instead of the gas.
Landscapes
- Physics & Mathematics (AREA)
- Health & Medical Sciences (AREA)
- Life Sciences & Earth Sciences (AREA)
- Chemical & Material Sciences (AREA)
- Analytical Chemistry (AREA)
- Biochemistry (AREA)
- General Health & Medical Sciences (AREA)
- General Physics & Mathematics (AREA)
- Immunology (AREA)
- Pathology (AREA)
- Investigating Or Analyzing Materials Using Thermal Means (AREA)
Description
- This invention relates to a measurement method for thermal conductivity under steady state conditions at high temperatures which can be appropriately applied to various kinds of materials such as heat insulating materials.
- In general, the thermal conductivity of insulating materials varies depending on the temperature. As shown in Figure 14, it is a general characteristics that the higher the temperature, the higher the heat conductivity. In other words, heat is more easily conducted through a material at a higher temperature than at lower temperature. For heat insulating materials to be used at over 1,000°C, it is necessary to test them at the temperatures at which they will be used.
- A conventional method for measurement of thermal conductivity is prescribed in ASTM C177-84 etc., for example, as shown in Figure 15. A conventional apparatus for measuring thermal conductivity consists of a main heater b and an auxiliary heater c which are disposed respectively in the upper and lower parts of the enclosure a and are designed to generate a downward steady heat flow. A heat flow meter d is disposed above the auxiliary heater c and is used to measure the steady heat flow.
- When thermal conductivity is measured with this conventional apparatus, specimen S is first placed at the center of the enclosure a, and standard heat transfer plates S1 and S2 of known thermal conductivity are positioned on and under the specimen S. Second, the main heater b and the auxiliary heater c are controlled to create a steady state heat flow in the enclosure. The average temperature of specimen S is maintained at the temperature T°C at which the heat conductivity is to be measured whereas the temperature within the specimen varies as shown in Fig. 15.
- Next, the steady state temperatures of the upper and lower surfaces of the specimen S are accurately measured with thermometers e. The thermal conductivity of the specimen S at temperature T °C (the average temperature of specimen S) can then be calculated from the temperature difference between the upper and lower surfaces of the specimen S and the value of the steady state heat flow which is measured by a heat flow meter d.
- The following equation relates the heat flow Q (Kcal/h) at a state where the temperatures at the upper and lower surfaces of specimen S are, θ1 and θ2 respectively, the thickness δ (meters) of specimen S, the effective area A (square meters) of specimen S, and the thermal conductivity λ (Kcal/m·h·deg) at temperature T °C.


- The standard heat transfer plates S1 and S2 in the above mentioned conventional thermal conductivity measurement apparatus are designed to keep the specimen S at a high temperature as well as to check the thermal conductivity of the specimen against the known thermal conductivity of the standard heat transfer plates S1 and S2. This thermal conductivity can be obtained from the surface temperatures which are measured by thermometers f, and heat flow Q.
- Heaters g for compensating the temperature of the inner surface of the enclosure 'a' maintain the surface temperature as shown by the line B in Fig. 15. Thus, the heat transfer between enclosure 'a' and its internal space is suppressed. This arrangement is for the purpose of preventing the heat flow through the peripheral part of the enclosure.
- It is rather difficult or impossible at higher temperatures to conduct accurate measuring of thermal conductivity of a specimen with the conventional measuring apparatus since its surfaces are in contact with the standard heat transfer plates and thermocouples are used for temperature measuring. This limits the temperature at which the apparatus is used.
- It is possible to remove the upper standard heat transfer plate, but the lower standard heat transfer plate cannot be removed because the plate is indispensable in keeping the heat flow meter d at a lower temperature when the measuring temperature is very high.
- In the above mentioned case, the upper surface temperature θ1 of specimen S should be set slightly higher than measuring temperature T and the lower surface temperature θ2 should be set slightly lower than temperature T. The mean temperature of θ1 and θ2 is then considered to be the average internal temperature of specimen S and can be regarded as the measuring temperature T at which the measuring will be conducted. In other word, the values of θ1 and θ2 are each kept at a point which satisfies the following formula.

- The assumption that mean temperature of the upper and lower surfaces is the internal mean temperature of specimen S is valid as long as the thermal conductivity of specimen S is constant and its internal temperature changes rectilinearly between θ1 and θ2 as shown as B in Figure 15.
- However, in reality, the thermal conductivity of specimen S, varies according to temperature. Therefore the internal temperature does not change rectilinearly, but makes a curvilinear change shown as "B'" in Figure 16.
- For large temperature differences between θ1and θ2 there is a big difference between the internal mean temperature T, obtained by assuming the simple average of θ1 and θ2, and the actual internal mean temperature T. Thus the simple average temperature of the two surfaces does not represent the overall mean temperature of specimen S. However, if the temperature difference between θ1 and θ2 is small, the change of temperature can be regarded as a rectilinear change and the difference between the two values of temperatures T and T' can be disregarded.
- However, if the temperature difference is too small, other problems will arise. Decreasing the amount of temperature difference makes it necessary to reduce the thickness of specimen S. The decrease in temperature difference however makes it more difficult to maintain the temperature difference between the upper and lower surfaces of specimen S constant. Furthermore, temperature measurement errors will cause a magnification of the error in the results, when the temperature difference is very small. For these reasons, it is virtually always the case that a large temperature difference is employed according to the conventional thermal conductivity measuring apparatus.
- The object of the present invention is to provide an accurate, easy method for measuring the thermal conductivity of a specimen at any desired temperature. According to the present invention, there is provide a method for measuring thermal conductivity of a material as defined in claim 1 below.
- Figure 1 is a vertical sectional view of a thermal conductivity measuring apparatus.
- Figure 2 is a schematic view which defines the parameters for measuring thermal conductivity of standard heat transfer plates.
- Figure 3 shows the relationship between thermal conductivity and surface temperatures of standard heat transfer plates.
- Figure 4 defines the parameters for measuring thermal conductivity of a specimen laid on a standard heat transfer plate.
- Figure 5 is a vertical sectional view of a means for measuring thermal conductivity based on a first embodiment of this invention.
- Figure 6 shows the internal temperature distribution of a specimen based upon the first embodiment of this invention.
- Figure 7 shows the surface temperature of a specimen based upon a second embodiment of this invention.
- Figures 8 and 9 show the internal temperature distribution of specimen based upon the second embodiment of this invention.
- Figure 10 shows a functional relationship between the upper surface temperature and thermal conductivity of a specimen.
- Figure 11 is a view used to explain the correction of measurement errors which arise due to radial heat flow in the above mentioned embodiments of this invention.
- Figure 12 is an enlarged view of a part of Figure 11.
- Figure 13 is a view used to explain the correction of measurement errors which arise due to heat transfer between heat flow meters and the auxiliary heater.
- Figure 14 shows the relationship between thermal conductivity and temperatures of various materials.
- Figure 15 is a vertical sectional view which shows a schematic structure of a conventional means of measuring thermal conductivity.
- Figure 16 shows an internal thermal state of a specimen when the thermal conductivity of the specimen is being measured.
- Embodiments of this invention will be described in detail referring to the figures.
- First, however, a comparative method will be explained referring to Figures 1 to 4.
- Figure 1 is a vertical sectional view of a thermal conductivity measuring apparatus which is appropriately used to illustrate the comparative method. In this figure, housing 1 consists of a
main body 2 and acap 4 which is connected to themain body 2 with ahinge 3. Themain body 2 has a water cooled jacket. - In the
main body 2,measuring chamber 8 is defined by alower heat insulator 5 and anupper heat insulator 6 and acylindrical heat insulator 7. Amain heater 9 is installed at the upper part of the measuringchamber 8 in order to keep the internal temperature of the chamber at a particular temperature. - In the
lower heat insulator 5, anauxiliary heater 10 is embedded to keep the internal temperature of the lower heat insulator at the same temperature as the heat flow meter 15 (to be described later).Electric terminals 11 and 12, passing through thecap 4 and themain body 2, are connected to themain heater 9 and theauxiliary heater 10, respectively. Aradiation type thermometer 13 is used to measure the internal temperature of the measuringchamber 8. - The internal surface of the
cylindrical heat insulator 7, which forms the side walls of the measuringchamber 8, is coated with aheat compensating plate 14 which is made of a material with sufficient heat resistance and high thermal conductivity, such as graphite, heat resistant steel or molybdenum. - The high thermal conductivity of the
heat compensating plate 14 allows the heat to flow downward from thechamber 8, maintaining a temperature distribution similar to that through the specimen S and also through the standardheat transfer plate 24. The internal temperature of thecylindrical heat insulator 7 can therefore be kept the same as that of specimen S or standard heat transfer plate 24 (described later). Moreover, a heater g which is used in a conventional measuring means (Fig. 15) for the purpose of temperature compensation of the side walls is not necessary, and thus the structure can be simplified and its size can be reduced. - At the center of the
lower heat insulator 5, a disc-shapedheat flow meter 15 is positioned with a ring-shapedauxiliary cooling plate 16 disposed around its periphery. A spiral passage is formed inside theheat flow meter 15 so as to measure the heat flow. A lead-induct 17 and lead-outduct 18 are connected to the spiral passage to carry the temperature detecting gas flow to and from the spiral passage in the direction indicated by the arrow in the figure. - Inside the
auxiliary cooling plate 16, a spiral passage, through which gas coolant runs, is formed. A lead-induct 19 and a lead-outduct 20 are connected to the spiral passage so as to carry the coolant gas to and from the spiral passage in the direction indicated by the arrow in the figure. - The heat detecting gas and the coolant gas are heated to a certain temperature by
gas pre-heaters heat insulator 5 and then pass to theheat flow meter 15 and theauxiliary cooling plate 16 respectively. - Although they are not illustrated in the figure, thermometers are installed in order to measure the temperatures of the two gases at the spiral passage inlet and outlet.
-
Heat flow meter 15 is designed to enable the quantity of heat received by the heat detecting gas to be determined, that is, the heat flow through specimen S, from the temperature difference between the detecting gas temperature at the spiral inlet and outlet, and the flow rate of the gas. Theauxiliary cooling plate 16 is placed around theheat flow meter 15 and kept at the same temperature as the heat flow meter so as to prevent heat transfer between the two. - Placed upon the upper surface of the said
heat flow meter 15 and theauxiliary cooling plate 16 is the lowertemperature measuring plate 23. Upon the upper surface of the lowertemperature measuring plate 23, the standardheat transfer plate 24, which has heat insulating properties, is placed. The specimen S is placed upon the upper surface of the standardheat transfer plate 24 for measurement of its thermal conductivity. Upon the upper surface of the specimen, uppertemperature measuring plate 25 is placed. - Thermocouples are located on the top face of the lower
temperature measuring plate 23 and the lower face of the upper temperature measuring plate 25 (not illustrated in the figure). The lower surface temperature of the standardheat transfer plate 24 and the upper surface temperature of specimen S are measured with these thermocouples and the upper surface temperature of the uppertemperature measuring plate 25 is measured withradiation thermometer 13.Element 26 in the figure is a thermal insulator. - Next is a description of a measuring method using this apparatus.
- The measuring method, which will be discussed hereafter, is an indirect way in which thermal conductivity λs of specimen S at temperature T°C (Precisely, T°C is the mean temperature which is determined from (T + t1')/2 for cases where the difference between T and t1' is small), is obtained by a calculation using the measured average thermal conductivity δ1 of the standard
heat transfer plate 24 without measuring the lower surface temperature of the specimen S. - Standard
heat transfer plate 24 is placed on the upper surface of the lowertemperature measuring plate 23. The uppertemperature measuring plate 25 is then, directly placed upon the upper surface of the standardheat transfer plate 24 without this specimen S. The measuringchamber 8 is closed and hermetically sealed with theupper heat insulator 6 and thecap 4 of the housing 1. - Heat conductivity of the standard
heat transfer plate 24 is then be measured according to the steps described below. - The
main heater 9 and anauxiliary heater 10 are adjusted in order to generate a steady heat flow in the measuringchamber 8 in the same way as the conventional means. The heat detecting gas and the gas coolant are then warmed to a certain temperature bygas pre-heaters heat flow meter 15 and theauxiliary cooling plate 16 to maintain the temperature of those plates at the same temperature as that of the two gases. Once a steady state condition is established, the inlet and outlet temperatures and rate of flow of the heat detecting gas through theheat flow meter 15 are measured. From the temperature difference between the inlet and outlet temperatures, flow rate and gas properties, the rate of heat flow through standardheat transfer plate 24 can be obtained. - From the value of heat flow, and the upper surface temperature and the thickness of the standard
heat transfer plate 24, the average thermal conductivity of the standardheat transfer plate 24 is determined by formula (2). - With the heat flow of the standard
heat transfer plate 24 referred to as Q1, the lower surface temperature of the plate as t0, the upper surface temperature as t1, the thickness of the plate as δ1, and the average thermal conductivity of the plate at this temperature as λ1, the value of λ1 can be obtained by the following formula which holds for the relationship among these factors.
- In this case, the effective area A of the standard
heat transfer plate 24 is the area of theheat flow meter 15. - The next step is to keep the lower surface temperature t0 at a certain temperature while the upper surface temperature t1 is heated until it becomes higher than the measurement temperature T.
- While increasing the temperature in steps, the average thermal conductivity of the plate is measured at each temperature step in the same manner as described above. Based upon the measurement result, a chart is drawn of the relationship between the average thermal conductivity λ1 and the upper surface temperature t1 as shown in Figure 3 by changing the temperature of the specimen S in steps.
- Since λ1 is a function of t1, it can be described as follows:

- "Function φ can be determined approximately by computer processing of as much data as possible. This function differs depending upon the material of standard
heat transfer plate 24. - After acquiring the values of λ1 by means of equation (3) for different temperature (the temperatures are chosen so that they are grouped around the temperature T), specimen S is laid upon the upper surface of the standard
heat transfer plate 24 and uppertemperature measuring plate 25 is lain upon the upper surface of the specimen. - As illustrated in Figure 4, the lower surface temperature of the standard
heat transfer plate 24 is kept at temperature t0 and the upper surface temperature of specimen S is kept at measuring temperature T. Once steady state conditions are established, the heat flow Qt is measured. - Provided that the thickness of a specimen is referred to as δs and the integrated thermal conductivity of the specimen S and the standard
heat transfer plate 24 are referred to as λt, then the following formula holds:
- As a result of this formula, the integrated thermal conductivity λt of specimen S and standard
heat transfer plate 24 can be obtained. - Consider the state illustrated in Figure 4 separately for specimen S and standard
heat transfer plate 24, and assume that the thermal conductivity of specimen S is λs, the lower surface temperature of the specimen (which is equal to the upper surface temperature of standard heat transfer plate 24) is t1', and the average thermal conductivity of the standard heat transfer plate is λ1', then from formula (4), because each of the two heat flows, one is through the specimen S and the other is through the standardheat transfer plate 24 is equal to the overall heat flow, the heat flow can be expressed as follows;
- Thus the following will be obtained if Formula (4)' is equal to Formula (4)".

- On the other hand, the integrated heat resistance R of specimen S and standard
heat transfer plate 24 in this condition can be represented as the sum of the heat resistance R1 of standardheat transfer plate 24 and the heat resistance Rs of specimen S; that is,

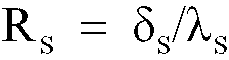
- Hence;

- Therefore, the following holds for the factors.

- In the above mentioned formulas, λs is the final value for the thermal conductivity of specimen S at temperature T. More precisely, the thermal conductivity λs corresponds to a state wherein the upper and the lower surfaces are T and t1' respectively.
- Although λ1' and t1' are unknown values, the following relationship can be obtained because λ1' is the average thermal conductivity of the standard
heat transfer plate 24 when the upper surface temperature is t1' and the lower surface temperature is t0.
- By solving simultaneous equations of formula (3)', (4)'" and (5), the three unknown values for λs, λ1', and t1' can be obtained. This calculation will be easily conducted with a microcomputer.
- In spite of obtaining the value of Function φ, it is also preferable to read the values of λ1' and t1', which satisfy the relations of formulas (4)'" and (5), from a chart showing the relationship between the average thermal conductivity λ1 and the upper surface temperature t1 such as in Figure 3.
- As described in the preceding paragraphs, with this method, the thermal conductivity λs of specimen S can be obtained by calculation without measuring the lower surface temperature t1' of specimen S. It was difficult to measure the lower surface temperature of specimen S because it was laid directly upon the upper surface of standard
heat transfer plate 24 in the conventional measuring means. - This measuring means can be appropriately applied for the measurement of thermal conductivity at very high temperatures in which case standard
heat transfer plate 24 cannot be omitted. - In addition, the procedure for the means of measuring thermal conductivity can be simplified.
- Precisely, the thermal conductivity λs obtained by the above method is an average thermal conductivity at a state wherein the temperature of the upper and the lower surface of the specimen S is T°C and t'°C respectively. But, in the condition that T and t' are close to each other, the observation approximately gives a thermal conductivity at the temperature T°C.
- If the same standard heat transfer plates are repeatedly used, then the average thermal conductivity is measured once at the beginning and a chart drawn similar to Figure 3 in order to obtain the function φ. This makes it unnecessary to measure the average thermal conductivity of the plates every time.
- The following is a description of a first embodiment of this invention referring to Figures 5 and 6.
- As shown in Figure 5, a standard heat transfer plate, which is referred to as standard
heat transfer plate 24 in the comparative method, is omitted from this embodiment. - Upon the upper surface of lower
temperature measuring plate 23, specimen S is directly placed. And the uppertemperature measuring plate 25 is placed upon the upper surface of the specimen S. - This embodiment of the invention is designed to obtain the average thermal conductivity λ of the specimen S at the measuring temperature T°C wherein the temperature difference between the upper and lower surface of the specimen is supposed to be small, without using the standard
heat transfer plate 24. The thermal conductivity λ of the specimen S at T°C, in other words, is the thermal conductivity when the internal mean temperature of the specimen S is T°C. - In this case, the lower surface temperature of specimen S is kept at T0 which is considerably lower than measuring temperature T and the upper surface temperature of specimen S is maintained at T1 which is lower than T by ΔT (degrees). The value of ΔT should be as small as possible.
- In the case where measurement temperature T is 2,000°C for instance, the upper surface temperature T1 is controlled to be as follows with the lower surface temperature T0 at 100°C and ΔT at 50 degrees.

- By this control, the temperature gradient is increased inside the specimen as indicated by B" in Figure 6. The average thermal conductivity λs1 of specimen S in this state will then be obtained.
- Basically the heat measuring gas and coolant gas are heated up to a certain temperature by
gas pre-heaters heat flow meter 15 andauxiliary cooling plate 16 in order to keep them at the same temperature. - Once the internal temperatures of measuring
chamber 8 and specimen S are at a steady state or no temperature change is detected (more specifically, if the temperature change over 10 minutes is constant within -0.5 and 0.5 degrees or within -0.1 and 0.1 percent of a certain allowable value), the inlet and outlet temperatures of the heat detecting gas are measured. From the difference of the temperatures and the flow rate, the heat flow through specimen S is obtained. - The average thermal conductivity λs1 of the specimen S in this state is obtained by formula (6) using the heat flow Q1, the upper and lower surface temperatures of the specimen S and the thickness δ of the specimen S.
- Incidentally, effective area A of the specimen S is the area of
heat flow meter 15.

- Thus, average thermal conductivity λs1, in the state in which the upper surface temperature is T1 and the lower surface temperature is T0, can be obtained.
- The next step is to raise the upper surface temperature to T2 which is higher than T by ΔT (in this example, T2=2,050°C).
- Once a steady state is established, heat flow Q2 is measured in the same manner as mentioned before and thermal conductivity λs2 is obtained in this state from formula (7).


- Thus, average thermal conductivity λs2, in the state in which the upper surface temperature is T2 and the lower surface temperature is T0, can be obtained.
- The temperature gradient which is shown as B'" in Figure 6 will increase in specimen S in this state.
- Provided that the distance from this temperature gradient curve B'" to the part on the lower surface of specimen S (at which the internal temperature is T1) is x, and the thickness of specimen S is divided into a part from the lower surface to x, and a part from x to the upper surface, formula (7) can be developed as follows: (Because heat flow Q2 is the same in the two parts as long as they are in a steady state condition.)

- Formula (7)' represents the heat balance of the part from the lower surface of the specimen to x hereof. Since the upper surface temperature (the temperature at x) is T1, and the lower surface temperature T0, the value of average thermal conductivity obtained hereupon is λs1 which is obtained by formula (6).
- Formula (7)'" represents the heat balance of the part from x to the upper surface of the specimen. Since the upper surface temperature is T2 and the lower surface temperature (the temperature at x) is T1, the value of thermal conductivity λ is the final value for the thermal conductivity.
- Provided that formula (7) = formula (7)', the following will be obtained.

- Provided that formula (7)' = formula (7)" substituting into formula (8) gives;


- On the other hand, if T2-T1=2 ΔT = Δt, then T1=T2-Δt. Substituting them into formula (9), the following will be obtained.

- With formula (9) or (9)', average thermal conductivity λ in the state in which the upper surface temperature is T2 and the lower surface temperature is T1, can be obtained.
- There will be no problem if the simple mean temperature of T1 and T2 is regarded as the internal mean temperature of specimen S because the difference between T1 and T2 is sufficiently small.
- Thus, the value of λ which is obtained by formulas (9) and (9)' can be considered to be the value of thermal conductivity at T=(T1+T2)/2.
- As described in the preceding paragraphs, in this embodiment of the invention, average thermal conductivity λs1 is measured at upper surface temperature T1, which is slightly lower than the measuring temperature and λs2 at T2, which is slightly higher than the measuring temperature while the lower surface of the specimen is kept at T0 which is considerably lower than the measuring temperature, From the values of λs1 and λs2, thermal conductivity λ is dalculated for measuring temperature T. Thus an accurate measurement of temperature can be achieved without use of the standard
heat transfer plate 24 of the comparative method. This accuracy of measurement makes it possible to obtain easily and precisely the value of thermal conductivity λ at any desired measuring temperature T. - What is more, since actual measurement is carried out in such a state that a big difference between the upper and lower surface temperatures is ensured, the specimen temperature can be easily controlled an measurement errors can be minimized.
- The next is a description ofa second embodiment of this invention referring to Figures 7 to 9.
- The measurment steps of this embodiment are designed to basically follow those of the first embodiment; namely, the upper surface temperature is increasingly raised by Δt degree from T0, T1, T2 ... up to Tn=T0+N ΔT, whereas the lower surface temperature is kept at the same temperature T0.
- Under this control of temperature, temperature gradient will gradually rise inside specimen S as shown in Figure 8.
- In this case, the lower surface temperature of the specimen is T0 and the upper surface temperature is Tn-1=T0+(N-1) Δt at (N-1)th measurement as shown in Figure 9. Thus the difference between T0 and Tn-1 is (N-1)Δt. Provided that the heat flow is designated as Qn-1 and the average thermal conductivity as λn-1, the following formula will hold for Qn-1 and λn-1:

- Since the lower surface temperature remains T0s and the upper surface temperature is Tn=T0+NΔt at the n-th measurement, the difference of the two temperatures will be NΔt. Provided that the heat flow is designated as Qn and the average thermal conductivity as λn, the following formula will hold for the two.

- In the state of the n-th measurement, should the distance (from the lower surface to a part where the internal temperature of a specimen is the same as the previous temperature Tn-1) be designated as y and the thickness of a specimen be divided into two parts, namely one from the lower surface to y and the other from y to the upper surface, then formula (11) can be developed in the same way as formulas (7)' and (7)"

- An means that the upper surface temperature is Tn=T0+NΔt and the lower surface temperature (which is the temperature at y) is T=T0+(N-1)Δt. Thus the thermal conductivity, with the temperature difference Δt and the simple mean temperature is

- Solving the above mentioned formulas, the following will be obtained.

- Hence,

- In other words, the average thermal conductivity, while the upper surface temperature is Tns and the lower surface temperatures Tn-1, will be obtained from the measurement results λn of the n-th measurement and λn-1 of the (N-1)th measurement.
- In addition, the following formulas can be established.

- The value of Tn can be regarded as the internal mean temperature of a specimen by reducing Δt or by reducing the difference between Tn-1 and Tn.
- With this measuring method of the second embodiment, thermal conductivity of a specimen at various temperatures can be easily obtained. By minimizing the value of Δt, a continuous graph as shown in Figure 14 can be created to show the relationship between thermal conductivity and temperatures.
- Just as in the first embodiment (since actual measurement is conducted by setting lower surface temperature T0 of a specimen at a sufficiently low temperature and maintaining a large temperature differential) it is easy to maintain the temperature of a specimen thus measurement errors will be reduced.
- In the following paragraphs, a third embodiment of this invention will be described referring to Figure 10.
- As for obtaining the thermal conductivity λ of specimen S at calculation temperature T°C, this method of the third embodiment also keeps the lower surface temperature of specimen S at T0 which is considerably lower than calculation temperature T in the first and second embodiments. On the other hand, upper surface temperature Tm of specimen S is set substantially higher than lower surface temperature T0 and measured at least three times. Applying formula (9) which was introduced in the first embodiment, this method is designed to obtain the thermal conductivity La at calculation temperature T by calculation.
- When the lower surface temperature of specimen S is designated as T0, and the upper surface temperature Tm is set at a desired temperature Tm1, the heat flow Qm1 is measured in that state and the average thermal conductivity λm1 can then be determined based on the value of Qm1 and by the following formula:

- The upper surface temperature Tm is then changed to a desired temperature Tm2 while the lower surface temperature is maintained at T0. Then heat flow Qm2 is measured in that state and average thermal conductivity λm2 can be obtained by the following formula as described in the preceding paragraph.

- The upper surface temperature Tm is then changed to a desired temperature Tm1 through Tm3 while the lower surface temperature is maintained at T0. Tm1 through Tm3 are determined so as to be sufficient to plot the graph shown in Figure 10. Then the heat flow Qm3 is measured and the average thermal conductivity λm3 is obtained by the following formula.

- The three different temperatures of the upper surface of the specimen Tm1, Tm2 and Tm3 should be set considerably higher than the lower surface temperature T0 , for example, at an appropriate temperature such that the graph described in Fig. 10 can be applied near the calculation temperature T. Likewise, the differences among them can be freely chosen.
- Based upon the measurement results obtained as described above, a graph is drawn with the upper surface temperature of specimen S as abscissa, and average thermal conductivity λm as ordinate, and a quadratic function which represents the relationship between λmf and Tm.

- For this formula, the values of a, b, and c are determined by the least squares approximation method.
- Once function Ψ is determined, when the lower surface temperature is set at To and the upper surface temperature Tn is variable, the average thermal conductivity can be obtained by formula (15) or read from Figure 10.
- In the case where the lower surface temperature is T0 and the upper surface temperature is T1, the average thermal conductivity λs1 is thus obtained by formula (16).

- The average thermal conductivity λs2 with lower surface temperature T0 and upper surface temperature T2 is obtained by the following formula.

- Substituting the values of λs1 and λs2 into formula (9), which is used to obtain thermal conductivity λ, in the case where the lower surface temperature is T1, and the upper surface temperature is T2, the following formula can be obtained:

- By this formula, the thermal conductivity λ where the lower surface temperature is T1, and the upper surface temperature is T2 (in which case the internal mean temperature of specimen S is the calculation temperature T), can be calculated from only the values of T1 and T2, the values of a, b and c in function Ψ of formula (15), and the value of lower surface temperature T0 of specimen S obtained during the measurement for determining the function Ψ.
- Once function Ψ is determined, it will not be necessary to measure the upper surface temperature near calculation temperature T. The value of the thermal conductivity λ at the calculation temperature T can be calculated by formula (18).
- The value of thermal conductivity λ, the final goal of this measuring method, is the value when the difference between T1 and T2 is infinitely small; that is, in the case where T2 is nearly equal to T1=T. By substituting T2= T1=T into formula (18), the following formula can be obtained:

- By this formula (19), the thermal conductivity λ of specimen S at calculation temperature T can be obtained.
- A subsequent calculation of λ at any desired temperature T can be carried out by formula (19). Since a graph similar to Figure 14 can be easily drawn from the formula, the thermal conductivity λ at the desired calculation temperature T can be read from the graph.
- As described in the preceding paragraphs with the measuring method of this embodiment, thermal conductivity is measured three times by changing the upper surface temperature Tm while keeping the lower surface temperature at the same temperature T0. Based upon the results of the three measurements, function Ψ, which represents the relationship between the upper surface temperature T and thermal conductivity λ can be determined. The thermal conductivity λ at a desired calculation temperature T can finally be calculated based upon the determined function Ψ. Thus the value of thermal conductivity λ at any desired calculation temperature T can be easily and accurately obtained.
- Because the measurement is required to be done only three times in order to determine function Ψ, temperature control of specimen S is easy and measuring errors are limited as much as possible since the three measurements are conducted with a large temperature difference maintained between the upper and lower surfaces.
- The function in the third embodiment is a quadratic function and the thermal conductivity measurement is carried out three times. However, it is not limited to a quadratic. Any type of function, a function of higher degrees or an exponential function, for instance, can be applied as long as it accurately represents the measurement results. If another type of function is applied, then measurement of thermal conductivity should be done as many times as necessary to precisely determine function Ψ .
- Descriptions of the embodiments of this invention are now finished.
- Each step in the measuring procedures of the embodiments can be conducted manually. However, it is highly recommended to equip the measuring means of thermal conductivity with a microcomputer and to program in advance all steps of the measurement to an electronic device so that all procedures of control and calculation of average thermal conductivity from measurement values can be immediately processed by the microcomputer.
- It should be noted that heat may flow from the side part of specimen S through heat insulator 26 (see Figures 1 and 5) when conducting measurement through the above described procedures with the said measuring means of thermal conductivity and that this heat flow may create measurement errors. In order to carry out more accurate measurement, the radial flow quantity is determined by measuring the internal and external temperatures of
heat insulator 26, then the measured value of heat flow which is obtained by theheat flow meter 15 is corrected. - When the internal mean temperature of
heat insulator 26 is designated as t1, the external mean temperature of the heat insulator as t2, the thermal conductivity of the heat insulator as λb, the inside diameter as R2, the outer diameter as R3, and the thickness of specimen S as δ , heat quantity Qb which affects the area of specimen S within effective diameter R1 as heat flow from the side part of specimen S throughheat insulator 26, will be represented as follows:
- However,

- Thus the value of Qb should be corrected in accordance with the value of the heat flow which is obtained by the
heat flow meter 15. - Since the internal and external temperatures of
heat insulator 26 are not uniform in the direction of the thickness of specimen S, it is preferable to measure the internal and external temperatures at points located at 2/3 or 3/4 of the thickness of specimen S (z=(2/3 3/4)δ) from the upper surface of the specimen and to designate the temperatures as internal mean temperature t1, and external mean temperature t2 so as to represent the overall temperature ofheat insulator 26. - To be more exact, as shown in Figure 12, it is recommended to divide
heat insulator 26 into several parts with thicknesses of δ1, δ2, ..., δn and to measure the internal and external temperatures of each part. Based upon these temperatures, Qb' can be obtained. - Provided that the internal temperature of each part is designated as t1n and the external temperature as t2n, then Qb' will be represented as follows:


- Another possible reason for measurement errors is heat transfer which arises between
heat flow meter 15 andauxiliary heater 10 due to the temperature difference between the two. - For the purpose of preventing these errors, it is preferable to measure the inlet and outlet temperatures of the heat detecting gas to and from the
heat flow meter 15, in order to adjust the mean temperature of the inlet and outlet temperatures to become the same as that of theauxiliary heater 10. With this procedure, the heat transfer may be prevented or the following correction can be applied. - As shown in Figure 13, the quantity of heat transfer Qc between
heat flow meter 15 andauxiliary heater 10 will be as follows, providing the thermal conductivity ofheat insulator 5 is λ c, the thickness of the heat insulator is C, the diameter of theheat flow meter 15 is R1, the lower surface temperature of the heat flow meter is t3, and the surface temperature ofauxiliary heater 10 is t4:
- For the correction, calculate Qc by measuring t3 and t4, then correct the value of Qc in accordance with the heat flow quantity which is obtained by the
heat flow meter 15. - Furthermore, lower surface temperature T0 of specimen S is always maintained at a fixed temperature regardless of the upper surface temperature. For this purpose, the quantity of heat detecting gas led into
heat flow meter 15 should be adjustable. Thus the gas flow quantity can be controlled so as not to allow the temperature of heat detecting gas to increase excessively due to heat reception from specimen S. - The temperature rise should be limited within 5 to 10 degrees because minimum measurement errors arise within that range.
- In the above preferred embodiments, the coolant to circulate through the heat flow meter was a gas. However any fluid such as water or oil may be employed instead of the gas.
Claims (3)
- A method for measuring thermal conductivity of a material at a stationary state at an arbitrarily chosen calculation temperature which is hereinafter referred to as temperature T, the method comprising the steps of:(a) preparing a specimen of the material having first and second surfaces at least substantially parallel to each other, thickness defined by the first and the second surfaces being substantially constant, a sectional area substantially parallel to the first and the second surfaces of the specimen being substantially constant through the specimen;(b) measuring heat flows Q0 to Qn through the specimen at thermally stationary states wherein the temperature of the first surface of the specimen is To, which is far lower than the temperature T, and the temperature of the second surface of the specimen is raised incrementally from T0 to Tn, where Tn-1 and Tn are relatively close to the temperature T and Tn = T0 + NΔT(c) calculating the thermal conductivity λ according to the following first equation by using a first average thermal conductivity λn-1 at a first state, and a second average thermal conductivity λn at a second state:

- A method for measuring thermal conductivity of a material according to Claim 1 wherein the process of calculating the thermal conductivity includes the steps of:(a) estimating a function (Ψ) showing the relationship between the average thermal conductivity (λm), which is determined on the basis of the thickness and sectional area, temperatures of the first and second surfaces, and heat flows through the specimen, and the temperature of the second surface (Tm) by determining values of a, b, and c as specified in the second equation below by the least squares approximation method:
 (b) deriving the said first and second average thermal conductivities using the second equation.
 - A method for measuring thermal conductivity of a material according to Claim 1 wherein the step of measuring the heat flow is performed at:(a) a thermally stationary state wherein the temperature of the second surface T1 is slightly lower than the temperature T by ΔT, and(b) a thermally stationary state wherein the temperature of the second surface T2 is slightly higher than the temperature T by ΔT.(c) calculating the thermal conductivity λ according to the following equation by using a first average thermal conductivity λ1, at the first state, and a second average thermal conductivity λ2 at the second state:

Applications Claiming Priority (6)
| Application Number | Priority Date | Filing Date | Title |
|---|---|---|---|
| JP780288A JPH0750050B2 (en) | 1988-01-18 | 1988-01-18 | Thermal conductivity measurement method |
| JP780188A JPH0625741B2 (en) | 1988-01-18 | 1988-01-18 | Thermal conductivity measurement method |
| JP7802/88 | 1988-01-18 | ||
| JP7801/88 | 1988-01-18 | ||
| JP63236727A JP2638994B2 (en) | 1988-09-21 | 1988-09-21 | Thermal conductivity measurement method |
| JP236727/88 | 1988-09-21 |
Publications (3)
| Publication Number | Publication Date |
|---|---|
| EP0325441A2 EP0325441A2 (en) | 1989-07-26 |
| EP0325441A3 EP0325441A3 (en) | 1991-10-16 |
| EP0325441B1 true EP0325441B1 (en) | 1997-04-09 |
Family
ID=27277755
Family Applications (1)
| Application Number | Title | Priority Date | Filing Date |
|---|---|---|---|
| EP19890300473 Expired - Lifetime EP0325441B1 (en) | 1988-01-18 | 1989-01-18 | A method for measuring thermal conductivity |
Country Status (2)
| Country | Link |
|---|---|
| EP (1) | EP0325441B1 (en) |
| DE (1) | DE68927938T2 (en) |
Families Citing this family (6)
| Publication number | Priority date | Publication date | Assignee | Title |
|---|---|---|---|---|
| FR2683908B1 (en) * | 1991-11-14 | 1994-02-25 | Aerospatiale Ste Nationale Indle | METHOD FOR MEASURING THE THERMAL CONDUCTIVITY OF A MATERIAL. |
| FR2745636B1 (en) * | 1996-03-04 | 1998-05-29 | Aerospatiale | PROCESS FOR DETERMINING THE THERMAL CONDUCTIVITY OF A HIGH TEMPERATURE MATERIAL AND CONDUCTIMETER FOR CARRYING OUT THIS METHOD |
| FR2818739B1 (en) * | 2000-12-21 | 2003-03-28 | Cirad | SENSOR, SYSTEM AND METHOD FOR CHARACTERIZING A MEDIUM BY ACTIVE THERMAL MEASUREMENT, APPLICATION FOR TRACKING FRYING OILS |
| CN107121452B (en) * | 2017-05-26 | 2019-08-09 | 北京航天长征飞行器研究所 | Device and method for measuring high-temperature dynamic thermal conductivity of carbonized layer of resin-based heat-resistant material |
| RU2755330C1 (en) * | 2020-11-23 | 2021-09-15 | Федеральное государственное унитарное предприятие "Всероссийский научно-исследовательский институт метрологии им. Д.И. Менделеева" | Method for measuring thermal conductivity |
| CN112432971B (en) * | 2020-11-30 | 2025-03-28 | 洛阳兰迪玻璃机器股份有限公司 | Glass heat transfer tester and test method thereof |
Family Cites Families (2)
| Publication number | Priority date | Publication date | Assignee | Title |
|---|---|---|---|---|
| US3263485A (en) * | 1964-01-30 | 1966-08-02 | Minnesota Mining & Mfg | Apparatus for determining thermal conductivity |
| US4259859A (en) * | 1979-05-03 | 1981-04-07 | Yoshihiro Iida | Method for determination of thermal properties by arbitrary heating |
-
1989
- 1989-01-18 EP EP19890300473 patent/EP0325441B1/en not_active Expired - Lifetime
- 1989-01-18 DE DE1989627938 patent/DE68927938T2/en not_active Expired - Fee Related
Also Published As
| Publication number | Publication date |
|---|---|
| DE68927938T2 (en) | 1997-10-09 |
| EP0325441A3 (en) | 1991-10-16 |
| EP0325441A2 (en) | 1989-07-26 |
| DE68927938D1 (en) | 1997-05-15 |
Similar Documents
| Publication | Publication Date | Title |
|---|---|---|
| US5258929A (en) | Method for measuring thermal conductivity | |
| US4916715A (en) | Method and apparatus for measuring the distribution of heat flux and heat transfer coefficients on the surface of a cooled component used in a high temperature environment | |
| Fowler | A third generation water bath based blackbody source | |
| EP0325430B1 (en) | An apparatus for measuring thermal conductivity | |
| CN114791325A (en) | Heat flow calibration method for testing ground thermal strength cabin of aerospace plane | |
| EP0325441A2 (en) | A method for measuring thermal conductivity | |
| Nuttall | Thermal Conductivity of Nitrogen from 50 to 500 C and | |
| JP3953170B2 (en) | Specific heat measurement method and differential scanning calorimeter | |
| CN109918613A (en) | A kind of heat flux method based on step response calibration | |
| De Lucas et al. | Measurement and analysis of the temperature gradient of blackbody cavities, for use in radiation thermometry | |
| JPH07198500A (en) | Surface temperature measuring method | |
| JP2638994B2 (en) | Thermal conductivity measurement method | |
| Turzo-Andras et al. | High-temperature thermal conductivity measurement apparatus based on guarded hot plate method | |
| Bityukov et al. | Contactless measurement of the surface temperature of objects from their infrared radiation | |
| Schooley | NBS/NIST gas thermometry from 0 to 660° C | |
| JPH01184449A (en) | Superconducting rate measuring method | |
| JPH01184448A (en) | Thermal conductivity measurement method | |
| Ribeaudeau et al. | RF surface resistance measurements of superconducting samples with vacuum insulated thermometers | |
| Shtern et al. | A procedure and a hardware-software system for the automated calibration of temperature measuring instruments | |
| Hwang | The Constant Volume Heat Capacities of Gaseous Tetrafluoromethane, Chlorodifluoromethane, Dichlorotetrafluoro Ethane, and Chloropentafluoroethane | |
| JPH01184450A (en) | Superconducting rate measuring instrument | |
| Shulgat et al. | Study of the instability of the fixed-point cell temperature of working standards: determining the optimal time intervals between comparisons | |
| SU1578612A1 (en) | Method of determining thermal conductivity of materials | |
| Zhao et al. | A measurement method for zero-degree thermostat | |
| SU1030671A1 (en) | Differential microcalorimeter |
Legal Events
| Date | Code | Title | Description |
|---|---|---|---|
| PUAI | Public reference made under article 153(3) epc to a published international application that has entered the european phase |
Free format text: ORIGINAL CODE: 0009012 |
|
| AK | Designated contracting states |
Kind code of ref document: A2 Designated state(s): DE FR GB IT |
|
| PUAL | Search report despatched |
Free format text: ORIGINAL CODE: 0009013 |
|
| AK | Designated contracting states |
Kind code of ref document: A3 Designated state(s): DE FR GB IT |
|
| 17P | Request for examination filed |
Effective date: 19920107 |
|
| 17Q | First examination report despatched |
Effective date: 19930708 |
|
| GRAG | Despatch of communication of intention to grant |
Free format text: ORIGINAL CODE: EPIDOS AGRA |
|
| GRAH | Despatch of communication of intention to grant a patent |
Free format text: ORIGINAL CODE: EPIDOS IGRA |
|
| GRAH | Despatch of communication of intention to grant a patent |
Free format text: ORIGINAL CODE: EPIDOS IGRA |
|
| GRAA | (expected) grant |
Free format text: ORIGINAL CODE: 0009210 |
|
| AK | Designated contracting states |
Kind code of ref document: B1 Designated state(s): DE FR GB IT |
|
| ITF | It: translation for a ep patent filed | ||
| REF | Corresponds to: |
Ref document number: 68927938 Country of ref document: DE Date of ref document: 19970515 |
|
| ET | Fr: translation filed | ||
| PGFP | Annual fee paid to national office [announced via postgrant information from national office to epo] |
Ref country code: GB Payment date: 19980109 Year of fee payment: 10 Ref country code: FR Payment date: 19980109 Year of fee payment: 10 |
|
| PGFP | Annual fee paid to national office [announced via postgrant information from national office to epo] |
Ref country code: DE Payment date: 19980123 Year of fee payment: 10 |
|
| PLBE | No opposition filed within time limit |
Free format text: ORIGINAL CODE: 0009261 |
|
| STAA | Information on the status of an ep patent application or granted ep patent |
Free format text: STATUS: NO OPPOSITION FILED WITHIN TIME LIMIT |
|
| 26N | No opposition filed | ||
| PG25 | Lapsed in a contracting state [announced via postgrant information from national office to epo] |
Ref country code: GB Free format text: LAPSE BECAUSE OF NON-PAYMENT OF DUE FEES Effective date: 19990118 |
|
| GBPC | Gb: european patent ceased through non-payment of renewal fee |
Effective date: 19990118 |
|
| PG25 | Lapsed in a contracting state [announced via postgrant information from national office to epo] |
Ref country code: FR Free format text: LAPSE BECAUSE OF NON-PAYMENT OF DUE FEES Effective date: 19990930 |
|
| PG25 | Lapsed in a contracting state [announced via postgrant information from national office to epo] |
Ref country code: DE Free format text: LAPSE BECAUSE OF NON-PAYMENT OF DUE FEES Effective date: 19991103 |
|
| REG | Reference to a national code |
Ref country code: FR Ref legal event code: ST |
|
| PG25 | Lapsed in a contracting state [announced via postgrant information from national office to epo] |
Ref country code: IT Free format text: LAPSE BECAUSE OF NON-PAYMENT OF DUE FEES Effective date: 20050118 |