EP0242629A2 - Signalverarbeitungsmethode zur Bestimmung des Grundaufbaus von Nukleinsäuren - Google Patents
Signalverarbeitungsmethode zur Bestimmung des Grundaufbaus von Nukleinsäuren Download PDFInfo
- Publication number
- EP0242629A2 EP0242629A2 EP87104502A EP87104502A EP0242629A2 EP 0242629 A2 EP0242629 A2 EP 0242629A2 EP 87104502 A EP87104502 A EP 87104502A EP 87104502 A EP87104502 A EP 87104502A EP 0242629 A2 EP0242629 A2 EP 0242629A2
- Authority
- EP
- European Patent Office
- Prior art keywords
- autoradiograph
- peak
- signal processing
- specific dna
- dna fragments
- Prior art date
- Legal status (The legal status is an assumption and is not a legal conclusion. Google has not performed a legal analysis and makes no representation as to the accuracy of the status listed.)
- Granted
Links
Images

Classifications
-
- C—CHEMISTRY; METALLURGY
- C12—BIOCHEMISTRY; BEER; SPIRITS; WINE; VINEGAR; MICROBIOLOGY; ENZYMOLOGY; MUTATION OR GENETIC ENGINEERING
- C12Q—MEASURING OR TESTING PROCESSES INVOLVING ENZYMES, NUCLEIC ACIDS OR MICROORGANISMS; COMPOSITIONS OR TEST PAPERS THEREFOR; PROCESSES OF PREPARING SUCH COMPOSITIONS; CONDITION-RESPONSIVE CONTROL IN MICROBIOLOGICAL OR ENZYMOLOGICAL PROCESSES
- C12Q1/00—Measuring or testing processes involving enzymes, nucleic acids or microorganisms; Compositions therefor; Processes of preparing such compositions
- C12Q1/68—Measuring or testing processes involving enzymes, nucleic acids or microorganisms; Compositions therefor; Processes of preparing such compositions involving nucleic acids
- C12Q1/6869—Methods for sequencing
- C12Q1/6874—Methods for sequencing involving nucleic acid arrays, e.g. sequencing by hybridisation
-
- C—CHEMISTRY; METALLURGY
- C12—BIOCHEMISTRY; BEER; SPIRITS; WINE; VINEGAR; MICROBIOLOGY; ENZYMOLOGY; MUTATION OR GENETIC ENGINEERING
- C12Q—MEASURING OR TESTING PROCESSES INVOLVING ENZYMES, NUCLEIC ACIDS OR MICROORGANISMS; COMPOSITIONS OR TEST PAPERS THEREFOR; PROCESSES OF PREPARING SUCH COMPOSITIONS; CONDITION-RESPONSIVE CONTROL IN MICROBIOLOGICAL OR ENZYMOLOGICAL PROCESSES
- C12Q1/00—Measuring or testing processes involving enzymes, nucleic acids or microorganisms; Compositions therefor; Processes of preparing such compositions
- C12Q1/68—Measuring or testing processes involving enzymes, nucleic acids or microorganisms; Compositions therefor; Processes of preparing such compositions involving nucleic acids
- C12Q1/6869—Methods for sequencing
-
- G—PHYSICS
- G01—MEASURING; TESTING
- G01N—INVESTIGATING OR ANALYSING MATERIALS BY DETERMINING THEIR CHEMICAL OR PHYSICAL PROPERTIES
- G01N27/00—Investigating or analysing materials by the use of electric, electrochemical, or magnetic means
- G01N27/26—Investigating or analysing materials by the use of electric, electrochemical, or magnetic means by investigating electrochemical variables; by using electrolysis or electrophoresis
- G01N27/416—Systems
- G01N27/447—Systems using electrophoresis
- G01N27/44704—Details; Accessories
- G01N27/44717—Arrangements for investigating the separated zones, e.g. localising zones
-
- G—PHYSICS
- G01—MEASURING; TESTING
- G01T—MEASUREMENT OF NUCLEAR OR X-RADIATION
- G01T1/00—Measuring X-radiation, gamma radiation, corpuscular radiation, or cosmic radiation
- G01T1/29—Measurement performed on radiation beams, e.g. position or section of the beam; Measurement of spatial distribution of radiation
- G01T1/2914—Measurement of spatial distribution of radiation
- G01T1/2921—Static instruments for imaging the distribution of radioactivity in one or two dimensions; Radio-isotope cameras
- G01T1/2942—Static instruments for imaging the distribution of radioactivity in one or two dimensions; Radio-isotope cameras using autoradiographic methods
-
- Y—GENERAL TAGGING OF NEW TECHNOLOGICAL DEVELOPMENTS; GENERAL TAGGING OF CROSS-SECTIONAL TECHNOLOGIES SPANNING OVER SEVERAL SECTIONS OF THE IPC; TECHNICAL SUBJECTS COVERED BY FORMER USPC CROSS-REFERENCE ART COLLECTIONS [XRACs] AND DIGESTS
- Y10—TECHNICAL SUBJECTS COVERED BY FORMER USPC
- Y10S—TECHNICAL SUBJECTS COVERED BY FORMER USPC CROSS-REFERENCE ART COLLECTIONS [XRACs] AND DIGESTS
- Y10S250/00—Radiant energy
- Y10S250/909—Methods and apparatus ancillary to stimulable phosphor systems
-
- Y—GENERAL TAGGING OF NEW TECHNOLOGICAL DEVELOPMENTS; GENERAL TAGGING OF CROSS-SECTIONAL TECHNOLOGIES SPANNING OVER SEVERAL SECTIONS OF THE IPC; TECHNICAL SUBJECTS COVERED BY FORMER USPC CROSS-REFERENCE ART COLLECTIONS [XRACs] AND DIGESTS
- Y10—TECHNICAL SUBJECTS COVERED BY FORMER USPC
- Y10T—TECHNICAL SUBJECTS COVERED BY FORMER US CLASSIFICATION
- Y10T436/00—Chemistry: analytical and immunological testing
- Y10T436/14—Heterocyclic carbon compound [i.e., O, S, N, Se, Te, as only ring hetero atom]
- Y10T436/142222—Hetero-O [e.g., ascorbic acid, etc.]
- Y10T436/143333—Saccharide [e.g., DNA, etc.]
Definitions
- This invention relates to a signal processing method for determining base sequence of nucleic acids.
- Maxam-Gilbert method and Sanger-Coulson method are known as typical methods for determining the base sequence of nucleic acids such as DNA and RNA.
- a group containing a radioactive isotope such as 32 P is attached to a chain molecule of DNA or a DNA fragment at one end to label it with the radioactive element and then the bond between the constitutional units of the chain molecule is base-specifically cleaved by a chemical reaction.
- a mixture of the resulting base-specific DNA cleavage products is resolved (developed) through gel electrophoresis to obtain a resolved pattern (not visible) wherein each of the numerous cleavage products is resolved on the gel support medium.
- the resolved pattern is visualized on a radiographic film such as an X-ray film to obtain an autoradiograph thereof as a visible image.
- a radiographic film such as an X-ray film
- the bases in certain positional relationships with the end of the radioactive element-attached chain molecule can be sequentially determined according to the visualized autoradiograph and the applied base-specific cleavage means. In this way, the sequence for all bases of the DNA specimen can be determined.
- the stimulable phosphor sheet comprises a stimulable phosphor and has such properties that when exposed to a radiation, the stimulable phosphor absorbs a portion of radiation energy and then emits light (stimulated emission) corresponding to the radiation energy stored therein upon excitation with an electromagnetic wave (stimulating rays) such as visible light or infrared rays.
- an electromagnetic wave such as visible light or infrared rays.
- the base sequence of the nucleic acids has been conventionally determined by visually judging individual resolved positions of the base-specific cleavage products or the base-specific synthetic products of radioactively labeled nucleic acid (hereinafter referred as to simply base-specific fragments of nucleic acid) on the autoradiograph and comparing them among the resolved rows thereof. Namely, the analysis of the autoradiograph is done by observing the visualized autoradiograph with eyes, and such visual analysis requires great amounts of time and labor.
- the digital signals corresponding to the autoradiograph can be obtained either by visualizing the autoradiograph on a radiographic film and photoelectrically reading out the visible image on said film by means of reflected light or transmitted light when the conventional radiography is employed, or by directly reading out the stimulable phosphor sheet without the visualization of the autoradiograph when the radiation image recording and reproducing method is employed.
- the resolved pattern obtained by resolving (developing) radioactively labeled substances on a support medium by electrophoresis or the like is liable to cause various distortion and noise.
- bands When the production and the separation of the base-specific fragments are insufficient during the preparation of a sample, or when the base-specific fragments are mixed with each other during the introduction of the sample into slots, bands (ghost bands or extra bands) happen to appear at positions where any band inherent to the resolved row should not exist.
- bands including such ghost bands are compared with each other, and as a result, an error is caused in the determination of the base sequence to lower the accuracy of the information on the base sequence.
- the present inventor has accomplished that the base sequence of nucleic acids is automatically determined with easiness and high accuracy by suitably processing digital signals corresponding to the autoradiograph of the resolved pattern even when noise is caused on the autradiograph.
- the present invention provides in one aspect a signal processing method for determining base sequence of nucleic acids by subjecting digital signals to signal processing, said digital signals corresponding to an autoradiograph of plural resolved rows which are formed by resolving a mixture of base-specific DNA fragments or base-specific RNA fragments labeled with a radioactive element in one-dimensional direction on a support medium, which comprises steps of:
- the present invention provides in another aspect a signal processing method for determining base sequence of nucleic acids by subjecting digital signals to signal processing, said digital signals corresponding to an autoradiograph of a resolved pattern which is formed by resolving a mixture of base-specific DNA fragments or base-specific RNA fragments labeled with a radioactive element in one-dimensional direction on a support medium, which comprises steps of:
- the base sequence of nucleic acids can be simply determined with high accuracy by processing the digital signals corresponding to the autoradiograph of a resolved pattern which is formed by resolving a mixture of the base-specific fragments of a nucleic acid on a support medium, through an appropriate signal processing circuit having a feature capable of eliminating noise and detecting only intrinsic bands, even when the resolved pattern causes noise.
- the first method of the present invention resolves the following problem with respect to the extra bands.
- the image density (level of digital signal) of noise and extra band appearing on the autoradiograph, due to the mixing of a sample or the natural radiation, is generally lower than that of the intrinsic band.
- the amount of radioactive element is increased and the intensity of radioactivity becomes higher in proportion as the molecular weight of the base-specific fragments of the sample is increased.
- only intrinsic bands can be completely detected on the basis of a threshold value fluctuating from interval to interval, by calculating the mean value of signal levels for every interval and setting the threshold value which enables intrinsic band to be separated from noise for each interval based on the mean value.
- the base sequence of nucleic acids can be determined with high accuracy and easiness by comparing the detected bands among the resolved rows on the basis of the band positions.
- the second method of the present invention resolves the following problem with respect to the noise. It is liable to mistake noise for band in the determination of bands, when peaks are only detected on one-dimensional waveform (raster) composed of position along the resolving direction and signal level for the resolved row, and the accurate information on the base sequence of nucleic acids can not be obtained.
- the band has a width in a direction perpendicular to the resolving direction depending on the size of slot.
- the noise appearing on an autoradiograph due to the incomplete introduction of a radioactive element into a sample during the preparation of the sample or the incorporation of a natural radiation during the exposure is in the form of a spot or a band the width of which is narrower than that of an intrinsic band.
- only intrinsic bands can be detected by excluding noise in such a manner that there are prepared many rasters for each resolved row and determination is made on whether the detected peaks are ones for intrinsic bands or noise, based on decision on whether the peaks continuously exist on these rasters in a direction perpendicular to the resolving direction or not.
- the base sequence of nucleic acids can be simply determined with high accuracy by comparing the detected bands among the resolved rows on the basis of the band positions.
- samples employable in the present invention include mixtures of base-specific fragments of nucleic acids such as DNA and RNA labeled with a radioactive element.
- fragments mean portions of a long-chain molecule.
- a mixture of base-specific DNA cleavage products which is a kind of a mixture of base-specific DNA fragments, can be obtained by base-specifically cleaving the radioactively labeled DNA according to the aforementioned Maxam-Gilbert method.
- a mixture of base-specific DNA synthetic products can be obtained by synthesizing from radioactively labeled deoxynucleoside triphosphates and DNA polymerase by use of DNA as a template according to the aforementioned Sanger-Coulson method.
- RNA is composed of four kinds of bases: adenine, guanine, uracil and cytosine. These substances can be labeled with a radioactive element such as 32p , "C, 35 S, 3 H or 125
- a sample which is a mixture of the base-specific fragments of a nucleic acid labeled with a radioactive element, can be resolved (developed) on a known support medium such as a gel support medium by any of conventional resolving (developing) procedures such as electrophoresis, thin layer chromatography, column chromatography and paper chromatography.
- the support medium on which the radioactively labeled substances are resolved is autoradiographed by means of the conventional radiography using a radiosensitive material or the radiation image recording and repro ducing method using a stimulable phosphor sheet.
- the digital signals corresponding to the autoradiograph are then obtained through an appropriate read-out system.
- the support medium and a radiosensitive material such as an X-ray film are placed together in layers at a low temperature or at room temperature for a long period of time (several hours to several tens of hours) to expose the radiographic film.
- the radiographic film is then developed to visualize the autoradiograph of the radioactively labeled substances on the film, and the visualized autoradiograph is read out by using an image read-out system.
- the radiographic film is irradiated with an optical beam and the beam transmitted thereby or reflected therefrom is photoelectrically detected, whereby the visualized autoradiograph can be transformed to electric signals. Further, the electric signals are converted into digital signals corresponding to the autoradiograph through A/D conversion.
- the support medium and the stimulable phosphor sheet are placed together in layers at an ambient temperature for a short period of time (several seconds to several tens of minutes) to store radiation energy radiating from the radioactively labeled substances in the phosphor sheet, whereby the autoradiograph is recorded as a kind of a latent image (energy-stored image) on the phosphor sheet.
- the stimulable phosphor sheet for instance, has a basic structure where a support comprising a plastic film, a phosphor layer comprising a stimulable phosphor such as a divalent europium activated barium fluorobromide phosphor (BaFBr:Eu 2+ ) and a transparent protective film are laminated in this order.
- a support comprising a plastic film
- a phosphor layer comprising a stimulable phosphor such as a divalent europium activated barium fluorobromide phosphor (BaFBr:Eu 2+ ) and a transparent protective film are laminated in this order.
- the stimulable phosphor has characteristics of absorbing and storing radiation energy when irradiated with a radiation such as X-rays and subsequently releas ing the stored radiation energy as stimulated emission when excited with visible light to infrared rays.
- the autoradiograph stored and recorded on the stimulable phosphor sheet is read out by using a read-out system.
- the phosphor sheet is scanned with a laser beam to release the radiation energy stored in the stimulable phosphor as light emission and the emitted light is photoelectrically detected, so that the autoradiograph can be directly obtained as electric signals without the visualization thereof. Further, the electric signals are converted into digital signals corresponding to the autoradiograph through A/D conversion.
- the present invention is not limited thereto and digital signals obtained by any other methods can be applied to the signal processing method of the invention, provided that they correspond to the autoradiograph.
- Only the image region may be subjected to the read-out operation.
- the present invention there may be previously inputted information on the location of each resolved row and the width of band to preset read-out conditions and then conducted scanning at a scanning line density such that each band is traversed by at least one or at least two of the scanning lines in the read-out operation, so as to shorten read-out time and obtain efficiently necessary information.
- the digital signals corresponding to the autoradiograph in the invention also include the thus-obtained digital signals.
- the obtained digital signals D x y comprise a coordinate (x,y) which is represented by a coordinate system fixed to the radiographic film or the stimulable phosphor sheet and a signal level (z) at the coordinate.
- the signal level represents the density of image at the coordinate, that is, the amount of the radioactively labeled substances. Accordingly, a series of the digital signals (namely, digital image data) have information on two-dimensional location of the labeled substances.
- the digital signals corresponding to the autoradiograph of the radioactively labeled substances resolved on a support medium is subjected to signal processing to determine the base sequence of nucleic acid according to the invention described in more detail below.
- Each group of the base-specific DNA synthetic products is composed of DNA products which are synthesized according to the Sanger-Coulson method and have various lengths and the same base at terminals.
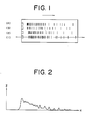
- Fig. 1 shows an autoradiograph of the electrophoretic pattern obtained by electrophoresing the above four groups of the base-specific DNA synthetic products in four slots, respectively. On the autoradiograph, there is caused a density gradient along the resolving direc tion (in the direction of an arrow).
- the digital signals corresponding to the autoradiograph are stored temporarily in a memory device of the signal processing circuit (that is, stored in a nonvolatile memory unit such as a buffer memory, a magnetic disk, etc.).
- Fig. 2 shows a one-dimensional waveform for the first lane prepared by extracting digital signals in the direction of the arrow shown in Fig. 1.
- Fig. 2 corresponds to the sectional view of image density for the first lane.
- Fig. 3 is a partial enlarged view of Fig. 2.
- the left part is a zone near to the electrophoresis-starting position, and the peak A (at which the signal level is maximum) is lower than peaks on both sides thereof so that the peak A is clearly an extra band or noise.
- the right part is'a zone (where the migration distance is long) far away from the electrophoresis-starting position, and the peak B is recognized as an intrinsic band in comparison with other peaks.
- the peak A is compared with the peak B
- the signal level of the peak A is higher than that of the peak B. It will be understood that determination on whether a peak is an intrinsic band or not should not be made simply from the signal level (absolute value) of each peak. It is necessary that relative comparison must be made by taking signal levels around the peak to be detected into consideration.
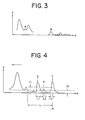
- Fig. 4 is a partial enlarged view of the one-dimensional waveform of Fig. 2, and shows an embodiment illustrating the essential of the present invention relating to the determination of threshold value and the detection of band on the basis of the threshold value.
- the search-fiducial point x is the position of the peak C which is an already determined intrinsic band, in Fig. 4.
- the first search-fiducial point is preferably the lowermost end of electrophoresis at the longest migration distance (the right end of Fig. 2), where the space between bands is large and the search is preferably made from the lower end of electrophoresis toward the upper end in order.
- the interval L may be previously set to a constant on the basis of the probable migration distance (i.e., the practical length of the support medium), or may be set as an appropriate function of migration distance (or of position along the electrophoretic direction) so as to allow it to vary depending on the search position. In the latter case, the number of peaks to be detected within one interval is made approximately constant, irrespective of the search position.
- the interval L may be started from the fiducial point X ; in the search direction [in the direction of an arrow (-)] as shown in Fig. 4, or the interval L may be taken by 1/2 L on each of both sides of the fiducial point.
- the mean level value Z i can be obtained by calculating the mean value of signal levels in the domains where signal levels are not less than a given value Z a , that is, in the domains L,, L z and L3. Namely, the mean value of signal levels of not less than Z a is obtained. Hence, relatively small extra bands and noise (background noise) appearing on the whole of the electrophoretic pattern can be removed.
- a threshold value T is deter mined on the basis of the mean level value Z j .
- coefficient a is a positive number excluding zero.
- the threshold value T is set to a proper value which enables extra bands and intrinsic bands to be separated from each other.
- the coefficient a is set to a constant larger than 1, extra bands can be excluded even when the peak of the extra band is relatively large, or even when many extra bands exist.
- the function f(Z ⁇ ) or the coefficient a may be an appropriate function of migration distance so as to allow it to vary depending on the search position.
- the interval L from the search-fiducial point x i is searched for peak(s) at which signal level is not less than the threshold value T ; .
- a peak is a point having the maximum signal level on the one-dimensional waveform. Only the domains L, to L3 where signal levels are not less than the value Z a may be searched for peak instead of making the search over the whole interval L, to shorten the search time.
- peak(s) at which signal level is not less than the threshold value T is determined to be intrinsic band(s), and peak(s) at which signal level is below T i is decided to be extra band-(s) or noise and is ignored.
- Fig. 4 there are two peaks D and E in the domains L, to L 3 . Only the peak E at which signal level exceeds T i is determined to be an intrinsic band, and the peak D is excluded as an extra band.
- the position of the peak E (intrinsic band) of the level above the threshold value T i is allowed to be the next search-fiducial point x i+1 .
- the above-described procedures are repeated in the next interval L from the fiducial point x i+1 .
- the peak nearest to the fiducial point in the search direction may be chosen as the next fiducial point, to determine intrinsic bands with much higher accuracy by taking a little change in circumferential signal levels into consideration while slightly shifting the interval.
- the farthest peak from the fiducial point in the search direction may be chosen, to reduce the number of times of the band-search procedure and to short the processing time by decreasing the overlap of the intervals.
- the distance dL may be previously set to a constant value such as a length corresponding to one pixel, or may be set as a function of migration distance and determined on the basis of the fiducial point.
- Each group of the base-specific DNA fragments is composed of base-specific cleavage products or synthetic products which have various lengths and the same base at terminals.
- Fig. 5 shows an autoradiograph of the electrophoretic pattern obtained by electrophoresing the above four groups of the base-specific DNA fragments in four slots, respectively.
- the electrophoretic direction is in the x-direction.
- At least two one-dimensional waveforms composed of position along the electrophoretic direction and signal level for each electrophoretic row (lane) are prepared on the basis of the digital image data corresponding to the autoradiograph.
- the raster composed of position (x) and signal level (z) can be directly prepared for every scanning line.
- the number of rasters per lane varies depending on the shape (width) of the slot, the amount of the sample and the number of pixels, and is generally 5 to 40 from the viewpoint of the accuracy of band detection. For instance, when the width of the slot is 5 mm, the space between pixels is 0.2 mm and the space between rasters (prepared by pixel unit) is also 0.2 mm, the number of rasters per lane is 25.
- Fig. 6 partially shows many rasters prepared for the first lane.
- the raster represents a sectional view of image density obtained by cutting the first lane off at every position in the x-direction.
- peaks on all the rasters are detected.
- the peak is detected, for instance, by finding out a position at which a sign of difference in signal level is inverted.
- each arrow (-) indicates a peak.
- a peak on an arbitrary raster is chosen and search for a peak is made in a given domain centering a position corresponding to the chosen peak position on a raster adjoining the chosen raster.
- the search of peak is repeatedly made on the adjoining rasters included in the same lane in order, so long as a peak is found.
- the domain of the peak search it is decided that a band exists only at the positions of peaks which are found on plural rasters without being so deviated from one another in the electrophoretic direction. The accuracy of the band detection can be improved.
- the peak search may be made on every one adjoining raster, or simultaneously on two or more rasters. For instance, the search can be made simultaneously on two to five rasters. The simultaneous search on plural rasters is preferred, when there is an interruption in peak appearance.
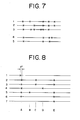
- Fig. 7 is a diagram showing the existence of peaks on each raster, wherein the sign X represents a peak position.
- a criterion for the decision on the continuity of the peaks varies depending upon the width of the band (i.e., the width of the slot), the shape of the pattern and the space between the rasters. It is generally determined that a band exists at a series of the peak positions, in the case that the peaks are continuously found on N rasters or more, wherein N is an integer in a range of 13 ⁇ N 5 37 when the width of the slot is 5 mm and the raster space is 0.2 mm (the number of rasters per lane being 25), by taking the stretching of band in the width direction in electrophoresis into consideration.
- the determination of the band existence is also made in the case that the interruption in peak appearance (the existence of raster on which no peak is found) for a series of rasters peak-searched is within a given limit.
- the interruption in peak appearance occurs at L positions or less and the number of rasters on which no peak is found at each interrupted position, is K or less
- the determination of the band existence is made at a series of the peak positions.
- K and L are set depending on the raster space and for instance, are integers in ranges of 1 ⁇ K S 3 and 1 5 L S 3 when the raster space is 0.2 mm.
- Fig. 8 is another diagram showing the existence of peaks on plural rasters, wherein the sign X represents a peak position.
- All the peaks on said raster and other rasters of the first lane are subjected to the above-described procedures to detect all bands on the first lane. Further, all peaks on the rasters of the other three lanes are subjected thereto to detect all bands on the electrophoretic pattern. In this way, the bands can be detected with high accuracy, even when the electrophoretic pattern causes noise.
- various distortions such as offset distortion and combining of some bands, or noise, signal processing for correction thereof may be made before or after the determination of the band positions.
- the smiling phenomenon is a phenomenon in which migration distances of the radioactively labeled substances at the both sides of the support medium are shorter than that in the vicinity of the center thereof.
- the smiling phenomenon is caused by heat dissipation effect (so-called edge effect), etc. during the electrophoresis.
- the offset distortion is a phenomenon in which positions of the lanes are wholly deviated from one another and is caused by difference between the slots in the electrophoresis-starting position or time of samples, which is due to the unevenness of the shapes of slots, etc.
- the combining of bands is a phenomenon in which two or three bands are combined together to form one broad band and is caused by the insufficient electrophoresis. Usually, the combined bands tend to be appeared in the upper region of the pattern near to the electrophoresis-starting position.
- All the bands are sequenced immediately by comparing the determined band positions with one another.
- the sequence can be easily determined by utilizing the fact that there do not exist two or more bands at the corresponding positions on different lanes, since the combination of the above four groups of the base-specific DNA fragments is exclusive.
- the slots (1) to (4) have information on the terminal bases of (G), (A), (T) and (C), respectively, the base sequence of DNA is obtained by substituting the bands with bases corresponding to the slots which the individual bands belong to. For instance, the following base sequence of DNA can be obtained.
- the base sequence of one chain molecule of DNA can be determined.
- the representation mode of the information on the base sequence of DNA is by no means limited to the above-mentioned mode, and other representation modes may be utilized.
- the intensity (z') of each band can be represented as the relative amount of the radioactively labeled substances, if desired.
- the base sequence of both two chain molecules of DNA can be also represented.
- Information on the base sequence of DNA can be also displayed as an image on the basis of the above processed digital signals.
- the original autoradiograph can be displayed as a visible image. In this case, investigators themselves can finally determine the DNA sequence on the basis of the display image.
- the signal processing method of the present invention is by no means limited to said combination, and other combinations can be used.
- a combination of (G, G+A, T + C, C) may be used.
- the method of the invention can be also applied to the mixtures (for instance, a combination of G, A, U, C) of base-specific RNA fragments.
- the detection of bands is not limited to resolved rows of one combination of base-specific fragments of a nucleic acid, but can be made for the whole resolved rows simultaneously resolved on a support medium.
- the information on the base sequence of DNA determined through the above-described signal processing is output from the signal processing circuit and subsequently transmitted to a recording device directly or optionally via storage in a storing means such as a magnetic disk or a magnetic tape.
- Various recording devices based on various systems can be employed for the above-described purpose, for instance, a device for visualizing optically by scanning a photosensitive material with laser beam, etc., a display means for visualizing electrically on CRT, etc., a means for printing a radiation image displayed on CRT by means of a video printer, and a means for visualizing on a heatsensitive recording material using thermic rays.
Landscapes
- Life Sciences & Earth Sciences (AREA)
- Chemical & Material Sciences (AREA)
- Health & Medical Sciences (AREA)
- Proteomics, Peptides & Aminoacids (AREA)
- Organic Chemistry (AREA)
- Molecular Biology (AREA)
- Zoology (AREA)
- Physics & Mathematics (AREA)
- Engineering & Computer Science (AREA)
- Wood Science & Technology (AREA)
- General Health & Medical Sciences (AREA)
- Immunology (AREA)
- Biochemistry (AREA)
- Analytical Chemistry (AREA)
- General Engineering & Computer Science (AREA)
- Biophysics (AREA)
- Bioinformatics & Cheminformatics (AREA)
- Microbiology (AREA)
- Biotechnology (AREA)
- Genetics & Genomics (AREA)
- General Physics & Mathematics (AREA)
- Electrochemistry (AREA)
- Chemical Kinetics & Catalysis (AREA)
- Pathology (AREA)
- High Energy & Nuclear Physics (AREA)
- Spectroscopy & Molecular Physics (AREA)
- Investigating Or Analysing Biological Materials (AREA)
- Measurement Of Radiation (AREA)
Priority Applications (1)
| Application Number | Priority Date | Filing Date | Title |
|---|---|---|---|
| EP91118244A EP0476712B1 (de) | 1986-03-26 | 1987-03-26 | Signalverarbeitungsmethode zur Bestimmung des Grundaufbaus von Nukleinsäuren |
Applications Claiming Priority (4)
| Application Number | Priority Date | Filing Date | Title |
|---|---|---|---|
| JP69074/86 | 1986-03-26 | ||
| JP6907486A JPS62225956A (ja) | 1986-03-26 | 1986-03-26 | 核酸の塩基配列決定のための信号処理方法 |
| JP25010/86 | 1987-02-04 | ||
| JP62025010A JPH0664058B2 (ja) | 1987-02-04 | 1987-02-04 | 核酸の塩基配列決定のための信号処理方法 |
Related Child Applications (1)
| Application Number | Title | Priority Date | Filing Date |
|---|---|---|---|
| EP91118244.2 Division-Into | 1991-10-25 |
Publications (3)
| Publication Number | Publication Date |
|---|---|
| EP0242629A2 true EP0242629A2 (de) | 1987-10-28 |
| EP0242629A3 EP0242629A3 (en) | 1989-07-26 |
| EP0242629B1 EP0242629B1 (de) | 1992-08-26 |
Family
ID=26362613
Family Applications (2)
| Application Number | Title | Priority Date | Filing Date |
|---|---|---|---|
| EP91118244A Expired - Lifetime EP0476712B1 (de) | 1986-03-26 | 1987-03-26 | Signalverarbeitungsmethode zur Bestimmung des Grundaufbaus von Nukleinsäuren |
| EP87104502A Expired - Lifetime EP0242629B1 (de) | 1986-03-26 | 1987-03-26 | Signalverarbeitungsmethode zur Bestimmung des Grundaufbaus von Nukleinsäuren |
Family Applications Before (1)
| Application Number | Title | Priority Date | Filing Date |
|---|---|---|---|
| EP91118244A Expired - Lifetime EP0476712B1 (de) | 1986-03-26 | 1987-03-26 | Signalverarbeitungsmethode zur Bestimmung des Grundaufbaus von Nukleinsäuren |
Country Status (3)
| Country | Link |
|---|---|
| US (1) | US4885696A (de) |
| EP (2) | EP0476712B1 (de) |
| DE (2) | DE3751366T2 (de) |
Cited By (4)
| Publication number | Priority date | Publication date | Assignee | Title |
|---|---|---|---|---|
| EP0463591A1 (de) * | 1990-06-29 | 1992-01-02 | E.I. Du Pont De Nemours And Company | Verfahren um DNA-Sequenzen festzustellen |
| EP0483460A1 (de) * | 1990-10-30 | 1992-05-06 | Shimadzu Corporation | Vorrichtung zur Bestimmung der Basensequenz |
| EP0497468A3 (en) * | 1991-02-01 | 1993-08-11 | Beckman Instruments, Inc. | Method of improving signal-to-noise in electropherogram |
| WO1996020286A1 (en) * | 1994-12-23 | 1996-07-04 | Imperial College Of Science, Technology And Medicine | Automated dna sequencing |
Families Citing this family (18)
| Publication number | Priority date | Publication date | Assignee | Title |
|---|---|---|---|---|
| US5202231A (en) | 1987-04-01 | 1993-04-13 | Drmanac Radoje T | Method of sequencing of genomes by hybridization of oligonucleotide probes |
| US5525464A (en) * | 1987-04-01 | 1996-06-11 | Hyseq, Inc. | Method of sequencing by hybridization of oligonucleotide probes |
| US5547839A (en) | 1989-06-07 | 1996-08-20 | Affymax Technologies N.V. | Sequencing of surface immobilized polymers utilizing microflourescence detection |
| US5371671A (en) * | 1990-03-13 | 1994-12-06 | The Regents Of The University Of California | DNA sequence autoradiogram digitizer and methodology implemented in the same |
| US5365455A (en) * | 1991-09-20 | 1994-11-15 | Vanderbilt University | Method and apparatus for automatic nucleic acid sequence determination |
| US5338687A (en) * | 1992-09-11 | 1994-08-16 | Lee Lawrence L | Detection of biological macromolecules by NMR-sensitive labels |
| US5273632A (en) * | 1992-11-19 | 1993-12-28 | University Of Utah Research Foundation | Methods and apparatus for analysis of chromatographic migration patterns |
| US5538613A (en) * | 1993-10-26 | 1996-07-23 | Genesys Technologies, Inc. | Electrophoresis analyzer |
| US5795716A (en) | 1994-10-21 | 1998-08-18 | Chee; Mark S. | Computer-aided visualization and analysis system for sequence evaluation |
| US5916747A (en) * | 1995-06-30 | 1999-06-29 | Visible Genetics Inc. | Method and apparatus for alignment of signals for use in DNA based-calling |
| US20040175718A1 (en) * | 1995-10-16 | 2004-09-09 | Affymetrix, Inc. | Computer-aided visualization and analysis system for sequence evaluation |
| US5748491A (en) * | 1995-12-20 | 1998-05-05 | The Perkin-Elmer Corporation | Deconvolution method for the analysis of data resulting from analytical separation processes |
| EP0944739A4 (de) | 1996-09-16 | 2000-01-05 | Univ Utah Res Found | Verfahren und apparat zur analyse von chromatografischen auftrennungsmustern |
| EP1088103A2 (de) | 1998-06-26 | 2001-04-04 | Visible Genetics Inc. | Verfahren zur sequenzierung von nukleinsäuren mit reduzierter fehlerrate |
| US6760668B1 (en) | 2000-03-24 | 2004-07-06 | Bayer Healthcare Llc | Method for alignment of DNA sequences with enhanced accuracy and read length |
| US7222059B2 (en) | 2001-11-15 | 2007-05-22 | Siemens Medical Solutions Diagnostics | Electrophoretic trace simulator |
| DE10225841A1 (de) * | 2002-06-03 | 2003-12-11 | Proteosys Ag | Differentielle Anzeige von markierten Molekülen |
| US20100291599A1 (en) * | 2009-05-18 | 2010-11-18 | Bruker Optics, Inc. | Large area scanning apparatus for analyte quantification by surface enhanced raman spectroscopy and method of use |
Family Cites Families (9)
| Publication number | Priority date | Publication date | Assignee | Title |
|---|---|---|---|---|
| EP0113672A3 (de) * | 1983-01-08 | 1988-03-02 | Fuji Photo Film Co., Ltd. | Signalbearbeitungsmethode in der Autoradiographie |
| JPS59155800A (ja) * | 1983-02-24 | 1984-09-04 | 富士写真フイルム株式会社 | 蓄積性蛍光体シ−ト |
| JPS59181335A (ja) * | 1983-03-31 | 1984-10-15 | Fuji Photo Film Co Ltd | オ−トラジオグラフイ−における信号検出方法 |
| JPS6010174A (ja) * | 1983-06-29 | 1985-01-19 | Fuji Photo Film Co Ltd | オ−トラジオグラフイ−による遺伝子のスクリ−ニング方法 |
| DE3573667D1 (en) * | 1984-04-27 | 1989-11-16 | Hitachi Software Eng | Input apparatus for entering base sequence information of the gene |
| DE3579186D1 (de) * | 1984-05-02 | 1990-09-20 | Fuji Photo Film Co Ltd | Autoradiographisches verfahren. |
| JPH0617983B2 (ja) * | 1984-09-13 | 1994-03-09 | 富士写真フイルム株式会社 | 放射線画像情報読取方法および装置 |
| US4720786A (en) * | 1985-04-19 | 1988-01-19 | Fuji Photo Film Co., Ltd. | Method of compensating for offset distortion in rows of electrophoretic patterns |
| JPS62161265A (ja) * | 1985-12-27 | 1987-07-17 | Fuji Photo Film Co Ltd | 放射線画像情報読取装置 |
-
1987
- 1987-03-25 US US07/030,062 patent/US4885696A/en not_active Expired - Lifetime
- 1987-03-26 EP EP91118244A patent/EP0476712B1/de not_active Expired - Lifetime
- 1987-03-26 EP EP87104502A patent/EP0242629B1/de not_active Expired - Lifetime
- 1987-03-26 DE DE3751366T patent/DE3751366T2/de not_active Expired - Fee Related
- 1987-03-26 DE DE8787104502T patent/DE3781307T2/de not_active Expired - Fee Related
Cited By (5)
| Publication number | Priority date | Publication date | Assignee | Title |
|---|---|---|---|---|
| EP0463591A1 (de) * | 1990-06-29 | 1992-01-02 | E.I. Du Pont De Nemours And Company | Verfahren um DNA-Sequenzen festzustellen |
| EP0483460A1 (de) * | 1990-10-30 | 1992-05-06 | Shimadzu Corporation | Vorrichtung zur Bestimmung der Basensequenz |
| EP0497468A3 (en) * | 1991-02-01 | 1993-08-11 | Beckman Instruments, Inc. | Method of improving signal-to-noise in electropherogram |
| WO1996020286A1 (en) * | 1994-12-23 | 1996-07-04 | Imperial College Of Science, Technology And Medicine | Automated dna sequencing |
| US6090550A (en) * | 1994-12-23 | 2000-07-18 | Imperial College Of Science, Technology And Medicine | Automated DNA sequencing comparing predicted and actual measurements |
Also Published As
| Publication number | Publication date |
|---|---|
| US4885696A (en) | 1989-12-05 |
| DE3781307T2 (de) | 1993-01-21 |
| EP0476712A1 (de) | 1992-03-25 |
| EP0242629A3 (en) | 1989-07-26 |
| DE3781307D1 (de) | 1992-10-01 |
| EP0476712B1 (de) | 1995-06-21 |
| DE3751366T2 (de) | 1995-11-02 |
| EP0242629B1 (de) | 1992-08-26 |
| DE3751366D1 (de) | 1995-07-27 |
Similar Documents
| Publication | Publication Date | Title |
|---|---|---|
| US4885696A (en) | Signal processing method for determining base sequence of nucleic acid | |
| US4802101A (en) | Signal processing method for determining base sequence of nucleic acid | |
| US4720786A (en) | Method of compensating for offset distortion in rows of electrophoretic patterns | |
| US4941092A (en) | Signal processing method for determining base sequence of nucleic acid | |
| US4894786A (en) | Signal processing method for analyzing autoradiograph | |
| US4958281A (en) | Signal processing method for determining base sequence of nucleic acid | |
| US4972325A (en) | Signal processing method for determining base sequence of nucleic acid | |
| EP0198403A2 (de) | Signalverarbeitungsverfahren um die Reihenfolge der Basen von Nukleinsäure festzustellen | |
| EP0220590B1 (de) | Signalverarbeitungsmethode zur Bestimmung des Grundaufbaus von Nukleinsäuren | |
| US4939667A (en) | Signal processing method for analyzing autoradiograph | |
| US4837687A (en) | Method for analyzing an autoradiograph | |
| EP0252182B1 (de) | Verfahren zum Zeigen einer Autoradiographie | |
| JPS62225956A (ja) | 核酸の塩基配列決定のための信号処理方法 | |
| JPH0664058B2 (ja) | 核酸の塩基配列決定のための信号処理方法 | |
| JPH0467630B2 (de) | ||
| JPH0529072B2 (de) | ||
| JPH0462340B2 (de) | ||
| JPH0462342B2 (de) | ||
| JPH0570791B2 (de) | ||
| JPS61269065A (ja) | 核酸の塩基配列決定のための信号処理方法 | |
| JPH0529067B2 (de) | ||
| JPH0529069B2 (de) | ||
| JPH0467629B2 (de) | ||
| JPH0462341B2 (de) | ||
| JPH0533747B2 (de) |
Legal Events
| Date | Code | Title | Description |
|---|---|---|---|
| PUAI | Public reference made under article 153(3) epc to a published international application that has entered the european phase |
Free format text: ORIGINAL CODE: 0009012 |
|
| AK | Designated contracting states |
Kind code of ref document: A2 Designated state(s): DE FR NL |
|
| PUAL | Search report despatched |
Free format text: ORIGINAL CODE: 0009013 |
|
| RHK1 | Main classification (correction) |
Ipc: G01T 1/29 |
|
| AK | Designated contracting states |
Kind code of ref document: A3 Designated state(s): DE FR NL |
|
| 17P | Request for examination filed |
Effective date: 19891004 |
|
| 17Q | First examination report despatched |
Effective date: 19901030 |
|
| GRAA | (expected) grant |
Free format text: ORIGINAL CODE: 0009210 |
|
| AK | Designated contracting states |
Kind code of ref document: B1 Designated state(s): DE FR NL |
|
| XX | Miscellaneous (additional remarks) |
Free format text: TEILANMELDUNG 91118244.2 EINGEREICHT AM 26/03/87. |
|
| REF | Corresponds to: |
Ref document number: 3781307 Country of ref document: DE Date of ref document: 19921001 |
|
| ET | Fr: translation filed | ||
| PLBE | No opposition filed within time limit |
Free format text: ORIGINAL CODE: 0009261 |
|
| STAA | Information on the status of an ep patent application or granted ep patent |
Free format text: STATUS: NO OPPOSITION FILED WITHIN TIME LIMIT |
|
| 26N | No opposition filed | ||
| PGFP | Annual fee paid to national office [announced via postgrant information from national office to epo] |
Ref country code: NL Payment date: 20020329 Year of fee payment: 16 |
|
| PGFP | Annual fee paid to national office [announced via postgrant information from national office to epo] |
Ref country code: DE Payment date: 20020429 Year of fee payment: 16 |
|
| PGFP | Annual fee paid to national office [announced via postgrant information from national office to epo] |
Ref country code: FR Payment date: 20030117 Year of fee payment: 17 |
|
| PG25 | Lapsed in a contracting state [announced via postgrant information from national office to epo] |
Ref country code: NL Free format text: LAPSE BECAUSE OF NON-PAYMENT OF DUE FEES Effective date: 20031001 Ref country code: DE Free format text: LAPSE BECAUSE OF NON-PAYMENT OF DUE FEES Effective date: 20031001 |
|
| NLV4 | Nl: lapsed or anulled due to non-payment of the annual fee |
Effective date: 20031001 |
|
| PG25 | Lapsed in a contracting state [announced via postgrant information from national office to epo] |
Ref country code: FR Free format text: LAPSE BECAUSE OF NON-PAYMENT OF DUE FEES Effective date: 20041130 |
|
| REG | Reference to a national code |
Ref country code: FR Ref legal event code: ST |