EP0091768B1 - Measuring characteristics of living tissues by ultrasonic waves - Google Patents
Measuring characteristics of living tissues by ultrasonic waves Download PDFInfo
- Publication number
- EP0091768B1 EP0091768B1 EP83301893A EP83301893A EP0091768B1 EP 0091768 B1 EP0091768 B1 EP 0091768B1 EP 83301893 A EP83301893 A EP 83301893A EP 83301893 A EP83301893 A EP 83301893A EP 0091768 B1 EP0091768 B1 EP 0091768B1
- Authority
- EP
- European Patent Office
- Prior art keywords
- frequencies
- tissue
- logarithms
- obtaining
- energies
- Prior art date
- Legal status (The legal status is an assumption and is not a legal conclusion. Google has not performed a legal analysis and makes no representation as to the accuracy of the status listed.)
- Expired
Links
Images

Classifications
-
- A—HUMAN NECESSITIES
- A61—MEDICAL OR VETERINARY SCIENCE; HYGIENE
- A61B—DIAGNOSIS; SURGERY; IDENTIFICATION
- A61B8/00—Diagnosis using ultrasonic, sonic or infrasonic waves
- A61B8/08—Detecting organic movements or changes, e.g. tumours, cysts, swellings
-
- G—PHYSICS
- G01—MEASURING; TESTING
- G01S—RADIO DIRECTION-FINDING; RADIO NAVIGATION; DETERMINING DISTANCE OR VELOCITY BY USE OF RADIO WAVES; LOCATING OR PRESENCE-DETECTING BY USE OF THE REFLECTION OR RERADIATION OF RADIO WAVES; ANALOGOUS ARRANGEMENTS USING OTHER WAVES
- G01S15/00—Systems using the reflection or reradiation of acoustic waves, e.g. sonar systems
- G01S15/88—Sonar systems specially adapted for specific applications
- G01S15/89—Sonar systems specially adapted for specific applications for mapping or imaging
- G01S15/8906—Short-range imaging systems; Acoustic microscope systems using pulse-echo techniques
- G01S15/895—Short-range imaging systems; Acoustic microscope systems using pulse-echo techniques characterised by the transmitted frequency spectrum
-
- G—PHYSICS
- G01—MEASURING; TESTING
- G01S—RADIO DIRECTION-FINDING; RADIO NAVIGATION; DETERMINING DISTANCE OR VELOCITY BY USE OF RADIO WAVES; LOCATING OR PRESENCE-DETECTING BY USE OF THE REFLECTION OR RERADIATION OF RADIO WAVES; ANALOGOUS ARRANGEMENTS USING OTHER WAVES
- G01S7/00—Details of systems according to groups G01S13/00, G01S15/00, G01S17/00
- G01S7/52—Details of systems according to groups G01S13/00, G01S15/00, G01S17/00 of systems according to group G01S15/00
- G01S7/52017—Details of systems according to groups G01S13/00, G01S15/00, G01S17/00 of systems according to group G01S15/00 particularly adapted to short-range imaging
- G01S7/52023—Details of receivers
- G01S7/52036—Details of receivers using analysis of echo signal for target characterisation
-
- G—PHYSICS
- G01—MEASURING; TESTING
- G01N—INVESTIGATING OR ANALYSING MATERIALS BY DETERMINING THEIR CHEMICAL OR PHYSICAL PROPERTIES
- G01N2291/00—Indexing codes associated with group G01N29/00
- G01N2291/02—Indexing codes associated with the analysed material
- G01N2291/024—Mixtures
- G01N2291/02475—Tissue characterisation
-
- G—PHYSICS
- G01—MEASURING; TESTING
- G01N—INVESTIGATING OR ANALYSING MATERIALS BY DETERMINING THEIR CHEMICAL OR PHYSICAL PROPERTIES
- G01N2291/00—Indexing codes associated with group G01N29/00
- G01N2291/02—Indexing codes associated with the analysed material
- G01N2291/028—Material parameters
- G01N2291/02872—Pressure
Definitions
- the present invention relates to the measuring of characteristic parameters of living tissues by transmitting ultrasonic waves into a living body and analyzing reflected waves therefrom.
- the tissue has such a microstructure that cells, capillary vessels, lymphatic vessels, muscular fibers and so forth intertwine complicatedly.
- a typical size of such a tissue is nearly equal to or smaller than the wavelength of ultrasonic waves.
- reflected waves from the microstructure are accompanied by complex interference owing to phase dispersion and pulse overlapping, introducing in a B-mode tomogram a speckled pattern commonly referred to as "speckle".
- the system * 1 conducts a second order differentiation by natural logarithms of their frequencies and a first order differentiation in the direction of depth, by which "a second order differentiated value of the attenuation coefficient of the ultrasonic waves by the natural logarithms of their frequencies" is obtained as a tissue characteristic parameter.
- energy (or power) values of the ultrasonic waves are obtained through utilization of three frequencies f" f 2 and f 3 and, as a difference value, "the second order differentiated value of the attenuation coefficient of the ultrasonic waves by the natural logarithms of their frequencies” is obtained in the form of a parameter.
- the attenuation coefficient is proportional to the first power of the frequency, the abovesaid parameter is in agreement with an attenuation constant.
- the abovesaid Hayakawa system requires complex processing corresponding to the second order differentiation by the natural logarithms of the frequencies, and hence is difficult of real-time processing and poor in SN ratio; further, tissue information on the reflection (backward scattering) is entirely lost. Moreover, the parameters thus obtained are insignificant from the physical viewpoint.
- the present invention pertains to the measuring of the frequency dependency of the reflection coefficient and that of the attenuation coefficient of the living tissue separately of each other.
- the present invention as defined in Claims 1 and 6, respectively, provides a method and apparatus which can enable separate measurement of tissue characteristic information on the attenuation and reflection coefficients of a living tissue to thereby permit non-invasive measurement of accurate internal living tissue information from the skin surface and which is therefore great utility when employed for a medical diagnosis, a medical checkup for geriatic diseases and so forth.
- the present invention can provide a method and an apparatus for obtaining tissue information on not only attenuation but also reflection (backward scattering) coefficients of a living tissue through simple processing which can be executed on the real-time basis, too, and does not introduce much noise.
- the present invention can provide a method and an apparatus which obtains energy (or power) values of reflected from a living tissue of ultrasonic waves of at least three frequency bands (or components) and performs arithmetic processing of the energy values to thereby obtain living tissue characteristic values (parameters) of clear physical meaning, such as a frequency slope of an attenuation coefficient of a living tissue and a spatial derivative of a frequency power exponent of its reflection coefficient, through simple processing which can be performed on the real-time basis and does not introduce much noise.
- the present invention provides a method in which energies of ultrasonic waves of at least three frequency bands (or components) reflected from a living tissue are obtained, and differences among their logarithms are obtained and then an attenuation slope and/or reflection power exponent derivative of the living tissue are obtained from at least two equations obtained by differentiating the differences in terms of the depth of measurement. Apparatus carrying out the method is also provided.
- the "power” mentioned herein is energy per unit time but, in this specification, it is included in the “energy”.
- Figure 1 shows the manner in which an ultrasonic transducer 11 formed by a piezoelectric element, for example, PZT sold by Clevite Inc., held in contact with the skin surface 0 of a living body, transmits thereinto and receives therefrom ultrasonic pulses in a direction Z.
- Reference numerals 0,1, 2, ... i, i+1, ... and m indicate boundaries of body tissues crossing the Z-axis. Intermediate portions between adjacent boundaries, for instance, 0-1, 1-2, 2-3, ... , i-i+1, ... show, for instance, the outer skin, fat, muscles, ... the liver,... and so forth.
- Reference numeral 51 designates a focused sound field that is determined by the radius of curvature of an aperture concave of the transducer 11 and the frequency of the ultrasonic waves used.
- the intensity of received waves reflected from a depth z varies as a function of the depth z with a factor determined by three-dimensional geometric conditions which are dependent on the convergence of a beam on both ways (in both directions) and the wavelength, such as the degree of focusing, even if the subject under test is not a living body but water or the like which does not attenuate ultrasonic waves.
- Transmitted ultrasonic waves having reached the boundary i are reflected back or scattered (reflected, refracted) and aside three-dimensionally since the living tissues on both sides of the boundary i have different acoustic impedances or the boundary i has irregularities; however, since the acoustic impedance and the speed of sound in the living body do not widely differ with tissues, the transmitted ultrasonic waves mostly pass through the boundary i.
- Letting the transmission factor, reflection factor and scattering factor of the boundary i with respect to the incident waves thereon be represented by ⁇ i, yi and 6i, respectively, they bear the following relationships: Therefore, even if yi and 6i somewhat have frequency dependence, T i can be regarded as having no frequency dependence.
- the voluminal tissue sandwiched between the boundaries i and i+1 has a microstructure of a typical size nearly equal to or smaller than the wavelength of the ultrasonic waves and having cells, capillary vessels, fibers, nerves and so forth intertwined complicatedly.
- the microstructure cannot theoretically be measured because of its size relative to the wavelength of the ultrasonic waves and only a spatial mean value of the microstructure can be measured. It has been proven experimentally that ultrasonic waves transmitted into a living body are subjected to attenuation which varies exponentially as the depth (z) increases, and that its attenuation constant a is proportional to the frequency f of the ultrasonic waves. That is, where ⁇ is a proportional constant.
- the proportional constant ⁇ is a frequency slope of the attenuation constant and referred to as an attenuation slope and it is a characteristic value of the tissue.
- a reflection from a voluminal tissue is statistically a speckled reflection commonly referred to as "speckle" and a reflection coefficient y is given experimentally as follows: where b and n are constants.
- the constant n is a frequency power exponent of the reflection coefficient and a characteristic value of the tissue.
- the following expression is a computational expression obtained from sound pressure measurement but, if the power of the waves can be directly measured, a direct representing expression can be used.
- F(f 1 ⁇ z) is a correcting term obtained by integrating frequency dependent components of reflection and attenuation in connection with a frequency variation from f 1 in the band 20.
- T 'i is the transmission factor of the reflected waves at the boundary i.
- the upper limit i is a maximum number from the skin surface to the depth z.
- E 1 , E 2 and E 3 are measured as functions of the depth z.
- ⁇ (z) frequency slope of attenuation coefficient, and spatial derivative of frequency power exponent of reflection coefficient
- the above is a description of the principle of the present invention.
- the present invention is free from the influence of the boundary transmission factors ⁇ i and T 'i, the constant b(z) of the reflection coefficient and the absolute values Q 1 , Q 2 and Q 3 of the amplitudes of respective frequency components. While in the foregoing Eq. (5) is set up using f 2 and f 3 , it may also be set up using f 3 and f 4 . Furthermore, if the value A of the attenuation compensating time control amplification degree (TGC) is held constant with respect to all frequencies, then become zero, making compensation unnecessary.
- TGC attenuation compensating time control amplification degree
- Eq. (1) and so on can be represented using the amplitude absolute value Q,(z) of the sound pressure but, in order to avoid a bad influence of the phase term, it is necessary to obtain E, first and then Q, from This is not so significant, and hence is not described in this specification.
- tissue characteristic value thus obtained as a function of the depth z on a certain scanning line is displayed on the corresponding scanning line on a CRT or the like as in the case of a B-mode graph, a two-dimensionally or three-dimensionally distributed image can be obtained. This is useful for finding out an abnormality, such as a cancer or the like, by visual examination.
- FIG 3 illustrates an example of apparatus suitable for carrying the present invention into practice.
- reference numeral 11 indicates a wide-band transducer, which is formed by piezoelectric elements of the aforementioned PZT or PVDF (polyvinylidene fluoride sold by Kureha Kogyo of Japan).
- the transducer 11 is shown to be a compound transducer which comprises a PZT transducer 11' and PVDF transducer 11" covering different frequency bands.
- the transducer is formed by three layers of center frequencies f 1 , f 2 and f 3 for covering frequency bands 2 ⁇ 1 , 20 2 and 20 3 (where ⁇ 1 , ⁇ 2 and ⁇ 3 are half-widths), respectively, and received waves are separated by filters to obtain energies E 1 , E 2 and E 3 .
- pulses of wide band are transmitted and the DFFT (Digital Fast Fourier Transformation) is used.
- Reference numeral 12 designates a driver, which may be arranged to drive the transducers 11' and 11" by impulses or in separately specified frequency bands.
- Reference numeral 13 identifies a wide-band amplifier for amplifying signals of received reflected waves.
- the reflected wave from a depth zi appears at such a time as follows: where C is the sound speed in the living body.
- a signal from a tissue between the depth zi and zi+Az appears in the following time interval: Accordingly, the tissue characteristic between the depths zi and zi+Az can be obtained by analyzing the signal received in the time interval ⁇ t.
- the amplification degree Z of the amplifier 13 is varied with an increase in the depth z or with the lapse of time t. This is called time-gain control or sensitivity-time control. This control is needed for retaining excellent SN ratio in subsequent signal processing.
- Reference numeral 14 denotes a gate, which is opened in the time phase of Eq. (12) and closed after the lapse of time given by Eq. (13).
- Reference numeral 16 shows a DFFT (Digital Fast Fourier Transformation) circuit, which analyzes the abovesaid 100 data to output real parts and imaginary parts of about 50 frequency components. For instance, in the case of the frequency f 1 , a component in-phase with cos2 ⁇ f 1 t is a real part R 1 and a component in-phase with sin2 ⁇ f 1 t is an imaginary part l 1 .
- DFFT Digital Fast Fourier Transformation
- Reference numerals 17-1, 17-2,... refer to calculating units, which are supplied with the real parts and the imaginary parts of components of the frequencies f 1 , f 2 , f 3 , f 4 , ... from the DFFT circuit 16. Since the calculating units 17-1, 17-2, ... are identical in construction and in operation, a detailed description will be given of the calculating unit 17-1 alone.
- the calculating unit 17-1 receives the real part R 1 and the imaginary part l 1 , ofthe frequency f 1 from the DFFT circuit 16.
- the real part R 1 and the imaginary part l 1 are squared by square circuits 171 and 172 to obtain R, 2 and l 1 2 , which are added by an adder 173, obtaining the sum R 1 2 +l 1 2 .
- This sum is equal to E 1 .
- InE is obtained by a logarithmic amplifier 74.
- InG 1 2 ⁇ A 1 2 is obtained as a function of the depth z (or the time t) and prestored in the form of a table in an ROM 178, from which is read out a value for the corresponding z (or t).
- the output InE, of the lorarithmic amplifier 174 and the output InG 1 2 ⁇ A 1 2 of the ROM 178 are applied to a subtractor 175, wherein a subtraction InE 1 -InG 1 2 ⁇ A 1 2 is carried out to output which is stored in a memory 176.
- the calculating unit 17-2 provides the following output:
- Reference numerals 18-1, 18-2, 18-3, ... signify subtractors.
- the subtractor 18-1 subtracts the output of the calculating unit 17-2 from the output of the calculating unit 17-1.
- the subtractor 18-2 subtracts the output of the calculating unit 17-3 from the output of the calculating unit 17-2. In a similar manner, the following subtractors operate.
- the output of the subtractor 18-2 similarly provides the left side of Eq. (5).
- Reference numeral 19-1 indicates an algebraic calculator which receives the outputs of the subtractors 18-1 and 18-2 and solves from Eqs. (4) and (5) a simultaneous equation with ⁇ (z) and unknown. Certain constants ⁇ 11 and a l2 determined by the frequencies f 1 , and f 2 are multiplied by the outputs of the subtractors 18-1 and 18-2 and then added together to obtain ⁇ (z).
- Reference numeral 20 designates an arithmetic mean circuit which comprises an adder 21 for adding the outputs of the algebraic calculators 19-1, 19-2, ... and a divider 22 for dividing the output of the adder 21 by the number N of inputs to the adder 22.
- the arithmetic mean circuit 20 obtains an arithmetic means value of the N values ⁇ (z) or sequentially obtained for each frequency component of the output of the DFFT circuit 16.
- Reference numeral 23 identifies a shift register which comprises L stacked registers 23-1, 23-2,... 23-L for storing the output of the arithmetic mean circuit 20.
- the output of the arithmetic mean circuit 20 for the depth zi is written into the register 23-1 and when the output of the arithmetic mean circuit 20 for the next depth zi+1 goes into the register 23-1, the content of the register 23-1 is shifted to the register 23-2.
- previous data are shifted upward through successive registers in the shift register 23.
- L data are stored in the shift register 23, with the oldest data in the register 23-L and the latest one in the register 23-1.
- Reference numeral 24 denotes an arithmetic mean circuit for obtaining an arithmetic mean value of L data.
- the arithmetic mean circuit 24 is also comprised of an adder 25 for adding L outputs from the registers 23-1 to 23-L and a divider 26 for dividing the output of the adder 25 by L. The outputs of the registers 23-1 to 23-L are added together by the adder 25 and its output is applied to the divider 26, wherein it is divided by L to obtain the arithmetic mean.
- the output of the arithmetic mean circuit 24 provides, for each scanning, a mean value of (LxN) ⁇ (z)'s or for each of the depths z 1 , z 2 , Z3 , ... z and z 1+1 , and the mean value is stored in a memory.
- the frequency components f 1 , f 2 , f 3 , ... correspond to the outputs of the DFFT circuit 16 in a sequential order but, by a suitable selection of the outputs of the DFFT circuit 16 in a manner to form a geometric or arithmetic progression as described previously, the calculating circuits of the algebraic calculators 19-1, 19-2, ... can be simplified although the number N decreases.
- ⁇ (z) By scanning one sectional area of a living body in successive scanning directions so that, for instance, ⁇ (z) may be obtained as a function of each of the depths z 1 , z 2 , ... z and z 1+1 as a mean value of the LxMxN measured values for each scanning direction, and then displaying the resulting values on the corresponding scanning lines of a CRT, it is possible to obtain a distribution diagram of j3(z) or on the sectional area of the living body. This is very useful for detecting an abnormal tissue as of a cancer.
Description
- The present invention relates to the measuring of characteristic parameters of living tissues by transmitting ultrasonic waves into a living body and analyzing reflected waves therefrom.
- Conventional systems for obtaining tissue characteristics by analyzing reflected ultrasonic waves of plural frequencies have been proposed by linuma (Japanese Patent "Kokai" No. 38490/74) and Nakagawa (Japanese Patent Publication No. 24798/77). With these systems, however, their operations are based on sound pressure waveforms, so that when the ultrasonic waves have a wide frequency band, like pulses, accurate measurements are impossible under the influence of the phase relationships of respective frequency components, pulse overlapping of continuous reflected waves and phase cancellation in a receiving sensor.
- The abovesaid prior art systems can be employed in the case where the living body is composed of several kinds of tissues, an ultrasonic reflector of a definite approximately smooth surface exist at the boundary between adjacent tissues and the reflection factor and the transmission factor of the ultrasonic reflector have no frequency dependence. Such reflection is called specular reflection.
- With recent technological progress, however, it has become possible to measure a weak reflection from the tissue between boundaries. In general, the tissue has such a microstructure that cells, capillary vessels, lymphatic vessels, muscular fibers and so forth intertwine complicatedly. A typical size of such a tissue is nearly equal to or smaller than the wavelength of ultrasonic waves. On account of this, reflected waves from the microstructure are accompanied by complex interference owing to phase dispersion and pulse overlapping, introducing in a B-mode tomogram a speckled pattern commonly referred to as "speckle". It has been proven experimentally that reflection from the tissue (backward scattering) has a frequency characteristic, that its reflection coefficient is proportional to the nth power of the frequency, and that the value of n is a characteristic value (a parameter) representing the tissue. It has been reported that n=2.1 to 2.2 in the liver and n=3.3 in the myocardium.
- Systems for obtaining the tissue characteristics in such a case have been proposed by Hayakawa and others.
- *1. "Theory of Reflecting Ultrasonic Computer Tomograph Using Plural Frequencies", Japanese Journal of Medical Ultrasonics, vol. 7, Supplement II, 1980.
- *2. "Multifrequency echoscopy for quantitative acoustical characterization of living tissues.", J. Acout. Soc. Am. 69 (6), June 1981, pp. 1838-1840.
- Noting the energy value of ultrasonic waves, the
system *1 conducts a second order differentiation by natural logarithms of their frequencies and a first order differentiation in the direction of depth, by which "a second order differentiated value of the attenuation coefficient of the ultrasonic waves by the natural logarithms of their frequencies" is obtained as a tissue characteristic parameter. According to thesystem *2, energy (or power) values of the ultrasonic waves are obtained through utilization of three frequencies f" f2 and f3 and, as a difference value, "the second order differentiated value of the attenuation coefficient of the ultrasonic waves by the natural logarithms of their frequencies" is obtained in the form of a parameter. As experimentally ascertained, it is indicated, when the attenuation coefficient is proportional to the first power of the frequency, the abovesaid parameter is in agreement with an attenuation constant. - The abovesaid Hayakawa system requires complex processing corresponding to the second order differentiation by the natural logarithms of the frequencies, and hence is difficult of real-time processing and poor in SN ratio; further, tissue information on the reflection (backward scattering) is entirely lost. Moreover, the parameters thus obtained are insignificant from the physical viewpoint.
- The present invention pertains to the measuring of the frequency dependency of the reflection coefficient and that of the attenuation coefficient of the living tissue separately of each other.
- The present invention as defined in
Claims 1 and 6, respectively, provides a method and apparatus which can enable separate measurement of tissue characteristic information on the attenuation and reflection coefficients of a living tissue to thereby permit non-invasive measurement of accurate internal living tissue information from the skin surface and which is therefore great utility when employed for a medical diagnosis, a medical checkup for geriatic diseases and so forth. - The present invention can provide a method and an apparatus for obtaining tissue information on not only attenuation but also reflection (backward scattering) coefficients of a living tissue through simple processing which can be executed on the real-time basis, too, and does not introduce much noise.
- The present invention can provide a method and an apparatus which obtains energy (or power) values of reflected from a living tissue of ultrasonic waves of at least three frequency bands (or components) and performs arithmetic processing of the energy values to thereby obtain living tissue characteristic values (parameters) of clear physical meaning, such as a frequency slope of an attenuation coefficient of a living tissue and a spatial derivative of a frequency power exponent of its reflection coefficient, through simple processing which can be performed on the real-time basis and does not introduce much noise.
- The present invention provides a method in which energies of ultrasonic waves of at least three frequency bands (or components) reflected from a living tissue are obtained, and differences among their logarithms are obtained and then an attenuation slope and/or reflection power exponent derivative of the living tissue are obtained from at least two equations obtained by differentiating the differences in terms of the depth of measurement. Apparatus carrying out the method is also provided.
- The "power" mentioned herein is energy per unit time but, in this specification, it is included in the "energy".
- Reference is made, by way of example, to the accompanying drawings, in which:-
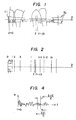
- Figure 1 is a schematic diagram of a three-dimensional model illustrating the manner of actual measurement, explanatory of the principle of the present invention;
- Figure 2 is a schematic diagram showing a one-dimensional model obtained by a correction of the model of Figure 1;
- Figure 3 is a block diagram illustrating an embodiment of the present invention; and
- Figure 4 is a time domain diagram of a received reflected signal.
- A description will be given first, with reference to Figure 1, of the principle of the present invention. Figure 1 shows the manner in which an ultrasonic transducer 11 formed by a piezoelectric element, for example, PZT sold by Clevite Inc., held in contact with the
skin surface 0 of a living body, transmits thereinto and receives therefrom ultrasonic pulses in a direction Z.Reference numerals Reference numeral 51 designates a focused sound field that is determined by the radius of curvature of an aperture concave of the transducer 11 and the frequency of the ultrasonic waves used. - The intensity of received waves reflected from a depth z varies as a function of the depth z with a factor determined by three-dimensional geometric conditions which are dependent on the convergence of a beam on both ways (in both directions) and the wavelength, such as the degree of focusing, even if the subject under test is not a living body but water or the like which does not attenuate ultrasonic waves. The ratio of the reflected waves at the depth z=0 is defined as Gl(z). This ratio can be measured by disposing a perfect reflector, such as a metal plate, at the depth z in water or the like.
- Transmitted ultrasonic waves having reached the boundary i are reflected back or scattered (reflected, refracted) and aside three-dimensionally since the living tissues on both sides of the boundary i have different acoustic impedances or the boundary i has irregularities; however, since the acoustic impedance and the speed of sound in the living body do not widely differ with tissues, the transmitted ultrasonic waves mostly pass through the boundary i. Letting the transmission factor, reflection factor and scattering factor of the boundary i with respect to the incident waves thereon be represented by τi, yi and 6i, respectively, they bear the following relationships:

- Through using corrections by the abovesaid Gi(z) and Ti, such a three-dimensional model as shown in Figure 1 can be converted into such a one-dimensional model as shown in Figure 2. The following description will be given of the one-dimensional model. In Figure 2 the transducer has indefinite expanses in the X and Y directions vertical to the ultrasonic transmission direction Z.
- The voluminal tissue sandwiched between the boundaries i and i+1 has a microstructure of a typical size nearly equal to or smaller than the wavelength of the ultrasonic waves and having cells, capillary vessels, fibers, nerves and so forth intertwined complicatedly. The microstructure cannot theoretically be measured because of its size relative to the wavelength of the ultrasonic waves and only a spatial mean value of the microstructure can be measured. It has been proven experimentally that ultrasonic waves transmitted into a living body are subjected to attenuation which varies exponentially as the depth (z) increases, and that its attenuation constant a is proportional to the frequency f of the ultrasonic waves. That is,

- A reflection from a voluminal tissue is statistically a speckled reflection commonly referred to as "speckle" and a reflection coefficient y is given experimentally as follows:

- In Figure 2, let it be assumed that ultrasonic waves of a frequency f, (
frequency band 20, where 0 is a half-width, and amplitude Q,(O)) are transmitted and received. Alternatively, it may also be assumed that pulses of a wide frequency band are transmitted, the amplitude of a component of the frequency f1 is Q1(0) and the component of the frequency f, of reflected waves is observed. Letting the attenuation compensating time control amplification degree (TGC) of the received signal and apparent energy observed including the attenuation compensating time control amplification degree (TGC) be represented by A1 (z) and E1 (z), respectively, E1 (z) is given by the following equation. For convenience of description, the following expression is a computational expression obtained from sound pressure measurement but, if the power of the waves can be directly measured, a direct representing expression can be used.
band 20. When Ω<<f1, F(f1, Z) can be regarded as invariable at the frequency f,. T'i is the transmission factor of the reflected waves at the boundary i. n indicates multiplications of TiT'i from i=O to i=i. The upper limit i is a maximum number from the skin surface to the depth z. - Apparent energy E2 similarly observed in respect of a sound frequency f2 is as follows:

- A difference between natural logarithms of Eqs. (1) and (2) is as follows:

- Differentiating (or differencing) Eq. (3) with respect to the depth z (in a reflected signal train, z=ct, where c is the sound speed, and Eq. (3) may also be differentiated with respect to time t.), it follows that

- Similarly setting up the equation corresponding to Eq. (4) with respect to f2 and f3 by introducing a third frequency f3, it follows that

- In Eqs. (4) and (5), E1, E2 and E3 are measured as functions of the depth z.
- Accordingly, the left sides of Eqs. (4) and (5) are both measured values.
- The left sides of Eqs. (4) and (5) can be transformed as follows: and


- On the right sides of Eqs. (4) and (5),

- β(z): frequency slope of attenuation coefficient, and

- The above is a description of the principle of the present invention. The present invention is free from the influence of the boundary transmission factors τi and T'i, the constant b(z) of the reflection coefficient and the absolute values Q1, Q2 and Q3 of the amplitudes of respective frequency components. While in the foregoing Eq. (5) is set up using f2 and f3, it may also be set up using f3 and f4. Furthermore, if the value A of the attenuation compensating time control amplification degree (TGC) is held constant with respect to all frequencies, then

- Eq. (1) and so on can be represented using the amplitude absolute value Q,(z) of the sound pressure but, in order to avoid a bad influence of the phase term, it is necessary to obtain E, first and then Q, from

- By putting the three frequencies f1, f2 and f3 into a geometric progression, the subsequent calculations are simplified. Letting


- Furthermore, obtaining a difference between Eqs. (4) and (5), the term


- Also the calculation is simplified by putting the frequencies f1, f2 and f3 into an arithmetic progression, that is,


- Since the pulse length of reflected waves from the depth z usually has a finite value that is not 0, the reflected waves are superimposed on reflected waves from irregular tissues before and after the depth z and certain frequency components may sometimes be irregularly added to or subtracted from each other due to interference, leading to a noticeable error. This is called spectrum scalloping. To avoid this, it is preferable that N values of (3(z) and

- It is needless to say that the calculations for obtaining a(z) and

- For improving the statistic precision, it is also possible to transmit and receive pulses and measure them M times for the same scanning line and perform statistical processing of the measured values, various quantities during computation and last computed values. For instance, even if an examinee stops his breath during measurement, tissues on the scanning line wobble three-dimensionally owing to pulsation of the heart, small changes in his posture and so forth. Accordingly, observed values at the depth z in the M-times measurement aredistributed in a specific space domain around a mean center X · Y · Z and the M-times statistical processing bears the same meaning as statistical processing of measured values at M measuring points in a certain space domain. By conducting the statistical processing in connection with L points before and after the depth z for each scanning, the statistical accuracy is further improved.
- By this, a maximum of LxMxN samples can be obtained.
- If the tissue characteristic value thus obtained as a function of the depth z on a certain scanning line is displayed on the corresponding scanning line on a CRT or the like as in the case of a B-mode graph, a two-dimensionally or three-dimensionally distributed image can be obtained. This is useful for finding out an abnormality, such as a cancer or the like, by visual examination.
- A description will be given of the method of the present invention. Figure 3 illustrates an example of apparatus suitable for carrying the present invention into practice. In Figure 3 reference numeral 11 indicates a wide-band transducer, which is formed by piezoelectric elements of the aforementioned PZT or PVDF (polyvinylidene fluoride sold by Kureha Kogyo of Japan). The transducer 11 is shown to be a compound transducer which comprises a PZT transducer 11' and PVDF transducer 11" covering different frequency bands. It is also possible to employ such a system in which the transducer is formed by three layers of center frequencies f1, f2 and f3 for covering frequency bands 2Ω1, 202 and 203 (where Ω1, Ω2 and Ω3 are half-widths), respectively, and received waves are separated by filters to obtain energies E1, E2 and E3. In this illustrated example, however, pulses of wide band are transmitted and the DFFT (Digital Fast Fourier Transformation) is used.
Reference numeral 12 designates a driver, which may be arranged to drive the transducers 11' and 11" by impulses or in separately specified frequency bands.Reference numeral 13 identifies a wide-band amplifier for amplifying signals of received reflected waves. The received signal varies with time as shown in Figure 4 with the time of transmission of pulses represented by t=0, and signals are reflected back from deeper positions in a living body with the lapse of time. The reflected wave from a depth zi appears at such a time as follows:

- Since the reflected signal decreases exponentially with an increase in the depth z by virtue of attenuation on forward and backward paths, the amplification degree Z of the
amplifier 13 is varied with an increase in the depth z or with the lapse of time t. This is called time-gain control or sensitivity-time control. This control is needed for retaining excellent SN ratio in subsequent signal processing. -
Reference numeral 14 denotes a gate, which is opened in the time phase of Eq. (12) and closed after the lapse of time given by Eq. (13).Reference numeral 15 represents an AID converter, which is required to have a sampling speed of about 20 MHz for signals of 1 to 10 MHz band. Assuming that Δz=1.5 mm, then C=1500 m/s, so that Δt=2 µs and, if sampling is carried out at 20 MHz, about 100 samples can be obtained. -
Reference numeral 16 shows a DFFT (Digital Fast Fourier Transformation) circuit, which analyzes the abovesaid 100 data to output real parts and imaginary parts of about 50 frequency components. For instance, in the case of the frequency f1, a component in-phase with cos2πf1t is a real part R1 and a component in-phase with sin2πf1t is an imaginary part l1. - Reference numerals 17-1, 17-2,... refer to calculating units, which are supplied with the real parts and the imaginary parts of components of the frequencies f1, f2, f3, f4, ... from the
DFFT circuit 16. Since the calculating units 17-1, 17-2, ... are identical in construction and in operation, a detailed description will be given of the calculating unit 17-1 alone. - The calculating unit 17-1 receives the real part R1 and the imaginary part l1, ofthe frequency f1 from the
DFFT circuit 16. The real part R1 and the imaginary part l1, are squared bysquare circuits adder 173, obtaining the sum R1 2+l1 2. This sum is equal to E1. Next, InE, is obtained by a logarithmic amplifier 74. Further, InG1 2· A1 2 is obtained as a function of the depth z (or the time t) and prestored in the form of a table in anROM 178, from which is read out a value for the corresponding z (or t). The output InE, of thelorarithmic amplifier 174 and the output InG1 2· A1 2 of theROM 178 are applied to asubtractor 175, wherein a subtraction InE1-InG1 2· A1 2 is carried out to output
memory 176. - Similar processing is performed for the reflected signal received at a time ti+1 after At to obtain


memory 176 is obtained by asubtractor 177. The difference thus obtained is a differentiated (differenced) value at Δz. This becomes the output of the calculating unit 17-1 and expresses the following equation:
- Likewise, the calculating unit 17-2 provides the following output:

- Reference numerals 18-1, 18-2, 18-3, ... signify subtractors. The subtractor 18-1 subtracts the output of the calculating unit 17-2 from the output of the calculating unit 17-1. The subtractor 18-2 subtracts the output of the calculating unit 17-3 from the output of the calculating unit 17-2. In a similar manner, the following subtractors operate.
- Thus the output of the subtractor 18-1 provides the difference between Eqs. (14) and (15):

- This is the left side of Eq. (4) as shown in Eq. (6). The order of calculation by the calculating units 17-1 and 17-2 and the calculation by the subtractor 18-1 is reverse from the order of calculations described previously but, in this case, it does not matter mathematically.
- The output of the subtractor 18-2 similarly provides the left side of Eq. (5).
- Reference numeral 19-1 indicates an algebraic calculator which receives the outputs of the subtractors 18-1 and 18-2 and solves from Eqs. (4) and (5) a simultaneous equation with β(z) and


-
Reference numeral 20 designates an arithmetic mean circuit which comprises anadder 21 for adding the outputs of the algebraic calculators 19-1, 19-2, ... and adivider 22 for dividing the output of theadder 21 by the number N of inputs to theadder 22. The arithmeticmean circuit 20 obtains an arithmetic means value of the N values β(z) or
DFFT circuit 16. -
Reference numeral 23 identifies a shift register which comprises L stacked registers 23-1, 23-2,... 23-L for storing the output of the arithmeticmean circuit 20. At first, the output of the arithmeticmean circuit 20 for the depth zi is written into the register 23-1 and when the output of the arithmeticmean circuit 20 for the next depth zi+1 goes into the register 23-1, the content of the register 23-1 is shifted to the register 23-2. In this way, upon each occurrence of inputting new data into the register 23-1, previous data are shifted upward through successive registers in theshift register 23. In consequence, L data are stored in theshift register 23, with the oldest data in the register 23-L and the latest one in the register 23-1. -
Reference numeral 24 denotes an arithmetic mean circuit for obtaining an arithmetic mean value of L data. The arithmeticmean circuit 24 is also comprised of anadder 25 for adding L outputs from the registers 23-1 to 23-L and adivider 26 for dividing the output of theadder 25 by L. The outputs of the registers 23-1 to 23-L are added together by theadder 25 and its output is applied to thedivider 26, wherein it is divided by L to obtain the arithmetic mean. - The output of the arithmetic
mean circuit 24 provides, for each scanning, a mean value of (LxN) β(z)'s or
- While the above description has been given of a method for executing statistical processing with the last calculated value β(z) or

DFFT circuit 16 in connection with frequency for M-time scanning of L points to remove the influence of the spectrum scalloping and executing again statistical processing with a last calculated value. - In the foregoing embodiment the frequency components f1, f2, f3, ... correspond to the outputs of the
DFFT circuit 16 in a sequential order but, by a suitable selection of the outputs of theDFFT circuit 16 in a manner to form a geometric or arithmetic progression as described previously, the calculating circuits of the algebraic calculators 19-1, 19-2, ... can be simplified although the number N decreases. - By scanning one sectional area of a living body in successive scanning directions so that, for instance, β(z) may be obtained as a function of each of the depths z1, z2, ... z and z1+1 as a mean value of the LxMxN measured values for each scanning direction, and then displaying the resulting values on the corresponding scanning lines of a CRT, it is possible to obtain a distribution diagram of j3(z) or

Claims (10)
Applications Claiming Priority (2)
| Application Number | Priority Date | Filing Date | Title |
|---|---|---|---|
| JP57573/82 | 1982-04-07 | ||
| JP57057573A JPS58173539A (en) | 1982-04-07 | 1982-04-07 | Measuring of characteristics of living body tissue by ultrasonic wave |
Publications (3)
| Publication Number | Publication Date |
|---|---|
| EP0091768A2 EP0091768A2 (en) | 1983-10-19 |
| EP0091768A3 EP0091768A3 (en) | 1985-06-26 |
| EP0091768B1 true EP0091768B1 (en) | 1989-07-26 |
Family
ID=13059585
Family Applications (1)
| Application Number | Title | Priority Date | Filing Date |
|---|---|---|---|
| EP83301893A Expired EP0091768B1 (en) | 1982-04-07 | 1983-04-05 | Measuring characteristics of living tissues by ultrasonic waves |
Country Status (4)
| Country | Link |
|---|---|
| US (2) | US4564019A (en) |
| EP (1) | EP0091768B1 (en) |
| JP (1) | JPS58173539A (en) |
| DE (1) | DE3380275D1 (en) |
Families Citing this family (46)
| Publication number | Priority date | Publication date | Assignee | Title |
|---|---|---|---|---|
| US4575799A (en) * | 1983-03-23 | 1986-03-11 | Fujitsu Limited | Ultrasonic living body tissue characterization system |
| JPS59203549A (en) * | 1983-04-30 | 1984-11-17 | 中山 淑 | Ultrasonic diagnostic apparatus |
| FR2554238B1 (en) * | 1983-10-28 | 1986-02-28 | Labo Electronique Physique | APPARATUS FOR EXPLORING MEDIA BY ULTRASONIC ECHOGRAPHY |
| JPS60122367A (en) * | 1983-12-07 | 1985-06-29 | Terumo Corp | Method and device for ultrasonic measurement |
| JPS60176629A (en) * | 1984-02-23 | 1985-09-10 | テルモ株式会社 | Ultrasonic measuring method and apparatus |
| JPS60195473A (en) * | 1984-03-17 | 1985-10-03 | Terumo Corp | Ultrasonic measuring method and device |
| JPS60203242A (en) * | 1984-03-28 | 1985-10-14 | 富士通株式会社 | Reflective type ultrasonic non-linear reflection coefficientmeasuring apparatus |
| FR2563918B1 (en) * | 1984-04-10 | 1987-06-05 | Labo Electronique Physique | APPARATUS FOR EXPLORING MEDIA BY ULTRASONIC ECHOGRAPHY |
| JPS6111658A (en) * | 1984-06-28 | 1986-01-20 | Terumo Corp | Method and device for measuring ultrasonic wave |
| JPS61135640A (en) * | 1984-12-06 | 1986-06-23 | テルモ株式会社 | Ultrasonic measuring method and apparatus |
| US4777599A (en) * | 1985-02-26 | 1988-10-11 | Gillette Company | Viscoelastometry of skin using shear wave propagation |
| FR2579765B1 (en) * | 1985-03-29 | 1988-05-06 | Labo Electronique Physique | METHOD AND APPARATUS FOR EXPLORING MEDIA BY ULTRASONIC ECHOGRAPHY |
| US4803994A (en) * | 1987-08-12 | 1989-02-14 | General Electric Company | Backscatter data collection technique for ultrasound |
| US5235983A (en) * | 1991-03-08 | 1993-08-17 | Fujitsu Limited | Ultrasonic imaging apparatus |
| US5460595A (en) * | 1993-06-01 | 1995-10-24 | Dynatronics Laser Corporation | Multi-frequency ultrasound therapy systems and methods |
| GB2279742A (en) * | 1993-06-29 | 1995-01-11 | Cancer Res Inst Royal | Apparatus for monitoring ultrasonic surgical ablation |
| US5891038A (en) * | 1996-12-30 | 1999-04-06 | General Electric Company | Method, apparatus and applications for combining transmit wave functions to obtain synthetic waveform in ultrasonic imaging system |
| AU1454699A (en) | 1997-11-14 | 1999-06-07 | Colorado Seminary | Ultrasonic system for grading meat |
| US6385474B1 (en) | 1999-03-19 | 2002-05-07 | Barbara Ann Karmanos Cancer Institute | Method and apparatus for high-resolution detection and characterization of medical pathologies |
| US6213946B1 (en) | 1998-12-24 | 2001-04-10 | Agilent Technologies, Inc. | Methods and apparatus for speckle reduction by orthogonal pulse compounding in medical ultrasound imaging |
| US6835178B1 (en) * | 1999-06-23 | 2004-12-28 | Hologic, Inc. | Ultrasonic bone testing with copolymer transducers |
| US20020173721A1 (en) * | 1999-08-20 | 2002-11-21 | Novasonics, Inc. | User interface for handheld imaging devices |
| US6685645B1 (en) | 2001-10-20 | 2004-02-03 | Zonare Medical Systems, Inc. | Broad-beam imaging |
| AU2003261073A1 (en) * | 2002-05-16 | 2003-12-02 | Barbara Ann Karmanos Cancer Institute | Combined diagnostic and therapeutic ultrasound system |
| US6984210B2 (en) * | 2002-12-18 | 2006-01-10 | Barbara Ann Karmanos Cancer Institute | Diagnostic analysis of ultrasound data |
| US6926672B2 (en) * | 2002-12-18 | 2005-08-09 | Barbara Ann Karmanos Cancer Institute | Electret acoustic transducer array for computerized ultrasound risk evaluation system |
| US6837854B2 (en) * | 2002-12-18 | 2005-01-04 | Barbara Ann Karmanos Cancer Institute | Methods and systems for using reference images in acoustic image processing |
| US7998073B2 (en) * | 2003-08-04 | 2011-08-16 | Imacor Inc. | Ultrasound imaging with reduced noise |
| AU2004294979B2 (en) * | 2003-11-26 | 2011-06-02 | Imacor Inc. | Transesophageal ultrasound using a narrow probe |
| US7374569B2 (en) * | 2004-09-02 | 2008-05-20 | Dynatronics, Corporation | Dynamically distributing power of a light beam for use in light therapy |
| US20070208396A1 (en) * | 2006-03-03 | 2007-09-06 | Gary Whatcott | Systems and methods for providing a dynamic light pad |
| US20070208289A1 (en) * | 2006-03-03 | 2007-09-06 | Jay Walther | Systems and methods for providing light therapy traction |
| US10201324B2 (en) | 2007-05-04 | 2019-02-12 | Delphinus Medical Technologies, Inc. | Patient interface system |
| US8870771B2 (en) * | 2007-05-04 | 2014-10-28 | Barbara Ann Karmanos Cancer Institute | Method and apparatus for categorizing breast density and assessing cancer risk utilizing acoustic parameters |
| FR2917831B1 (en) * | 2007-06-25 | 2009-10-30 | Super Sonic Imagine Sa | METHOD OF RHEOLOGICAL CHARACTERIZATION OF A VISCOELASTIC MEDIUM |
| KR100983623B1 (en) * | 2008-03-04 | 2010-09-24 | 광주과학기술원 | A method for selection and separation of normal cell and specific cell using ultrasonic wave |
| US9248318B2 (en) | 2008-08-06 | 2016-02-02 | Mirabilis Medica Inc. | Optimization and feedback control of HIFU power deposition through the analysis of detected signal characteristics |
| WO2010017419A2 (en) * | 2008-08-06 | 2010-02-11 | Mirabilis Medica Inc. | Optimization and feedback control of hifu power deposition through the analysis of detected signal characteristics |
| JP2013519455A (en) | 2010-02-12 | 2013-05-30 | デルフィヌス メディカル テクノロジーズ,インコーポレイテッド | How to characterize a patient's tissue |
| CN102843959B (en) | 2010-02-12 | 2014-11-12 | 戴尔菲纳斯医疗科技公司 | Method of characterizing the pathological response of tissue to a treatmant plan |
| US9763641B2 (en) | 2012-08-30 | 2017-09-19 | Delphinus Medical Technologies, Inc. | Method and system for imaging a volume of tissue with tissue boundary detection |
| US10123770B2 (en) | 2013-03-13 | 2018-11-13 | Delphinus Medical Technologies, Inc. | Patient support system |
| US10143443B2 (en) | 2014-05-05 | 2018-12-04 | Delphinus Medical Technologies, Inc. | Method for representing tissue stiffness |
| US10743837B2 (en) | 2014-08-04 | 2020-08-18 | Delphinus Medical Technologies, Inc. | Ultrasound waveform tomography method and system |
| US10285667B2 (en) | 2014-08-05 | 2019-05-14 | Delphinus Medical Technologies, Inc. | Method for generating an enhanced image of a volume of tissue |
| JP7278267B2 (en) | 2017-09-19 | 2023-05-19 | コーニンクレッカ フィリップス エヌ ヴェ | Ultrasound system and method for measuring acoustic attenuation coefficient |
Family Cites Families (2)
| Publication number | Priority date | Publication date | Assignee | Title |
|---|---|---|---|---|
| JPS57550A (en) * | 1980-06-03 | 1982-01-05 | Fujitsu Ltd | Identification systm for specimen |
| FR2514910A1 (en) * | 1981-10-19 | 1983-04-22 | Labo Electronique Physique | DEVICE FOR TREATING ECHOS IN ULTRASONIC ULTRASONOGRAPHIC MEDIA EXPLORATION APPARATUS AND MEDIUM EXPLORATION APPARATUS COMPRISING SUCH A TREATMENT DEVICE |
-
1982
- 1982-04-07 JP JP57057573A patent/JPS58173539A/en active Pending
-
1983
- 1983-03-30 US US06/480,589 patent/US4564019A/en not_active Ceased
- 1983-04-05 EP EP83301893A patent/EP0091768B1/en not_active Expired
- 1983-04-05 DE DE8383301893T patent/DE3380275D1/en not_active Expired
-
1987
- 1987-04-29 US US07/044,066 patent/USRE33672E/en not_active Expired - Fee Related
Also Published As
| Publication number | Publication date |
|---|---|
| USRE33672E (en) | 1991-08-27 |
| EP0091768A2 (en) | 1983-10-19 |
| EP0091768A3 (en) | 1985-06-26 |
| DE3380275D1 (en) | 1989-08-31 |
| US4564019A (en) | 1986-01-14 |
| JPS58173539A (en) | 1983-10-12 |
Similar Documents
| Publication | Publication Date | Title |
|---|---|---|
| EP0091768B1 (en) | Measuring characteristics of living tissues by ultrasonic waves | |
| EP0064399B1 (en) | Ultrasonic measuring method | |
| O'Donnell et al. | Internal displacement and strain imaging using ultrasonic speckle tracking | |
| EP0066343B2 (en) | Method and apparatus for measuring ultrasonic attenuation characteristics | |
| EP0154869B1 (en) | Ultrasonic measurement apparatus | |
| US4575799A (en) | Ultrasonic living body tissue characterization system | |
| EP0168565B1 (en) | Ultrasonic measurement method and apparatus therefor | |
| US5010885A (en) | Ultrasonic echograph with controllable phase coherence | |
| CN104013419B (en) | Adaptive acoustic pressure estimation in medical ultrasound wave | |
| EP0146707B1 (en) | Ultrasonic measurement method, and apparatus therefor | |
| EP0139235B1 (en) | Ultrasonic measurement method and apparatus therefor | |
| JPH0246213B2 (en) | ||
| EP3769690B1 (en) | Method for tissue characterization by ultrasound wave attenuation measurements and ultrasound system for tissue characterization | |
| US11397167B2 (en) | Local speed of sound estimation method for medical ultrasound | |
| US6293914B1 (en) | Ultrasonic system and method for measurement of fluid flow | |
| JPH0713631B2 (en) | Ultrasonic echographic inspection method and apparatus for medium | |
| Parker et al. | Comparison of techniques for in vivo attenuation measurements | |
| Mensah et al. | Enhanced compressibility tomography | |
| US20190231320A1 (en) | Ultrasonic shear wave imaging with background motion compensation | |
| JPS6238982B2 (en) | ||
| Jones et al. | In vivo characterization of several lesions in the eye using ultrasonic impediography | |
| Peters et al. | Compensation for receiver bandpass effects on ultrasonic backscatter power spectra using a random medium reference | |
| JPS62123354A (en) | Method and device for scanning body by ultrasonic echography | |
| JPS6083645A (en) | Ultrasonic tomographic measuring method and apparatus | |
| JPS60212150A (en) | Measurement of living body tissue characteristics by ultrasonic wave |
Legal Events
| Date | Code | Title | Description |
|---|---|---|---|
| PUAI | Public reference made under article 153(3) epc to a published international application that has entered the european phase |
Free format text: ORIGINAL CODE: 0009012 |
|
| AK | Designated contracting states |
Designated state(s): DE FR GB NL SE |
|
| PUAL | Search report despatched |
Free format text: ORIGINAL CODE: 0009013 |
|
| AK | Designated contracting states |
Designated state(s): DE FR GB NL SE |
|
| 17P | Request for examination filed |
Effective date: 19851125 |
|
| 17Q | First examination report despatched |
Effective date: 19871123 |
|
| GRAA | (expected) grant |
Free format text: ORIGINAL CODE: 0009210 |
|
| AK | Designated contracting states |
Kind code of ref document: B1 Designated state(s): DE FR GB NL SE |
|
| REF | Corresponds to: |
Ref document number: 3380275 Country of ref document: DE Date of ref document: 19890831 |
|
| ET | Fr: translation filed | ||
| PGFP | Annual fee paid to national office [announced via postgrant information from national office to epo] |
Ref country code: SE Payment date: 19900427 Year of fee payment: 8 |
|
| PGFP | Annual fee paid to national office [announced via postgrant information from national office to epo] |
Ref country code: NL Payment date: 19900430 Year of fee payment: 8 |
|
| PLBE | No opposition filed within time limit |
Free format text: ORIGINAL CODE: 0009261 |
|
| STAA | Information on the status of an ep patent application or granted ep patent |
Free format text: STATUS: NO OPPOSITION FILED WITHIN TIME LIMIT |
|
| 26N | No opposition filed | ||
| PG25 | Lapsed in a contracting state [announced via postgrant information from national office to epo] |
Ref country code: SE Effective date: 19910406 |
|
| PG25 | Lapsed in a contracting state [announced via postgrant information from national office to epo] |
Ref country code: NL Effective date: 19911101 |
|
| NLV4 | Nl: lapsed or anulled due to non-payment of the annual fee | ||
| PGFP | Annual fee paid to national office [announced via postgrant information from national office to epo] |
Ref country code: GB Payment date: 19930202 Year of fee payment: 11 |
|
| PGFP | Annual fee paid to national office [announced via postgrant information from national office to epo] |
Ref country code: FR Payment date: 19930429 Year of fee payment: 11 |
|
| PGFP | Annual fee paid to national office [announced via postgrant information from national office to epo] |
Ref country code: DE Payment date: 19930622 Year of fee payment: 11 |
|
| PG25 | Lapsed in a contracting state [announced via postgrant information from national office to epo] |
Ref country code: GB Effective date: 19940405 |
|
| GBPC | Gb: european patent ceased through non-payment of renewal fee |
Effective date: 19940405 |
|
| PG25 | Lapsed in a contracting state [announced via postgrant information from national office to epo] |
Ref country code: FR Effective date: 19941229 |
|
| PG25 | Lapsed in a contracting state [announced via postgrant information from national office to epo] |
Ref country code: DE Effective date: 19950103 |
|
| EUG | Se: european patent has lapsed |
Ref document number: 83301893.0 Effective date: 19911108 |
|
| REG | Reference to a national code |
Ref country code: FR Ref legal event code: ST |