CN108738338B - Method and apparatus for detecting interferents in a sample - Google Patents
Method and apparatus for detecting interferents in a sample Download PDFInfo
- Publication number
- CN108738338B CN108738338B CN201780008828.3A CN201780008828A CN108738338B CN 108738338 B CN108738338 B CN 108738338B CN 201780008828 A CN201780008828 A CN 201780008828A CN 108738338 B CN108738338 B CN 108738338B
- Authority
- CN
- China
- Prior art keywords
- sample
- serum
- interferent
- plasma fraction
- different
- Prior art date
- Legal status (The legal status is an assumption and is not a legal conclusion. Google has not performed a legal analysis and makes no representation as to the accuracy of the status listed.)
- Active
Links
- 238000000034 method Methods 0.000 title claims abstract description 81
- 210000002966 serum Anatomy 0.000 claims abstract description 102
- 238000001228 spectrum Methods 0.000 claims abstract description 55
- 238000012360 testing method Methods 0.000 claims abstract description 55
- 206010018910 Haemolysis Diseases 0.000 claims description 46
- 230000008588 hemolysis Effects 0.000 claims description 46
- 239000008280 blood Substances 0.000 claims description 41
- 210000004369 blood Anatomy 0.000 claims description 40
- 206010023126 Jaundice Diseases 0.000 claims description 36
- 238000007689 inspection Methods 0.000 claims description 30
- 238000012706 support-vector machine Methods 0.000 claims description 22
- 230000008569 process Effects 0.000 claims description 16
- 238000012549 training Methods 0.000 claims description 12
- 238000005119 centrifugation Methods 0.000 claims description 9
- 238000003066 decision tree Methods 0.000 claims description 5
- 210000002381 plasma Anatomy 0.000 description 89
- 238000001514 detection method Methods 0.000 description 38
- 238000004458 analytical method Methods 0.000 description 24
- 239000007788 liquid Substances 0.000 description 22
- 238000012545 processing Methods 0.000 description 19
- 238000012512 characterization method Methods 0.000 description 14
- 238000005286 illumination Methods 0.000 description 14
- BPYKTIZUTYGOLE-IFADSCNNSA-N Bilirubin Chemical compound N1C(=O)C(C)=C(C=C)\C1=C\C1=C(C)C(CCC(O)=O)=C(CC2=C(C(C)=C(\C=C/3C(=C(C=C)C(=O)N\3)C)N2)CCC(O)=O)N1 BPYKTIZUTYGOLE-IFADSCNNSA-N 0.000 description 10
- 238000003556 assay Methods 0.000 description 10
- 230000000875 corresponding effect Effects 0.000 description 10
- 230000011218 segmentation Effects 0.000 description 10
- 239000012530 fluid Substances 0.000 description 8
- 210000003743 erythrocyte Anatomy 0.000 description 7
- 230000010354 integration Effects 0.000 description 7
- 238000013145 classification model Methods 0.000 description 6
- 238000010586 diagram Methods 0.000 description 6
- 230000001747 exhibiting effect Effects 0.000 description 6
- 238000005194 fractionation Methods 0.000 description 6
- 230000009467 reduction Effects 0.000 description 6
- 239000003086 colorant Substances 0.000 description 5
- 239000006260 foam Substances 0.000 description 5
- 230000001000 lipidemic effect Effects 0.000 description 5
- 238000011002 quantification Methods 0.000 description 5
- 239000000470 constituent Substances 0.000 description 4
- 238000000025 interference lithography Methods 0.000 description 4
- 238000005259 measurement Methods 0.000 description 4
- 230000007246 mechanism Effects 0.000 description 4
- 238000012986 modification Methods 0.000 description 4
- 230000004048 modification Effects 0.000 description 4
- 238000002360 preparation method Methods 0.000 description 4
- 238000012216 screening Methods 0.000 description 4
- 102000001554 Hemoglobins Human genes 0.000 description 3
- 108010054147 Hemoglobins Proteins 0.000 description 3
- 239000000654 additive Substances 0.000 description 3
- 230000002411 adverse Effects 0.000 description 3
- 239000012491 analyte Substances 0.000 description 3
- 238000013096 assay test Methods 0.000 description 3
- 238000004422 calculation algorithm Methods 0.000 description 3
- 239000000969 carrier Substances 0.000 description 3
- 201000010099 disease Diseases 0.000 description 3
- 208000037265 diseases, disorders, signs and symptoms Diseases 0.000 description 3
- 230000002949 hemolytic effect Effects 0.000 description 3
- 238000003018 immunoassay Methods 0.000 description 3
- 150000002632 lipids Chemical class 0.000 description 3
- 238000005067 remediation Methods 0.000 description 3
- 238000000926 separation method Methods 0.000 description 3
- 102000004190 Enzymes Human genes 0.000 description 2
- 108090000790 Enzymes Proteins 0.000 description 2
- 238000010521 absorption reaction Methods 0.000 description 2
- 230000000996 additive effect Effects 0.000 description 2
- 238000013459 approach Methods 0.000 description 2
- 238000013528 artificial neural network Methods 0.000 description 2
- 210000001772 blood platelet Anatomy 0.000 description 2
- 238000006243 chemical reaction Methods 0.000 description 2
- 239000003153 chemical reaction reagent Substances 0.000 description 2
- 239000002131 composite material Substances 0.000 description 2
- 238000002845 discoloration Methods 0.000 description 2
- 238000011156 evaluation Methods 0.000 description 2
- 239000000284 extract Substances 0.000 description 2
- 238000000605 extraction Methods 0.000 description 2
- 230000006870 function Effects 0.000 description 2
- 230000002452 interceptive effect Effects 0.000 description 2
- 210000000265 leukocyte Anatomy 0.000 description 2
- 238000013507 mapping Methods 0.000 description 2
- 239000000463 material Substances 0.000 description 2
- 230000003595 spectral effect Effects 0.000 description 2
- 239000013598 vector Substances 0.000 description 2
- 238000011179 visual inspection Methods 0.000 description 2
- YYYARFHFWYKNLF-UHFFFAOYSA-N 4-[(2,4-dimethylphenyl)diazenyl]-3-hydroxynaphthalene-2,7-disulfonic acid Chemical compound CC1=CC(C)=CC=C1N=NC1=C(O)C(S(O)(=O)=O)=CC2=CC(S(O)(=O)=O)=CC=C12 YYYARFHFWYKNLF-UHFFFAOYSA-N 0.000 description 1
- 238000012935 Averaging Methods 0.000 description 1
- 102000008946 Fibrinogen Human genes 0.000 description 1
- 108010049003 Fibrinogen Proteins 0.000 description 1
- 240000001973 Ficus microcarpa Species 0.000 description 1
- 239000006125 LAS system Substances 0.000 description 1
- ZLMJMSJWJFRBEC-UHFFFAOYSA-N Potassium Chemical compound [K] ZLMJMSJWJFRBEC-UHFFFAOYSA-N 0.000 description 1
- 238000009825 accumulation Methods 0.000 description 1
- 230000009471 action Effects 0.000 description 1
- 230000003044 adaptive effect Effects 0.000 description 1
- 238000003491 array Methods 0.000 description 1
- 230000000712 assembly Effects 0.000 description 1
- 238000000429 assembly Methods 0.000 description 1
- 230000004888 barrier function Effects 0.000 description 1
- 230000009286 beneficial effect Effects 0.000 description 1
- 230000008901 benefit Effects 0.000 description 1
- 239000003809 bile pigment Substances 0.000 description 1
- 210000000601 blood cell Anatomy 0.000 description 1
- 230000006037 cell lysis Effects 0.000 description 1
- 210000001175 cerebrospinal fluid Anatomy 0.000 description 1
- 230000008859 change Effects 0.000 description 1
- 238000013098 chemical test method Methods 0.000 description 1
- 238000010224 classification analysis Methods 0.000 description 1
- 238000005345 coagulation Methods 0.000 description 1
- 230000015271 coagulation Effects 0.000 description 1
- 238000004891 communication Methods 0.000 description 1
- 230000003750 conditioning effect Effects 0.000 description 1
- 230000001276 controlling effect Effects 0.000 description 1
- 230000002596 correlated effect Effects 0.000 description 1
- 230000007547 defect Effects 0.000 description 1
- 230000001934 delay Effects 0.000 description 1
- 230000009977 dual effect Effects 0.000 description 1
- 230000000694 effects Effects 0.000 description 1
- 238000005516 engineering process Methods 0.000 description 1
- 238000012854 evaluation process Methods 0.000 description 1
- 210000003722 extracellular fluid Anatomy 0.000 description 1
- 229940012952 fibrinogen Drugs 0.000 description 1
- 230000004927 fusion Effects 0.000 description 1
- 239000011521 glass Substances 0.000 description 1
- 208000036796 hyperbilirubinemia Diseases 0.000 description 1
- 238000003384 imaging method Methods 0.000 description 1
- 230000006872 improvement Effects 0.000 description 1
- 230000003993 interaction Effects 0.000 description 1
- 238000007477 logistic regression Methods 0.000 description 1
- 238000010801 machine learning Methods 0.000 description 1
- 239000011159 matrix material Substances 0.000 description 1
- 238000011326 mechanical measurement Methods 0.000 description 1
- 239000000203 mixture Substances 0.000 description 1
- 238000010606 normalization Methods 0.000 description 1
- 230000003287 optical effect Effects 0.000 description 1
- 230000000704 physical effect Effects 0.000 description 1
- 229910052700 potassium Inorganic materials 0.000 description 1
- 239000011591 potassium Substances 0.000 description 1
- 238000013139 quantization Methods 0.000 description 1
- 230000005855 radiation Effects 0.000 description 1
- 238000007637 random forest analysis Methods 0.000 description 1
- 238000000611 regression analysis Methods 0.000 description 1
- 230000000246 remedial effect Effects 0.000 description 1
- 230000004044 response Effects 0.000 description 1
- 239000002904 solvent Substances 0.000 description 1
- 210000000952 spleen Anatomy 0.000 description 1
- 238000007619 statistical method Methods 0.000 description 1
- 239000000126 substance Substances 0.000 description 1
- 238000004448 titration Methods 0.000 description 1
- 238000002834 transmittance Methods 0.000 description 1
- 230000001960 triggered effect Effects 0.000 description 1
- 210000002700 urine Anatomy 0.000 description 1
- 230000000007 visual effect Effects 0.000 description 1
Images


Classifications
-
- G—PHYSICS
- G01—MEASURING; TESTING
- G01N—INVESTIGATING OR ANALYSING MATERIALS BY DETERMINING THEIR CHEMICAL OR PHYSICAL PROPERTIES
- G01N33/00—Investigating or analysing materials by specific methods not covered by groups G01N1/00 - G01N31/00
- G01N33/48—Biological material, e.g. blood, urine; Haemocytometers
- G01N33/483—Physical analysis of biological material
- G01N33/487—Physical analysis of biological material of liquid biological material
- G01N33/49—Blood
- G01N33/491—Blood by separating the blood components
-
- G—PHYSICS
- G01—MEASURING; TESTING
- G01N—INVESTIGATING OR ANALYSING MATERIALS BY DETERMINING THEIR CHEMICAL OR PHYSICAL PROPERTIES
- G01N21/00—Investigating or analysing materials by the use of optical means, i.e. using sub-millimetre waves, infrared, visible or ultraviolet light
- G01N21/17—Systems in which incident light is modified in accordance with the properties of the material investigated
- G01N21/25—Colour; Spectral properties, i.e. comparison of effect of material on the light at two or more different wavelengths or wavelength bands
- G01N21/251—Colorimeters; Construction thereof
-
- G—PHYSICS
- G01—MEASURING; TESTING
- G01N—INVESTIGATING OR ANALYSING MATERIALS BY DETERMINING THEIR CHEMICAL OR PHYSICAL PROPERTIES
- G01N21/00—Investigating or analysing materials by the use of optical means, i.e. using sub-millimetre waves, infrared, visible or ultraviolet light
- G01N21/17—Systems in which incident light is modified in accordance with the properties of the material investigated
- G01N21/25—Colour; Spectral properties, i.e. comparison of effect of material on the light at two or more different wavelengths or wavelength bands
- G01N21/31—Investigating relative effect of material at wavelengths characteristic of specific elements or molecules, e.g. atomic absorption spectrometry
- G01N21/314—Investigating relative effect of material at wavelengths characteristic of specific elements or molecules, e.g. atomic absorption spectrometry with comparison of measurements at specific and non-specific wavelengths
-
- G—PHYSICS
- G01—MEASURING; TESTING
- G01N—INVESTIGATING OR ANALYSING MATERIALS BY DETERMINING THEIR CHEMICAL OR PHYSICAL PROPERTIES
- G01N33/00—Investigating or analysing materials by specific methods not covered by groups G01N1/00 - G01N31/00
- G01N33/48—Biological material, e.g. blood, urine; Haemocytometers
- G01N33/483—Physical analysis of biological material
- G01N33/487—Physical analysis of biological material of liquid biological material
- G01N33/49—Blood
- G01N33/492—Determining multiple analytes
-
- G—PHYSICS
- G06—COMPUTING; CALCULATING OR COUNTING
- G06T—IMAGE DATA PROCESSING OR GENERATION, IN GENERAL
- G06T7/00—Image analysis
- G06T7/0002—Inspection of images, e.g. flaw detection
- G06T7/0012—Biomedical image inspection
-
- G—PHYSICS
- G01—MEASURING; TESTING
- G01N—INVESTIGATING OR ANALYSING MATERIALS BY DETERMINING THEIR CHEMICAL OR PHYSICAL PROPERTIES
- G01N2201/00—Features of devices classified in G01N21/00
- G01N2201/12—Circuits of general importance; Signal processing
- G01N2201/129—Using chemometrical methods
- G01N2201/1293—Using chemometrical methods resolving multicomponent spectra
-
- G—PHYSICS
- G06—COMPUTING; CALCULATING OR COUNTING
- G06T—IMAGE DATA PROCESSING OR GENERATION, IN GENERAL
- G06T2207/00—Indexing scheme for image analysis or image enhancement
- G06T2207/10—Image acquisition modality
- G06T2207/10024—Color image
-
- G—PHYSICS
- G06—COMPUTING; CALCULATING OR COUNTING
- G06T—IMAGE DATA PROCESSING OR GENERATION, IN GENERAL
- G06T2207/00—Indexing scheme for image analysis or image enhancement
- G06T2207/10—Image acquisition modality
- G06T2207/10048—Infrared image
-
- G—PHYSICS
- G06—COMPUTING; CALCULATING OR COUNTING
- G06T—IMAGE DATA PROCESSING OR GENERATION, IN GENERAL
- G06T2207/00—Indexing scheme for image analysis or image enhancement
- G06T2207/20—Special algorithmic details
- G06T2207/20076—Probabilistic image processing
-
- G—PHYSICS
- G06—COMPUTING; CALCULATING OR COUNTING
- G06T—IMAGE DATA PROCESSING OR GENERATION, IN GENERAL
- G06T2207/00—Indexing scheme for image analysis or image enhancement
- G06T2207/20—Special algorithmic details
- G06T2207/20081—Training; Learning
Abstract
A model-based method of inspecting a sample for the presence of interferents (H, I and/or L). The method comprises the following steps: capturing images of the sample at a plurality of different exposure times and at a plurality of spectra having different nominal wavelengths; selecting optimal exposure pixels from the captured image to generate optimal exposure image data for each spectrum; identifying a serum or plasma fraction of the sample; and classifying whether the interferent is present or absent from the serum or plasma fraction. As other aspects, a testing device and a quality check module adapted to perform the method are described.
Description
RELATED APPLICATIONS
The present application claims priority to U.S. provisional patent application serial No. 62/288,375, entitled "METHODS AND APPARATUS FOR detecting interferents in a sample," filed on 28.1.2016, the disclosure of which is hereby incorporated by reference in its entirety.
Technical Field
The present invention relates to methods and devices for testing samples, and more particularly to methods and devices for determining the presence of interferents, such as hemolysis, jaundice, or lipemia (HIL), in a sample.
Background
Clinical chemistry or assay tests may be performed using an automated testing system in which one or more reagents are used to identify analytes or other constituents in a sample such as urine, serum, plasma, interstitial fluid, cerebrospinal fluid, and the like. For convenience and safety reasons, these samples may be contained in a sample container (e.g., a sample collection tube). The assay or test reaction produces a variety of changes that can be read and/or manipulated to determine the concentration of the analyte or other constituent present in the sample.
Improvements in automated testing technology are accompanied by corresponding advances in pre-analysis sample preparation and handling operations, such as sorting, batch preparation, processing of sample containers with centrifuges to separate sample components, decapping to facilitate sample utilization, etc., by automated pre-analysis sample preparation systems, which may be part of a Laboratory Automation System (LAS). The LAS may automatically transport the samples in the sample containers to a plurality of pre-analysis sample processing stations and to an analyzer station containing a clinical chemistry analyzer and/or an assay instrument.
These LAS may handle the processing of multiple different samples simultaneously, which may be contained in barcode labeled sample containers. The barcode label may contain an access number that may be correlated with demographic information that may be entered into a hospital's Laboratory Information System (LIS) along with test orders (test orders) and/or other information. The operator may place the labeled sample container onto the LAS system, which may automatically route the sample container for pre-analysis operations, such as centrifugation, decapping, and aliquot preparation, all prior to the sample actually undergoing clinical analysis or assay by one or more analyzers (clinical chemistry or assay instruments) that may be part of the LAS.
For certain tests, such as for the detection of interferents such as hemolysis, jaundice, and lipemia (hereinafter collectively referred to as "HIL"), a serum or plasma fraction obtained from whole blood by fractionation (e.g., by centrifugation) may be used. In some cases, a gel separator (gel separator) may be added to the sample container to assist in the separation of the settled blood fraction from the serum or plasma fraction. After fractionation and subsequent decapping processes, in some embodiments, the sample container can be transported to a suitable analyzer that can extract the serum or plasma portion from the sample container via aspiration and mix the serum or plasma portion with one or more reagents in a reaction vessel (e.g., a cuvette or other vessel). Analytical measurements can then be performed, for example, often using an interrogating radiation beam or by using photometric or fluorometric absorption readings or the like. The measurement allows for determination of a titration endpoint or rate value from which the concentration of the analyte or other constituent may be determined using well known techniques.
Unfortunately, due to patient condition or sample handling, the presence of interferents (e.g., H, I and/or L) in the sample may adversely affect the test results of the analyte or constituent measurements obtained from the analyzer. For example, the presence of hemolysis in a sample (which may be unrelated to a patient's disease state) may lead to a different interpretation of the patient's disease condition. Furthermore, the presence of jaundice and/or lipemia in a sample may also lead to a different interpretation of the patient's disease condition.
In the prior art, the integrity of the serum or plasma portion of a sample can be visually inspected by a skilled laboratory technician and the degree (e.g., index) of HIL assessed. This may involve examining the color of the serum or plasma portion of the sample against known standards. Normal serum or plasma fractions have a pale yellow to light amber color. The serum or plasma fraction containing hemolysis may have a reddish color. The jaundice-containing serum or plasma fraction may have a deep yellow color due to increased bilirubin, and the lipemic-containing serum or plasma fraction may have a whitish or milky (milky) appearance. However, such visual inspection is very subjective, labor intensive, and fraught with the possibility of human error.
Because manual inspection includes the problems listed above, it is becoming increasingly important not to use visual inspection by a laboratory technician, but to assess the integrity of the sample by using automated inspection methods. However, in some cases, a bar code label directly adhered to the sample container may partially obscure the view of the sample, such that there may be no clear opportunity to visually observe the serum or plasma fraction. Therefore, automation is difficult.
To accommodate this, some systems (such as those described in U.S. patent No. 9,322,761 to Miller) describe automated pre-screening for HIL by rotating the sample container to find a window that is not obscured by a label. However, such systems may not be easily automated.
Because of the problems encountered when hemolysis, jaundice, or lipemia (HIL) is contained within a sample to be analyzed, there is an unmet need for methods and devices suitable for easily determining the presence and possibly extent of HIL. The method and apparatus should not significantly adversely affect the speed at which analytical or assay test results are obtained, i.e., the time to determine the presence of HIL should be very short. Furthermore, the method and apparatus should even be able to be used on labeled sample containers where the label blocks a certain portion of the sample.
Disclosure of Invention
According to a first aspect, a method of determining a perturber in a sample contained in a sample container is provided. The method comprises the following steps: providing a sample contained in a sample container, capturing images of the sample at a plurality of different exposure times and at a plurality of spectra having different nominal wavelengths, selecting optimal exposure pixels at each spectrum from the images captured at the different exposure times to generate optimal exposure image data for each spectrum, classifying a serum or plasma portion of the sample, and determining whether an interferent is present or absent from the serum or plasma portion.
According to another aspect, a quality inspection module is provided, which is adapted to determine the presence of a disturbing object in a sample contained in a sample container. The quality inspection module comprises a plurality of cameras arranged around the sample container and configured to capture a plurality of images of the sample at a plurality of different exposure times and a plurality of spectra having different nominal wavelengths and from a plurality of viewpoints, and a computer coupled to the plurality of cameras and adapted to process image data of the plurality of images, the computer configured and operable to: selecting, for each spectrum, an optimal exposure pixel from the plurality of images at the different exposure times and generating optimal exposure image data for each spectrum, classifying a serum or plasma portion of the sample, and classifying whether an interferent is present or absent within the serum or plasma portion.
In another aspect, a sample testing device adapted to determine the presence of an interferent in a sample contained within a sample container is provided. The sample testing device includes: a track; a carrier movable on the track and configured to receive the sample container; a plurality of cameras arranged around the track and configured to capture a plurality of images of the sample at a plurality of different exposure times and a plurality of spectra having different nominal wavelengths and from a plurality of viewpoints; and a computer coupled to the plurality of cameras and configured to process image data from the plurality of images, the computer configured and operable to: selecting optimal exposure pixels from the plurality of images at the different exposure times and spectra to generate optimal exposure image data for each spectrum, classifying a serum or plasma portion of the sample, and classifying whether an interferent is present or absent within the serum or plasma portion.
Still other aspects, features and advantages of the present invention may be readily apparent from the following description by illustrating a number of example embodiments and implementations, including the best mode contemplated for carrying out the invention. The invention is also capable of other and different embodiments and its several details are capable of modification in various respects, all without departing from the scope of the present invention. The intention is to cover all modifications, equivalents, and alternatives falling within the scope of the appended claims.
Drawings
The drawings described below are for illustrative purposes only and are not necessarily drawn to scale. Accordingly, the drawings and description are to be regarded as illustrative in nature, and not as restrictive. The drawings are not intended to limit the scope of the present invention in any way.
FIG. 1 illustrates a top view of a sample testing device including one or more quality check modules and one or more analyzers (clinical chemistry or assay instruments) in accordance with one or more embodiments.
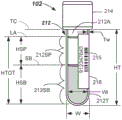
Fig. 2 illustrates a side view of a labeled sample container including an isolated sample containing an interferent that may be determined using an interferent detection method according to one or more embodiments.
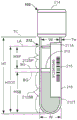
Fig. 3 illustrates a side view of a labeled sample container comprising a separated sample comprising an interferent and a gel separator, wherein the presence of the interferent may be determined using an interferent detection method according to one or more embodiments.
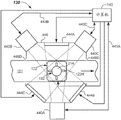
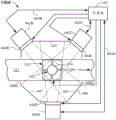
Fig. 4A illustrates a schematic top view of a quality inspection module (with the top plate removed) configured to capture and analyze multiple images for the presence of interferent in a sample, in accordance with one or more embodiments.
Fig. 4B illustrates a schematic side view of the quality inspection module of fig. 4A (with the side panel removed) in accordance with one or more embodiments.
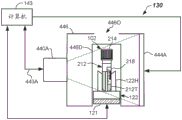
Fig. 4C illustrates a schematic top view of a quality inspection module (with the top plate removed) configured to capture and analyze multiple images for the presence of interferent, in accordance with one or more embodiments.
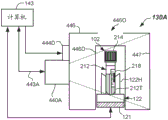
Fig. 4D illustrates a schematic side view of the quality inspection module of fig. 4C (with the side panel removed) in accordance with one or more embodiments.
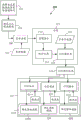
Fig. 5 illustrates a block diagram of components of a quality check module configured to determine the presence of an interferent in a sample, in accordance with one or more embodiments.
FIG. 6 illustrates a general block diagram of components of a sample testing device having the ability to determine the presence of interferents in a sample and the ability to detect characteristics or quantify the sample or sample container, according to one or more embodiments.
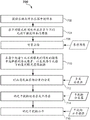
Fig. 7 is a flow diagram of a method of determining the presence of an interferent in a sample in accordance with one or more embodiments.
Detailed Description
In a first broad aspect, embodiments of the invention provide methods and devices configured to determine whether one or more interferents are present in a serum or plasma portion of a sample, or whether the serum or plasma portion is normal (i.e., contains no interferents). As used herein, "interferent" shall mean the presence of at least one of hemolysis (H), jaundice (I), or lipemia (L) in a serum or plasma fraction of a sample. Hemolysis (H), jaundice (I), and lipemia (L) are collectively referred to herein as HIL.
As used herein, "hemolysis" is defined as the following conditions in a serum or plasma fraction: wherein the red blood cells are destroyed, resulting in the release of hemoglobin from within the red blood cells into the serum or plasma fraction, thereby causing the serum or plasma fraction to assume a reddish hue.
As used herein, "jaundice" means the following condition of the blood: wherein the serum or plasma fraction is discolored to a deep yellow color due to the accumulation of bile pigments (bilirubin) in the blood.
"lipemia" as used herein means the presence of abnormally high concentrations of emulsified fat in the blood, such that the serum or plasma fraction includes a whitish or milky appearance.
The presence of one or more interferents (HILs) in the serum or plasma fractions may affect the interpretation of the results of subsequent tests (e.g., clinical chemistry or assay tests) on the analyzer. Thus, the ability to pre-screen HILs prior to final analysis can minimize the time wasted analyzing samples that do not have the quality suitable for analysis. Samples found to contain one or more of the HILs may be marked to the operator, scheduled for re-extraction, subjected to remediation, or subjected to further testing to more accurately measure the extent of the interferent present.
As described herein, a sample is typically collected in a sample container (such as a blood collection tube) and, after fractionation (e.g., separation by centrifugation), includes a settled blood fraction as well as serum and plasma fractions. The settled blood fraction consists of blood cells such as white blood cells (leukocytes), red blood cells (erythrocytes) and platelets (thrombocytes), which are aggregated and separated from the serum or plasma fraction. The settled blood fraction is generally found at the bottom of the sample container. The serum or plasma fraction is the liquid component of the blood, which is not part of the settled blood fraction. It is generally found above the settled blood fraction after fractionation. Plasma and serum differ in the content of coagulation components, mainly fibrinogen. Plasma is an uncoagulated liquid, while serum refers to blood plasma that has been allowed to clot under the influence of endogenous enzymes or exogenous components. In some sample containers, a small gel separator may be used, which places itself between the settled blood fraction and the serum or plasma fraction during centrifugation. The gel separator acts as a physical barrier between the two parts.
In accordance with one or more embodiments, the interferent detection method may be performed as a pre-analytical test method, i.e., prior to performing an analysis on an analyzer (e.g., a clinical chemistry or assay instrument). The HIL detection methods described herein can use High Dynamic Range (HDR) image processing of serum or plasma portions of a sample to determine the presence of interferents (H, I and/or L). In some embodiments, identification of the physical boundaries of the serum or plasma portion may also be done by using HDR image processing.
In some embodiments, the quality check module may be configured to perform the interferent detection method. The quality check module may be disposed in an area that: wherein a robotic mechanism (e.g., a track or gripper-finger robot) can deliver the samples contained in the sample containers to the quality inspection module. In some embodiments, the quality inspection module may be disposed on a track, wherein the track carries the sample to a remote location for analysis (e.g., clinical chemical testing or assays) on the analyzer. In particular embodiments, the quality inspection module may be disposed on the track such that the specimen may be tested for the presence of an interfering object while the specimen resides on the track.
In one or more embodiments, the processed HDR data may be used for HIL detection. In another embodiment, HDR data may also be used for artifact detection (e.g., detection of clots, bubbles, or bubbles in serum or plasma portions). In this case, when performing HIL determination based on the processed HDR data, pixels found to contain artifacts may simply be ignored, since the artifact location(s) and extent are now known. If the sample is found to contain one or more of H, I and L, the sample can be taken off line for remediation to correct one or more of H, I or L, further quantify the degree of HIL, re-extract, or otherwise process. The interferent detection method is image based, i.e. based on pixilated images obtained by a plurality of digital cameras at a plurality of viewpoints. "pixel" as used herein means a single pixel or group of pixels, such as a super pixel. It has been found that a super pixel having a size of 11 individual pixels by 11 individual pixels works well for processing data.
In another related aspect of the invention, the data obtained from the HIL analysis may be used to determine the volume of the serum or plasma fraction, and possibly also the volume of the settled blood fraction. The data may also be used to determine the liquid-air interface (LA), the interface between the serum or plasma fraction and the settled blood fraction (SB), the interface between the serum or plasma fraction and the gel Separator (SG) and/or the interface between the settled blood fraction and the gel separator (BG).
A HIL detection method including HDR data processing may include capturing multiple images at a quality inspection module at multiple exposure times and under multiple spectra with different nominal wavelengths and also using multiple cameras from multiple viewpoints. "Camera" as used herein means any device capable of capturing a pixelated image (e.g., a digital image) for analysis. The exposure time may vary based on the illumination intensity and camera characteristics, but multiple exposure times may be used for each spectrum and for each camera. For each camera, the exposure time may be the same for each corresponding image capture.
For each corresponding pixel in the plurality of images at a particular wavelength, a pixel exhibiting an optimal image intensity may be selected. The result is a plurality of sets of image data of integrated colors, e.g., one set of image data per spectrum, for each different spectrum (e.g., red, green, blue, near infrared, infrared) in which all pixels are optimally exposed. The data from the integrated color dataset may undergo statistical analysis to determine statistical data (e.g., mean, standard deviation, and covariance matrix) for each of its pixels. Covariance is a measure of how much two or more of the color pixels change together. The statistical data in the form of one or more data matrices may then be operated on by one or more multi-class classifiers to segment the image dataset into classes.
In some embodiments, HDR data may be passed through a multi-class classifier to additionally determine regions of serum or plasma fractions and other classes (e.g., settled blood fractions, gel separators, tubes, caps, labels, air) in an image. The multi-class classifier may be a Support Vector Machine (SVM) or a random decision tree that has been pre-trained according to multiple training sets. Once the serum or plasma fraction is identified by the multi-class classifier, the presence of interferents (e.g., H, I and/or L) may be identified using one or more interferent classifiers. The one or more interferent classifiers may be individually trained bigrams, which may classify each pixel as H, I or L, respectively. In other embodiments, the interferent classifier may be a multi-class classifier. The interferent classifier models may each also be Support Vector Machines (SVMs) or random decision trees.
Based on the interferent classification results, the interferent type (i.e., H, I and/or L) of the serum or plasma fraction as a whole may be determined. An interferent level for the determined interferent type(s) may also optionally be provided. In some embodiments, the level of the interferent may be based on one or more additional models (e.g., one or more regression models). Regression models can be trained for each interferent type based on sample samples exhibiting differing levels of interferent. More than one interferent type may be determined by the method, and thus the level of interferent for each determined interferent type may be specified.
Further details of the inventive interferent detection method, quality check module and sample testing device comprising the quality check module will be further described herein with reference to fig. 1-7.
Fig. 1 illustrates a sample testing device 100 capable of automatically processing a plurality of sample containers 102 (e.g., sample collection tubes, see fig. 2 and 3). The sample containers 102 may be contained in one or more racks 104 at the loading zone 105 prior to being transported to and analyzed by one or more analyzers (e.g., first, second, and third analyzers 106, 108, 110, respectively, disposed about the sample testing device 100). It should be apparent that a greater or lesser number of analyzers may be used. The analyzer may be any combination of clinical chemistry analyzer and/or assay instrument, etc. The specimen container 102 may be any generally transparent or translucent container, such as a blood collection tube, test tube, specimen cup, cuvette, or other generally clear glass or plastic container.
In general, a sample 212 (fig. 2 and 3) to be processed automatically may be provided to the sample testing device 100 in a sample container 102, and the sample container 102 may be covered with a lid 214 (fig. 2 and 3, otherwise referred to as a stopper). The lid 214 may have different shapes and/or colors (e.g., red, blue, light blue, green, gray, tan, yellow, or a combination of colors) that may have meaning in terms of the test, the type of additive, etc. that the sample container 102 is used for. Other lid colors may be used.
Each sample container 102 may be provided with identification information 215 (i.e., indicia), such as a bar code, letter, number, alphanumeric, or combination thereof, that may be machine readable at various locations around the sample testing device 100. The identification information 215 may be indicated via a Laboratory Information System (LIS) or may otherwise correlate, for example, an identification of the patient and the test or other information to be achieved on the sample 212. Such identification information 215 may generally be disposed on a label 218, with the label 218 being adhered or otherwise disposed on the side of the sample container 102. The label 218 generally does not extend completely around the sample container 102 or all the way along the length of the sample container 102. In some embodiments, multiple labels may be adhered, and the multiple labels may overlap slightly. Thus, although the label 218 may block certain portions of the specimen 212, certain portions of the specimen 212 may still be visible. In some embodiments, the rack 104 may have additional identification information thereon.
In the case of using the gel separator 313 (fig. 3), the height of the serum or plasma fraction 212SP is (HSP) and is defined as the height from the top of the serum or plasma fraction 212SP at LA to the top of the gel separator 313 at SG (i.e., from LA to SG in fig. 3). The height of the settled blood fraction 212SB is (HSB) and is defined as the height from the bottom of the settled blood fraction 212SB to the bottom of the gel separator 313 at BG in fig. 3. HTOT is the total height of sample 212 and is equal to HSP plus HSB plus the height of gel separator 313. In each case, the wall thickness is Tw, the outer width is W, and the inner width of sample container 102 is Wi.
In more detail, the sample testing device 100 may include a base 120 (e.g., a frame or other structure) and the track 121 may be mounted on the base 120. The track 121 may be a tracked track (e.g., single or multiple tracks), a collection of conveyor belts, a conveyor chain, a movable platform, or any other suitable type of conveying mechanism. In some embodiments, the track 121 may be circular or any other suitable shape, and may be a closed track (e.g., an endless track). In operation, the track 121 may transport individual ones of the sample containers 102 in the carrier 122 to locations spaced around the track 121.
The carrier 122 may be a passive device, i.e., a motorless puck (puck) that may be configured to carry individual sample containers 102 on the track 121, or an automated carrier that includes an on-board drive motor, such as a linear motor, that is programmed or otherwise controlled to move around the track 121 and stop at a pre-programmed location. The carriers 122 may each include a holder 122H (fig. 4A-4D) configured to hold the sample container 102 in a defined upright position. Holder 122H may include a plurality of fingers or leaves that secure sample containers 102 in carrier 122, but may be movable or flexible to allow different sized sample containers 102 to be received therein. In some embodiments, the carrier 122 may exit from the loading zone 105, the loading zone 105 having one or more racks 104 segmented thereat. In some embodiments, loading zone 105 may serve a dual function of allowing sample containers 102 to be unloaded from carrier 122 after analysis is complete.
A robot 124 may be disposed at the loading zone 105 and may be configured to grasp sample containers 102 from one or more racks 104 and load the sample containers 102 onto the carriers 122 on an input lane, such as a track 121. The robot 124 may also be configured to remove the sample container 102 from the carrier 122 upon completion of the test. The robot 124 includes one or more (e.g., at least two) robotic arms or assemblies capable of X and Z, Y and Z, X, Y and Z, or r and θ motion. Robot 124 may be an overhead robot, an articulated robot, an R-theta robot, or other suitable robot, where robot 124 may be equipped with robot gripper fingers sized to pick and place sample containers 102. After being loaded onto track 121, sample containers 102 carried by carriers 122 may proceed to a centrifuge 125 (e.g., an automated centrifuge configured to perform fractionation of samples 212). The carrier 122 carrying the sample container 102 may be transferred to a centrifuge 125 via an inflow channel 126 or other suitable robot. After centrifugation, the sample container 102 may exit on the outflow channel 128 or otherwise be removed by the robot and continue on the track 121. In the depicted embodiment, the sample containers 102 in the carrier 122 may then be transported to a quality check module 130 to be further described herein with reference to fig. 4A and 4D.
The quality check module 130 is configured and adapted to automatically determine the presence of one or more of H, I and/or L contained in the sample 212 to be processed by the sample testing device 100. If it is found that in fact a low amount of H, I and/or L is contained and thus considered normal (N), the sample 212 may continue on track 121 and may then be analyzed in one or more analyzers (e.g., first, second, and third analyzers 106, 108, and/or 110) before returning each sample container 102 to the loading zone 105 for unloading. In some embodiments, the sample 212 may also be tested for the presence of artifacts (e.g., clots, bubbles, or foam) at the quality check module 130. In some embodiments, the quantification of the sample 212 (i.e., determination of HSP, HSB, HTOT and determination of SB, LA locations) may be performed at the quality check module 130. In some embodiments, quantification of the physical properties of the sample container 102 may be performed at the quality check module 130, such as determining HT, lid color, lid type, TC, and tube width (W).
Additionally, the remote station 132 may be provided on the automated sample testing device 100 even if the remote station 132 is not directly linked to the track 121. For example, a separate robot 133 (shown in phantom) may carry the sample containers 102 containing the samples 212 to the remote station 132 and return them after testing/processing. Alternatively, the sample container 102 may be manually removed and returned. The remote station 132 may be used to test certain components (such as hemolysis level) or may be used for further processing, such as reducing the level of lipemia or removing clots, bubbles, or foam, for example, by one or more additives. Other tests or processes may be implemented at the remote station 132. Other stations (not shown), such as decapping stations and the like, may be provided or arranged along the track 121.
The sample testing device 100 can include a plurality of sensors 116 at one or more locations around the track 121. The sensor 116 may be used to detect the position of the sample container 102 along the track 121 by means of reading identification information 215 (fig. 2) placed on the sample container 102 or similar information (not shown) provided on each carrier 122. In some embodiments, a different RFID chip may be embedded in each carrier 122, and a conventional RFID reader system may be employed in, for example, tracking operations. Other means for tracking the position of the sample container 102 in the carrier 122 may be used, such as proximity sensors. All sensors 116 may interface with the computer 143 so that the location of each sample container 102 may always be known correctly.
The centrifuge 125 and each of the analyzers 106, 108, 110 may generally be equipped with a robotic mechanism and/or inflow channel (e.g., inflow channels 126, 134, 138, 144) configured to remove the carrier 122 from the track 121, and a robotic mechanism and/or outflow channel (e.g., outflow channels 128, 136, 141, and 146) configured to re-enter the carrier 122 into the track 121.
The sample testing device 100 may be controlled by a computer 143, which computer 143 may be a microprocessor-based central processing unit CPU with suitable memory and suitable conditioning electronics and drivers for operating the various system components. The computer 143 may be housed within or separate from the base 120 of the sample testing device 100. The computer 143 may be operable to control movement of the carrier 122 into and out of the loading zone 105, movement around the track 121, movement into and out of the centrifuge 125 and operation of the centrifuge 125, movement into and out of the quality inspection module 130 and operation of the quality inspection module 130, and movement into and out of each analyzer 106, 108, 110 and operation of each analyzer 106, 108, 110 for performing various types of tests (e.g., assays or clinical chemistry).
For all modules except the quality check module 130, the computer 143 may control the sample testing device 100 in accordance with software, firmware and/or hardware commands or circuitry, such as those used on Dimension clinical chemical analyzers sold by Siemens Healthcare Diagnostics Inc. However, other suitable systems for controlling the sample testing device 100 may be used. Control of the quality check module 130 may also be provided by the computer 143 but in accordance with the inventive model-based approach (as will be described in detail herein).
Embodiments of the present invention may be implemented using a Computer Interface Module (CIM) that allows a user to easily and quickly access various control and status display screens. These control and status screens may describe some or all aspects of a plurality of interrelated automated devices for preparing and analyzing the sample 212. The CIM may be used to provide information about the operational status of a plurality of interrelated automated devices as well as information describing the location of any sample 212 and the status of tests to be performed on the sample 212 or being performed on the sample 212. CIM 145 is thus adapted to facilitate interaction between an operator and sample testing device 100. CIM 145 may include a display screen adapted to display a menu including icons, scroll bars, boxes, and buttons through which an operator may interface with sample testing device 100. The menu may include a plurality of function buttons programmed to display various functional aspects of the sample testing device 100.
In fig. 2 and 3, a sample container 102 is shown that includes one of H, I or L. Fig. 2 illustrates a sample 212 including H, I or L in a serum or plasma fraction 212SP without a gel separator. Fig. 3 illustrates a sample 212 comprising H, I or L in a serum or plasma fraction 212SP with a gel separator 313. Pre-screening the sample container 102 for the presence of the interferent ensures that the sample 212 may be prevented from proceeding to one or more analyzers 106, 108, 110, if desired. In this way, inaccurate test results may be avoided. In some embodiments, if the method determines that a disturbance is present, the sample container 102 may be taken off-line, such as to the remote station 132 for remedial action (e.g., lipemia reduction) to better quantify the level of hemolysis or jaundice, which may be reported with the test results, or perhaps to cause the sample 212 to be re-drawn.
Referring to fig. 4A-4B, a first embodiment of a quality check module 130 is shown and described. The quality check module 130 may be configured and adapted to automatically determine the presence of an interferent (e.g., H, I or L) in the sample 212 (e.g., in a serum or plasma portion 212SP thereof) prior to analysis by one or more analyzers 106, 108, 110. Pre-screening in this manner allows additional processing, additional quantification, discarding, or re-extraction of the specimen 212 without wasting valuable analyzer resources or potentially having the presence of interferents affect the authenticity of the test results.
In addition to the interferent detection method, other detection methods may be performed on the sample 212 contained in the sample container 102 at the quality check module 130. Further, the detection method may be used to quantify one or more geometric features of the sample container 102. For example, the quality check module 130 may be used to quantify the sample 212, i.e., determine certain physical dimensional characteristics of the sample 212 (e.g., the physical locations of LA and SB, and/or the determination of HSP, HSB, and/or HTOT, and/or the volume of serum or plasma fraction (VSP) and/or the volume of settled blood fraction (VSB)). Further, in some embodiments, the artifact detection method may determine the presence or absence of an artifact (e.g., a clot, a bubble, or a foam) in the serum or plasma portion 212 SP.
In one or more embodiments, the quality inspection module 130 may be used to quantify the sample containers 102, i.e., to quantify one or more physical dimensional characteristics of the sample containers 102, such as the locations of TC, HT, and/or W of the sample containers 102, and/or the color and/or type of the lid 214.
Referring now to fig. 1, 4A, and 4B, a first embodiment of a quality inspection module 130 is provided that may include a plurality of cameras 440A-440C. Three cameras 440A-440C are shown, but two or more, three or more, four or more cameras may be used. The cameras 440A-440C may be conventional digital cameras capable of capturing digital images (i.e., pixelated images), Charge Coupled Devices (CCDs), photodetector arrays, one or more CMOS sensors, or the like. For example, three cameras 440A, 440B, 440C are illustrated in fig. 4A and are configured to capture images from three different viewpoints (e.g., lateral viewpoints). Each camera 440A, 440B, 440C may be a device capable of capturing an image having an image size. In one embodiment, the image size may be, for example, about 2560 × 694 pixels. In another embodiment, the image size may be, for example, about 1280 × 384 pixels. Other pixel densities may be used. Each camera 440A, 440B, 440C may be configured and operable to capture lateral images of at least a portion of sample container 102 and at least a portion of sample 212. For example, the cameras 440A-440C may capture a portion of the label 218 or cap 214 and a portion of the tube 212T, as well as at least a portion of the serum or plasma fraction 212 SP. Finally, from the plurality of images, a composite model of the sample 212 in the sample container 102 may be formed. In some embodiments, the composite model may be a 3D model that includes the classification results and may be used to make a final determination regarding the sample 212.
In the illustrated embodiment, a plurality of cameras 440A, 440B, 440C are arranged around the sample 212 and configured to capture lateral images from a plurality of viewpoints. The viewpoints may be spaced such that they are approximately equally spaced from each other, such as about 120 degrees from each other when three cameras 440A, 440B, 440C are used (as shown). As shown, cameras 440A, 440B, 440C may be arranged around track 121. Other arrangements of multiple cameras 440A, 440B, 440C may be used. In some embodiments, images of the sample 212 in the sample container 102 may be taken while the sample container 102 resides in the carrier 122. The images may overlap slightly.
In one or more embodiments, the carrier 122 may be stopped at a predetermined location in the quality check module 130, for example at a point where normal vectors from each of the cameras 440A, 440B, 440C intersect. In some embodiments, a shutter (gate) may be provided to stop the carrier 122 so that one or more good quality images may be captured therein. In other embodiments, the carrier 122 may include a linear motor configured to start and stop the carrier 122 at desired locations as programmed. In embodiments where a shutter is present at the quality inspection module 130, one or more sensors (such as sensor 116) may be used to determine the presence of the carrier 122 at the quality inspection module 130.
The cameras 440A, 440B, 440C may be disposed proximate to an image window (i.e., an area including the expected location of the sample container 102) in which the sample container 102 may be parked such that it is approximately centered in the viewing window and trained or focused to capture the image window. As configured, the cameras 440A, 440B, 440C may capture such images: it includes a partial serum or plasma fraction 212SP, a partial settled blood fraction 212SB, and a partial or full tube 212T and a partial or full cap 214. Within the captured image, one or more reference fiducials may be present. The reference standard may assist in the quantization of the sample 212. The reference datum may be the TC or the bottom-most portion of the sample container 102, or a mark of a known location somewhere on the sample container 102, such as a ring at a predetermined height that can be seen from all viewpoints.
In operation, each image may be triggered and captured in response to a trigger signal provided in the communication line 443A, 443B, 443C, which may be transmitted by the computer 143. Each captured image may be processed according to one or more embodiments of the methods provided herein. In particular, the image may be captured and processed using HDR processing.
In more detail, multiple images of the sample 212 (e.g., separated samples by fractionation) are captured at the quality check module 130 at multiple different exposure times and under one or more different wavelength spectra. For example, each camera 440A, 440B, 440C may take 4-8 images at different exposure times in one or more spectra (one or more wavelength ranges).
In one embodiment, the multiple wavelength images may be implemented using different colored light sources 444A-444C that emit different spectra of illumination. The light sources 444A-444C may backlight the sample container 102 (as shown). Alternatively, the light sources 444D-444F may direct light to illuminate the sample container 102, such as by being disposed above, below, or to the side of the respective cameras 440A, 440B, 440C, or at other locations and illumination, as shown in FIGS. 4C-4D. In some embodiments, an optical diffuser may be used in conjunction with the light sources 444A-444C or 444D-444F. The plurality of different spectrum light sources 444A-444C may be RGB light sources or other light sources, such as LEDs emitting two or more different spectra. For example, the light source may emit illumination having nominal wavelengths of 634 nm +/-35 nm (red-R), 537 nm +/-35 nm (green-G), and 455 nm +/-35 nm (blue-B). In other embodiments, the illumination spectrum may include one or more spectra having a nominal wavelength between about 700 nm and about 1500 nm, or even between about 700 nm and about 1200 nm.
For example, to capture an image at a first wavelength, sample 212 may be illuminated from three lateral positions using three red light sources (wavelengths of about 634 nm +/-35 nm). The red illumination by the light sources 444A-444C may occur when the multiple images (e.g., 4-8 or more images) are captured by each camera 440A-440C at different exposure times. In some embodiments, the exposure time may be between about 0.1 ms and 256 ms. Other exposure times may be used. Each of the respective images for each camera 440A-440C may be taken sequentially or simultaneously.
In each embodiment, the quality inspection module 130, 130A may include a housing 446, the housing 446 may at least partially surround or cover the track 121, and the sample container 102 may be located inside the housing 446 during the image capture phase. The housing 446 may include one or more doors 446D (e.g., openings) to allow the carrier 122 to enter and/or exit the housing 446. In some embodiments, the top plate may include an opening 446O to allow sample containers 102 to be loaded into the carrier 122 from above by a robot including a movable robot finger. In the case where front lighting is used (fig. 4C-4D), quality inspection module 130A may include non-return walls 447 to provide improved image contrast. The check wall 447 may be any suitable color other than the intended color range of the specimen 212. In some embodiments, a black material may be used.
Once the red illumination image is captured in the embodiment of fig. 4A-4B, the red light sources 444A-444C may be turned off and one or more other spectra (e.g., the green light sources 444A-444C (nominal wavelength of about 537 nm, bandwidth of about +/-35 nm)) may be turned on, and multiple images (e.g., 4-8 or more images) at different exposure times may be captured by each camera 440A, 440B, 440C under the spectra. These may be repeated for each camera 440A, 440B, 440C with a blue light source 444A-444C (nominal wavelength of about 455 nm, bandwidth of about +/-35 nm). In other embodiments, white light sources (400 nm-700 nm), Near Infrared (NIR) light sources (e.g., 700 nm-1200 nm), or even Infrared (IR) light sources (e.g., 1200 nm-1500 nm) may be used. Infrared (IR) and Near Infrared (NIR) light sources may be particularly effective in increasing the transmittance of the sample 212 and label 218, and allow for improved see-through capabilities. The NIR and IR light sources may also be beneficial for detecting the fluid level (level of serum or plasma fraction 212 SP) regardless of being obscured by the label 218. Furthermore, the discrimination between jaundice and lipemia samples may be improved by illumination with IR or NIR light sources during imaging. The different nominal wavelength light sources 444A-444C may be implemented via the use of, for example, switchable band pass filters or, for example, different color/spectral light source banks that may be selectively turned on and off. Other means for different spectrum illumination may be used. Illumination and image capture at two or more, or even three or more, different spectra may be performed.
In an alternative embodiment, as best shown in fig. 4C and 4D, the sample container 102 may be frontlit in the quality inspection module 130A, such as by including light sources 444D, 444E, and 444F arranged near the cameras 440A, 440B, 440C (i.e., above, below, to the side of the cameras, or a combination thereof, but on the same side of the sample container 102 as the respective cameras 440A-440C). In this embodiment, the cameras 440A-440C may be digital color cameras having RGB nominal wavelength peaks at approximately 634 nm, 537 nm, and 455 nm, respectively, but where each RGB color spectrum has a relatively wider wavelength range than the discrete source used in the above-described embodiment with a monochrome camera. In this embodiment, light sources 444D, 444E, and 444F may each be a white light source. For example, the light sources 444D-444F may emit wavelength ranges as specified above, and may be used to illuminate the sample 212 from multiple lateral positions. Multiple images at different exposure times may be taken by each camera 440A-440C. Each white light image captured may be separated into color components at multiple wavelengths. For example, the computer 143 can separate the image into at least three capture wavelengths between about 400 nm and about 700 nm. For example, the RGB components may be separated from the image by the computer 143 to generate a multi-spectral, multi-exposure time captured image. Images may be taken via signals from the computer 143 in lines 443A-443C as previously described.
For each of the above-described settings, all of these multiple images taken at multiple exposure times for each respective wavelength spectrum (e.g., R, G and B) may be obtained in rapid succession, such that the entire set of images for the sample 212 from multiple viewpoints may be obtained in a short amount of time, such as, for example, less than about 2 seconds. In one example, 4 different exposure images for each wavelength backlit with RGB light sources 444A-444C at three viewpoints using cameras 440A, 440B, 440C would result in 4 images by 3 colors by 3 cameras = 36 images. In another example, 4 different exposure images using cameras 440A, 440B, 440C at three viewpoints and frontlit with white light sources 444D-444F would result in 4 images x 3 cameras = 12 images. However, the RGB image is then captured by separating the captured white light image into its individual RGB components. Thus, after separation, 36 images were also captured. The image data may be stored in the memory of the computer 143 and then processed thereby. In addition to these, a reference image may be captured and used for background removal.
According to the HIL characterization method, the processing of the image data may involve, for example, selecting optimal exposure pixels from the plurality of images captured at different exposure times for each camera 440A-440C and at each wavelength spectrum, thereby generating optimal exposure image data for each wavelength spectrum and for each camera 440A-440C. This is referred to herein as "image integration". For each corresponding pixel, a pixel exhibiting an optimal image intensity may be selected from each of the different exposure time images for each of the images from each of the cameras 440A-440C. In one embodiment, the optimal image intensity may be, for example, between 16-254 on a scale of 0-255. In another example, the optimal image intensity may be pixels that fall within a predetermined range of 180-254 on a scale of 0-255, for example. If more than one pixel in the corresponding position of the two images is determined to be optimally exposed, the higher of the two is selected. Selected pixels exhibiting optimal image intensity may be normalized by their respective exposure times. The result is a plurality of normalized and integrated color image datasets (e.g., R, G, B) for each camera 440A-440C, with all pixels optimally exposed (e.g., one image dataset per wavelength (e.g., R, G and B)). Sets of images in the near infrared and/or infrared may also or alternatively be captured and processed to provide an optimal exposure image data set for each viewpoint.
As part of the calibration process of the quality check module 130, a reference image may be taken without the sample container 102 or carrier 122. In this way, the computational burden can be minimized by subtracting the tube background (the area outside the sample container 102) from each image dataset. A reference image for each exposure time and illumination condition (R, G, B, white light, near IR, IR) may be taken by the quality check module 130 before the interferer detection method is performed.
For each image dataset that includes optimally exposed pixels, a characterization process is performed to identify pixels that are classified as serum or plasma portions 212SP of the sample 212. Identifying the serum or plasma fraction 212SP may be based on classifying each pixel in the optimal exposure image data. The classification may be based on using multi-class classifiers generated from multiple training sets. For example, the multi-class classifier may include a Support Vector Machine (SVM) or a random decision tree. Other means for determining the classification of the serum or plasma fraction 212SP may be used.
To perform the classification, first statistical data as described above may be calculated for each of the optimally exposed pixels at different wavelength spectra (e.g., R, G, B, white light, near IR, and/or IR) for each camera 440A-440C. For example, the statistical data may include mean values and covariances up to a second order. The calculated statistical properties encode specific properties of the object class and are thus used to distinguish between different object classes by assigning class labels. Once generated, the statistical data is presented to and operated on by the multi-class classifier 515, which multi-class classifier 515 may classify pixels in the image as belonging to one of a plurality of class labels, such as 1-serum or plasma fraction, 2-settled blood fraction, 3-tube, 4-cap, 5-label, 6-air, and 7-gel separator (if used). Thus, the pixels that make up the liquid region (i.e., the serum and plasma fraction 212 SP) can be identified.
The multi-class classifier 515 is trained using multiple sets of training examples, and then the image data set is manipulated and each pixel is classified on the multi-class classifier 515. Multiclass classifier 515 may be trained as follows: by graphically depicting various areas of the sample container 102 in numerous examples of various sample conditions, occlusion by the label 218, levels of the serum or plasma fraction 212SP and the settled blood fraction 212SB, and the like. Multi-class classifier 515 may be trained using up to 500 or more images. Each training image may be manually traced to identify and teach areas of the multi-class classifier 515 belonging to each class.
The training algorithm constructs a multi-class classifier 515 that assigns pixels of any new sample into one of the classes. The SVM model represents examples as points in space that are mapped such that the examples of classes are divided with as wide a clear gap as possible. New pixels from the image dataset may be mapped into this same space and predicted to belong to a particular class based on which side of the gap they fall on. In some embodiments, SVMs may efficiently perform non-linear classification using so-called kernel-based SVM classifiers, implicitly mapping their inputs into a high-dimensional feature space. SVM and lifting are particularly preferred. Other types of classification models may be used.
The results of the multi-class classifier 515, which are considered to belong to the class of the serum or plasma fraction 212SP, may then be fed into a model configured to identify whether H, I or L is present or whether HIL is not present within the serum or plasma fraction 212SP and the sample 212 is therefore normal (N). Thus, in effect, the interferent model classifies whether interferents are present within one or more regions of the serum or plasma fraction 212SP, or absent from the serum or plasma fraction 212SP, based on the subset of image data. In one or more embodiments, the interferent model may be implemented as one or more different interferent type models, such as a hemolysis model, a jaundice model, and a lipemia model. In some cases, even a normal model may be used. Each interferent model or normal model may be a binary classification model. The result of operating on the subset of image data previously defined as liquid is the presence or absence of interferents in the serum or plasma fraction 212SP, i.e. the serum or plasma fraction 212SP of the sample 212 is normal.
A simple functional flow diagram of a jammer detection method in accordance with one or more embodiments is shown in fig. 5. First, in 502, a sample container 102 comprising a sample 212, which may be carried by a carrier 122, is provided at a quality check module 130. Capturing a plurality of images at 504; as described above, the plurality of images are multispectral images taken at a plurality of different exposures and at a plurality of different wavelength spectra and from a plurality of viewpoints. The plurality of images may be stored in a memory of the computer 143. From these images, the background may optionally be subtracted in the background reduction stage of 508 to reduce the computational burden. Background reduction may be achieved by subtracting the reference image previously taken at 510.
After image capture and optional background reduction, segmentation is performed in 511. The segmentation in 511 may include the image integration process performed in 512. During this image integration process in 512, the individual exposure time images under each color spectrum (R, G, B, white light, NIR, and/or IR) and for each camera 440A-440C are examined pixel by pixel to determine those pixels that have been optimally exposed. For each corresponding pixel location, the best pixel of any optimally exposed pixels is selected and included in the optimally exposed image data set. Thus, after image integration at 512, an optimal exposure image data set is generated for each spectrum and for each camera 440A-440C. The use of HDR processing can be used to enrich the image in detail regarding reflection and absorption.
After or possibly concurrent with the image integration at 512, a statistics generation process may be performed at 514, wherein statistics, such as mean and/or covariance matrices, are generated for each pixel. This statistical data for the optimal exposure data set is then operated on by a multi-class classifier 515 in 516 to provide identification of pixel classes present in the image. The final class for each pixel may be determined by maximizing the confidence value for each pixel. For each pixel location, a statistical description (e.g., a small super-pixel tile (e.g., 11 × 11 pixels)) may be extracted within the pixel. Each superpixel tile provides descriptors that are considered in the training and evaluation process. Typically, during testing/evaluation, the classifier operates on the feature descriptors and uses the class labels for training and outputting the class labels.
According to this segmentation process of 511, at 516, each pixel in the integrated image for each camera 440A-440C is given a classification as one of a plurality of class types. Class types may be, for example, liquid (serum or plasma fraction 212 SP), settled blood fraction 212SB, tube 212T, label 218, cap 214, gel separator 313, air 212A. From this segmentation information, the fluid region (serum or plasma fraction 212 SP) may be determined at 518. This may involve identifying the location and width (W) of the upper interface (i.e., LA), SB, or SPG (if gel separator 313 is used) between the liquid (serum or plasma fraction 212 SP) and the air 212A. From this information, a volume estimate of the fluid region (serum or plasma fraction 212 SP) can be determined. Once the liquid region is identified in 518, the presence of the interferent may then be detected in 521. One or more additional classifiers may be utilized to operate on the data subset of the fluid region (serum or plasma fraction 212 SP) to see the presence of H, I and/or L. In one embodiment, a separate classifier may be used for each of H, I and L, as described below.
Hemolysis assay
According to a first broad aspect, embodiments of the present invention are directed to methods and devices that may be used to detect whether hemolysis has occurred in a sample 212 contained in a sample container 102 of centrifuged blood. The method utilizes multiple cameras 440A-440C, and multiple exposures (e.g., 4-8 exposures or more) and multiple wavelength spectra (e.g., R, G, B, near IR, and/or IR) are made for each camera to capture multiple pixelated images. These images are then analyzed and operated on as described above to identify regions of liquid at 518. This subset of data from the liquid region is further analyzed in 521H to identify hemolysis.
Hemolysis is a sample quality discoloration problem and it cannot be solved by special handling. Hemolysis (also known as red blood cell lysis) can occur when red blood cells rupture and the internal hemoglobin is released into the serum or plasma fraction 212SP of the sample 212 that has been centrifuged. This gives the serum or plasma fraction 212SP a reddish color or appearance. With a reddish color, potassium may be released into the serum or plasma fraction 212S, which may give false results when tested on the analyzers 106, 108, and/or 110. Incorrect blood collection, handling, storage and/or processing can lead to hemolysis.
The degree or grade of hemolysis can be characterized by the hemolysis index as determined in 526H. As used herein, "hemolytic index" shall mean the rating given to a particular sample 212 based on the determined amount of hemolysis present in the serum or plasma fraction 212 SP. Generally, the scale of grading used for observation ranges from zero to four (0-4). Zero indicates essentially no hemolysis, while four indicates significant hemolysis. Alternatively, a scale of 0-10, 0-20, A-F may be used, or some other range of scales may be used. Samples 212 with sufficiently high hemolytic index as determined by the quality check module 130 may be discarded. A common procedure is to re-draw another sample 212 from the patient to ensure that a sample 212 of good quality is presented to the analyzer 106, 108, and/or 110. Thus, a sample 212 exhibiting hemolysis can be discarded and unloaded at the loading zone 105 without further testing. Optionally, the sample 212 may be tested in an analyzer (e.g., analyzer 106, 108, or 110) and depending on the indicated test, the hemolytic index may be reported along with the test results.
Once the new sample 212 is processed and considered normal by the quality check module 130, it can be successfully analyzed without interfering with hemoglobin. In some embodiments, if it is determined that the sample 212 contains hemolysis as detected at the quality check module 130, the sample 212 may be sent on to another analytical instrument (e.g., a dedicated clinical analyzer at the remote station 132 in fig. 1), where the precise level of hemolysis may be measured and characterized. If the sample 212 is found to contain hemolysis, an alarm may be displayed on a display (e.g., a computer screen) of the CIM 145 or computer 143 of the sample testing device 100 to alert laboratory personnel to further evaluation and/or decision making.
To improve the ability to communicate an assessment that the sample 212 contains hemolysis to laboratory personnel, an image of the sample container 102 including the sample 212 with hemolysis may be displayed on a display of the CIM 145 or computer 143. This image may be displayed with other collaboration information such as, but not limited to: various known reference images of hemolyzed samples, chromatograms used for comparison, levels of hemolysis (i.e., indices) of the sample 212 evaluated, and/or suggested actions to be taken by laboratory personnel.
Jaundice detection
According to another broad aspect, embodiments of the present invention are directed to methods and devices that may be used for jaundice in a centrifuged blood sample 212 contained in a sample container 102. For example, jaundice interferents may be caused by, for example, an excess of bilirubin, which is the result of decaying red blood cells being converted to bilirubin in the spleen. Bilirubin levels above 2-3 mg/dl are typically visible as dark yellow or brown, and may adversely affect any enzyme-based immunoassay performed on the analyzer (e.g., analyzers 106, 108, and/or 110). This condition is also known as bilirubinaemia.
Jaundice is detected by a method similar to that for hemolysis. After image capture and analysis of the pixelated image to identify fluid regions in 518, a subset of data from the fluid regions may be analyzed for the presence of jaundice. According to the method, the same subset of digital image data used for hemolysis detection may be used for jaundice detection. The analysis may use a binary classifier to determine whether jaundice is present, and if so, may determine an interferent level, such as a jaundice index. As used herein, "jaundice index" shall mean the rating given to a particular sample 212 based on the determined amount of jaundice present. Generally, the scale of grading for observations ranges from zero to four (0-4). Similarly, zero indicates substantially no jaundice, while four indicates a significant presence of jaundice. Alternatively, other scales may be used, such as 0-10, 0-20, A-F, or some other range.
Lipemia detection
According to another broad aspect, embodiments of the present invention are directed to methods and devices that may be used to detect lipemia in a sample 212 contained in a sample container 102 of centrifuged blood. A lipemic disruptor that may exhibit a whitish or milky appearance in the serum or plasma fraction may be caused by the presence of excess lipids in the blood. Lipid levels above about 50 mg/dl may interfere with antibody binding in the immunoassay test and thus may affect the immunoassay results from the analyzer 106, 108 or 110.
The lipemia detection method is similar to the method for detecting hemolysis and jaundice. The method may receive the sample container 102 in the quality check module 130. Next, cameras 440A-440C may capture pixelated images of sample 212. The computer 143 may then perform an analysis of the image to segment the sample container 102 and sample 212 at 511, and identify the liquid portion at 518. Finally, the image data subset may be analyzed for the presence of lipemia in 521L. According to the method, the same subset of digital image data used for hemolysis and jaundice detection may be used for lipemia detection. The analysis may determine whether an interferent is present and, if so, may determine the level of the interferent, such as a lipemic index. As used herein, "lipemic index" shall mean the rating given to the sample 212 based on the determined lipemic content therein. Generally, the grading scale for visual observation ranges from zero to four (0-4). Similarly, zero indicates the substantial absence of lipemia, while four indicates the significant presence of lipemia. Alternatively, other scales may be used, such as 0-10, 0-20, A-F, or some other range of scales. Lipemia is a specific sample mass discoloration defect that can be addressed with special handling before the sample 212 is tested or analyzed on an analyzer (e.g., analyzers 106, 108, and/or 110).
After the laboratory perceives that the sample contains lipemia, they may further process the sample 212 to remove or reduce lipids, for example, at the remote station 132. For example, they may introduce solvents or other materials to reduce the amount of lipemia. After additional processing at the remote station 132 to reduce the level of lipemia, the sample 212 may be returned to the track 121 and may be placed directly on an analyzer (e.g., analyzers 106, 108, and/or 110) for analysis. Optionally, the specimen 212 may be routed again to the quality check module 130 for rescreening the specimen for lipemia. If the level of lipemia is now sufficiently low, the sample may be routed on the track 121 for analysis on an analyzer (e.g., analyzers 106, 108, and/or 110), and then returned to the loading zone 105 with the sample 212. By retesting lipemia, the sample 212 can be correctly analyzed by one or more of the analyzers (e.g., analyzers 106, 108, 110), and the laboratory can be relatively more confident in the test results.
Thus, it should be apparent that embodiments of the present invention may detect H, I and/or L at a first possible step (e.g., at quality check module 130) after centrifugation of sample 212. By detecting H, I and/or L at this point in the process, the sample 212 will not be wasted, erroneous test results can be prevented, and any patient test result delays will be minimized. Of course, in order to provide an even more accurate measurement of the level of H, I and/or L present in the serum or plasma fraction 212SP, artifact detection methods may be employed to identify the presence of artifacts such as clots, bubbles or foam. In this approach, pixels identified as containing one or more artifacts may be ignored and not used for HIL detection. The Artifact detection method of 622 (of FIG. 6) is further described In U.S. provisional patent application No. 62/288,358, entitled "Methods and Apparatus For Classifying artifacts In A Specificationn", filed on 28/1/2016.
According to the method, identifying hemolysis in 521H, identifying jaundice in 521I, and identifying lipemia in 521L may be performed by operating on the image data subsets with one or more classifiers trained based on a plurality of training sets. A separate binary classifier may be used for each of H, I and/or L, or even for N separately, or a multiclass classifier may be used to identify any one or more of H, I and/or L that may exist or are N. Alternatively, the stored RGB values for each pixel of the data subset may be measured against RGB values in a memory (such as in a look-up table).
In one or more embodiments, the determination of the presence of the one or more interferents involves first analyzing the subset of image data to characterize individual ones of the pixels as normal (N) or comprising hemolysis (H), jaundice (I), or lipemia (L). Based on this determination, an overall classification of the liquid region may be provided. The overall classification may be normal (N) or include specific one or more types of interferents. For example, the specific interferent type(s) in the liquid region may be determined as one of H, I and/or L, such as H, I, L, H and I, H and L, I and L, or H, I and L.
In one or more embodiments, interferent classifier 521 may include any suitable supervised classification model. The interferent classifier 521 may utilize another classification model to determine whether a pixel classified as being in the liquid region belongs to one of the N, H, I or L classes. The interferent classifier in 521 may be based on a single binary classifier for each of H, I and L, or a multi-class classifier that has been fully trained based on multiple interferent training sets for H, I, L and N. In one embodiment, the multi-class classifier (e.g., the four-class classification model) may be a Support Vector Machine (SVM), a support vector network, or a boosted class algorithm. Examples of Support vector machines and Support vector Networks are described in the paper entitled "Support-vector Networks" by C. cortex and V. Vapnik at machine learning Vol.20, phase 3, page 273 and 297 and the paper entitled "Additive logical Regression: A Statistical View Boosting" (1998) by J. Friedman, T. Hastie, R. Tibshirai and the paper entitled "A Short Introduction to Boosting" (1999) by Y. free and R.E. Schapire.
Once the pixels of the image data subset have been classified as N, H, I or L by interferent classifier 521, method 500 may include determining whether the liquid region of sample 212 as a whole is normal (N), or if not normal (N), contains one or more of H, I and/or L. If the sample 212 is deemed normal (N), the sample 212 simply proceeds on the track 121 to the analyzer(s) (e.g., analyzers 106, 108, and/or 110) for which testing is indicated. If not, one or more interferent types are determined. Further, in 521B, an interferent level detector may be used to determine the interferent level for each interferent type.
The determination of the type of interferent if the serum or plasma fraction 212SP as a whole is normal (N) or if not normal (N) may be achieved by summing the number of pixels in the liquid region that have previously been classified as N, H, I or L. The classification as normal (N) or containing interferents may be based on the maximum number of pixels in each class, or in some embodiments, on a weighting scheme. Thus, in one embodiment, if most pixels are classified as N, then the fluid region and the sample 212 may be classified as normal (N). If most pixels are classified as H, then the liquid region and the sample 212 may be classified as containing hemolysis (H). Likewise, if most pixels are classified as I or L, the fluid region and the sample 212 may be classified as jaundice (I) or lipemia (L), respectively. In other embodiments, a weighted majority voting scheme may also be used to classify the samples 212 by using the probabilities from the interferent classifier 521 as weights. Other means for characterizing the sample 212 as a whole may be used.
Furthermore, if the image dataset of the sample 212 contains a relatively large number of pixels classified in two or more interferent classes (e.g., H and I, H and L, I and L, or even H, I and L), then the interferent detection method may report the presence of multiple interferent types in the sample 212. Once the sample 212 is given a characterization that includes multiple interferent types (e.g., H, I and/or L), the interferent level detector 521B may be used to provide interferent levels for the multiple interferent types in the sample 212. The interferent level detector 521B may obtain the interferent level or index for each particular interferent by passing the subset of image data through a level characterization model, such as a supervised regression model. Any suitable regression model may be used, such as Support Vector Regression (SVR), neural network regression, tree-based regression, and the like.
Different regression models may be used for each interferent type, such as hemolysis regression model 526H, jaundice regression model 526I, and lipemia regression model 526L. In one or more embodiments, each of the regression models may be an SVR machine and may be trained using only liquid regions exhibiting that particular type of interferent type (e.g., H, I or L). For example, hemolysis regression model 526H may be trained with a wide range of samples 212 having hemolysis levels that span a range of expected hemolysis levels. For example, a range of hemolysis may include a level of hemolysis from about 50 to 525. Likewise, jaundice regression model 526I may be trained with a wide range of samples 212 having jaundice levels that span a variety of expected level ranges, including jaundice levels from about 1.7 to 30. Likewise, the lipemia regression model 526L may be trained with a wide range of samples 212 having lipemia levels spanning a variety of expected level ranges, including lipemia levels from about 125 to 1000.
In some embodiments, the level of interferents may be discretized. For example, four discrete levels may be used. For hemolysis regression model 526H, discrete hemolysis levels of 50, 150, 250, and 525 may be used. For jaundice regression model 526I, discrete jaundice levels of 1.7, 6.6, 16, and 30 may be used, and for lipemia regression model 526L, discrete lipemia levels of 125, 250, 500, and 1000 may be used. More or less than four discrete levels may be used. Levels other than the discrete levels listed above may be used.
While the results from multiple viewpoints may provide an indication of whether the sample is normal (N) or contains one or more of HILs, the final determination of the interferent level may be determined by fusion of the regression results of the image data subsets for that particular interferent type as passed through the desired regression model. If the model's interferent levels have been discretized, the output from the regression model will also be discretized by mapping to the closest target level. In any case, in accordance with one or more embodiments, an interferent level or index may be provided for each detected interferent type in the sample 212. The determinations may be aggregated according to a weighting scheme, wherein the images are weighted based on the number of pixels of each type. The final decision can be verified across different views.
Thus, it should be apparent that the model-based interferent detection and classification methodology 500 performed by the quality inspection module 130 may result in a rapid characterization of the sample 212 as being normal or containing one or more interferents therein. If the sample 212 contains one or more interferent, the method 500 may further determine the one or more interferent types present, and may also determine an interferent level or index for each interferent type present. The final results and determinations may be aggregated across multiple views.
Fig. 6 illustrates a flow diagram of a broader characterization method 600, where the interferent characterization (i.e., HILN classification) in 621 is only one of many items that may be characterized or classified using the quality check module 130 by the broader method 600. In accordance with one or more embodiments of method 600, images are captured, such as by multiple cameras (camera 440A is shown). However, other cameras 440B, 440C may be used to capture images from other viewpoints. The processing that will be described for the image captured on camera 440A is the same for the other cameras 440B, 440C at the other viewpoints, and their input in line 605 can be used to develop a 3D model of the sample 212 for ultimately determining or resolving any resulting differences as between the viewpoints.
As described above, the images captured by the camera 440A and the other cameras 440B, 440C may be multi-spectral (e.g., RGB, near IR, IR) and multi-exposure images. In particular, multiple exposures (e.g., 4-8 exposures) may be made for each wavelength spectrum used in 604A. The corresponding images for each exposure of each camera 440A-440C may be obtained simultaneously using a monochrome camera and backlight sources 444A-444C as described in FIGS. 4A-4B. Alternatively, in 604B, a color camera may be used to obtain front-lit multi-exposure images using white light sources 444D-444F.
The image may then be optionally processed at 508 to remove background using the reference image 510, as described above in the optional background removal method. The image may then be further processed in the manner described above to determine a segmentation in 511. In some embodiments, the images from 604B from the front-lit cameras 440A-440C (see FIGS. 4C-4D) may be best used for segmentation in 511. Likewise, any image captured in 604A using backlighting may be best used for characterization of HILN in 621. It is apparent, however, that the image captured in 604A may be used for segmentation in 511, and the image captured in 604B may be used for HILN detection in 621.
The identification and quantification of the liquid in 623 may also be performed after the segmentation in 511. 623 may involve the determination of certain physical dimensional characteristics of the sample 212, such as the physical location of LA, SB, SG and/or BG, and/or HSP, HSB and/or HTOT, and/or the volume of serum or plasma fraction (VSP) and/or the volume of settled blood fraction (VSB). The internal width (Wi) can be obtained from the sample container characterization in 627. The identification may be achieved by selecting the pixels at these bounding regions and averaging their position values in pixel space to obtain the value of LA, SB or SPG. From this information, the volume of the serum or plasma fraction 212SP can be determined. The correlation from pixel space to mechanical measurements may be achieved by calibrating the pixels to millimeters using any suitable calibration.
To provide an even closer measurement of the actual volume of the serum or plasma fraction 212SP available for testing, an artifact detection method may be employed at 622 to identify the presence of clots, bubbles, or foam. The corresponding estimated volume of the one or more artifacts present may be subtracted from the estimated volume of the serum or plasma fraction 212SP determined above to obtain a better volume estimate. The image may then be processed at 622 using an artifact classifier to determine whether an artifact is present in the serum or plasma portion 212 SP. Those pixels identified as artifacts by artifact detection 622 may then be ignored in the HILN classification in 621. In some embodiments, the detection of the artifact may also initiate remediation. Artifact detection Methods are described In U.S. provisional patent application No. 62/288,358, filed on 28/1/2016 and entitled "Methods and Apparatus For Classifying artifacts In samples".
511 may also be used to identify a label 218, which label 218 may include identification information 215 such as a bar code. The barcode may be read 625. Once the label 218 is identified in the segmentation in 511, conventional bar code reading software may be used. If a particular image does not contain enough barcodes to read, the barcodes may be read from other images obtained from the other cameras 440A-440C or may be read in conjunction with other images obtained from the other cameras 440A-440C.
Further characterization of the sample container 102 according to the broader method 600 may also be implemented in 627. The characterization of the tube type in 529, the cap type in 531, and the cap color in 533 may be fed to the 3D model 635 to verify that the same characterization is achieved based on processing the images from each camera 440A-440C. If slightly different values are obtained, the values may be averaged. All outputs from HILN classification in 621, liquid quantification in 623, artifact detection in 622, and sample container detection in 627 may be fed into the 3D model 635, which may be used for final decision making, characterization, and coordination of results from the various cameras 440A-440C.
Fig. 7 illustrates a flow diagram of a method of determining interferers in a sample 212 in accordance with one or more embodiments of the disclosure. The method 700 includes providing a sample (e.g., sample 212) contained in a sample container (e.g., sample container 102, such as a capped blood collection tube) at 702. Next, method 700 includes capturing images of sample container 102 containing sample 212 at different exposure times and under different spectra, at 704. For example, in some embodiments, 4-8 or more different exposures may be made at different exposure times but under the same illumination conditions. In one or more embodiments, some images may be captured using white light and using front-lighting, and some images may be captured using multiple single wavelength peak narrowband light sources (such as red, blue, and green) as the backlight illumination sources 444A-444C. In other embodiments, NIR and/or IR spectral sources may be used. In some embodiments, the white light image may be interpreted by computer 143 as the captured R, G and B images, as described above. In each case, images may be taken by multiple cameras 440A-440C from multiple viewpoints.
As shown in 706, method 700 may optionally include background removal to subtract out some of the background in order to reduce the computational burden. Background reduction may be achieved by subtracting the image from a corresponding reference image, which may be captured as part of a calibration process. The reference image may be taken under the same exposure time, wavelength spectrum, and illumination conditions as the image for the sample container 102, but may be captured without the sample container 102 in the carrier 122. The background reduction stage may also include normalization.
The method 700 includes selecting optimal exposure pixels at each wavelength from images at different exposure times to generate optimal exposure image data at each wavelength spectrum at 710. For each corresponding pixel location in each image at a particular wavelength, the best exposed pixel (without underexposure or overexposure) may be selected. The optimum exposure range may be as described above. This optimal exposure pixel selection occurs during the image integration phase (e.g., image integration 512). Thus, for each of the spectra (R, G, B, near IR, and/or IR), a dataset of optimally exposed pixels may be generated.
Next, the method 700 includes classifying 712 the optimally exposed pixels as serum and plasma portions 212SP (i.e., liquid regions). The classification may be achieved by calculating statistics of the optimal exposure pixels at different wavelength spectra to generate statistics and then operating on the statistics of the optimal exposure pixels to identify the serum and plasma fractions 212 SP. Other classes (e.g., settled blood fraction 212SB, air 212A, tube 212T, label 218, and/or gel separator 313) may also be identified by the segmentation in 511.
Finally, the method 700 includes: the presence or absence of an interferent and the interferent type are identified in 714 based on operating on the optimal exposure image data for each wavelength spectrum with an interferent classifier. Optionally, at 716, the interferent level or index may be detected, such as by using an interferent level model, such as a regression model or the like. Thus, based on the foregoing, it should be apparent that the model-based sample interferent detection method 700 performed by the quality check module 130 may result in H, I and/or a rapid characterization of the presence of L or N. If an interferent is detected, the level of the interferent may be assessed and reported.
Although the quality inspection module 130 is shown in fig. 1 as being positioned such that the pre-screening is performed immediately after centrifugation on the centrifuge 125, it may be advantageous in some embodiments to include this feature directly on the analyzer (e.g., analyzers 106, 108, and/or 110) or elsewhere. For example, a standalone quality inspection module 130 located at a remote station 132 that is not physically connected to the track 121 of the sample testing device 100 can use this technique to validate the sample 212 prior to analysis. Furthermore, in some embodiments, centrifugation may be performed prior to loading the racks 104 into the loading zone 105, such that in some embodiments, the quality check module 130 may be located at the loading zone 105 and the robot 124 may perform a quality check as soon as the sample containers 102 are loaded into the carrier 122. Other locations of the quality check module 130 are possible.
While the invention is susceptible to various modifications and alternative forms, specific system and apparatus embodiments and methods thereof have been shown by way of example in the drawings and are herein described in detail. It should be understood, however, that there is no intention to limit the disclosure to the specific devices or methods disclosed, but on the contrary, the intention is to cover all modifications, equivalents, and alternatives falling within the scope of the appended claims.
Claims (20)
1. A method of determining a perturbant in a sample contained in a sample container, comprising:
providing a sample contained in a sample container;
providing a plurality of cameras;
capturing images of the sample with each camera from different viewpoints at a plurality of different exposure times and at a plurality of different spectra having different nominal wavelengths;
generating a plurality of integrated color image data sets, i.e. one image data set for each different spectrum and for each camera; wherein to generate a color image dataset, pixels from the image are selected comprising intensities between 16 and 254 based on a range of 0 to 255;
classifying the serum or plasma fraction of the sample; and
determining an interferent:
whether present in the serum or plasma fraction, or
Is not present in the serum or plasma fraction.
2. The method of claim 1, wherein classifying the serum or plasma fraction is done with a classifier pre-trained from a plurality of training sets and comprises calculating statistics of pixels at the different spectra to generate statistics.
3. The method of claim 1, wherein the sample is a post-centrifugation sample comprising the separated blood fraction and the serum or plasma fraction.
4. The method of claim 1, wherein capturing the image of the sample involves capturing multiple images with cameras from 3 or more different viewpoints.
5. The method of claim 1, wherein the plurality of different spectra comprises two or more spectra between 400 nm and 1500 nm.
6. The method of claim 1, wherein the plurality of different spectra comprises two or more spectra between 400 nm and 700 nm.
7. The method of claim 1, wherein the plurality of different spectra comprise red light, green light, blue light.
8. The method of claim 1, wherein the plurality of different spectra comprise infrared and near-infrared light.
9. The method of claim 1, wherein the plurality of exposure times comprises between 0.1 ms and 256 ms.
10. The method of claim 1, wherein classifying the serum or plasma fraction comprises using a multiclass classifier pre-trained from a plurality of training sets.
11. The method of claim 10, wherein the multi-class classifier comprises a support vector machine or a random decision tree.
12. The method of claim 1, wherein determining the presence or absence of an interferent in the serum or plasma fraction is based on interferent classifiers generated from a plurality of training sets.
13. The method of claim 12, wherein the interferent classifier comprises a multi-class classifier capable of discriminating hemolysis, jaundice, and lipemia.
14. The method of claim 12, wherein the interferent classifier comprises a separate binary classifier capable of separately discriminating hemolysis, jaundice, and lipemia.
15. A quality inspection module adapted to determine the presence of an interferent in a sample contained within a sample container, comprising:
a plurality of cameras arranged around the sample container and configured to capture a plurality of images of the sample at a plurality of different exposure times and a plurality of spectra having different nominal wavelengths and from a plurality of viewpoints; and
a computer coupled to the plurality of cameras and adapted to process image data of the plurality of images, the computer configured and operable to:
generating a plurality of integrated color image datasets for each different spectrum and for each camera; wherein for generating a color image dataset pixels from said image are selected comprising intensities between 16 and 254 based on a range of 0 to 255,
classifying the serum or plasma fraction of said sample, and
classifying interferents:
whether present in the serum or plasma fraction, or
Is not present in the serum or plasma fraction.
16. The quality inspection module of claim 15, comprising a housing surrounding the sample container received in a carrier, the carrier being disposed on a track.
17. The quality inspection module of claim 16, comprising an opening in a top plate of the housing configured to allow a sample container to be top loaded into the quality inspection module.
18. A quality inspection module according to claim 15, comprising a plurality of RGB light sources providing backlighting.
19. A quality inspection module according to claim 15, comprising a plurality of white light sources providing front lighting.
20. A sample testing device adapted to determine the presence of a interferent in a sample contained within a sample container, comprising:
a track;
a carrier movable on the track and configured to receive the sample container;
a plurality of cameras arranged around the track and configured to capture a plurality of images of the sample at a plurality of different exposure times and a plurality of spectra comprising different nominal wavelengths and from a plurality of viewpoints; and
a computer coupled to the plurality of cameras and configured to process image data from the plurality of images, the computer configured and operable to:
generating a plurality of integrated color image data sets, i.e. one image data set for each different spectrum and for each camera; wherein for generating a color image dataset pixels from said image are selected comprising intensities between 16 and 254 based on a range of 0 to 255,
classifying the serum or plasma fraction of said sample, and
classifying interferents:
whether present in the serum or plasma fraction, or
Is not present in the serum or plasma fraction.
Applications Claiming Priority (3)
| Application Number | Priority Date | Filing Date | Title |
|---|---|---|---|
| US201662288375P | 2016-01-28 | 2016-01-28 | |
| US62/288375 | 2016-01-28 | ||
| PCT/US2017/014775 WO2017132169A1 (en) | 2016-01-28 | 2017-01-24 | Methods and apparatus for detecting an interferent in a specimen |
Publications (2)
| Publication Number | Publication Date |
|---|---|
| CN108738338A CN108738338A (en) | 2018-11-02 |
| CN108738338B true CN108738338B (en) | 2022-01-14 |
Family
ID=59398664
Family Applications (1)
| Application Number | Title | Priority Date | Filing Date |
|---|---|---|---|
| CN201780008828.3A Active CN108738338B (en) | 2016-01-28 | 2017-01-24 | Method and apparatus for detecting interferents in a sample |
Country Status (6)
| Country | Link |
|---|---|
| US (1) | US10816538B2 (en) |
| EP (1) | EP3408651B1 (en) |
| JP (1) | JP6791972B2 (en) |
| CN (1) | CN108738338B (en) |
| HK (1) | HK1257096A1 (en) |
| WO (1) | WO2017132169A1 (en) |
Families Citing this family (28)
| Publication number | Priority date | Publication date | Assignee | Title |
|---|---|---|---|---|
| CN108139320B (en) * | 2015-02-17 | 2023-12-22 | 西门子医疗保健诊断公司 | Model-based method and device for classifying interferents in a sample |
| US10816538B2 (en) | 2016-01-28 | 2020-10-27 | Siemens Healthcare Diagnostics Inc. | Methods and apparatus for detecting an interferent in a specimen |
| WO2017132167A1 (en) | 2016-01-28 | 2017-08-03 | Siemens Healthcare Diagnostics Inc. | Methods and apparatus adapted to identify a specimen container from multiple lateral views |
| JP6870826B2 (en) | 2016-01-28 | 2021-05-12 | シーメンス・ヘルスケア・ダイアグノスティックス・インコーポレーテッドSiemens Healthcare Diagnostics Inc. | Methods and devices configured to quantify samples from lateral multi-viewpoints |
| EP3408646A4 (en) | 2016-01-28 | 2019-03-06 | Siemens Healthcare Diagnostics Inc. | Methods and apparatus for characterizing a specimen container and specimen |
| WO2017186705A1 (en) * | 2016-04-27 | 2017-11-02 | Ventana Medical Systems, Inc. | System and method for real-time volume control |
| CN109791161A (en) | 2016-07-21 | 2019-05-21 | 西门子医疗保健诊断公司 | Automatic Clinical Analyzer system and method |
| US11035870B2 (en) | 2016-07-25 | 2021-06-15 | Siemens Healthcare Diagnostics Inc. | Systems, methods and apparatus for identifying a specimen container cap |
| KR102586862B1 (en) | 2016-10-28 | 2023-10-11 | 베크만 컬터, 인코포레이티드 | Material Readiness Assessment System |
| EP3538839B1 (en) | 2016-11-14 | 2021-09-29 | Siemens Healthcare Diagnostics Inc. | Methods, apparatus, and quality check modules for detecting hemolysis, icterus, lipemia, or normality of a specimen |
| EP3538870A4 (en) | 2016-11-14 | 2019-11-27 | Siemens Healthcare Diagnostics Inc. | Methods and apparatus for characterizing a specimen using pattern illumination |
| JP7055818B2 (en) | 2017-04-13 | 2022-04-18 | シーメンス・ヘルスケア・ダイアグノスティックス・インコーポレーテッド | HILIN evaluation method and device using convolutional neural network |
| EP3610269A4 (en) | 2017-04-13 | 2020-04-22 | Siemens Healthcare Diagnostics Inc. | Methods and apparatus for determining label count during specimen characterization |
| WO2018191295A1 (en) | 2017-04-13 | 2018-10-18 | Siemens Healthcare Diagnostics Inc. | Methods and apparatus for label compensation during specimen characterization |
| CN110869740A (en) | 2017-07-19 | 2020-03-06 | 美国西门子医学诊断股份有限公司 | Method and apparatus for sample characterization using hyperspectral imaging |
| CN110914667A (en) | 2017-07-19 | 2020-03-24 | 美国西门子医学诊断股份有限公司 | Stray light compensation method and device for characterizing samples |
| US11657593B2 (en) | 2017-07-28 | 2023-05-23 | Siemens Healthcare Diagnostics Inc. | Deep learning volume quantifying methods and apparatus |
| JP7324757B2 (en) * | 2018-01-10 | 2023-08-10 | シーメンス・ヘルスケア・ダイアグノスティックス・インコーポレイテッド | Method and Apparatus for Biofluid Specimen Characterization Using Reduced-Training Neural Networks |
| US11927736B2 (en) | 2018-06-15 | 2024-03-12 | Siemens Healthcare Diagnostics Inc. | Methods and apparatus for fine-grained HIL index determination with advanced semantic segmentation and adversarial training |
| US11386551B2 (en) * | 2018-11-08 | 2022-07-12 | Perkinelmer Health Sciences, Inc. | Method and apparatus for buffy coat imaging |
| US10726543B2 (en) * | 2018-11-27 | 2020-07-28 | General Electric Company | Fluorescent penetrant inspection system and method |
| IT201900006738A1 (en) * | 2019-05-10 | 2020-11-10 | Inpeco Holding Ltd | DEVICE AND PROCEDURE FOR SCREENING OF A BIOLOGICAL SAMPLE |
| EP3933409A1 (en) * | 2020-07-03 | 2022-01-05 | F. Hoffmann-La Roche AG | Photometric interference determination |
| WO2022266628A1 (en) * | 2021-06-15 | 2022-12-22 | Siemens Healthcare Diagnostics Inc. | Apparatus and methods of monitoring items in diagnostic laboratory systems |
| CN113449804B (en) * | 2021-07-09 | 2023-03-10 | 曲阜师范大学 | Method for determining blood category and related equipment |
| CN114813590A (en) * | 2022-06-30 | 2022-07-29 | 深圳市帝迈生物技术有限公司 | Sample detection method, sample analyzer and control device thereof |
| CN115452744A (en) * | 2022-09-15 | 2022-12-09 | 深圳市卓润生物科技有限公司 | Whole blood volume measurement method |
| CN116908428B (en) * | 2023-07-27 | 2024-02-13 | 耐优生物技术(上海)有限公司 | Plasma quality control method and application thereof |
Citations (5)
| Publication number | Priority date | Publication date | Assignee | Title |
|---|---|---|---|---|
| WO2003031954A1 (en) * | 2001-10-08 | 2003-04-17 | Inlight Solutions, Inc. | Classification of samples |
| CN100516876C (en) * | 2002-11-21 | 2009-07-22 | 惠氏公司 | Methods for diagnosing RCC and other solid tumors |
| JP2010185718A (en) * | 2009-02-10 | 2010-08-26 | Beckman Coulter Inc | Reaction card |
| CN102792124A (en) * | 2009-10-17 | 2012-11-21 | 荷马里光电子公司 | Enhanced imaging method and apparatus |
| CN103477197A (en) * | 2011-01-21 | 2013-12-25 | 提拉诺斯公司 | Systems and methods for sample use maximization |
Family Cites Families (29)
| Publication number | Priority date | Publication date | Assignee | Title |
|---|---|---|---|---|
| JP5161052B2 (en) * | 2008-12-04 | 2013-03-13 | オリンパス株式会社 | Microscope system, specimen observation method and program |
| JPH07280814A (en) * | 1994-04-14 | 1995-10-27 | Hitachi Ltd | Automatic specimen inspection system |
| US20050037505A1 (en) * | 2000-05-11 | 2005-02-17 | James Samsoondar | Spectroscopic method and apparatus for analyte measurement |
| US7126630B1 (en) * | 2001-02-09 | 2006-10-24 | Kujin Lee | Method and apparatus for omni-directional image and 3-dimensional data acquisition with data annotation and dynamic range extension method |
| AU2002245537B2 (en) | 2001-02-23 | 2007-12-20 | Genicon Sciences Corporation | Methods for providing extended dynamic range in analyte assays |
| TWI242206B (en) * | 2001-06-22 | 2005-10-21 | Fuji Photo Film Co Ltd | Optical information recording medium |
| AU2003235627A1 (en) | 2002-01-19 | 2003-07-30 | Pvt Probenverteiltechnik Gmbh | Method and device for the analysis of body fluids |
| JP3778355B2 (en) * | 2002-07-04 | 2006-05-24 | アロカ株式会社 | Sample analyzer |
| US7611839B2 (en) * | 2002-11-21 | 2009-11-03 | Wyeth | Methods for diagnosing RCC and other solid tumors |
| US8101431B2 (en) | 2004-02-27 | 2012-01-24 | Board Of Regents, The University Of Texas System | Integration of fluids and reagents into self-contained cartridges containing sensor elements and reagent delivery systems |
| JP2005345370A (en) | 2004-06-04 | 2005-12-15 | Aloka Co Ltd | Interface detecting device and method, and volume measuring device and method |
| US7616256B2 (en) | 2005-03-21 | 2009-11-10 | Dolby Laboratories Licensing Corporation | Multiple exposure methods and apparatus for electronic cameras |
| US7826652B2 (en) * | 2006-12-19 | 2010-11-02 | Cytyc Corporation | Method for forming an optimally exposed image of cytological specimen |
| CN102027368B (en) | 2008-03-21 | 2014-02-26 | 艾博特健康公司 | Method and apparatus for determining red blood cell indices of a blood sample utilizing the intrinsic pigmentation of hemoglobin contained within the red blood cells |
| AU2010282784C1 (en) * | 2009-08-13 | 2014-03-13 | Siemens Healthcare Diagnostics Inc. | Methods and apparatus for ascertaining interferents and physical dimensions in liquid samples and containers to be analyzed by a clinical analyzer |
| US9522396B2 (en) * | 2010-12-29 | 2016-12-20 | S.D. Sight Diagnostics Ltd. | Apparatus and method for automatic detection of pathogens |
| US9646375B2 (en) * | 2011-07-09 | 2017-05-09 | Gauss Surgical, Inc. | Method for setting a blood transfusion parameter |
| JP5474903B2 (en) | 2011-09-28 | 2014-04-16 | あおい精機株式会社 | Pre-test processing apparatus, pre-test processing method, and sample processing apparatus |
| US9927450B2 (en) * | 2013-03-08 | 2018-03-27 | Siemens Healthcare Diagnostics Inc. | Tube characterization station |
| JP6143584B2 (en) * | 2013-07-04 | 2017-06-07 | 株式会社日立ハイテクノロジーズ | Detector and biological sample analyzer |
| CN108139320B (en) | 2015-02-17 | 2023-12-22 | 西门子医疗保健诊断公司 | Model-based method and device for classifying interferents in a sample |
| US10267813B1 (en) * | 2015-12-31 | 2019-04-23 | Cerner Innovation, Inc. | Monitoring specimen integrity in automated blood sample processing system |
| US10816538B2 (en) | 2016-01-28 | 2020-10-27 | Siemens Healthcare Diagnostics Inc. | Methods and apparatus for detecting an interferent in a specimen |
| US10746665B2 (en) | 2016-01-28 | 2020-08-18 | Siemens Healthcare Diagnostics Inc. | Methods and apparatus for classifying an artifact in a specimen |
| JP6870826B2 (en) | 2016-01-28 | 2021-05-12 | シーメンス・ヘルスケア・ダイアグノスティックス・インコーポレーテッドSiemens Healthcare Diagnostics Inc. | Methods and devices configured to quantify samples from lateral multi-viewpoints |
| EP3408641B1 (en) | 2016-01-28 | 2021-05-26 | Siemens Healthcare Diagnostics Inc. | Methods and apparatus for multi-view characterization |
| CN108770364A (en) | 2016-01-28 | 2018-11-06 | 西门子医疗保健诊断公司 | The method and apparatus that sample container and/or sample are imaged for using multiple exposures |
| EP3408646A4 (en) | 2016-01-28 | 2019-03-06 | Siemens Healthcare Diagnostics Inc. | Methods and apparatus for characterizing a specimen container and specimen |
| WO2017132167A1 (en) | 2016-01-28 | 2017-08-03 | Siemens Healthcare Diagnostics Inc. | Methods and apparatus adapted to identify a specimen container from multiple lateral views |
-
2017
- 2017-01-24 US US16/072,423 patent/US10816538B2/en active Active
- 2017-01-24 EP EP17744780.2A patent/EP3408651B1/en active Active
- 2017-01-24 WO PCT/US2017/014775 patent/WO2017132169A1/en active Application Filing
- 2017-01-24 JP JP2018539287A patent/JP6791972B2/en active Active
- 2017-01-24 CN CN201780008828.3A patent/CN108738338B/en active Active
-
2018
- 2018-12-20 HK HK18116346.7A patent/HK1257096A1/en unknown
Patent Citations (5)
| Publication number | Priority date | Publication date | Assignee | Title |
|---|---|---|---|---|
| WO2003031954A1 (en) * | 2001-10-08 | 2003-04-17 | Inlight Solutions, Inc. | Classification of samples |
| CN100516876C (en) * | 2002-11-21 | 2009-07-22 | 惠氏公司 | Methods for diagnosing RCC and other solid tumors |
| JP2010185718A (en) * | 2009-02-10 | 2010-08-26 | Beckman Coulter Inc | Reaction card |
| CN102792124A (en) * | 2009-10-17 | 2012-11-21 | 荷马里光电子公司 | Enhanced imaging method and apparatus |
| CN103477197A (en) * | 2011-01-21 | 2013-12-25 | 提拉诺斯公司 | Systems and methods for sample use maximization |
Also Published As
| Publication number | Publication date |
|---|---|
| CN108738338A (en) | 2018-11-02 |
| WO2017132169A1 (en) | 2017-08-03 |
| JP6791972B2 (en) | 2020-11-25 |
| JP2019511700A (en) | 2019-04-25 |
| HK1257096A1 (en) | 2019-10-11 |
| US20180372715A1 (en) | 2018-12-27 |
| EP3408651B1 (en) | 2024-01-10 |
| US10816538B2 (en) | 2020-10-27 |
| EP3408651A1 (en) | 2018-12-05 |
| EP3408651A4 (en) | 2018-12-12 |
Similar Documents
| Publication | Publication Date | Title |
|---|---|---|
| CN108738338B (en) | Method and apparatus for detecting interferents in a sample | |
| EP3538839B1 (en) | Methods, apparatus, and quality check modules for detecting hemolysis, icterus, lipemia, or normality of a specimen | |
| US11313869B2 (en) | Methods and apparatus for determining label count during specimen characterization | |
| EP3408652B1 (en) | Methods and apparatus for classifying an artifact in a specimen | |
| EP3408640B1 (en) | Methods and apparatus adapted to identify a specimen container from multiple lateral views | |
| US11238318B2 (en) | Methods and apparatus for HILN characterization using convolutional neural network | |
| CN108738336B (en) | Method and apparatus for multi-view characterization | |
| CN108139320B (en) | Model-based method and device for classifying interferents in a sample | |
| US11538159B2 (en) | Methods and apparatus for label compensation during specimen characterization | |
| US11852642B2 (en) | Methods and apparatus for HILN determination with a deep adaptation network for both serum and plasma samples |
Legal Events
| Date | Code | Title | Description |
|---|---|---|---|
| PB01 | Publication | ||
| PB01 | Publication | ||
| SE01 | Entry into force of request for substantive examination | ||
| SE01 | Entry into force of request for substantive examination | ||
| REG | Reference to a national code |
Ref country code: HK Ref legal event code: DE Ref document number: 1257096 Country of ref document: HK |
|
| GR01 | Patent grant | ||
| GR01 | Patent grant |