WO2017002820A1 - Data flow control device and data flow control method - Google Patents
Data flow control device and data flow control method Download PDFInfo
- Publication number
- WO2017002820A1 WO2017002820A1 PCT/JP2016/069174 JP2016069174W WO2017002820A1 WO 2017002820 A1 WO2017002820 A1 WO 2017002820A1 JP 2016069174 W JP2016069174 W JP 2016069174W WO 2017002820 A1 WO2017002820 A1 WO 2017002820A1
- Authority
- WO
- WIPO (PCT)
- Prior art keywords
- index
- data
- application
- causal
- data flow
- Prior art date
Links
Images


Classifications
-
- G—PHYSICS
- G06—COMPUTING; CALCULATING OR COUNTING
- G06F—ELECTRIC DIGITAL DATA PROCESSING
- G06F17/00—Digital computing or data processing equipment or methods, specially adapted for specific functions
- G06F17/10—Complex mathematical operations
- G06F17/18—Complex mathematical operations for evaluating statistical data, e.g. average values, frequency distributions, probability functions, regression analysis
-
- G—PHYSICS
- G06—COMPUTING; CALCULATING OR COUNTING
- G06F—ELECTRIC DIGITAL DATA PROCESSING
- G06F16/00—Information retrieval; Database structures therefor; File system structures therefor
- G06F16/20—Information retrieval; Database structures therefor; File system structures therefor of structured data, e.g. relational data
- G06F16/22—Indexing; Data structures therefor; Storage structures
- G06F16/2228—Indexing structures
- G06F16/2272—Management thereof
-
- G—PHYSICS
- G06—COMPUTING; CALCULATING OR COUNTING
- G06F—ELECTRIC DIGITAL DATA PROCESSING
- G06F13/00—Interconnection of, or transfer of information or other signals between, memories, input/output devices or central processing units
-
- G—PHYSICS
- G06—COMPUTING; CALCULATING OR COUNTING
- G06F—ELECTRIC DIGITAL DATA PROCESSING
- G06F16/00—Information retrieval; Database structures therefor; File system structures therefor
- G06F16/20—Information retrieval; Database structures therefor; File system structures therefor of structured data, e.g. relational data
- G06F16/28—Databases characterised by their database models, e.g. relational or object models
- G06F16/284—Relational databases
- G06F16/288—Entity relationship models
-
- G—PHYSICS
- G06—COMPUTING; CALCULATING OR COUNTING
- G06F—ELECTRIC DIGITAL DATA PROCESSING
- G06F16/00—Information retrieval; Database structures therefor; File system structures therefor
- G06F16/90—Details of database functions independent of the retrieved data types
- G06F16/901—Indexing; Data structures therefor; Storage structures
- G06F16/9024—Graphs; Linked lists
-
- H—ELECTRICITY
- H04—ELECTRIC COMMUNICATION TECHNIQUE
- H04L—TRANSMISSION OF DIGITAL INFORMATION, e.g. TELEGRAPHIC COMMUNICATION
- H04L67/00—Network arrangements or protocols for supporting network services or applications
- H04L67/01—Protocols
- H04L67/10—Protocols in which an application is distributed across nodes in the network
- H04L67/1097—Protocols in which an application is distributed across nodes in the network for distributed storage of data in networks, e.g. transport arrangements for network file system [NFS], storage area networks [SAN] or network attached storage [NAS]
-
- H—ELECTRICITY
- H04—ELECTRIC COMMUNICATION TECHNIQUE
- H04M—TELEPHONIC COMMUNICATION
- H04M11/00—Telephonic communication systems specially adapted for combination with other electrical systems
-
- H—ELECTRICITY
- H04—ELECTRIC COMMUNICATION TECHNIQUE
- H04W—WIRELESS COMMUNICATION NETWORKS
- H04W4/00—Services specially adapted for wireless communication networks; Facilities therefor
- H04W4/30—Services specially adapted for particular environments, situations or purposes
- H04W4/38—Services specially adapted for particular environments, situations or purposes for collecting sensor information
-
- H—ELECTRICITY
- H04—ELECTRIC COMMUNICATION TECHNIQUE
- H04W—WIRELESS COMMUNICATION NETWORKS
- H04W4/00—Services specially adapted for wireless communication networks; Facilities therefor
- H04W4/70—Services for machine-to-machine communication [M2M] or machine type communication [MTC]
Definitions
- the present invention relates to a technique for controlling a data flow that provides data obtained in a device such as a sensor to an application that uses the data.
- M2M Machine to Machine
- M2M cloud Such an M2M technology realized on a cloud computing environment is called an M2M cloud.
- This provides basic functions required for M2M, such as services such as data collection and storage, processing, and analysis as applications on the cloud, making them available from anywhere. Reliability and completeness can be improved by collective management of data.
- the user has an advantage that the collected data and computer resources can be used as much as necessary. Therefore, it is possible to analyze big data and obtain added value without building a system individually, and applications in a wide range of fields are expected.
- Patent Document 1 a technique called a sensor network has been studied. This is because sensor devices with sensing and communication functions (hereinafter also simply referred to as “sensors”) are installed in various locations and industrial facilities, and networking them to collect, manage, and seamlessly sense data. It can be used.
- sensors sensor devices with sensing and communication functions
- sensors are installed to collect data that the owners themselves need. Therefore, it is often not used except when the owner collects data (the sensor itself is not operating, or sensing data is not used even if the sensor is operating). For this reason, the distribution of sensing data is low, and no matter how meaningful the data is for a third party, the sensor owner himself has only analyzed and used it. As a result, redundant investment of equipment and network congestion due to communication with sensors installed by each person have been invited.
- IoT Internet of Things
- sensing data should be collected from what devices and used to control the application in order to achieve the purpose of the application. It's not easy.
- One reason is that in IoT, all sensors are connected to a network, and a huge number and various types of sensing data can be used.
- the second reason is that various events and elements are complexly related in the real world, so they are appropriately modeled, and sensing data (cause) that has a strong causal relationship with the purpose (result) of the application. It is extremely difficult to identify.
- the network configuration that is, available sensors and data that can be acquired
- the network configuration changes from moment to moment due to sensor stoppage, failure, or movement.
- sensing data as defined may not be obtained.
- the sensor network has been described as an example heretofore, the same problem may occur in the case of an actuator (controller) network.
- Sensors and “actuators (controllers)” have some difference in whether they “detect (acquire) the state” or “change the state”, but they perform some action on the target area within a predetermined range. The point is common.
- control data instead of sensing data obtained from a sensor, control data given to the actuator becomes a distribution target.
- the term “device” is used as a concept including “sensor” and “actuator”.
- the term “device network” is used as a concept including “sensor network” and “actuator network”. It is possible that both a sensor and an actuator are connected to the device network.
- the present invention has been made in view of the above circumstances, and an object thereof is to provide a technique for facilitating the use of data in a device network.
- the invention according to claim 1 is a data flow control device for controlling a data flow, which provides data obtained in at least one of a plurality of devices to an application using the data.
- Storing a causal network representing a causal relationship between the plurality of indices, including at least a plurality of device indices that are data obtained in each of the plurality of devices and a target index that is an index controlled or predicted by the application When a data request is received from the causal network storage unit and the application, at least one device index having a causal relationship with the purpose index of the application is selected from the plurality of device indices based on the causal network.
- a device index selector Data obtained in the device corresponding to the serial selected device indicators, as provided to the application, a data flow control apparatus characterized by comprising: a data flow control unit for controlling the data flow, the.
- the application when an application purpose (an index that the application controls or predicts) is given, data having a causal relationship with the purpose is automatically provided from the corresponding device to the application. Therefore, even if there is no knowledge of what devices exist in the device network and what data can be acquired, and what data should be referred to in order to perform the desired control and prediction, the application Can be designed and developed. Therefore, as compared with the prior art, the design and development of an application that uses data in the device network is facilitated, and the use and distribution of data in the device network is promoted.
- an application purpose an index that the application controls or predicts
- the causal relationship includes information on causal intensity between two indices and a delay time required for the influence of one of the two indices to propagate to the other index.
- index) can be evaluated.
- the invention according to claim 3 is the data flow control device according to claim 2, wherein the causal relationship is defined using movement entropy.
- the causal relationship accompanied by a time delay (propagation delay) and its causal intensity
- the device index selection unit preferentially selects a device index having a short distance from the target index in the causal network, and if the distance is the same, the device having the higher causal intensity 4.
- the invention according to claim 5 is characterized in that the device index selection unit confirms whether the device is active or inactive, and excludes the device index corresponding to the inactive device from the selection target. 5.
- the data flow control device according to any one of 1 to 4.
- a device that is in an inactive state (a state in which data cannot be acquired) due to some cause, such as failure, stop, or movement, is excluded from selection targets. Therefore, it is possible to automatically select an appropriate device (a device that can acquire data having a causal relationship with an application purpose index) from currently active devices, and to improve the robustness of the system.
- the invention according to claim 6 is a data flow control method for controlling a data flow, which provides data obtained in at least one of a plurality of devices to an application that uses the data.
- a plurality of indicators including at least a plurality of device indicators that are data obtained in each of the plurality of devices and a target indicator that is an indicator that is controlled or predicted by the application when a data request is received from the application Selecting at least one device index having a causal relationship with the purpose index of the application from the plurality of device indices based on a causal network representing a causal relationship between the plurality of device indices, and corresponding to the selected device index Data obtained on the device ,
- a data flow control method characterized by comprising the steps of: controlling data flow.
- an application purpose an index that the application controls or predicts
- data having a cause and effect relationship with the purpose is automatically provided from the corresponding device to the application. Therefore, even if there is no knowledge of what devices exist in the device network and what data can be acquired, and what data should be referred to in order to perform the desired control and prediction, the application Can be designed and developed. Therefore, as compared with the prior art, the design and development of an application that uses data in the device network is facilitated, and the use and distribution of data in the device network is promoted.
- the invention according to claim 7 is a program that causes a computer to execute each step of the data flow control method according to claim 6.
- an application purpose an index controlled or predicted by the application
- data having a causal relationship with the purpose is automatically provided from the corresponding device to the application. Therefore, even if there is no knowledge of what devices exist in the device network and what data can be acquired, and what data should be referred to in order to perform the desired control and prediction, the application Can be designed and developed. Therefore, as compared with the prior art, the design and development of an application that uses data in the device network is facilitated, and the use and distribution of data in the device network is promoted.
- the invention according to claim 8 is a data stream readable by an information processing apparatus that manages a sensor that outputs sensing data, and information that specifies an application that uses the sensing data, and the application controls or predicts Information for identifying a sensor selected to output sensing data having a causal relationship with a target index that is an index, and causal relationship information between the sensing data obtained by the selected sensor and the target index, It is a control command data stream characterized by including. According to the invention of claim 8, it is possible to realize a data flow in which sensing data having a causal relationship with an application purpose (an index controlled or predicted by the application) is provided from the corresponding sensor to the application.
- the causal relationship information includes information on causal intensity between the sensing data and the objective index, information on a delay time required for the influence of the sensing data to propagate to the objective index, and
- the present invention can be understood as a data flow control device having at least a part of the above-described configuration or function.
- the present invention can also be understood as a device network system, a sensor network system, and an actuator network system having a data flow control device.
- the present invention also provides a data flow control method including at least a part of the above processing, a program for causing a computer to execute such a method, or a computer-readable record in which such a program is recorded non-temporarily. It can also be understood as a medium.
- the present invention can also be understood as a control command data stream for controlling the data flow.
- the use of data in the device network can be made easier.
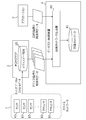
- FIG. 1 is a block diagram showing functions related to generation of a causal network of a device network system.
- FIG. 2 is a block diagram showing functions related to data flow control of the device network system.
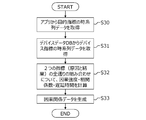
- FIG. 3 is a flowchart of the causal network generation process.
- FIG. 4 is a flowchart of the causal network generation process.
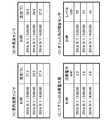
- FIG. 5 is an example of time series data of the objective index.
- 6A to 6D are examples of time series data of device indices.
- FIG. 7 is an example of causal relationship data.
- FIG. 8 is an example of a causal network.
- FIG. 9 is a flowchart of device index selection processing and data flow control processing.
- FIG. 10 is a diagram schematically illustrating device index selection based on a causal network.
- FIG. 11 is a diagram schematically showing device control based on a causal network.
- FIG. 1 is a block diagram showing functions related to generation of a causal network of the device network system
- FIG. 2 is a block diagram showing functions related to data flow control of the device network system.
- the device network system is a mechanism that can provide data acquired by a large number of devices to applications that use it online and in real time.
- the device network system mainly includes a device network 1, an M2M cloud server 2, an application 3, a data flow control device 4, and the like.
- the device network 1 is a network constituted by a large number of devices 10.
- the number, type, installation position, network configuration, communication method, and the like of the device 10 can be arbitrarily designed and are not particularly limited.
- Each device 10 can communicate with the M2M cloud server 2, the application 3, and the data flow control device 4 via a wide area network such as the Internet.
- Each device 10 is a device that acts on a target area defined in space or space-time, and can be roughly classified into “sensor” and “actuator”.
- space is a region defined by two dimensions (x, y) or three dimensions (x, y, z)
- time space is a dimension of “time (t)” in “space”. That is, an area defined by three dimensions (x, y; t) or four dimensions (x, y, z; t).
- the term “sensor” is used to mean a device that detects (acquires) the state of the target region
- actuator is used to mean a device that changes the state of the target region.
- the senor examples include an image sensor (camera), a temperature sensor, a humidity sensor, an illuminance sensor, a force sensor, a sound sensor, an RFID sensor, an infrared sensor, an attitude sensor, a rainfall sensor, a radioactivity sensor, and a gas sensor.
- Any type of sensor can be used in the system.
- Various actuators such as motors, solenoids, controllers, robots, lighting, speakers, displays, digital signage, and air conditioning are applicable, and any type of actuator can be used in this system.
- devices including both sensors (image sensors and the like) and actuators (display, speakers, and the like) such as mobile phones, smartphones, and slate terminals (tablet PCs).
- Various types of devices can be mixed in the device network 1.
- the M2M cloud server 2 manages information on each device 10 constituting the device network 1, data acquired by each device 10, and the like. This is a server system provided to 3).
- the M2M cloud server 2 has a device data DB 20 that is a database for managing the device 10.
- device-related information for example, device attribute information (device type, device position / posture, device owner, device ID, network address, operation history, etc.), target region (sensing region) Or attribute information (position range, time range, etc.) of the actuator, attribute information (type, physical attribute, object ID, etc.) of the object (sensing object or object on which the actuator acts), operation Attribute information (controllable items, sensing sampling specifications, quantization specifications, etc.), data attributes (data manager or owner, usage range (for example, limited to academic use, commercial use prohibited, etc.), access authority range , Data type, accuracy, unit system, reliability, usable range, consideration for use, Use possible time, such as data ID) and the like are registered.
- the device data DB 20 stores sensing data (sensor measurement values) in the case of sensors and control data (actuator control values) in the case of actuators as data acquired by the device. Sensing data and control data are preferably stored not only the latest data but also time-series data for a predetermined period.
- the application 3 is a device or software module that uses data obtained from the device network 1.
- the application 3 one that controls a control target based on data obtained from the device network 1, or one that predicts an unknown or future state based on data obtained from the device network 1 is assumed.
- any application such as an application that improves office productivity, an application that suppresses or predicts energy consumption in a factory, or an application that predicts traffic congestion may be used.
- the data flow control device 4 performs matching of conditions between the device and the application, so that data necessary for the application to achieve the intended purpose (control or prediction) is provided from an appropriate device. It has a function to control the flow.
- Patent Document 3 Conventional systems (see Patent Document 3) have adopted a mechanism in which application-side metadata that defines the specifications of data required by an application is issued and a device that satisfies the required specifications is searched.
- an application developer or a designer is responsible for what kind of device exists in the device network 1 and what kind of data can be acquired, and further, intended control and prediction are performed. It was necessary to understand what kind of data should be referred to, and advanced development skills were required.
- it is not easy to know what kind of data should be referred to in order to perform the target control and prediction such as the application for the purpose of “improvement of office productivity” described above. . Even problems that seem simple at first glance may actually involve various events in the real world.
- the data flow control device 4 performs (1) data obtained by each of the plurality of devices 10 (referred to as “device index”) and an index (“target index”) that the application 3 controls or predicts.
- a function that generates a causal network that represents a causal relationship between a plurality of indices see FIG. 1
- a device index that has a causal relationship with a target index A function of controlling the data flow (see FIG. 2) is performed so that data of the selected device index is provided to the application 3.
- the “index controlled by the application” means an index representing the state of the controlled object controlled by the application, for example, an index that can be observed by measuring the state and output of the controlled object with a sensor or the like. .
- the number of processes per hour, sales, and the like can be used as target indices as indices that directly or indirectly represent productivity.
- the “index predicted by the application” means an index that the application predicts or estimates by calculation.
- the target index in the case of an application that predicts traffic jams, the time expected to pass the road, the length of traffic jams, and the like can be used as the target index. Details will be described later.
- the M2M cloud server 2, the device for executing the application 3, and the data flow control device 4 are all general-purpose computers having a CPU (Central Processing Unit), a memory, an auxiliary storage device, a communication IF, an input device, a display device, and the like. Can be configured. The functions and processes described later are realized by the CPU reading and executing a program stored in the auxiliary storage device.
- a computer a personal computer, a smart phone, a portable information terminal, etc. may be sufficient, and a server computer may be sufficient. Further, the distributed processing may be performed by a plurality of computers instead of a single computer.
- FIGS. 3 and 4 are flowcharts of the causal network generation processing
- FIG. 5 is an example of time-series data of a target index
- FIGS. 6A to 6D are examples of time-series data of a device index
- FIG. 7 is an example of causal relationship data
- FIG. 8 is an example of a causal network.
- an application 3 that improves office productivity is taken as an example.
- the causal network generation unit 40 of the data flow control device 4 acquires time-series data of the target index from the application 3 (step S30).
- FIG. 5 shows an example of time series data of the objective index.
- an index value (no unit) indicating the productivity of the office every hour is given.
- This time-series data is data measured and recorded by the application 3 over a predetermined period, and for example, the number of processes per hour and sales can be used as a target index.
- the period of the time series data is arbitrary, but considering the reliability of the causal relationship estimation, it is preferable to obtain time series data for at least several days, preferably several weeks to several months.
- the causal network generation unit 40 acquires the time series data of the device index of each device 10 from the device data DB 20 of the M2M cloud server 2 (step S31). For example, time-series data of room temperature measured by a temperature sensor installed in the office (FIG. 6A), time-series data of outside air temperature measured by a temperature sensor installed outside the office (FIG. 6B), Various device indices such as time-series data (FIG. 6C) of the power consumption of the air conditioner and noise level time-series data (FIG. 6D) measured by a noise sensor installed in the office may be acquired.
- control value of the air conditioner in the office temperature setting value
- control value of the office ceiling lighting brightness setting
- measured value of the illuminance sensor set in the office the power consumption of the entire office
- sensing data or control data such as the office LAN network load and the number of office printers and copiers to be printed may be acquired.
- step S31 is performed. Only the time series data of the device index of some devices 10 may be acquired.
- the causal network generation unit 40 calculates the causal intensity, the correlation coefficient, and the delay time for all combinations of the two indices (cause and result) based on the time series data of the objective index and the device index (Ste S32). Details of the processing in step S32 are shown in the flowchart of FIG. Here, it is assumed that m indices E1 to Em are obtained by combining the target index and the device index.
- the causal network generation unit 40 selects a pair of indices (Ei, Ej) from the m indices E1 to Em (step S41), and performs the processing described below.
- Ei represents a cause index
- Ej represents a result index
- the causal network generation unit 40 sets the delay time s to the minimum value smin (step S42). And the causal network production
- the movement entropy TEij is used as the causal intensity.
- Movement entropy is a measure or method for evaluating the causal relationship in consideration of the propagation time (delay time) between two indices X and Y, and the average amount of information moved from index X to index Y after time s.
- (Entropy) is an idea that the cause index X is regarded as the strength of influence (that is, the causal strength) of the effect index Y after the time s.
- the index X causes the index Y.
- the movement entropy TE XY (s) related to the delay time s can be calculated by the following equation.
- P (a, b) represents a joint probability density variable of P (a) and P (b)
- [*] represents a time average of *.
- the movement entropy can be calculated by giving time series data of two indices X and Y and a delay time s.
- TE YX (s) is calculated by replacing the value of TE XY (s) with the cause and effect. )
- TE XY (s)> TE YX (s) is established. Therefore, by evaluating the magnitude relationship between the values of TE XY (s) and TE YX (s), the existence of the causal relationship and the direction of the causality can be determined.
- the movement entropy in the reverse direction that is, the movement entropy TEji from the index Ej after time s to the index Ei is calculated. If the movement entropy in the reverse direction is larger (TEji> TEij) It may be determined that there is no causal relationship between the two indices (Ei, Ej) that is caused by the index Ei and the index Ej is a result, and the causal intensity is set to zero.
- the causal network generation unit 40 causes the cause index Ei and the result index after time s.
- a correlation coefficient of Ej is calculated (step S45). Since the calculation method of the correlation coefficient is well known, the description thereof is omitted.
- steps S43 to S45 are repeatedly executed while increasing the value of s by the time step width ⁇ s (step S46).
- step S47 When the process is completed up to the maximum delay time value smax (step S47), the next set of indices (Step S48; NO).
- step S48; YES When the causal relationship evaluation is completed for all combinations of the two indexes (step S48; YES), the process proceeds to step S33 in FIG.
- the causal network generation unit 40 generates causal relation data and stores it in the causal network storage unit 41 (step S33).
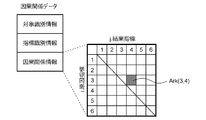
- FIG. 7 schematically shows an example of the data structure of the causal relationship data.
- the causal relationship data includes “target identification information” that is information for identifying the application 3 or the target index, and “index identification information” that is information for identifying which device each of the m indices is acquired from. ”And causal relationship information for each set of two indices.
- target identification information that is information for identifying the application 3 or the target index
- index identification information that is information for identifying which device each of the m indices is acquired from.
- ”And causal relationship information for each set of two indices In the object identification information, for example, the ID of the application 3 and the ID of the purpose index are described. In the index identification information, for example, an ID of a device corresponding to each index is described. However, the index 1 is an objective index, and the ID of the application 3 is described in the index identification information of the index 1.
- Causal relationship information is stored.
- a data description example of the causal relationship information Ark (3, 4) of the element number (3, 4) is shown below.
- Causality is intensity information representing the maximum causal intensity (movement entropy) between the cause index i and the result index j
- Delay is time information representing a delay time at which the causal intensity is maximum
- Co_CoEf is correlation information indicating the direction of change of the result index j with respect to increase or decrease of the cause index i (positive correlation or negative correlation).
- time is used as the unit of Delay
- a correlation coefficient between the cause index i and the result index j after Delay is used as the correlation information.
- FIG. 8 is an example of a causal network in which the causal relationship between indices is shown as a directed graph based on the causal relationship data in FIG.
- each node corresponds to an index
- an ID of the index and a device ID corresponding to the index are associated with each node.
- An arc linking two nodes indicates the causal relationship and the direction of the cause and effect between the two nodes (the root side of the arc is the cause node, and the arrow side is the result node).
- the thickness of the arc indicates the causal strength.
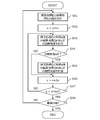
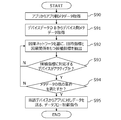
- FIG. 9 is a flowchart of device index selection processing and data flow control processing
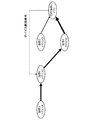
- FIG. 10 is a diagram schematically illustrating device index selection based on a causal network.
- the data flow control device 4 includes a device index selection unit 42 and a data flow control unit 43 as functions related to data flow control. It is assumed that the causal network storage unit 41 stores the causal relationship data already generated for the purpose index of the application 3.
- the device index selection unit 42 acquires application-side metadata as a data request from the application 3 (step S90).
- the application-side metadata includes, for example, an objective index ID, desired usage time, fee, and the like.
- the device index selection unit 42 acquires device-side metadata of each device 10 from the device data DB 20 of the M2M cloud server 2 (step S91).
- the device-side metadata describes information related to the device described above. If the number of devices 10 constituting the device network 1 is enormous and it is not practical from the viewpoint of data capacity and calculation cost to acquire metadata of all the devices 10, some of the devices 10 are obtained in step S91. Only the metadata of the device 10 may be acquired.
- the devices that are likely to be related are roughly narrowed down, and only the metadata of the narrowed-down devices is extracted from the M2M cloud server 2. (Neither the M2M cloud server 2 nor the data flow control device 4 may narrow down the devices).
- the device index selecting unit 42 selects a device index having a causal relationship with the target index based on the causal network (causal relationship data) stored in the causal network storage unit 41 (step S92).
- device index candidates are selected according to the following rules.
- the causal network priority is given to a device index that is close to the target index. “Distance” is defined as the number of arcs between two indices (nodes). (2) When the distances are the same, priority is given to an index with a higher causal intensity (however, an index whose causal intensity is less than a predetermined threshold is not selected). (3) When the distance and the causal intensity are the same, the index with the shorter delay time is prioritized.
- FIG. 10 is a partial network showing only the causal relationship that satisfies the condition that the causal intensity is larger than the threshold in the causal network of FIG.
- candidates are selected in the order of index 4 ⁇ index 2 ⁇ index 6 ⁇ index 3. Thereby, it is possible to preferentially select a device index having a strong relationship with the target index.
- the device index selection unit 42 checks whether or not the device corresponding to the candidate index selected in step S92 is active (step S93).
- Information indicating whether the device is active or inactive may be obtained directly from the device (for example, the status of the device is confirmed using a ping command or the like) or may be obtained from the M2M cloud server 2.
- the process returns to step S92 and the next candidate Select an indicator.
- the device index selection unit 42 selects other conditions (for example, consideration, It is confirmed whether the usage range, usage time, etc. match the request of the application 3 (step S94). If there is a condition that does not match (step S94; NO), the process returns to step S92 to select the next candidate index.
- a device index that has a cause-and-effect relationship with the target index is active in the device, and satisfies other conditions is selected.
- the data flow control unit 43 generates a data flow control command with the device 10 corresponding to the selected device index as the transmission source and the application 3 as the transmission destination, and transmits the data flow control command to the M2M cloud server 2. (Step S95).
- the data flow control unit 43 transmits a data flow control command from “device C” to “application 3” to the M2M cloud server 2.
- the data flow control command includes, for example, the following information. -ID of device C ⁇ ID of application 3 Causal relationship information Ark (6, 4) of index 6 (cause) acquired by device C ⁇ index 4 (result) -Causal relationship information Ark (4, 1) of index 4 (cause) ⁇ objective index 1 (result)
- M2M cloud server 2 serving as an information processing apparatus that manages devices such as sensors reads a data flow control command (also referred to as a control command data stream) issued (transmitted) from the data flow control unit 43, the next data flow Execute control.
- M2M cloud server 2 causal intensity at causal relationship information Ark (6, 4), the delay time, based on parameters such as correlation coefficients, prediction data of the index 4 from the data of indicator 6 (guess) prediction function is f 6 ⁇ 4 is generated.
- the M2M cloud server 2 generates a prediction function f 4 ⁇ 1 that predicts (estimates) the data of the target index 1 from the data of the index 4.
- the M2M cloud server 2 obtains the prediction data dp of the objective index 1 from the latest data dc acquired by the device C.
- dp f 4 ⁇ 1 (f 6 ⁇ 4 (dc))
- the data dp is transmitted to the application 3.
- the data dc and the causal relationship information Ark (6, 4) and Ark (4, 1), or the data dc and the prediction function f 6 ⁇ 4 and f 4 ⁇ 1 may be transmitted to the application 3, and the value dp of the target index 1 may be calculated from the data dc on the application 3 side.
- the causal network is used to select a device index to be provided to the application 3.
- the application 3 may also use the causal network to positively adjust the value of the target index. Is possible.
- device indexes 2, 4, 6, and 3 are selected as indexes that can affect the target index 1 as in the example of FIG.
- the value of the target index 1 is adjusted by sending a device control command to the actuator from the application 3 ( Increase or decrease).
- ⁇ Device C is the air conditioner and index 6 is the temperature setting value of the air conditioner
- ⁇ Device E is the indoor temperature sensor and index 4 is the temperature in the office
- the application 3 is the target index 1 ( In order to bring the office productivity value close to the target value, a system is built that sends a device control command to change the index 6 (temperature set value) of the device C (air conditioner) and changes the temperature in the office. it can.
- the device control command may be transmitted directly from the application 3 to the device C, or may be mediated by the M2M cloud server 2.
- the objective index can be positively adjusted by the application 3, and the degree of freedom of application development is increased.
- sensors and actuators are shown as examples of devices. However, not only real devices but also virtual devices (for example, combining sensing data obtained by a plurality of sensors to output one sensing data) Or the like).
- an example in which an actuator is controlled is shown as an example of device control.
- a sensor can be controlled (for example, adjustment of pan / tilt / zoom of a camera, change of a sampling period of measurement, etc.).
- Device network 10 Device 2: M2M cloud server 20: Device data DB 3: Application 4: Data flow control device 40: Causal network generation unit 41: Causal network storage unit 42: Device index selection unit 43: Data flow control unit
Landscapes
- Engineering & Computer Science (AREA)
- Theoretical Computer Science (AREA)
- Physics & Mathematics (AREA)
- General Physics & Mathematics (AREA)
- Databases & Information Systems (AREA)
- Data Mining & Analysis (AREA)
- General Engineering & Computer Science (AREA)
- Signal Processing (AREA)
- Software Systems (AREA)
- Computer Networks & Wireless Communication (AREA)
- Mathematical Analysis (AREA)
- Mathematical Physics (AREA)
- Pure & Applied Mathematics (AREA)
- Computational Mathematics (AREA)
- Mathematical Optimization (AREA)
- Bioinformatics & Computational Biology (AREA)
- Evolutionary Biology (AREA)
- Operations Research (AREA)
- Probability & Statistics with Applications (AREA)
- Bioinformatics & Cheminformatics (AREA)
- Algebra (AREA)
- Life Sciences & Earth Sciences (AREA)
- Data Exchanges In Wide-Area Networks (AREA)
- Computer And Data Communications (AREA)
- Telephonic Communication Services (AREA)
- Testing And Monitoring For Control Systems (AREA)
Abstract
A data flow control device having: a causal network storage unit that stores a causal network representing cause-and-effect relationships between multiple indicators, at least including multiple device indicators which are data obtained respectively in multiple devices and a target indicator which is an indicator controlled or predicted by an application; a device indicator selection unit that, when a data request is received from the application, selects from the multiple device indicators one or more device indicators having a causal relationship with the target indicator of the application, on the basis of the causal network; and a data flow control unit that controls the data flow such that the data obtained in the device corresponding to the selected device indicator is provided to the application.
Description
本発明は、センサなどのデバイスにおいて得られるデータを当該データを利用するアプリケーションへと提供するデータフローを制御するための技術に関する。
The present invention relates to a technique for controlling a data flow that provides data obtained in a device such as a sensor to an application that uses the data.
現在、M2Mクラウドと呼ばれるIT環境が注目を集めている。M2M(Machine to Machine)とは、様々な用途、大きさや性能を持つ機械同士がネットワーク上で情報をやり取りするシステムを指す。この情報を利用することで、それぞれの機械の適切な制御や、実社会の状況解析が可能になる。M2Mを支える無線通信技術の向上や機械の小型化、低廉化などにより、実用化への期待が高まっている。
Currently, an IT environment called M2M cloud is attracting attention. M2M (Machine to Machine) refers to a system in which machines having various uses, sizes, and performances exchange information on a network. By using this information, appropriate control of each machine and real-world situation analysis become possible. Expectations for practical use are increasing due to improvements in wireless communication technology supporting M2M, miniaturization of machines, and cost reduction.
このようなM2Mの技術をクラウドコンピューティング環境上で実現したものはM2Mクラウドと呼ばれる。これは、M2Mに必要な基本機能、例えばデータの収集蓄積から加工、分析のようなサービスをクラウド上のアプリケーションとして提供し、どこからでも利用可能にしたものである。データの一括管理によって信頼性や網羅性を高めることができる。また利用者にとっては、収集されたデータやコンピュータ資源を必要な分だけ利用できるメリットがある。そのため、個別にシステムを構築することなくビッグデータを解析して付加価値を得ることが可能であり、幅広い分野での応用が期待されている。
Such an M2M technology realized on a cloud computing environment is called an M2M cloud. This provides basic functions required for M2M, such as services such as data collection and storage, processing, and analysis as applications on the cloud, making them available from anywhere. Reliability and completeness can be improved by collective management of data. In addition, the user has an advantage that the collected data and computer resources can be used as much as necessary. Therefore, it is possible to analyze big data and obtain added value without building a system individually, and applications in a wide range of fields are expected.
また、特許文献1に示すように、センサネットワークと呼ばれる技術が検討されている。これは、センシング機能と通信機能をもつセンサデバイス(以下、単に「センサ」とも呼ぶ)を様々な場所や産業設備に設置し、それらをネットワーク化することで、センシングデータの収集、管理、シームレスな利用を可能とするものである。
Also, as shown in Patent Document 1, a technique called a sensor network has been studied. This is because sensor devices with sensing and communication functions (hereinafter also simply referred to as “sensors”) are installed in various locations and industrial facilities, and networking them to collect, manage, and seamlessly sense data. It can be used.
通常、センサは、その所有者自身が必要とするデータを収集するために設置される。そのため所有者がデータ収集を行うとき以外は利用されていない(センサ自体が稼働していない、またはセンサが稼働していてもセンシングデータが利用されない)ことが多い。そのためセンシングデータの流通性は低く、第三者にとっていかに有意義なデータであっても、センサの所有者自身による分析、利用に留まっていた。その結果、設備の重複投資や、各自が設置したセンサとの通信によるネットワークの輻湊を招いていた。
Typically, sensors are installed to collect data that the owners themselves need. Therefore, it is often not used except when the owner collects data (the sensor itself is not operating, or sensing data is not used even if the sensor is operating). For this reason, the distribution of sensing data is low, and no matter how meaningful the data is for a third party, the sensor owner himself has only analyzed and used it. As a result, redundant investment of equipment and network congestion due to communication with sensors installed by each person have been invited.
また、IoT(Internet of Things)という技術が検討されている。これは、世界に存在する多くの物に関する情報をネット上で組み合わせることで新しい価値を生むもので、社会インフラを始めとする様々なサービスのシームレスな展開が期待されている。IoTから価値を生み出すためには、ネットに繋がる物の状態を知る必要があり、センシングと通信が重要な要素技術となる。
Also, a technology called IoT (Internet of Things) is being studied. This creates new value by combining information on many things in the world on the Internet, and seamless development of various services including social infrastructure is expected. In order to generate value from IoT, it is necessary to know the state of things connected to the Internet, and sensing and communication are important elemental technologies.
そこで本出願人は、IoTにおいてセンシングデータなどの資源を適切に流通させる仕組みを実現するため、センサに関する情報が記述された「センサ側メタデータ」とセンシングデータを利用するアプリケーションに関する情報が記述された「アプリ側メタデータ」とのマッチングを行うことで、アプリケーションの要求を満たすセンシングデータを取得可能なセンサを特定し、センサからアプリケーションへのデータフローを制御するシステムを検討している(特許文献3参照)。
Therefore, in order to realize a mechanism for appropriately distributing resources such as sensing data in IoT, the present applicant described “sensor-side metadata” in which information on sensors is described and information on applications using sensing data. We are studying a system that controls the data flow from a sensor to an application by identifying a sensor that can acquire sensing data that satisfies the application requirements by matching with “application-side metadata” (Patent Document 3). reference).
特許文献3のシステムでは、アプリ側メタデータの中に、アプリケーションが必要とするセンシングデータの種類や仕様を定義しなければならない。
In the system of Patent Document 3, the type and specification of sensing data required by the application must be defined in the application-side metadata.
しかしながら、アプリケーションの開発者や設計者が、アプリケーションの目的を達成するために、どのようなデバイスからどのようなセンシングデータを収集しアプリケーションの制御に役立てればよいか、を適切に設計するのは容易ではない。その理由の一つは、IoTではあらゆるセンサがネットワークに接続され、膨大な数・様々な種類のセンシングデータが利用可能となるからである。また、第二の理由は、現実世界においては様々な事象や要素が複雑に関連しているため、それを適切にモデル化し、アプリケーションの目的(結果)と強い因果関係をもつセンシングデータ(原因)を見極めるのが極めて難しいことにある。
However, it is important for application developers and designers to properly design what kind of sensing data should be collected from what devices and used to control the application in order to achieve the purpose of the application. It's not easy. One reason is that in IoT, all sensors are connected to a network, and a huge number and various types of sensing data can be used. The second reason is that various events and elements are complexly related in the real world, so they are appropriately modeled, and sensing data (cause) that has a strong causal relationship with the purpose (result) of the application. It is extremely difficult to identify.
また仮に、必要なセンシングデータの種類や仕様を事前に定義できたとしても、センサの停止・故障・移動などによりネットワークの構成(つまり、利用可能なセンサや取得可能なデータ)が時々刻々と変化する可能性があり、定義どおりのセンシングデータが得られない事態も発生し得る。システムのロバスト性を高めるためには、利用可能なセンサやセンシングデータのうちから最も適切なものをアプリケーションに提供できるようなフレキシブルな仕組みが望ましい。
Even if the type and specifications of the required sensing data can be defined in advance, the network configuration (that is, available sensors and data that can be acquired) changes from moment to moment due to sensor stoppage, failure, or movement. There is a possibility that sensing data as defined may not be obtained. In order to increase the robustness of the system, it is desirable to have a flexible mechanism that can provide the application with the most appropriate sensor or sensing data available.
なお、ここまでセンサネットワークを例に挙げて説明をしたが、アクチュエータ(コントローラ)のネットワークの場合にも、全く同様の課題が発生し得る。「センサ」と「アクチュエータ(コントローラ)」とは、「状態を検知(取得)する」のか「状態を変化させる」のかという違いはあるものの、所定の範囲の対象領域に対して何らかの作用を行うという点では共通である。アクチュエータネットワークの場合は、センサから得られるセンシングデータの代わりに、アクチュエータに与えるコントロールデータが流通の対象となる。以下、「センサ」と「アクチュエータ」を包含する概念として「デバイス」という用語を用いる。また、「センサネットワーク」と「アクチュエータネットワーク」を包含する概念として「デバイスネットワーク」という用語を用いる。デバイスネットワークにはセンサとアクチュエータの両方が接続されることもあり得る。
In addition, although the sensor network has been described as an example heretofore, the same problem may occur in the case of an actuator (controller) network. “Sensors” and “actuators (controllers)” have some difference in whether they “detect (acquire) the state” or “change the state”, but they perform some action on the target area within a predetermined range. The point is common. In the case of an actuator network, instead of sensing data obtained from a sensor, control data given to the actuator becomes a distribution target. Hereinafter, the term “device” is used as a concept including “sensor” and “actuator”. The term “device network” is used as a concept including “sensor network” and “actuator network”. It is possible that both a sensor and an actuator are connected to the device network.
本発明は上記実情に鑑みなされたものであり、デバイスネットワークにおけるデータの利用をより容易にするための技術を提供することを目的とする。
The present invention has been made in view of the above circumstances, and an object thereof is to provide a technique for facilitating the use of data in a device network.
請求項1に係る発明は、複数のデバイスのうちの少なくともいずれかのデバイスにおいて得られるデータを、当該データを利用するアプリケーションへと提供する、データフローを制御するためのデータフロー制御装置であって、前記複数のデバイスのそれぞれにおいて得られるデータである複数のデバイス指標と、前記アプリケーションが制御又は予測する指標である目的指標とを少なくとも含む、複数の指標のあいだの因果関係を表す因果ネットワークを記憶する因果ネットワーク記憶部と、前記アプリケーションからデータ要求を受けた場合に、前記因果ネットワークに基づき、前記アプリケーションの目的指標と因果関係を有する少なくとも1つのデバイス指標を前記複数のデバイス指標の中から選択するデバイス指標選択部と、前記選択されたデバイス指標に対応するデバイスにおいて得られるデータが、前記アプリケーションへ提供されるように、データフローを制御するデータフロー制御部と、を有することを特徴とするデータフロー制御装置である。
The invention according to claim 1 is a data flow control device for controlling a data flow, which provides data obtained in at least one of a plurality of devices to an application using the data. Storing a causal network representing a causal relationship between the plurality of indices, including at least a plurality of device indices that are data obtained in each of the plurality of devices and a target index that is an index controlled or predicted by the application When a data request is received from the causal network storage unit and the application, at least one device index having a causal relationship with the purpose index of the application is selected from the plurality of device indices based on the causal network. A device index selector, Data obtained in the device corresponding to the serial selected device indicators, as provided to the application, a data flow control apparatus characterized by comprising: a data flow control unit for controlling the data flow, the.
請求項1に係る発明によれば、アプリケーションの目的(アプリケーションが制御又は予測する指標)を与えると、その目的と因果関係を有するデータが、対応するデバイスからアプリケーションへと自動的に提供される。したがって、デバイスネットワーク内にどのようなデバイスが存在しどのようなデータが取得できるかとか、目的とする制御や予測を行うためにどのようなデータを参照すべきか、といった知識がなくても、アプリケーションの設計・開発が可能となる。よって、従来に比べて、デバイスネットワークにおけるデータを利用するアプリケーションの設計・開発が容易となり、デバイスネットワークにおけるデータの利用・流通が促進される。
According to the first aspect of the present invention, when an application purpose (an index that the application controls or predicts) is given, data having a causal relationship with the purpose is automatically provided from the corresponding device to the application. Therefore, even if there is no knowledge of what devices exist in the device network and what data can be acquired, and what data should be referred to in order to perform the desired control and prediction, the application Can be designed and developed. Therefore, as compared with the prior art, the design and development of an application that uses data in the device network is facilitated, and the use and distribution of data in the device network is promoted.
請求項2に係る発明は、前記因果関係は、2つの指標のあいだの因果強度の情報と、前記2つの指標のうちの一方の指標の影響が他方の指標に伝播するのにかかる遅延時間の情報とを含むことを特徴とする請求項1に記載のデータフロー制御装置である。請求項2に係る発明によれば、一方の指標(原因指標)から他方の指標(結果指標)への時間遅れ(伝播遅延)を考慮した因果関係を評価できる。
In the invention according to claim 2, the causal relationship includes information on causal intensity between two indices and a delay time required for the influence of one of the two indices to propagate to the other index. The data flow control apparatus according to claim 1, further comprising information. According to the invention which concerns on Claim 2, the causal relationship which considered the time delay (propagation delay) from one parameter | index (cause parameter | index) to the other parameter | index (result parameter | index) can be evaluated.
請求項3に係る発明は、前記因果関係は、移動エントロピーを用いて定義されることを特徴とする請求項2に記載のデータフロー制御装置である。請求項3に係る発明によれば、移動エントロピーを用いることで時間遅れ(伝播遅延)を伴う因果関係及びその因果強度を適切に求めることができる。
The invention according to claim 3 is the data flow control device according to claim 2, wherein the causal relationship is defined using movement entropy. According to the invention which concerns on Claim 3, the causal relationship accompanied by a time delay (propagation delay) and its causal intensity | strength can be calculated | required appropriately by using movement entropy.
請求項4に係る発明は、前記デバイス指標選択部は、前記因果ネットワークにおいて、前記目的指標からの距離が近いデバイス指標を優先的に選択し、距離が同じ場合には因果強度が強い方のデバイス指標を優先的に選択し、距離も因果強度も同じ場合には遅延時間が短い方のデバイス指標を優先的に選択することを特徴とする請求項2又は3に記載のデータフロー制御装置である。請求項4に係る発明によれば、目的指標との関係が最も強いデバイス指標を選択することができる。このように選択されたデバイス指標を用いれば、高い妥当性をもって目的指標の値を推測することができる。
In the invention according to claim 4, the device index selection unit preferentially selects a device index having a short distance from the target index in the causal network, and if the distance is the same, the device having the higher causal intensity 4. The data flow control apparatus according to claim 2, wherein the index is preferentially selected, and the device index having a shorter delay time is preferentially selected when the distance and the causal intensity are the same. . According to the invention of claim 4, it is possible to select a device index having the strongest relationship with the target index. If the device index selected in this way is used, the value of the target index can be estimated with high validity.
請求項5に係る発明は、前記デバイス指標選択部は、デバイスがアクティブか非アクティブかを確認し、非アクティブなデバイスに対応するデバイス指標を選択の対象から除外することを特徴とする請求項1~4のうちいずれか1項に記載のデータフロー制御装置である。請求項5に係る発明によれば、例えば、故障、停止、移動など、何らかの原因によって非アクティブな状態(データを取得できない状態)となっているデバイスが選択の対象から除外される。したがって、現在アクティブなデバイスのなかから、適切なデバイス(アプリケーションの目的指標と因果関係を有するデータを取得可能なデバイス)を自動で選択でき、システムのロバスト性を高めることができる。
The invention according to claim 5 is characterized in that the device index selection unit confirms whether the device is active or inactive, and excludes the device index corresponding to the inactive device from the selection target. 5. The data flow control device according to any one of 1 to 4. According to the fifth aspect of the present invention, for example, a device that is in an inactive state (a state in which data cannot be acquired) due to some cause, such as failure, stop, or movement, is excluded from selection targets. Therefore, it is possible to automatically select an appropriate device (a device that can acquire data having a causal relationship with an application purpose index) from currently active devices, and to improve the robustness of the system.
請求項6に係る発明は、複数のデバイスのうちの少なくともいずれかのデバイスにおいて得られるデータを、当該データを利用するアプリケーションへと提供する、データフローを制御するためのデータフロー制御方法であって、前記アプリケーションからデータ要求を受けた場合に、前記複数のデバイスのそれぞれにおいて得られるデータである複数のデバイス指標と、前記アプリケーションが制御又は予測する指標である目的指標とを少なくとも含む、複数の指標のあいだの因果関係を表す因果ネットワークに基づき、前記アプリケーションの目的指標と因果関係を有する少なくとも1つのデバイス指標を前記複数のデバイス指標の中から選択するステップと、前記選択されたデバイス指標に対応するデバイスにおいて得られるデータが、前記アプリケーションへ提供されるように、データフローを制御するステップと、を有することを特徴とするデータフロー制御方法である。
The invention according to claim 6 is a data flow control method for controlling a data flow, which provides data obtained in at least one of a plurality of devices to an application that uses the data. A plurality of indicators including at least a plurality of device indicators that are data obtained in each of the plurality of devices and a target indicator that is an indicator that is controlled or predicted by the application when a data request is received from the application Selecting at least one device index having a causal relationship with the purpose index of the application from the plurality of device indices based on a causal network representing a causal relationship between the plurality of device indices, and corresponding to the selected device index Data obtained on the device , As provided to the application, a data flow control method characterized by comprising the steps of: controlling data flow.
請求項6に係る発明によれば、アプリケーションの目的(アプリケーションが制御又は予測する指標)を与えると、その目的と因果関係を有するデータが、対応するデバイスからアプリケーションへと自動的に提供される。したがって、デバイスネットワーク内にどのようなデバイスが存在しどのようなデータが取得できるかとか、目的とする制御や予測を行うためにどのようなデータを参照すべきか、といった知識がなくても、アプリケーションの設計・開発が可能となる。よって、従来に比べて、デバイスネットワークにおけるデータを利用するアプリケーションの設計・開発が容易となり、デバイスネットワークにおけるデータの利用・流通が促進される。
According to the sixth aspect of the present invention, when an application purpose (an index that the application controls or predicts) is given, data having a cause and effect relationship with the purpose is automatically provided from the corresponding device to the application. Therefore, even if there is no knowledge of what devices exist in the device network and what data can be acquired, and what data should be referred to in order to perform the desired control and prediction, the application Can be designed and developed. Therefore, as compared with the prior art, the design and development of an application that uses data in the device network is facilitated, and the use and distribution of data in the device network is promoted.
請求項7に係る発明は、請求項6に記載のデータフロー制御方法の各ステップをコンピュータに実行させることを特徴とするプログラムである。
The invention according to claim 7 is a program that causes a computer to execute each step of the data flow control method according to claim 6.
請求項7に係る発明によれば、アプリケーションの目的(アプリケーションが制御又は予測する指標)を与えると、その目的と因果関係を有するデータが、対応するデバイスからアプリケーションへと自動的に提供される。したがって、デバイスネットワーク内にどのようなデバイスが存在しどのようなデータが取得できるかとか、目的とする制御や予測を行うためにどのようなデータを参照すべきか、といった知識がなくても、アプリケーションの設計・開発が可能となる。よって、従来に比べて、デバイスネットワークにおけるデータを利用するアプリケーションの設計・開発が容易となり、デバイスネットワークにおけるデータの利用・流通が促進される。
According to the invention of claim 7, when an application purpose (an index controlled or predicted by the application) is given, data having a causal relationship with the purpose is automatically provided from the corresponding device to the application. Therefore, even if there is no knowledge of what devices exist in the device network and what data can be acquired, and what data should be referred to in order to perform the desired control and prediction, the application Can be designed and developed. Therefore, as compared with the prior art, the design and development of an application that uses data in the device network is facilitated, and the use and distribution of data in the device network is promoted.
請求項8に係る発明は、センシングデータを出力するセンサを管理する情報処理装置が読み取り可能なデータストリームであって、前記センシングデータを利用するアプリケーションを特定する情報と、前記アプリケーションが制御又は予測する指標である目的指標と因果関係を有するセンシングデータを出力するものとして選択されたセンサを特定する情報と、前記選択されたセンサで得られるセンシングデータと前記目的指標のあいだの因果関係情報と、を含むことを特徴とする制御指令データストリームである。請求項8に係る発明によれば、アプリケーションの目的(アプリケーションが制御又は予測する指標)と因果関係を有するセンシングデータが対応するセンサからアプリケーションへと提供されるデータフローを実現できる。
The invention according to claim 8 is a data stream readable by an information processing apparatus that manages a sensor that outputs sensing data, and information that specifies an application that uses the sensing data, and the application controls or predicts Information for identifying a sensor selected to output sensing data having a causal relationship with a target index that is an index, and causal relationship information between the sensing data obtained by the selected sensor and the target index, It is a control command data stream characterized by including. According to the invention of claim 8, it is possible to realize a data flow in which sensing data having a causal relationship with an application purpose (an index controlled or predicted by the application) is provided from the corresponding sensor to the application.
請求項9に係る発明は、前記因果関係情報は、前記センシングデータと前記目的指標のあいだの因果強度の情報と、前記センシングデータの影響が前記目的指標に伝播するのにかかる遅延時間の情報とを含むことを特徴とする請求項8に記載の制御指令データストリームである。請求項9に係る発明によれば、センシングデータ(原因指標)から目的指標(結果指標)への時間遅れ(伝播遅延)を考慮した因果関係を考慮したデータフロー制御を実現できる。
In the invention according to claim 9, the causal relationship information includes information on causal intensity between the sensing data and the objective index, information on a delay time required for the influence of the sensing data to propagate to the objective index, and The control command data stream according to claim 8, comprising: According to the ninth aspect of the invention, it is possible to realize data flow control that takes into account a causal relationship that takes into account a time delay (propagation delay) from sensing data (cause indicator) to a target indicator (result indicator).
なお、本発明は、上記構成ないし機能の少なくとも一部を有するデータフロー制御装置として捉えることができる。また、本発明は、データフロー制御装置を有するデバイスネットワークシステム、センサネットワークシステム、アクチュエータネットワークシステムとして捉えることもできる。また、本発明は、上記処理の少なくとも一部を含むデータフロー制御方法、又は、かかる方法をコンピュータに実行させるためのプログラム、又は、そのようなプログラムを非一時的に記録したコンピュータ読取可能な記録媒体として捉えることもできる。また、本発明は、上記データフローを制御するための制御指令データストリームとして捉えることもできる。上記構成及び処理の各々は技術的な矛盾が生じない限り互いに組み合わせて本発明を構成することができる。
The present invention can be understood as a data flow control device having at least a part of the above-described configuration or function. The present invention can also be understood as a device network system, a sensor network system, and an actuator network system having a data flow control device. The present invention also provides a data flow control method including at least a part of the above processing, a program for causing a computer to execute such a method, or a computer-readable record in which such a program is recorded non-temporarily. It can also be understood as a medium. The present invention can also be understood as a control command data stream for controlling the data flow. Each of the above configurations and processes can be combined with each other to constitute the present invention as long as there is no technical contradiction.
本発明によれば、デバイスネットワークにおけるデータの利用をより容易にすることができる。
According to the present invention, the use of data in the device network can be made easier.
<システム構成>
図1および図2を参照して、本発明の実施形態に係るデバイスネットワークシステムの構成例を説明する。図1は、デバイスネットワークシステムの因果ネットワークの生成に関わる機能を示すブロック図であり、図2は、デバイスネットワークシステムのデータフロー制御に関わる機能を示すブロック図である。 <System configuration>
A configuration example of a device network system according to an embodiment of the present invention will be described with reference to FIGS. 1 and 2. FIG. 1 is a block diagram showing functions related to generation of a causal network of the device network system, and FIG. 2 is a block diagram showing functions related to data flow control of the device network system.
デバイスネットワークシステムとは、多数のデバイスにおいて取得されるデータを、それを利用するアプリケーションへとオンライン且つリアルタイムで提供可能な仕組みである。デバイスネットワークシステムは、主に、デバイスネットワーク1、M2Mクラウドサーバ2、アプリケーション3、データフロー制御装置4などで構成される。
The device network system is a mechanism that can provide data acquired by a large number of devices to applications that use it online and in real time. The device network system mainly includes a device network 1, an M2M cloud server 2, an application 3, a data flow control device 4, and the like.
(デバイスネットワーク)
デバイスネットワーク1は、多数のデバイス10によって構成されるネットワークである。デバイス10の数、種類、設置位置、ネットワークの構成や通信方式などは任意に設計でき、特に限定されない。各々のデバイス10は、例えばインターネットなどの広域ネットワークを介してM2Mクラウドサーバ2、アプリケーション3、データフロー制御装置4と通信可能である。 (Device network)
Thedevice network 1 is a network constituted by a large number of devices 10. The number, type, installation position, network configuration, communication method, and the like of the device 10 can be arbitrarily designed and are not particularly limited. Each device 10 can communicate with the M2M cloud server 2, the application 3, and the data flow control device 4 via a wide area network such as the Internet.
デバイスネットワーク1は、多数のデバイス10によって構成されるネットワークである。デバイス10の数、種類、設置位置、ネットワークの構成や通信方式などは任意に設計でき、特に限定されない。各々のデバイス10は、例えばインターネットなどの広域ネットワークを介してM2Mクラウドサーバ2、アプリケーション3、データフロー制御装置4と通信可能である。 (Device network)
The
各々のデバイス10は、空間又は時空間で規定される対象領域に対して作用するデバイスであって、「センサ」と「アクチュエータ」とに大別できる。ここで「空間」とは2次元(x,y)又は3次元(x,y,z)で規定される領域であり、「時空間」とは「空間」に「時間(t)」の次元を加えたもの、つまり3次元(x,y;t)又は4次元(x,y,z;t)で規定される領域をいう。なお本明細書では、「センサ」の語を、対象領域の状態を検知(取得)するデバイスという意味で用い、「アクチュエータ」の語を、対象領域の状態を変化させるデバイスという意味で用いる。センサには、例えば、画像センサ(カメラ)、温度センサ、湿度センサ、照度センサ、力センサ、音センサ、RFIDセンサ、赤外線センサ、姿勢センサ、降雨センサ、放射能センサ、ガスセンサなどが該当し、本システムではいかなる種類のセンサも利用することができる。またアクチュエータには、例えば、モータ、ソレノイド、コントローラ、ロボット、照明、スピーカ、ディスプレイ、デジタルサイネージ、空調など様々なものが該当し、本システムではいかなる種類のアクチュエータも利用することができる。携帯電話、スマートフォン、スレート型端末(タブレットPC)のように、センサ(画像センサなど)とアクチュエータ(ディスプレイ、スピーカなど)の両方を備えるデバイスも存在する。なお、デバイスネットワーク1の中には、様々な種類のデバイスを混在させることが可能である。
Each device 10 is a device that acts on a target area defined in space or space-time, and can be roughly classified into “sensor” and “actuator”. Here, “space” is a region defined by two dimensions (x, y) or three dimensions (x, y, z), and “time space” is a dimension of “time (t)” in “space”. That is, an area defined by three dimensions (x, y; t) or four dimensions (x, y, z; t). In this specification, the term “sensor” is used to mean a device that detects (acquires) the state of the target region, and the term “actuator” is used to mean a device that changes the state of the target region. Examples of the sensor include an image sensor (camera), a temperature sensor, a humidity sensor, an illuminance sensor, a force sensor, a sound sensor, an RFID sensor, an infrared sensor, an attitude sensor, a rainfall sensor, a radioactivity sensor, and a gas sensor. Any type of sensor can be used in the system. Various actuators such as motors, solenoids, controllers, robots, lighting, speakers, displays, digital signage, and air conditioning are applicable, and any type of actuator can be used in this system. There are also devices including both sensors (image sensors and the like) and actuators (display, speakers, and the like) such as mobile phones, smartphones, and slate terminals (tablet PCs). Various types of devices can be mixed in the device network 1.
(M2Mクラウドサーバ)
M2Mクラウドサーバ2は、デバイスネットワーク1を構成する各デバイス10に関する情報や各デバイス10にて取得されたデータなどを管理すると共に、各デバイス10にて取得されたデータを広域ネットワークを通じて利用者(アプリケーション3)へと提供するサーバシステムである。 (M2M cloud server)
TheM2M cloud server 2 manages information on each device 10 constituting the device network 1, data acquired by each device 10, and the like. This is a server system provided to 3).
M2Mクラウドサーバ2は、デバイスネットワーク1を構成する各デバイス10に関する情報や各デバイス10にて取得されたデータなどを管理すると共に、各デバイス10にて取得されたデータを広域ネットワークを通じて利用者(アプリケーション3)へと提供するサーバシステムである。 (M2M cloud server)
The
M2Mクラウドサーバ2は、デバイス10を管理するためのデータベースであるデバイスデータDB20を有する。デバイスデータDB20には、デバイスに関する情報として、例えば、デバイスの属性情報(デバイスの種類、デバイスの位置・姿勢、デバイスの所有者、デバイスID、ネットワークアドレス、動作履歴など)、対象領域(センシングする領域又はアクチュエータが作用を及ぼす領域)の属性情報(位置範囲、時間範囲など)、対象物(センシングの対象又はアクチュエータが作用を及ぼす対象)の属性情報(種類、物理属性、対象物IDなど)、動作の属性情報(制御可能な項目、センシングのサンプリング仕様、量子化仕様など)、データの属性(データの管理者または所有者、利用範囲(例えばアカデミック利用に限る、商用利用禁止など)、アクセス権限範囲、データの種類、精度、単位系、信頼度、利用可能範囲、利用の対価、利用可能時間、データIDなど)などが登録される。またデバイスデータDB20には、デバイスにて取得されたデータとして、センサの場合にはセンシングデータ(センサ測定値)が、アクチュエータの場合にはコントロールデータ(アクチュエータ制御値)が、それぞれ格納される。センシングデータやコントロールデータは最新のデータだけでなく、所定の期間分の時系列データが蓄積されているとよい。
The M2M cloud server 2 has a device data DB 20 that is a database for managing the device 10. In the device data DB 20, as device-related information, for example, device attribute information (device type, device position / posture, device owner, device ID, network address, operation history, etc.), target region (sensing region) Or attribute information (position range, time range, etc.) of the actuator, attribute information (type, physical attribute, object ID, etc.) of the object (sensing object or object on which the actuator acts), operation Attribute information (controllable items, sensing sampling specifications, quantization specifications, etc.), data attributes (data manager or owner, usage range (for example, limited to academic use, commercial use prohibited, etc.), access authority range , Data type, accuracy, unit system, reliability, usable range, consideration for use, Use possible time, such as data ID) and the like are registered. The device data DB 20 stores sensing data (sensor measurement values) in the case of sensors and control data (actuator control values) in the case of actuators as data acquired by the device. Sensing data and control data are preferably stored not only the latest data but also time-series data for a predetermined period.
(アプリケーション)
アプリケーション3は、デバイスネットワーク1から得られるデータを利用する装置又はソフトウェアモジュールである。アプリケーション3としては、デバイスネットワーク1から得られるデータを基に制御対象を制御するものや、デバイスネットワーク1から得られるデータを基に未知又は未来の状態を予測するものなどが想定される。例えば、オフィスの生産性を向上させるアプリケーション、工場の消費エネルギを抑えたり予測したりするアプリケーション、渋滞予測を行うアプリケーションなど、いかなるアプリケーションでもよい。 (application)
Theapplication 3 is a device or software module that uses data obtained from the device network 1. As the application 3, one that controls a control target based on data obtained from the device network 1, or one that predicts an unknown or future state based on data obtained from the device network 1 is assumed. For example, any application such as an application that improves office productivity, an application that suppresses or predicts energy consumption in a factory, or an application that predicts traffic congestion may be used.
アプリケーション3は、デバイスネットワーク1から得られるデータを利用する装置又はソフトウェアモジュールである。アプリケーション3としては、デバイスネットワーク1から得られるデータを基に制御対象を制御するものや、デバイスネットワーク1から得られるデータを基に未知又は未来の状態を予測するものなどが想定される。例えば、オフィスの生産性を向上させるアプリケーション、工場の消費エネルギを抑えたり予測したりするアプリケーション、渋滞予測を行うアプリケーションなど、いかなるアプリケーションでもよい。 (application)
The
(データフロー制御装置)
データフロー制御装置4は、デバイスとアプリケーションのあいだの条件のマッチングを行い、アプリケーションが所期の目的(制御ないし予測)を達成するのに必要なデータが適切なデバイスから提供されるように、データフローを制御する機能を有する。 (Data flow control device)
The dataflow control device 4 performs matching of conditions between the device and the application, so that data necessary for the application to achieve the intended purpose (control or prediction) is provided from an appropriate device. It has a function to control the flow.
データフロー制御装置4は、デバイスとアプリケーションのあいだの条件のマッチングを行い、アプリケーションが所期の目的(制御ないし予測)を達成するのに必要なデータが適切なデバイスから提供されるように、データフローを制御する機能を有する。 (Data flow control device)
The data
従来システム(特許文献3参照)では、アプリケーションが必要なデータの仕様を定義したアプリ側メタデータを発行し、その要求仕様を満たすデバイスを探索するという仕組みを採っていた。しかしこのような仕組みの場合、アプリケーションの開発者や設計者が、デバイスネットワーク1内にどのようなデバイスが存在しどのようなデータが取得できるか、さらには、目的とする制御や予測を行うためにどのようなデータを参照すべきか、等を理解していなければならず、高度な開発スキルが要求されていた。また、前述した「オフィスの生産性の向上」を目的とするアプリケーションのように、目的とする制御や予測を行うためにどのようなデータを参照すればよいのか、容易には分からないケースも多い。また一見すると簡単に見える問題でも、実は現実世界における様々な事象が絡み合っているということもある。
Conventional systems (see Patent Document 3) have adopted a mechanism in which application-side metadata that defines the specifications of data required by an application is issued and a device that satisfies the required specifications is searched. However, in the case of such a mechanism, an application developer or a designer is responsible for what kind of device exists in the device network 1 and what kind of data can be acquired, and further, intended control and prediction are performed. It was necessary to understand what kind of data should be referred to, and advanced development skills were required. In addition, there are many cases where it is not easy to know what kind of data should be referred to in order to perform the target control and prediction, such as the application for the purpose of “improvement of office productivity” described above. . Even problems that seem simple at first glance may actually involve various events in the real world.
そこで、本システムでは、データフロー制御装置4が、(1)複数のデバイス10のそれぞれにおいて得られるデータ(「デバイス指標」とよぶ)と、アプリケーション3が制御又は予測する指標(「目的指標」とよぶ)とを少なくとも含む、複数の指標のあいだの因果関係を表す因果ネットワークを生成する機能(図1参照)と、(2)この因果ネットワークを用いて、目的指標と因果関係をもつデバイス指標を選択し、その選択されたデバイス指標のデータがアプリケーション3へ提供されるようにデータフローを制御する機能(図2参照)を実施する。ここで、「アプリケーションが制御する指標」とは、アプリケーションが制御する制御対象の状態等を表す指標を意味し、例えば、制御対象の状態や出力をセンサ等により測定することで観測できる指標である。例えば、オフィスの生産性を向上するアプリケーションの場合であれば、生産性を直接又は間接的に表す指標として、時間当たりの処理件数や売り上げなどを目的指標として用いることができる。また「アプリケーションが予測する指標」とは、アプリケーションが計算によって予測ないし推定する指標を意味する。例えば、渋滞予測を行うアプリケーションの場合であれば、道路を通過するのに見込まれる時間や渋滞の長さなどを目的指標として用いることができる。詳細については後述する。
Therefore, in this system, the data flow control device 4 performs (1) data obtained by each of the plurality of devices 10 (referred to as “device index”) and an index (“target index”) that the application 3 controls or predicts. A function that generates a causal network that represents a causal relationship between a plurality of indices (see FIG. 1), and (2) using this causal network, a device index that has a causal relationship with a target index A function of controlling the data flow (see FIG. 2) is performed so that data of the selected device index is provided to the application 3. Here, the “index controlled by the application” means an index representing the state of the controlled object controlled by the application, for example, an index that can be observed by measuring the state and output of the controlled object with a sensor or the like. . For example, in the case of an application that improves office productivity, the number of processes per hour, sales, and the like can be used as target indices as indices that directly or indirectly represent productivity. The “index predicted by the application” means an index that the application predicts or estimates by calculation. For example, in the case of an application that predicts traffic jams, the time expected to pass the road, the length of traffic jams, and the like can be used as the target index. Details will be described later.
M2Mクラウドサーバ2、アプリケーション3を実行する装置、データフロー制御装置4は、いずれも、CPU(中央演算処理装置)、メモリ、補助記憶装置、通信IF、入力デバイス、表示デバイスなどを有する汎用のコンピュータにより構成することができる。後述する機能及び処理は、補助記憶装置に格納されたプログラムをCPUが読み込み、実行することにより、実現されるものである。コンピュータとしては、パーソナルコンピュータ、スマートフォン、携帯情報端末などでもよいし、サーバコンピュータでもよい。また、一台のコンピュータでなく、複数のコンピュータにより分散処理を行ってもよい。
The M2M cloud server 2, the device for executing the application 3, and the data flow control device 4 are all general-purpose computers having a CPU (Central Processing Unit), a memory, an auxiliary storage device, a communication IF, an input device, a display device, and the like. Can be configured. The functions and processes described later are realized by the CPU reading and executing a program stored in the auxiliary storage device. As a computer, a personal computer, a smart phone, a portable information terminal, etc. may be sufficient, and a server computer may be sufficient. Further, the distributed processing may be performed by a plurality of computers instead of a single computer.
<因果ネットワークの生成>
図1、図3~図8を参照して、本実施形態のデータフロー制御装置4による因果ネットワークの生成について説明する。図3及び図4は、因果ネットワークの生成処理のフローチャートであり、図5は、目的指標の時系列データの一例、図6A~図6Dは、デバイス指標の時系列データの一例である。図7は、因果関係データの一例であり、図8は、因果ネットワークの一例である。 <Causal network generation>
The generation of the causal network by the dataflow control device 4 of this embodiment will be described with reference to FIGS. FIGS. 3 and 4 are flowcharts of the causal network generation processing, FIG. 5 is an example of time-series data of a target index, and FIGS. 6A to 6D are examples of time-series data of a device index. FIG. 7 is an example of causal relationship data, and FIG. 8 is an example of a causal network.
図1、図3~図8を参照して、本実施形態のデータフロー制御装置4による因果ネットワークの生成について説明する。図3及び図4は、因果ネットワークの生成処理のフローチャートであり、図5は、目的指標の時系列データの一例、図6A~図6Dは、デバイス指標の時系列データの一例である。図7は、因果関係データの一例であり、図8は、因果ネットワークの一例である。 <Causal network generation>
The generation of the causal network by the data
本実施形態では、一具体例として、オフィスの生産性を向上するアプリケーション3を例に挙げる。図1および図3に示すように、データフロー制御装置4の因果ネットワーク生成部40は、アプリケーション3から目的指標の時系列データを取得する(ステップS30)。図5に目的指標の時系列データの一例を示す。ここでは、一時間ごとのオフィスの生産性を示す指標値(単位なし)が与えられる。この時系列データは、アプリケーション3が所定期間にわたって測定し記録したデータであり、例えば、時間当たりの処理件数や売り上げなどを目的指標として用いることができる。時系列データの期間は任意であるが、因果関係推定の信頼性を考慮すると、少なくとも数日間、望ましくは数週間から数か月分の時系列データが得られるとよい。
In the present embodiment, an application 3 that improves office productivity is taken as an example. As shown in FIGS. 1 and 3, the causal network generation unit 40 of the data flow control device 4 acquires time-series data of the target index from the application 3 (step S30). FIG. 5 shows an example of time series data of the objective index. Here, an index value (no unit) indicating the productivity of the office every hour is given. This time-series data is data measured and recorded by the application 3 over a predetermined period, and for example, the number of processes per hour and sales can be used as a target index. The period of the time series data is arbitrary, but considering the reliability of the causal relationship estimation, it is preferable to obtain time series data for at least several days, preferably several weeks to several months.
次に、因果ネットワーク生成部40は、M2Mクラウドサーバ2のデバイスデータDB20から、各デバイス10のデバイス指標の時系列データを取得する(ステップS31)。例えば、オフィス内に設置された温度センサで測定された室温の時系列データ(図6A)、オフィスの外の設置された温度センサで測定された外気温の時系列データ(図6B)、オフィス内のエアコンの消費電力量の時系列データ(図6C)、オフィス内に設置された騒音センサで測定された騒音レベルの時系列データ(図6D)など、様々なデバイス指標を取得するとよい。他にも、例えば、オフィス内のエアコンの制御値(温度設定値)、オフィスの天井照明の制御値(明るさ設定)、オフィス内に設定された照度センサの測定値、オフィス全体の消費電力量、オフィスのLANのネットワーク負荷、オフィスのプリンタや複写機の印刷枚数など、様々な種類のセンシングデータないしコントロールデータを取得するとよい。なお、デバイスネットワーク1を構成するデバイス10の数が膨大であり、すべてのデバイス10のデバイス指標の時系列データを取得することがデータ容量や計算コストの点から現実的でない場合には、ステップS31において一部のデバイス10のデバイス指標の時系列データのみを取得してもよい。例えば、アプリケーション3の制御対象や予測範囲、あるいは位置範囲などに基づいて、関連性のありそうなデバイスを大まかに絞り込み、その絞り込まれたデバイスの時系列データのみをM2Mクラウドサーバ2から受け取ればよい(デバイスの絞り込みはM2Mクラウドサーバ2とデータフロー制御装置4のいずれが行ってもよい)。これにより因果ネットワークの生成にかかる計算コストを低減することができる。
Next, the causal network generation unit 40 acquires the time series data of the device index of each device 10 from the device data DB 20 of the M2M cloud server 2 (step S31). For example, time-series data of room temperature measured by a temperature sensor installed in the office (FIG. 6A), time-series data of outside air temperature measured by a temperature sensor installed outside the office (FIG. 6B), Various device indices such as time-series data (FIG. 6C) of the power consumption of the air conditioner and noise level time-series data (FIG. 6D) measured by a noise sensor installed in the office may be acquired. In addition, for example, the control value of the air conditioner in the office (temperature setting value), the control value of the office ceiling lighting (brightness setting), the measured value of the illuminance sensor set in the office, the power consumption of the entire office Various types of sensing data or control data such as the office LAN network load and the number of office printers and copiers to be printed may be acquired. Note that if the number of devices 10 constituting the device network 1 is enormous and it is not practical from the viewpoint of data capacity and calculation cost to acquire device index time series data of all devices 10, step S31 is performed. Only the time series data of the device index of some devices 10 may be acquired. For example, it is only necessary to roughly narrow down devices that are likely to be related based on the control target, prediction range, or position range of the application 3, and receive only the time-series data of the narrowed devices from the M2M cloud server 2. (Narrowing down of devices may be performed by either the M2M cloud server 2 or the data flow control device 4). Thereby, the calculation cost concerning generation of a causal network can be reduced.
次に、因果ネットワーク生成部40は、目的指標とデバイス指標の時系列データに基づき、2つの指標(原因と結果)の全通りの組み合わせについて、因果強度・相関係数・遅延時間を計算する(ステップS32)。ステップS32の処理の詳細を図4のフローチャートに示す。ここでは、目的指標とデバイス指標をあわせてm個の指標E1~Emが得られたものとする。
Next, the causal network generation unit 40 calculates the causal intensity, the correlation coefficient, and the delay time for all combinations of the two indices (cause and result) based on the time series data of the objective index and the device index ( Step S32). Details of the processing in step S32 are shown in the flowchart of FIG. Here, it is assumed that m indices E1 to Em are obtained by combining the target index and the device index.
因果ネットワーク生成部40は、m個の指標E1~Emの中から2つの指標の組(Ei,Ej)を選択し(ステップS41)、以下に述べる処理を行う。ここで、Eiが原因指標、Ejが結果指標を表し、指標番号を表す添え字i、jは、i=1~m、j=1~m、i≠jを満たす。
The causal network generation unit 40 selects a pair of indices (Ei, Ej) from the m indices E1 to Em (step S41), and performs the processing described below. Here, Ei represents a cause index, Ej represents a result index, and subscripts i and j representing index numbers satisfy i = 1 to m, j = 1 to m, and i ≠ j.
まず因果ネットワーク生成部40は、遅延時間sを最小値sminに設定する(ステップS42)。そして、因果ネットワーク生成部40は、原因指標Eiと時間s後の結果指標Ejのあいだの因果強度を求める(ステップS43)。本実施形態では、移動エントロピーTEijを因果強度として用いる。
First, the causal network generation unit 40 sets the delay time s to the minimum value smin (step S42). And the causal network production | generation part 40 calculates | requires the causal intensity | strength between the cause parameter | index Ei and the result parameter | index Ej after time s (step S43). In the present embodiment, the movement entropy TEij is used as the causal intensity.
移動エントロピーとは、二つの指標X、Yのあいだの伝播時間(遅延時間)を考慮した因果関係を評価する尺度ないし手法であり、指標Xから時間s後の指標Yへと移動した平均情報量(エントロピー)を、原因指標Xが時間s後に結果指標Yに与える影響の強さ(つまり因果強度)とみなす考え方である。なお、似た概念に相関係数があるが、相関係数は2つの指標XとYの間の線形関係の度合いと線形関係の符号を評価するだけであり、因果の方向(どちらの指標が因でとちらが果か)および時間遅れを考慮していない点で、移動エントロピーとは異なる。
Movement entropy is a measure or method for evaluating the causal relationship in consideration of the propagation time (delay time) between two indices X and Y, and the average amount of information moved from index X to index Y after time s. (Entropy) is an idea that the cause index X is regarded as the strength of influence (that is, the causal strength) of the effect index Y after the time s. There is a correlation coefficient in a similar concept, but the correlation coefficient only evaluates the degree of linear relationship between the two indexes X and Y and the sign of the linear relationship, and the direction of causality (which index is This is different from the movement entropy in that it does not consider time delays.
指標X、Yそれぞれの時系列データをx(t)、y(t)とし、確率密度関数をP(x(t))、P(y(t))とすると、指標Xを因、指標Yを果とする、遅延時間sに関する移動エントロピーTEXY(s)は、次式で計算できる。

ここで、P(a,b)は、P(a)とP(b)の結合確率密度変数を表し、[*]は*の時間平均を表す。 If the time series data of the indices X and Y are x (t) and y (t), and the probability density functions are P (x (t)) and P (y (t)), the index X causes the index Y. The movement entropy TE XY (s) related to the delay time s can be calculated by the following equation.
Here, P (a, b) represents a joint probability density variable of P (a) and P (b), and [*] represents a time average of *.
上式から分かるように、移動エントロピーは、二つの指標X、Yの時系列データと遅延時間sを与えることで計算できる。ここで、指標X、Yのあいだに、Xを因、Yを果とする因果関係が存在する場合には、TEXY(s)の値と、因と果を入れ替えて計算したTEYX(s)の値とのあいだに、TEXY(s)>TEYX(s)が成立する。よって、TEXY(s)とTEYX(s)の値の大小関係を評価することにより、因果関係の存在および因果の方向を判断できる。また、sの値を変えながら移動エントロピーTEXY(s)を計算することで、原因指標Xと結果指標Yのあいだの因果強度の最大値、及び、因果強度が最大となる遅延時間sを求めることができる。
As can be seen from the above equation, the movement entropy can be calculated by giving time series data of two indices X and Y and a delay time s. Here, when there is a causal relationship between the indices X and Y, where X is a cause and Y is a result, TE YX (s) is calculated by replacing the value of TE XY (s) with the cause and effect. ), TE XY (s)> TE YX (s) is established. Therefore, by evaluating the magnitude relationship between the values of TE XY (s) and TE YX (s), the existence of the causal relationship and the direction of the causality can be determined. Further, by calculating the movement entropy TE XY (s) while changing the value of s, the maximum value of the causal intensity between the cause index X and the result index Y and the delay time s at which the causal intensity is maximized are obtained. be able to.
ステップS41の処理において、逆方向の移動エントロピー、すなわち、時間s後の指標Ejから指標Eiへの移動エントロピーTEjiを計算し、もし逆方向の移動エントロピーの方が大きい場合(TEji>TEij)には、2つの指標(Ei,Ej)のあいだには指標Eiが原因、指標Ejが結果となる因果関係はないと判断し、因果強度をゼロにするとよい。
In the process of step S41, the movement entropy in the reverse direction, that is, the movement entropy TEji from the index Ej after time s to the index Ei is calculated. If the movement entropy in the reverse direction is larger (TEji> TEij) It may be determined that there is no causal relationship between the two indices (Ei, Ej) that is caused by the index Ei and the index Ej is a result, and the causal intensity is set to zero.
原因指標Eiと結果指標Ejのあいだに因果関係が認められた場合(因果強度がゼロでない場合)は(ステップS44;YES)、因果ネットワーク生成部40は、原因指標Eiと時間s後の結果指標Ejの相関係数を計算する(ステップS45)。相関係数の計算方法は公知のため説明を省略する。
When a causal relationship is recognized between the cause index Ei and the result index Ej (when the causal intensity is not zero) (step S44; YES), the causal network generation unit 40 causes the cause index Ei and the result index after time s. A correlation coefficient of Ej is calculated (step S45). Since the calculation method of the correlation coefficient is well known, the description thereof is omitted.
以上のステップS43~S45の処理を、sの値を時間ステップ幅Δsずつ増やしながら繰り返し実行し(ステップS46)、遅延時間の最大値smaxまで処理を終えたら(ステップS47)、次の指標の組の処理へと移行する(ステップS48;NO)。そして、2つの指標の全通りの組について因果関係の評価を終えたら(ステップS48;YES)、図3のステップS33へ進む。
The processes in steps S43 to S45 are repeatedly executed while increasing the value of s by the time step width Δs (step S46). When the process is completed up to the maximum delay time value smax (step S47), the next set of indices (Step S48; NO). When the causal relationship evaluation is completed for all combinations of the two indexes (step S48; YES), the process proceeds to step S33 in FIG.
因果ネットワーク生成部40は、因果関係データを生成し、因果ネットワーク記憶部41に格納する(ステップS33)。
The causal network generation unit 40 generates causal relation data and stores it in the causal network storage unit 41 (step S33).
図7は、因果関係データのデータ構造の一例を模式的に示している。因果関係データは、アプリケーション3又は目的指標を特定するための情報である「対象識別情報」と、m個の指標それぞれがどのデバイスから取得した情報かを特定するための情報である「指標識別情報」と、2つの指標の組ごとの因果関係情報とを含んでいる。対象識別情報には、例えば、アプリケーション3のID、目的指標のIDなどが記述される。指標識別情報には、例えば、各指標に対応するデバイスのIDなどが記述される。ただし、指標1は目的指標とし、指標1の指標識別情報にはアプリケーション3のIDを記述するものとする。
FIG. 7 schematically shows an example of the data structure of the causal relationship data. The causal relationship data includes “target identification information” that is information for identifying the application 3 or the target index, and “index identification information” that is information for identifying which device each of the m indices is acquired from. ”And causal relationship information for each set of two indices. In the object identification information, for example, the ID of the application 3 and the ID of the purpose index are described. In the index identification information, for example, an ID of a device corresponding to each index is described. However, the index 1 is an objective index, and the ID of the application 3 is described in the index identification information of the index 1.
因果関係情報はm×mの2次元配列で構成されており(図7は、m=6の例である)、要素番号(i,j)のセルに原因指標iと結果指標jのあいだの因果関係情報が格納される。要素番号(3,4)の因果関係情報Ark(3,4)のデータ記述例を以下に示す。
The causal relation information is composed of an m × m two-dimensional array (FIG. 7 is an example of m = 6), and the cell of element number (i, j) is between the cause index i and the result index j. Causal relationship information is stored. A data description example of the causal relationship information Ark (3, 4) of the element number (3, 4) is shown below.
Ark(3,4) = {
Causality = 0.58;
Delay = 3;
Co_CoEf = -0.7
} Ark (3,4) = {
Causality = 0.58;
Delay = 3;
Co_CoEf = −0.7
}
Causality = 0.58;
Delay = 3;
Co_CoEf = -0.7
} Ark (3,4) = {
Causality = 0.58;
Delay = 3;
Co_CoEf = −0.7
}
Causalityは、原因指標iと結果指標jのあいだの最大の因果強度(移動エントロピー)を表す強度情報であり、Delayは、因果強度が最大となる遅延時間を表す時間情報である。Co_CoEfは、原因指標iの増減に対する結果指標jの変化の方向(正の相関か負の相関か)を表す相関情報である。この例では、Delayの単位として「時間」を用い、相関情報として、原因指標iとDelay後の結果指標jとのあいだの相関係数を用いている。すなわち、上記例の因果関係情報Ark(3,4)からは、原因指標3と結果指標4とのあいだには因果関係が存在し、その因果の方向は指標3→指標4であること、因果強度は0.58であること、原因指標3の影響が結果指標4に伝播するのに3時間かかる(遅れる)こと、原因指標3と結果指標4とのあいだには負の相関があり、その強さは0.7であることなどが分かる。
Causality is intensity information representing the maximum causal intensity (movement entropy) between the cause index i and the result index j, and Delay is time information representing a delay time at which the causal intensity is maximum. Co_CoEf is correlation information indicating the direction of change of the result index j with respect to increase or decrease of the cause index i (positive correlation or negative correlation). In this example, “time” is used as the unit of Delay, and a correlation coefficient between the cause index i and the result index j after Delay is used as the correlation information. That is, from the causal relationship information Ark (3, 4) in the above example, there is a causal relationship between the cause index 3 and the result index 4, and the direction of the causality is index 3 → index 4, The intensity is 0.58, it takes 3 hours (delay) for the influence of the cause index 3 to propagate to the result index 4, and there is a negative correlation between the cause index 3 and the result index 4. It can be seen that the strength is 0.7.
なお、前述したステップS44において、指標iとjのあいだに因果関係なしと判断された場合には、Ark(i,j)にはNULLが設定される。また、i=jとなるセルのArk(i,j)にもNULLが設定される。
In step S44 described above, if it is determined that there is no causal relationship between the indices i and j, NULL is set in Ark (i, j). Also, NULL is set to Ark (i, j) of the cell where i = j.
図8は、図7の因果関係データをもとに、指標間の因果関係を有向グラフで示した因果ネットワークの一例である。この有向グラフにおいて、各ノードが指標に対応しており、指標のIDと対応するデバイスのIDが各ノードに関連付けられている。2つのノードのあいだをリンクするアークが2つのノードのあいだの因果関係及び因果の方向を示している(アークの基端側が原因ノード、矢印側が結果ノード)。またアークの太さは因果強度を示している。図8の例では、デバイスAで得られる指標3→デバイスCで得られる指標6→デバイスEで得られる指標4→アプリケーション3の目的指標1の順に因果の強い伝播があることがわかる。言い換えると、アプリケーション3の目的指標1の値ないし状態を推測するには、デバイス指標4、デバイス指標6、デバイス指標3が役立つことがわかる。
FIG. 8 is an example of a causal network in which the causal relationship between indices is shown as a directed graph based on the causal relationship data in FIG. In this directed graph, each node corresponds to an index, and an ID of the index and a device ID corresponding to the index are associated with each node. An arc linking two nodes indicates the causal relationship and the direction of the cause and effect between the two nodes (the root side of the arc is the cause node, and the arrow side is the result node). The thickness of the arc indicates the causal strength. In the example of FIG. 8, it can be seen that there is causal propagation in the order of the index 3 obtained by the device A → the index 6 obtained by the device C → the index 4 obtained by the device E → the objective index 1 of the application 3. In other words, it can be understood that the device index 4, the device index 6, and the device index 3 are useful for estimating the value or state of the target index 1 of the application 3.
<データフローの制御>
図2、図9、図10を参照して、本実施形態のデータフロー制御装置4によるデータフロー制御について説明する。図9は、デバイス指標の選択処理およびデータフロー制御処理のフローチャートであり、図10は、因果ネットワークに基づくデバイス指標の選択を模式的に示す図である。 <Data flow control>
Data flow control by the dataflow control device 4 of the present embodiment will be described with reference to FIGS. 2, 9, and 10. FIG. 9 is a flowchart of device index selection processing and data flow control processing, and FIG. 10 is a diagram schematically illustrating device index selection based on a causal network.
図2、図9、図10を参照して、本実施形態のデータフロー制御装置4によるデータフロー制御について説明する。図9は、デバイス指標の選択処理およびデータフロー制御処理のフローチャートであり、図10は、因果ネットワークに基づくデバイス指標の選択を模式的に示す図である。 <Data flow control>
Data flow control by the data
図2に示すように、データフロー制御装置4は、データフロー制御に関わる機能として、デバイス指標選択部42およびデータフロー制御部43を有している。因果ネットワーク記憶部41には、アプリケーション3の目的指標について既に生成された因果関係データが格納されているものとする。
As shown in FIG. 2, the data flow control device 4 includes a device index selection unit 42 and a data flow control unit 43 as functions related to data flow control. It is assumed that the causal network storage unit 41 stores the causal relationship data already generated for the purpose index of the application 3.
まず、デバイス指標選択部42は、アプリケーション3からデータ要求としてのアプリ側メタデータを取得する(ステップS90)。アプリ側メタデータには、例えば、目的指標のID、希望する利用時間や料金などが含まれている。また、デバイス指標選択部42は、M2Mクラウドサーバ2のデバイスデータDB20から、各デバイス10のデバイス側メタデータを取得する(ステップS91)。デバイス側メタデータには、前述したデバイスに関する情報が記述されている。なお、デバイスネットワーク1を構成するデバイス10の数が膨大であり、すべてのデバイス10のメタデータを取得することがデータ容量や計算コストの点から現実的でない場合には、ステップS91において一部のデバイス10のメタデータのみを取得してもよい。この場合も、例えば、アプリケーション3の制御対象や予測範囲、あるいは位置範囲などに基づいて、関連性のありそうなデバイスを大まかに絞り込み、その絞り込まれたデバイスのメタデータのみをM2Mクラウドサーバ2から受け取ればよい(デバイスの絞り込みはM2Mクラウドサーバ2とデータフロー制御装置4のいずれが行ってもよい)。
First, the device index selection unit 42 acquires application-side metadata as a data request from the application 3 (step S90). The application-side metadata includes, for example, an objective index ID, desired usage time, fee, and the like. In addition, the device index selection unit 42 acquires device-side metadata of each device 10 from the device data DB 20 of the M2M cloud server 2 (step S91). The device-side metadata describes information related to the device described above. If the number of devices 10 constituting the device network 1 is enormous and it is not practical from the viewpoint of data capacity and calculation cost to acquire metadata of all the devices 10, some of the devices 10 are obtained in step S91. Only the metadata of the device 10 may be acquired. Also in this case, for example, based on the control target, the prediction range, or the position range of the application 3, the devices that are likely to be related are roughly narrowed down, and only the metadata of the narrowed-down devices is extracted from the M2M cloud server 2. (Neither the M2M cloud server 2 nor the data flow control device 4 may narrow down the devices).
次に、デバイス指標選択部42は、因果ネットワーク記憶部41に格納された因果ネットワーク(因果関係データ)に基づいて、目標指標と因果関係を有するデバイス指標を選択する(ステップS92)。本実施形態では、以下のルールにしたがってデバイス指標の候補が選択される。
Next, the device index selecting unit 42 selects a device index having a causal relationship with the target index based on the causal network (causal relationship data) stored in the causal network storage unit 41 (step S92). In the present embodiment, device index candidates are selected according to the following rules.
(1)因果ネットワークにおいて、目的指標からの距離が近いデバイス指標を優先する。なお「距離」は、2つの指標(ノード)のあいだにあるアークの数と定義する。
(2)距離が同じ場合は、因果強度が強い方の指標を優先する(ただし、因果強度が所定の閾値に満たない指標は選択しない)。
(3)距離も因果強度も同じ場合は、遅延時間が短い方の指標を優先する。 (1) In the causal network, priority is given to a device index that is close to the target index. “Distance” is defined as the number of arcs between two indices (nodes).
(2) When the distances are the same, priority is given to an index with a higher causal intensity (however, an index whose causal intensity is less than a predetermined threshold is not selected).
(3) When the distance and the causal intensity are the same, the index with the shorter delay time is prioritized.
図10は、図8の因果ネットワークにおいて、因果強度が閾値よりも大きいという条件を満足する因果関係のみを示す、部分ネットワークである。この図10に上記ルール(1)~(3)を適用すると、指標4→指標2→指標6→指標3の順に候補が選ばれる。これにより、目的指標との関係が強いデバイス指標を優先的に選択することができる。
FIG. 10 is a partial network showing only the causal relationship that satisfies the condition that the causal intensity is larger than the threshold in the causal network of FIG. When the above rules (1) to (3) are applied to FIG. 10, candidates are selected in the order of index 4 → index 2 → index 6 → index 3. Thereby, it is possible to preferentially select a device index having a strong relationship with the target index.
デバイス指標選択部42は、ステップS92で選択された候補指標に対応するデバイスがアクティブか否かを確認する(ステップS93)。デバイスがアクティブか非アクティブかを示す情報については、デバイスから直接得てもよいし(例えば、pingコマンドなどを用いてデバイスのステイタスを確認する。)、M2Mクラウドサーバ2から得てもよい。デバイスが非アクティブの場合、すなわち、デバイスの停止、故障、移動などにより当該デバイスから現在のデータ(最新のデータ)を取得できない状態の場合は(ステップS93;NO)、ステップS92に戻り次の候補指標を選択する。デバイスがアクティブの場合、すなわち、当該デバイスから現在のデータを取得可能な状態の場合は(ステップS93;YES)、デバイス指標選択部42は、メタデータに記述された他の条件(例えば、対価、利用範囲、利用時間など)がアプリケーション3の要求とマッチするかを確認する(ステップS94)。マッチしない条件がある場合には(ステップS94;NO)、ステップS92に戻り次の候補指標を選択する。以上の処理によって、目的指標と因果関係を有し、且つ、デバイスがアクティブで、且つ、他の条件も満足するデバイス指標が選択される。
The device index selection unit 42 checks whether or not the device corresponding to the candidate index selected in step S92 is active (step S93). Information indicating whether the device is active or inactive may be obtained directly from the device (for example, the status of the device is confirmed using a ping command or the like) or may be obtained from the M2M cloud server 2. When the device is inactive, that is, when the current data (latest data) cannot be acquired from the device due to the stop, failure, or movement of the device (step S93; NO), the process returns to step S92 and the next candidate Select an indicator. When the device is active, that is, when the current data can be acquired from the device (step S93; YES), the device index selection unit 42 selects other conditions (for example, consideration, It is confirmed whether the usage range, usage time, etc. match the request of the application 3 (step S94). If there is a condition that does not match (step S94; NO), the process returns to step S92 to select the next candidate index. Through the above processing, a device index that has a cause-and-effect relationship with the target index, is active in the device, and satisfies other conditions is selected.
そして、データフロー制御部43が、選択されたデバイス指標に対応するデバイス10を送信元としアプリケーション3を送信先とするデータフロー制御指令を生成し、そのデータフロー制御指令をM2Mクラウドサーバ2に送信する(ステップS95)。
Then, the data flow control unit 43 generates a data flow control command with the device 10 corresponding to the selected device index as the transmission source and the application 3 as the transmission destination, and transmits the data flow control command to the M2M cloud server 2. (Step S95).
図10において、「指標6:デバイスC」が選択された場合のデータフロー制御の一例を説明する。このときデータフロー制御部43は、「デバイスC」から「アプリケーション3」へのデータフロー制御指令をM2Mクラウドサーバ2に送信する。データフロー制御指令には、例えば以下の情報が含まれる。
・デバイスCのID
・アプリケーション3のID
・デバイスCで取得される指標6(原因)→指標4(結果)の因果関係情報Ark(6,4)
・指標4(原因)→目的指標1(結果)の因果関係情報Ark(4,1) An example of data flow control when “index 6: device C” is selected in FIG. 10 will be described. At this time, the dataflow control unit 43 transmits a data flow control command from “device C” to “application 3” to the M2M cloud server 2. The data flow control command includes, for example, the following information.
-ID of device C
・ ID ofapplication 3
Causal relationship information Ark (6, 4) of index 6 (cause) acquired by device C → index 4 (result)
-Causal relationship information Ark (4, 1) of index 4 (cause) → objective index 1 (result)
・デバイスCのID
・アプリケーション3のID
・デバイスCで取得される指標6(原因)→指標4(結果)の因果関係情報Ark(6,4)
・指標4(原因)→目的指標1(結果)の因果関係情報Ark(4,1) An example of data flow control when “index 6: device C” is selected in FIG. 10 will be described. At this time, the data
-ID of device C
・ ID of
Causal relationship information Ark (6, 4) of index 6 (cause) acquired by device C → index 4 (result)
-Causal relationship information Ark (4, 1) of index 4 (cause) → objective index 1 (result)
センサ等のデバイスを管理する情報処理装置としてのM2Mクラウドサーバ2は、データフロー制御部43から発行(送信)されるデータフロー制御指令(制御指令データストリームとも呼ぶ)を読み取ると、次のデータフロー制御を実行する。M2Mクラウドサーバ2は、因果関係情報Ark(6,4)における因果強度、遅延時間、相関係数などのパラメータに基づき、指標6のデータから指標4のデータを予測(推測)する予測関数f6→4を生成する。また、M2Mクラウドサーバ2は、同じように、指標4のデータから目的指標1のデータを予測(推測)する予測関数f4→1を生成する。
When the M2M cloud server 2 serving as an information processing apparatus that manages devices such as sensors reads a data flow control command (also referred to as a control command data stream) issued (transmitted) from the data flow control unit 43, the next data flow Execute control. M2M cloud server 2, causal intensity at causal relationship information Ark (6, 4), the delay time, based on parameters such as correlation coefficients, prediction data of the index 4 from the data of indicator 6 (guess) prediction function is f 6 → 4 is generated. Similarly, the M2M cloud server 2 generates a prediction function f 4 → 1 that predicts (estimates) the data of the target index 1 from the data of the index 4.
そして、M2Mクラウドサーバ2は、デバイスCにて取得した最新のデータdcから、目的指標1の予測データdpを、
dp=f4→1(f6→4(dc))
のように計算し、データdpをアプリケーション3に送信する。このように、目的指標1との因果関係が強いデバイス指標6のデータdcから目的指標1のデータdpを求めるため、高い妥当性をもって目的指標1の値を推測することができる。 Then, theM2M cloud server 2 obtains the prediction data dp of the objective index 1 from the latest data dc acquired by the device C.
dp = f 4 → 1 (f 6 → 4 (dc))
And the data dp is transmitted to theapplication 3. Thus, since the data dp of the objective index 1 is obtained from the data dc of the device index 6 having a strong causal relationship with the objective index 1, the value of the objective index 1 can be estimated with high validity.
dp=f4→1(f6→4(dc))
のように計算し、データdpをアプリケーション3に送信する。このように、目的指標1との因果関係が強いデバイス指標6のデータdcから目的指標1のデータdpを求めるため、高い妥当性をもって目的指標1の値を推測することができる。 Then, the
dp = f 4 → 1 (f 6 → 4 (dc))
And the data dp is transmitted to the
なお、M2Mクラウドサーバ2で予測データdpを計算する代わりに、データdcと因果関係情報Ark(6,4)及びArk(4,1)、又は、データdcと予測関数f6→4及びf4→1をアプリケーション3に送信し、アプリケーション3側でデータdcから目的指標1の値dpの計算を実行してもよい。
Instead of calculating the prediction data dp in the M2M cloud server 2, the data dc and the causal relationship information Ark (6, 4) and Ark (4, 1), or the data dc and the prediction function f 6 → 4 and f 4 → 1 may be transmitted to the application 3, and the value dp of the target index 1 may be calculated from the data dc on the application 3 side.
以上の構成によれば、アプリケーションの目的(アプリケーションが制御又は予測する指標)を与えると、その目的と因果関係を有するデータが、対応するデバイス10からアプリケーション3へと自動的に提供される。したがって、デバイスネットワーク1内にどのようなデバイスが存在しどのようなデータが取得できるかとか、目的とする制御や予測を行うためにどのようなデータを参照すべきか、といった知識がなくても、アプリケーション3の設計・開発が可能となる。よって、従来に比べて、デバイスネットワーク1におけるデータを利用するアプリケーション3の設計・開発が容易となり、デバイスネットワーク1におけるデータの利用・流通が促進される。
According to the above configuration, when an application purpose (an index that the application controls or predicts) is given, data having a causal relationship with the purpose is automatically provided from the corresponding device 10 to the application 3. Therefore, even if there is no knowledge of what devices exist in the device network 1 and what data can be acquired, what data should be referred to in order to perform target control and prediction, Application 3 can be designed and developed. Therefore, as compared with the prior art, the design / development of the application 3 that uses data in the device network 1 is facilitated, and the use / distribution of data in the device network 1 is promoted.
また、故障、停止、移動など、何らかの原因によって非アクティブな状態(データを取得できない状態)となっているデバイスが選択の対象から除外される。したがって、現在アクティブなデバイスのなかから、適切なデバイス(アプリケーション3の目的指標と因果関係を有するデータを取得可能なデバイス)を自動で選択でき、システムのロバスト性を高めることができる。
In addition, devices that are in an inactive state (a state where data cannot be acquired) for some reason, such as failure, stop, or movement, are excluded from selection. Therefore, it is possible to automatically select an appropriate device (a device that can acquire data having a causal relationship with the purpose index of the application 3) from among currently active devices, and to improve the robustness of the system.
<アプリケーションによるデバイスの制御>
上記実施形態では、アプリケーション3へ提供するデバイス指標を選択するために因果ネットワークを利用したが、さらに進んで、アプリケーション3が目的指標の値を積極的に調整するために因果ネットワークを利用することも可能である。 <Device control by application>
In the above embodiment, the causal network is used to select a device index to be provided to theapplication 3. However, the application 3 may also use the causal network to positively adjust the value of the target index. Is possible.
上記実施形態では、アプリケーション3へ提供するデバイス指標を選択するために因果ネットワークを利用したが、さらに進んで、アプリケーション3が目的指標の値を積極的に調整するために因果ネットワークを利用することも可能である。 <Device control by application>
In the above embodiment, the causal network is used to select a device index to be provided to the
図11の例のように、目的指標1に影響を与え得る指標として、デバイス指標2,4,6,3が選ばれているとする。これらのデバイス指標に対応するデバイスD,E,C,Aのなかにアクチュエータが存在する場合には、アプリケーション3から当該アクチュエータに対してデバイス制御命令を送ることで、目的指標1の値を調整(増加又は減少)させることが可能である。
Suppose that device indexes 2, 4, 6, and 3 are selected as indexes that can affect the target index 1 as in the example of FIG. When an actuator exists in the devices D, E, C, and A corresponding to these device indexes, the value of the target index 1 is adjusted by sending a device control command to the actuator from the application 3 ( Increase or decrease).
例えば、図11において、
・デバイスCがエアコン、指標6がエアコンの温度設定値
・デバイスEが室内温度センサ、指標4がオフィス内の温度
・目的指標1がオフィスの生産性
と想定した場合、アプリケーション3が目的指標1(オフィスの生産性)の値を目標値に近づけるために、デバイスC(エアコン)の指標6(温度設定値)を変更するデバイス制御命令を送信し、オフィス内の温度を変更する、というシステムが構築できる。なお、デバイス制御命令は、アプリケーション3からデバイスCへ直接送信してもよいし、M2Mクラウドサーバ2を仲介してもよい。 For example, in FIG.
・ Device C is the air conditioner andindex 6 is the temperature setting value of the air conditioner ・ Device E is the indoor temperature sensor and index 4 is the temperature in the office ・ If the target index 1 is assumed to be office productivity, the application 3 is the target index 1 ( In order to bring the office productivity value close to the target value, a system is built that sends a device control command to change the index 6 (temperature set value) of the device C (air conditioner) and changes the temperature in the office. it can. The device control command may be transmitted directly from the application 3 to the device C, or may be mediated by the M2M cloud server 2.
・デバイスCがエアコン、指標6がエアコンの温度設定値
・デバイスEが室内温度センサ、指標4がオフィス内の温度
・目的指標1がオフィスの生産性
と想定した場合、アプリケーション3が目的指標1(オフィスの生産性)の値を目標値に近づけるために、デバイスC(エアコン)の指標6(温度設定値)を変更するデバイス制御命令を送信し、オフィス内の温度を変更する、というシステムが構築できる。なお、デバイス制御命令は、アプリケーション3からデバイスCへ直接送信してもよいし、M2Mクラウドサーバ2を仲介してもよい。 For example, in FIG.
・ Device C is the air conditioner and
このように、因果ネットワークを用いることにより、目的指標の値に影響を及ぼし得るアクチュエータを容易に特定することができる。またアプリケーション3によるデバイス制御を可能にしたことで、アプリケーション3による目的指標の積極的な調整が可能となり、アプリケーション開発の自由度が高まる。
Thus, by using a causal network, it is possible to easily identify an actuator that can affect the value of the target index. In addition, since the device control by the application 3 is enabled, the objective index can be positively adjusted by the application 3, and the degree of freedom of application development is increased.
<その他の実施形態>
上述した実施形態の構成は本発明の一具体例を示したものにすぎず、本発明の範囲を限定する趣旨のものではない。本発明はその技術思想を逸脱しない範囲において、種々の具体的構成を採り得るものである。 <Other embodiments>
The configuration of the above-described embodiment is merely a specific example of the present invention, and is not intended to limit the scope of the present invention. The present invention can take various specific configurations without departing from the technical idea thereof.
例えば、上記実施形態では、因果ネットワークの例として数個の指標(デバイス)のみを図示したが、実際には数十から数百、あるいはそれ以上の指標(デバイス)の因果ネットワークを形成することも可能である。また上記実施形態では、デバイスの例としてセンサとアクチュエータを示したが、実デバイスだけでなく、仮想的なデバイス(例えば複数のセンサで得られたセンシングデータを組み合わせて1つのセンシングデータを出力するようにしたモジュールなど)を用いることもできる。また上記実施形態では、デバイス制御の例としてアクチュエータを制御する例を示したが、センサを制御(例えば、カメラのパン・チルト・ズームの調整、測定のサンプリング周期の変更など)することもできる。
For example, in the above embodiment, only a few indicators (devices) are illustrated as examples of the causal network, but in practice, a causal network of tens to hundreds or more indicators (devices) may be formed. Is possible. In the above embodiment, sensors and actuators are shown as examples of devices. However, not only real devices but also virtual devices (for example, combining sensing data obtained by a plurality of sensors to output one sensing data) Or the like). In the above-described embodiment, an example in which an actuator is controlled is shown as an example of device control. However, a sensor can be controlled (for example, adjustment of pan / tilt / zoom of a camera, change of a sampling period of measurement, etc.).
1:デバイスネットワーク
10:デバイス
2:M2Mクラウドサーバ
20:デバイスデータDB
3:アプリケーション
4:データフロー制御装置
40:因果ネットワーク生成部
41:因果ネットワーク記憶部
42:デバイス指標選択部
43:データフロー制御部 1: Device network 10: Device 2: M2M cloud server 20: Device data DB
3: Application 4: Data flow control device 40: Causal network generation unit 41: Causal network storage unit 42: Device index selection unit 43: Data flow control unit
Claims (9)
- 複数のデバイスのうちの少なくともいずれかのデバイスにおいて得られるデータを、当該データを利用するアプリケーションへと提供する、データフローを制御するためのデータフロー制御装置であって、
前記複数のデバイスのそれぞれにおいて得られるデータである複数のデバイス指標と、前記アプリケーションが制御又は予測する指標である目的指標とを少なくとも含む、複数の指標のあいだの因果関係を表す因果ネットワークを記憶する因果ネットワーク記憶部と、
前記アプリケーションからデータ要求を受けた場合に、前記因果ネットワークに基づき、前記アプリケーションの目的指標と因果関係を有する少なくとも1つのデバイス指標を前記複数のデバイス指標の中から選択するデバイス指標選択部と、
前記選択されたデバイス指標に対応するデバイスにおいて得られるデータが、前記アプリケーションへ提供されるように、データフローを制御するデータフロー制御部と、
を有することを特徴とするデータフロー制御装置。 A data flow control device for controlling a data flow, which provides data obtained in at least one of a plurality of devices to an application that uses the data,
A causal network representing a causal relationship between a plurality of indices is stored, including at least a plurality of device indices that are data obtained in each of the plurality of devices and a target index that is an index that is controlled or predicted by the application. A causal network storage unit;
A device index selection unit that selects, based on the causal network, at least one device index having a causal relationship with a purpose index of the application from the plurality of device indices when receiving a data request from the application;
A data flow control unit that controls data flow so that data obtained in a device corresponding to the selected device index is provided to the application;
A data flow control device comprising: - 前記因果関係は、2つの指標のあいだの因果強度の情報と、前記2つの指標のうちの一方の指標の影響が他方の指標に伝播するのにかかる遅延時間の情報とを含む
ことを特徴とする請求項1に記載のデータフロー制御装置。 The causal relationship includes information on the causal strength between two indicators and information on a delay time required for the influence of one of the two indicators to propagate to the other indicator. The data flow control device according to claim 1. - 前記因果関係は、移動エントロピーを用いて定義される
ことを特徴とする請求項2に記載のデータフロー制御装置。 The data flow control apparatus according to claim 2, wherein the causal relationship is defined using movement entropy. - 前記デバイス指標選択部は、前記因果ネットワークにおいて、前記目的指標からの距離が近いデバイス指標を優先的に選択し、距離が同じ場合には因果強度が強い方のデバイス指標を優先的に選択し、距離も因果強度も同じ場合には遅延時間が短い方のデバイス指標を優先的に選択する
ことを特徴とする請求項2又は3に記載のデータフロー制御装置。 The device index selection unit preferentially selects a device index having a short distance from the target index in the causal network, and preferentially selects a device index having a stronger causal intensity when the distance is the same, 4. The data flow control apparatus according to claim 2, wherein when the distance and the causal intensity are the same, the device index with a shorter delay time is preferentially selected. - 前記デバイス指標選択部は、デバイスがアクティブか非アクティブかを確認し、非アクティブなデバイスに対応するデバイス指標を選択の対象から除外する
ことを特徴とする請求項1~4のうちいずれか1項に記載のデータフロー制御装置。 The device index selection unit confirms whether a device is active or inactive, and excludes a device index corresponding to an inactive device from selection targets. The data flow control device described in 1. - 複数のデバイスのうちの少なくともいずれかのデバイスにおいて得られるデータを、当該データを利用するアプリケーションへと提供する、データフローを制御するためのデータフロー制御方法であって、
前記アプリケーションからデータ要求を受けた場合に、前記複数のデバイスのそれぞれにおいて得られるデータである複数のデバイス指標と、前記アプリケーションが制御又は予測する指標である目的指標とを少なくとも含む、複数の指標のあいだの因果関係を表す因果ネットワークに基づき、前記アプリケーションの目的指標と因果関係を有する少なくとも1つのデバイス指標を前記複数のデバイス指標の中から選択するステップと、
前記選択されたデバイス指標に対応するデバイスにおいて得られるデータが、前記アプリケーションへ提供されるように、データフローを制御するステップと、
を有することを特徴とするデータフロー制御方法。 A data flow control method for controlling a data flow, which provides data obtained in at least one of a plurality of devices to an application that uses the data,
When receiving a data request from the application, a plurality of indicators including at least a plurality of device indicators that are data obtained in each of the plurality of devices and a target indicator that is an indicator that is controlled or predicted by the application. Selecting at least one device index having a causal relationship with a purpose index of the application from the plurality of device indices based on a cause-and-effect network representing an inter-causal relationship;
Controlling the data flow such that data obtained at a device corresponding to the selected device index is provided to the application;
A data flow control method comprising: - 請求項6に記載のデータフロー制御方法の各ステップをコンピュータに実行させる
ことを特徴とするプログラム。 A program for causing a computer to execute each step of the data flow control method according to claim 6. - センシングデータを出力するセンサを管理する情報処理装置が読み取り可能なデータストリームであって、
前記センシングデータを利用するアプリケーションを特定する情報と、
前記アプリケーションが制御又は予測する指標である目的指標と因果関係を有するセンシングデータを出力するものとして選択されたセンサを特定する情報と、
前記選択されたセンサで得られるセンシングデータと前記目的指標のあいだの因果関係情報と、
を含むことを特徴とする制御指令データストリーム。 A data stream that can be read by an information processing device that manages a sensor that outputs sensing data,
Information for identifying an application that uses the sensing data;
Information identifying the sensor selected to output sensing data having a causal relationship with a target index that is an index that the application controls or predicts;
Causal relationship information between sensing data obtained by the selected sensor and the objective index,
A control command data stream comprising: - 前記因果関係情報は、前記センシングデータと前記目的指標のあいだの因果強度の情報と、前記センシングデータの影響が前記目的指標に伝播するのにかかる遅延時間の情報とを含む
ことを特徴とする請求項8に記載の制御指令データストリーム。 The causal relationship information includes causal intensity information between the sensing data and the objective indicator, and information on a delay time required for the influence of the sensing data to propagate to the objective indicator. Item 9. The control command data stream according to Item 8.
Priority Applications (2)
| Application Number | Priority Date | Filing Date | Title |
|---|---|---|---|
| EP16817928.1A EP3318976B1 (en) | 2015-06-30 | 2016-06-28 | Data flow control device and data flow control method |
| US15/576,470 US11748326B2 (en) | 2015-06-30 | 2016-06-28 | Data flow control device and data flow control method |
Applications Claiming Priority (2)
| Application Number | Priority Date | Filing Date | Title |
|---|---|---|---|
| JP2015-131161 | 2015-06-30 | ||
| JP2015131161A JP6398894B2 (en) | 2015-06-30 | 2015-06-30 | Data flow control device and data flow control method |
Publications (1)
| Publication Number | Publication Date |
|---|---|
| WO2017002820A1 true WO2017002820A1 (en) | 2017-01-05 |
Family
ID=57608639
Family Applications (1)
| Application Number | Title | Priority Date | Filing Date |
|---|---|---|---|
| PCT/JP2016/069174 WO2017002820A1 (en) | 2015-06-30 | 2016-06-28 | Data flow control device and data flow control method |
Country Status (4)
| Country | Link |
|---|---|
| US (1) | US11748326B2 (en) |
| EP (1) | EP3318976B1 (en) |
| JP (1) | JP6398894B2 (en) |
| WO (1) | WO2017002820A1 (en) |
Cited By (1)
| Publication number | Priority date | Publication date | Assignee | Title |
|---|---|---|---|---|
| US20180157692A1 (en) * | 2015-06-30 | 2018-06-07 | Omron Corporation | Data flow control device and data flow control method |
Families Citing this family (8)
| Publication number | Priority date | Publication date | Assignee | Title |
|---|---|---|---|---|
| JP6390692B2 (en) * | 2016-12-15 | 2018-09-19 | オムロン株式会社 | Data distribution system, instruction device, data distribution device, sensor management device, data distribution method, and program |
| JP6718827B2 (en) * | 2017-01-27 | 2020-07-08 | ローム株式会社 | Management system utilizing IoT and water heater data transmission system applying the same |
| JP6872919B2 (en) * | 2017-02-03 | 2021-05-19 | 株式会社日立製作所 | Sensor network management method and sensor network management system |
| JP6489250B1 (en) * | 2018-02-13 | 2019-03-27 | オムロン株式会社 | Candidate extraction apparatus, candidate extraction method and program |
| US11093873B2 (en) * | 2018-03-30 | 2021-08-17 | Atlassian Pty Ltd. | Using a productivity index and collaboration index for validation of recommendation models in federated collaboration systems |
| US11249469B2 (en) | 2018-09-28 | 2022-02-15 | Rockwell Automation Technologies, Inc. | Systems and methods for locally modeling a target variable |
| CN110321458B (en) * | 2019-05-21 | 2021-10-15 | 国家电网有限公司 | Data flow analysis method and device based on control flow graph |
| CN116711288A (en) * | 2020-08-27 | 2023-09-05 | 西门子股份公司 | Centralized management of dataflow graphs for distributed edge node deployment |
Family Cites Families (54)
| Publication number | Priority date | Publication date | Assignee | Title |
|---|---|---|---|---|
| JP3501013B2 (en) | 1999-05-20 | 2004-02-23 | 日本電気株式会社 | Group position display device |
| KR100709964B1 (en) * | 2005-01-18 | 2007-04-25 | 삼성전자주식회사 | Routing method in wireless sense network |
| KR100683848B1 (en) * | 2005-10-11 | 2007-02-16 | 삼성전자주식회사 | Method for reducing power consumption of sensor in wireless sensor network and system thereof |
| US20070118496A1 (en) * | 2005-11-21 | 2007-05-24 | Christof Bornhoevd | Service-to-device mapping for smart items |
| US7890568B2 (en) * | 2006-04-28 | 2011-02-15 | Sap Ag | Service-to-device mapping for smart items using a genetic algorithm |
| JP4682912B2 (en) | 2006-05-08 | 2011-05-11 | 株式会社日立製作所 | Sensor network system, sensor network location program |
| US8296413B2 (en) * | 2006-05-31 | 2012-10-23 | Sap Ag | Device registration in a hierarchical monitor service |
| US8131838B2 (en) * | 2006-05-31 | 2012-03-06 | Sap Ag | Modular monitor service for smart item monitoring |
| US8614633B1 (en) * | 2007-01-08 | 2013-12-24 | Lockheed Martin Corporation | Integrated smart hazard assessment and response planning (SHARP) system and method for a vessel |
| JP5297272B2 (en) * | 2009-06-11 | 2013-09-25 | 株式会社日立製作所 | Device abnormality monitoring method and system |
| GB2490738A (en) * | 2011-05-13 | 2012-11-14 | En Twyn Ltd | A power line communications network controlled by an operating system in which network terminals include a processor. |
| JP5533820B2 (en) * | 2011-08-22 | 2014-06-25 | 富士通株式会社 | Sensor information management system, sensor information management method, sensor information management program |
| US20130073576A1 (en) * | 2011-09-19 | 2013-03-21 | International Business Machines Corporation | System and Protocol To Dynamically Query Sensor Data Collections |
| US8873429B2 (en) * | 2011-12-22 | 2014-10-28 | Infosys Limited | Method and system to dynamically detect and form a master slave network |
| WO2013153890A1 (en) * | 2012-04-12 | 2013-10-17 | オムロン株式会社 | Device management apparatus and device search method |
| JPWO2014030510A1 (en) * | 2012-08-22 | 2016-07-28 | オムロン株式会社 | Device management apparatus and device management method |
| US10121381B2 (en) * | 2012-09-12 | 2018-11-06 | Omron Corporation | Data flow control order generating apparatus and sensor managing apparatus |
| US9053430B2 (en) * | 2012-11-19 | 2015-06-09 | Qualcomm Incorporated | Method and apparatus for inferring logical dependencies between random processes |
| KR101479953B1 (en) * | 2013-03-11 | 2015-01-07 | 주식회사 케이티 | Method of controlling collection period of sensor data using analysis of dependency between sensor data, and network application server for controlling collection period of sensor data |
| CN103197445B (en) | 2013-03-27 | 2017-05-31 | 京东方科技集团股份有限公司 | Liquid crystal display and electronic equipment |
| US9319856B1 (en) * | 2014-08-26 | 2016-04-19 | Amazon Technologies, Inc. | Routing messages to user devices |
| CN107431844A (en) * | 2015-03-09 | 2017-12-01 | 瑞典爱立信有限公司 | For providing method, system and the equipment of live data stream to content presenting device |
| JP6398894B2 (en) * | 2015-06-30 | 2018-10-03 | オムロン株式会社 | Data flow control device and data flow control method |
| JP6398944B2 (en) * | 2015-10-28 | 2018-10-03 | オムロン株式会社 | Data distribution management system |
| JP6365519B2 (en) * | 2015-12-03 | 2018-08-01 | オムロン株式会社 | Data flow control device and data flow control method |
| JP6465012B2 (en) * | 2015-12-14 | 2019-02-06 | オムロン株式会社 | Data flow control device and data flow control method |
| JP6458755B2 (en) * | 2016-03-15 | 2019-01-30 | オムロン株式会社 | Data flow control device and data flow control method |
| JP6372508B2 (en) * | 2016-03-15 | 2018-08-15 | オムロン株式会社 | Data flow control device and data flow control method |
| JP6406335B2 (en) * | 2016-11-14 | 2018-10-17 | オムロン株式会社 | MATCHING DEVICE, MATCHING METHOD, AND PROGRAM |
| JP6406336B2 (en) * | 2016-11-14 | 2018-10-17 | オムロン株式会社 | Sensor opening test system, sensor opening test management terminal, sensor, sensor opening test method and program |
| JP6805791B2 (en) * | 2016-12-14 | 2020-12-23 | 株式会社Ihi | Information processing equipment, information processing methods and information processing systems |
| JP6380517B2 (en) * | 2016-12-15 | 2018-08-29 | オムロン株式会社 | Control device, sensor management device, control method, sensor management method, and program |
| JP6390692B2 (en) * | 2016-12-15 | 2018-09-19 | オムロン株式会社 | Data distribution system, instruction device, data distribution device, sensor management device, data distribution method, and program |
| JP6848426B2 (en) * | 2016-12-27 | 2021-03-24 | 富士通株式会社 | Communication devices, communication systems, programs and communication control methods |
| WO2018142764A1 (en) * | 2017-02-03 | 2018-08-09 | パナソニックIpマネジメント株式会社 | Learned model generating method, learned model generating device, and learned model use device |
| EP3579153A4 (en) * | 2017-02-03 | 2020-04-15 | Panasonic Intellectual Property Management Co., Ltd. | Learned model provision method and learned model provision device |
| WO2018142598A1 (en) * | 2017-02-03 | 2018-08-09 | 株式会社日立製作所 | Sensor network management system and sensor network management method |
| US10803407B2 (en) * | 2017-02-03 | 2020-10-13 | Panasonic Intellectual Property Management Co., Ltd. | Method for selecting learned model corresponding to sensing data and provisioning selected learned model, and learned model provision device |
| JP6872919B2 (en) * | 2017-02-03 | 2021-05-19 | 株式会社日立製作所 | Sensor network management method and sensor network management system |
| JP6515937B2 (en) * | 2017-02-08 | 2019-05-22 | 横河電機株式会社 | Event analysis apparatus, event analysis system, event analysis method, event analysis program, and recording medium |
| JP2018147290A (en) * | 2017-03-07 | 2018-09-20 | オムロン株式会社 | Sensor metadata generation apparatus, sensor metadata generation system, sensor metadata generation method, and sensor meta data generation program |
| EP3637285A4 (en) * | 2017-06-06 | 2020-11-11 | Omron Corporation | Score calculation unit, retrieval device, score calculation method, and score calculation program |
| CN110678911A (en) * | 2017-08-01 | 2020-01-10 | 欧姆龙株式会社 | Sensor management unit, sensor device, sensed data providing method, and sensed data providing program |
| CN110679165A (en) * | 2017-08-01 | 2020-01-10 | 欧姆龙株式会社 | Sensing equipment management device |
| WO2019026711A1 (en) * | 2017-08-02 | 2019-02-07 | オムロン株式会社 | Sensor device, background noise data transmission method, and background noise data transmission program |
| EP3664057B1 (en) * | 2017-08-02 | 2023-05-10 | Omron Corporation | Sensor management unit, sensing data distribution system, sensing data evaluation method, and sensing data evaluation program |
| WO2019026635A1 (en) * | 2017-08-03 | 2019-02-07 | オムロン株式会社 | Matching processing device |
| JP6930276B2 (en) * | 2017-08-09 | 2021-09-01 | オムロン株式会社 | Sensor management unit, sensor device, sensing data management method, and sensing data management program |
| WO2019058725A1 (en) * | 2017-09-19 | 2019-03-28 | オムロン株式会社 | Mobile sensor management unit, mobile sensor apparatus, matching apparatus, sensing data distribution system, data provision method, and data provision program |
| JP6424993B1 (en) * | 2017-09-19 | 2018-11-21 | オムロン株式会社 | Mobile sensor management unit, mobile sensor device, matching device, sensing data distribution system, data providing method, and data providing program |
| US11700305B2 (en) * | 2017-09-19 | 2023-07-11 | Omron Corporation | Moving sensor management unit, moving sensor apparatus, matching apparatus, sensing data distribution system, data provision method, and data provision program |
| JP6432719B1 (en) * | 2017-09-19 | 2018-12-05 | オムロン株式会社 | MOBILE SENSOR MANAGEMENT UNIT, MOBILE SENSOR DEVICE, MATCHING DEVICE, SENSING DATA DISTRIBUTION SYSTEM, DATA PROVIDING METHOD, AND DATA PROVIDING PROGRAM |
| US11140042B2 (en) * | 2019-09-18 | 2021-10-05 | Servicenow, Inc. | Dictionary-based service mapping |
| GB2588107B (en) * | 2019-10-07 | 2022-11-02 | British Telecomm | Secure publish-subscribe communication methods and apparatus |
-
2015
- 2015-06-30 JP JP2015131161A patent/JP6398894B2/en active Active
-
2016
- 2016-06-28 WO PCT/JP2016/069174 patent/WO2017002820A1/en active Application Filing
- 2016-06-28 EP EP16817928.1A patent/EP3318976B1/en active Active
- 2016-06-28 US US15/576,470 patent/US11748326B2/en active Active
Non-Patent Citations (2)
| Title |
|---|
| KAZUKI KOMURA ET AL.: "Ido Entropy o Mochiita Meigarakan Eikyodo Network ni yoru Toshi Shihyo no Bunseki", DAI 13 KAI JSAI SPECIAL INTEREST GROUP ON FINANCIAL INFOMATICS SHIRYO (SIG-FIN- 013-08, 11 October 2014 (2014-10-11), pages 1 - 6, XP009507970 * |
| TETSUYA NAKAMURA ET AL.: "Context handling architecture for adaptive networking services", IPSJ SIG NOTES, vol. 2000, no. 14, 4 February 2000 (2000-02-04), pages 83 - 90, XP009507959 * |
Cited By (2)
| Publication number | Priority date | Publication date | Assignee | Title |
|---|---|---|---|---|
| US20180157692A1 (en) * | 2015-06-30 | 2018-06-07 | Omron Corporation | Data flow control device and data flow control method |
| US11748326B2 (en) * | 2015-06-30 | 2023-09-05 | Omron Corporation | Data flow control device and data flow control method |
Also Published As
| Publication number | Publication date |
|---|---|
| EP3318976A1 (en) | 2018-05-09 |
| EP3318976A4 (en) | 2019-03-20 |
| JP6398894B2 (en) | 2018-10-03 |
| US11748326B2 (en) | 2023-09-05 |
| US20180157692A1 (en) | 2018-06-07 |
| EP3318976B1 (en) | 2023-11-29 |
| JP2017016306A (en) | 2017-01-19 |
Similar Documents
| Publication | Publication Date | Title |
|---|---|---|
| JP6398894B2 (en) | Data flow control device and data flow control method | |
| JP6465012B2 (en) | Data flow control device and data flow control method | |
| WO2017094442A1 (en) | Data flow control apparatus and data flow control method | |
| JP2023055853A (en) | Learned dynamically controlling combined system | |
| White et al. | Qos prediction for reliable service composition in iot | |
| WO2014050192A1 (en) | Device management apparatus and device search method | |
| KR102391510B1 (en) | Method, device and system for predicting failure in advance of it infrastructure equipment based on artificial intelligence | |
| JP7442550B2 (en) | Inference calculation device, model training device, and inference calculation system | |
| Wen et al. | Fog orchestration for IoT services: issues, challenges and directions | |
| US8996341B2 (en) | Generating and evaluating expert networks | |
| WO2017033443A1 (en) | Traffic-congestion prediction system, traffic-congestion prediction method, and recording medium | |
| Mohamed et al. | SBDaaS: Smart building diagnostics as a service on the cloud | |
| WO2020189086A1 (en) | Control system, setting device and setting program | |
| JP2018049321A (en) | Estimation device, estimation method, and estimation program | |
| Magableh et al. | A deep recurrent Q network towards self‐adapting distributed microservice architecture | |
| Tripathy et al. | Sustainable fog-assisted intelligent monitoring framework for consumer electronics in Industry 5.0 applications | |
| JPWO2014054231A1 (en) | Information system construction support apparatus, information system construction support method, and information system construction support program | |
| Khabou et al. | A novel analysis approach for the design and the development of context-aware applications | |
| US10320700B2 (en) | Apparatus for managing optimized asset of distributed resources and operation method of the same | |
| Javed et al. | Fog paradigm for local energy management systems | |
| KR101575982B1 (en) | System and method to guarantee quality of service of iot terminal installed and deployed in a region of a certain range such as a home or store or mash-up services | |
| Ninagawa | IoT Communication Performance Analysis | |
| Shi et al. | A Prototype Tool of Optimal Wireless Sensor Placement for Structural Health Monitoring | |
| Hore et al. | Intelligent Predictive Maintenance for Industrial Internet of Things (IIoT) Using Machine Learning Approach | |
| JP7245403B2 (en) | Behavior prediction system and method in buildings |
Legal Events
| Date | Code | Title | Description |
|---|---|---|---|
| 121 | Ep: the epo has been informed by wipo that ep was designated in this application |
Ref document number: 16817928 Country of ref document: EP Kind code of ref document: A1 |
|
| WWE | Wipo information: entry into national phase |
Ref document number: 15576470 Country of ref document: US |
|
| NENP | Non-entry into the national phase |
Ref country code: DE |