EP3318976B1 - Data flow control device and data flow control method - Google Patents
Data flow control device and data flow control method Download PDFInfo
- Publication number
- EP3318976B1 EP3318976B1 EP16817928.1A EP16817928A EP3318976B1 EP 3318976 B1 EP3318976 B1 EP 3318976B1 EP 16817928 A EP16817928 A EP 16817928A EP 3318976 B1 EP3318976 B1 EP 3318976B1
- Authority
- EP
- European Patent Office
- Prior art keywords
- index
- application
- data
- causal
- indices
- Prior art date
- Legal status (The legal status is an assumption and is not a legal conclusion. Google has not performed a legal analysis and makes no representation as to the accuracy of the status listed.)
- Active
Links
- 238000000034 method Methods 0.000 title claims description 11
- 230000001364 causal effect Effects 0.000 claims description 136
- 238000012546 transfer Methods 0.000 claims description 13
- 238000004364 calculation method Methods 0.000 claims description 8
- 230000000694 effects Effects 0.000 description 33
- 238000012545 processing Methods 0.000 description 24
- 230000006870 function Effects 0.000 description 17
- 230000000875 corresponding effect Effects 0.000 description 13
- 238000005516 engineering process Methods 0.000 description 13
- 238000011161 development Methods 0.000 description 10
- 238000013461 design Methods 0.000 description 9
- 230000001276 controlling effect Effects 0.000 description 8
- 238000004891 communication Methods 0.000 description 7
- 238000010586 diagram Methods 0.000 description 7
- 230000002349 favourable effect Effects 0.000 description 5
- 230000007246 mechanism Effects 0.000 description 5
- 230000007257 malfunction Effects 0.000 description 4
- 238000004458 analytical method Methods 0.000 description 3
- 238000005259 measurement Methods 0.000 description 3
- 230000005540 biological transmission Effects 0.000 description 2
- 238000005286 illumination Methods 0.000 description 2
- 230000001965 increasing effect Effects 0.000 description 2
- 230000010365 information processing Effects 0.000 description 2
- 238000007726 management method Methods 0.000 description 2
- 238000005070 sampling Methods 0.000 description 2
- 230000009471 action Effects 0.000 description 1
- 230000003044 adaptive effect Effects 0.000 description 1
- 238000004378 air conditioning Methods 0.000 description 1
- 230000008859 change Effects 0.000 description 1
- 230000002596 correlated effect Effects 0.000 description 1
- 238000013480 data collection Methods 0.000 description 1
- 238000013500 data storage Methods 0.000 description 1
- 230000003247 decreasing effect Effects 0.000 description 1
- 230000003111 delayed effect Effects 0.000 description 1
- 230000001419 dependent effect Effects 0.000 description 1
- 238000005265 energy consumption Methods 0.000 description 1
- 230000002708 enhancing effect Effects 0.000 description 1
- 238000011156 evaluation Methods 0.000 description 1
- 230000003203 everyday effect Effects 0.000 description 1
- 238000009434 installation Methods 0.000 description 1
- 230000006855 networking Effects 0.000 description 1
- 238000005457 optimization Methods 0.000 description 1
- 238000013139 quantization Methods 0.000 description 1
- 230000005855 radiation Effects 0.000 description 1
- 230000009467 reduction Effects 0.000 description 1
- 238000011160 research Methods 0.000 description 1
- 239000010454 slate Substances 0.000 description 1
- 230000002123 temporal effect Effects 0.000 description 1
Images


Classifications
-
- G—PHYSICS
- G06—COMPUTING; CALCULATING OR COUNTING
- G06F—ELECTRIC DIGITAL DATA PROCESSING
- G06F16/00—Information retrieval; Database structures therefor; File system structures therefor
- G06F16/20—Information retrieval; Database structures therefor; File system structures therefor of structured data, e.g. relational data
- G06F16/22—Indexing; Data structures therefor; Storage structures
- G06F16/2228—Indexing structures
- G06F16/2272—Management thereof
-
- G—PHYSICS
- G06—COMPUTING; CALCULATING OR COUNTING
- G06F—ELECTRIC DIGITAL DATA PROCESSING
- G06F17/00—Digital computing or data processing equipment or methods, specially adapted for specific functions
- G06F17/10—Complex mathematical operations
- G06F17/18—Complex mathematical operations for evaluating statistical data, e.g. average values, frequency distributions, probability functions, regression analysis
-
- G—PHYSICS
- G06—COMPUTING; CALCULATING OR COUNTING
- G06F—ELECTRIC DIGITAL DATA PROCESSING
- G06F13/00—Interconnection of, or transfer of information or other signals between, memories, input/output devices or central processing units
-
- G—PHYSICS
- G06—COMPUTING; CALCULATING OR COUNTING
- G06F—ELECTRIC DIGITAL DATA PROCESSING
- G06F16/00—Information retrieval; Database structures therefor; File system structures therefor
- G06F16/20—Information retrieval; Database structures therefor; File system structures therefor of structured data, e.g. relational data
- G06F16/28—Databases characterised by their database models, e.g. relational or object models
- G06F16/284—Relational databases
- G06F16/288—Entity relationship models
-
- G—PHYSICS
- G06—COMPUTING; CALCULATING OR COUNTING
- G06F—ELECTRIC DIGITAL DATA PROCESSING
- G06F16/00—Information retrieval; Database structures therefor; File system structures therefor
- G06F16/90—Details of database functions independent of the retrieved data types
- G06F16/901—Indexing; Data structures therefor; Storage structures
- G06F16/9024—Graphs; Linked lists
-
- H—ELECTRICITY
- H04—ELECTRIC COMMUNICATION TECHNIQUE
- H04L—TRANSMISSION OF DIGITAL INFORMATION, e.g. TELEGRAPHIC COMMUNICATION
- H04L67/00—Network arrangements or protocols for supporting network services or applications
- H04L67/01—Protocols
- H04L67/10—Protocols in which an application is distributed across nodes in the network
- H04L67/1097—Protocols in which an application is distributed across nodes in the network for distributed storage of data in networks, e.g. transport arrangements for network file system [NFS], storage area networks [SAN] or network attached storage [NAS]
-
- H—ELECTRICITY
- H04—ELECTRIC COMMUNICATION TECHNIQUE
- H04M—TELEPHONIC COMMUNICATION
- H04M11/00—Telephonic communication systems specially adapted for combination with other electrical systems
-
- H—ELECTRICITY
- H04—ELECTRIC COMMUNICATION TECHNIQUE
- H04W—WIRELESS COMMUNICATION NETWORKS
- H04W4/00—Services specially adapted for wireless communication networks; Facilities therefor
- H04W4/30—Services specially adapted for particular environments, situations or purposes
- H04W4/38—Services specially adapted for particular environments, situations or purposes for collecting sensor information
-
- H—ELECTRICITY
- H04—ELECTRIC COMMUNICATION TECHNIQUE
- H04W—WIRELESS COMMUNICATION NETWORKS
- H04W4/00—Services specially adapted for wireless communication networks; Facilities therefor
- H04W4/70—Services for machine-to-machine communication [M2M] or machine type communication [MTC]
Definitions
- the present invention relates to a technology for controlling a dataflow and that provides data obtained in a device such as a sensor to an application that utilizes the data.
- M2M Machine to Machine
- M2M Cloud The platform obtained by realizing such M2M technology in a cloud computing environment is called an M2M Cloud.
- M2M Cloud This provides basic functions required for M2M and services ranging, for example, from data collection and storage to processing and analysis as applications on a cloud, enabling utilization from anywhere. Collective management of data can enhance reliability and completeness. Also, for users, there is the merit of being able to utilize as much collected data and as many computer resources as needed. Thus, it is possible to analyze big data and obtain added value without building a system individually, and application in a wide range of fields is expected.
- Patent Document 1 a technology called a sensor network is being investigated.
- This technology enables collection, management and seamless utilization of sensing data, by installing sensor devices (hereinafter, also referred to simply as "sensors") having a sensing function and a communication function at various locations or industrial facilities, and networking these sensors.
- sensor devices hereinafter, also referred to simply as "sensors”
- sensors are installed in order to collect data that is required by the entity to which the sensors belong.
- the sensing data is not utilized (the sensors themselves are not operating or the sensing data is not utilized even when the sensors are operating) except when data is collected by the entity to which the sensors belong.
- the distributability of the sensing data is low, and no matter how significant the data is to a third party, analysis and utilization is limited to the entity to which the sensors belong. As a result, this causes overlapping investment of facilities and network congestion due to communication with individually installed sensors.
- IoT Internet of Things
- the applicant of the present invention in order to realize a mechanism for appropriately distributing resources such as sensing data in IoT, investigated a system that specifies sensors capable of acquiring sensing data that satisfies a request from an application, and controls the dataflow from the sensors to the application, by performing matching of "sensor-side metadata" in which information relating to the sensors is described with "app-side metadata” in which information relating to the application that utilizes the sensing data is described (see Patent Document 3).
- a dataflow control apparatus is known from each of the articles " Graph-based formalism for Machine-to-Machine self-managed communications" by Cédric Eichler et AL (DOI: 10.1109/WETICE.2013.45 ), " Graph based M2M optimization in an IoT Environment” by Anand Paul, published in PROCEESINGS OF THE 2013 RESEARCH IN ADAPTIVE AND CONVERGENT SYSTEMS ON; RAC'S 13, 1 October 2013, pages 45-46 , and " A Survey on M2M Service Networks" by Juhani Latvakoski et AL, published in COMPUTERS, vol. 3, no. 4, pages 130-173 .
- the network configuration i.e., available sensors and acquirable data
- the network configuration could possibly be ever-changing due to stoppage, malfunction, movement and the like of sensors, and situations in which sensing data is not obtained as defined can also arise.
- a flexible mechanism that is able to provide the most appropriate sensors and sensing data from among the available sensors and acquirable data is desirable.
- the present invention was made in view of the above situation, and an object thereof is to provide a technology for further facilitating utilization of data in a device network.
- An aspect is a dataflow control apparatus for controlling a dataflow and that provides data obtained in at least one device among a plurality of devices to an application that utilizes the data, the apparatus including a causal network storage unit that stores a causal network representing a causal relationship between a plurality of indices that include at least a plurality of device indices which are respectively data obtained in the plurality of devices and an objective index which is an index that the application controls or predicts, a device index selection unit that selects, based on the causal network, at least one device index having a causal relationship with the objective index of the application, from among the plurality of device indices, in a case where a data request is received from the application, and a dataflow control unit that controls the dataflow, such that data obtained in the device corresponding to the selected device index is provided to the application.
- a causal network storage unit that stores a causal network representing a causal relationship between a plurality of indices that include at least a plurality of device indices which are respectively data obtained in the plurality
- the objective of the application index that the application controls or predicts
- data that has a causal relationship with the objective is automatically provided to the application from a corresponding device. Accordingly, design and development of applications become possible, even without knowing what kind of devices exist in the device network, what kind of data can be acquired, or what kind of data to refer to in order to perform the control or prediction serving as the objective. Therefore, compared with former technologies, design and development of applications utilizing data in the device network is facilitated, and utilization and distribution of data in the device network are promoted.
- the causal relationship includes information on a causal strength between two indices and information on a delay time taken for an influence of one of the two indices to propagate to the other index.
- a causal relationship that takes into consideration the time delay (propagation delay) from one index (cause index) to the other index (effect index) can be evaluated.
- the causal relationship is defined using transfer entropy.
- the causal relationship associated with the time delay (propagation delay) and the causal strength of that relationship can be appropriately derived by using transfer entropy.
- the device index selection unit preferentially selects, in the causal network, the device index whose distance to the objective index is closest, preferentially selects the device index whose causal strength is strongest in a case where distances are the same, and preferentially selects the device index whose delay time is shortest in a case where distances and causal strengths are the same.
- the device index having the strongest relationship with the objective index can be selected. Using a device index selected in this way enables the value of the objective index to be inferred with high validity.
- the device index selection unit checks whether the devices are active or inactive, and excludes the device indices corresponding to inactive devices from selection.
- devices that are in an inactive state state where data cannot be acquired
- a cause of some sort such as malfunction, stoppage, movement or the like
- an appropriate device can be automatically selected, from among the devices that are currently active, and the robustness of the system can be enhanced.
- An aspect is a dataflow control method for controlling a dataflow and that provides data obtained in at least one device among of a plurality of devices to an application that utilizes the data, the method including a step of selecting, based on a causal network representing a causal relationship between a plurality of indices that include at least a plurality of device indices which are respectively data obtained in the plurality of devices and an objective index which is an index that the application controls or predicts, at least one device index having a causal relationship with the objective index of the application, from among the plurality of device indices, in a case where a data request is received from the application, and a step of controlling the dataflow, such that data obtained in the device corresponding to the selected device index is provided to the application.
- An aspect is a program that causes a computer to execute the steps of the dataflow control method recited above.
- the objective of the application index that the application controls or predicts
- data having a causal relationship with the objective is automatically provided to the application from a corresponding device. Accordingly, design and development of applications become possible, even without knowing what kind of devices exist in the device network, what kind of data can be acquired, or what kind of data to refer to in order to perform the control or prediction serving as the objective. Therefore, compared with former technologies, design and development of applications utilizing data in the device network is facilitated, and utilization and distribution of data in the device network are promoted.
- a not claimed aspect is a control command data stream readable by an information processing apparatus for managing sensors that output sensing data, the data stream including information specifying an application that utilizes the sensing data, information specifying a sensor selected to output sensing data having a causal relationship with an objective index which is an index that the application controls or predicts, and information on the causal relationship between the sensing data obtained by the selected sensor and the objective index.
- an information processing apparatus for managing sensors that output sensing data
- the data stream including information specifying an application that utilizes the sensing data, information specifying a sensor selected to output sensing data having a causal relationship with an objective index which is an index that the application controls or predicts, and information on the causal relationship between the sensing data obtained by the selected sensor and the objective index.
- the causal relationship information includes information on a causal strength between the sensing data and the objective index and information on a delay time taken for an influence of the sensing data to propagate to the objective index.
- dataflow control that takes into consideration the time delay (propagation delay) from the sensing data (cause index) to the objective index (effect index) can be realized.
- the present invention can be regarded as a dataflow control apparatus having at least part of the above configurations or functions.
- the present invention can also be regarded as a device network system, a sensor network system or an actuator network system having a dataflow control apparatus.
- the present invention can also be regarded as a dataflow control method including at least part of the above processing, or a program for causing a computer to execute this method, or a computer-readable recording medium on which such a program is recorded in a non-transitory manner.
- the present invention can be constituted by combining the above configurations and various processing as long as technical inconsistencies do not occur.
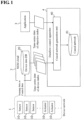
- Fig. 1 is a block diagram showing functions related to generation of a causal network of the device network system
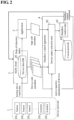
- Fig. 2 is a block diagram showing functions related to dataflow control of the device network system.
- the device network system is a mechanism capable of providing data that is acquired in a large number of devices online and in real time to an application that utilizes the data.
- the device network system is mainly constituted by a device network 1, an M2M cloud server 2, an application 3, a dataflow control apparatus 4, and the like.
- the device network 1 is a network that is constituted by a large number of devices 10.
- the devices 10 can be suitably designed in terms of number, type, installation position, network configuration, communication method and the like, and are not particularly limited in these respects.
- Each of the devices 10 is able to communicate with the M2M cloud server 2, the application 3 and the dataflow control apparatus 4 via a wide area network such as the Internet, for example.
- the devices 10 are each a device that acts on a target region that is designated in space or space-time, and can be broadly divided into “sensors” and "actuators".
- space is a region that is defined in two dimensions (x, y) or three dimensions (x, y, z)
- space-time is a region in which the dimension of "time(t)” is added to "space”, or in other words, a region that is defined in three dimensions (x, y; t) or four dimensions (x, y, z; t).
- the word “sensor” is used to mean a device that detects (acquires) the state of the target region
- the word “actuator” is used to mean a device that changes the state of the target region.
- Sensors include image sensors (cameras), temperature sensors, humidity sensors, illumination sensors, force sensors, sound sensors, RFID sensors, infrared sensors, attitude sensors, rainfall sensors, radiation sensors and gas sensors, for example, and any type of sensor can be utilized in the system of the present invention.
- actuators include various devices such as motors, solenoids, controllers, robots, lighting, speakers, displays, digital signage and air-conditioning, for example, and any type of actuator can be utilized in the system of the present invention.
- the M2M cloud server 2 is a server system that manages information relating the devices 10 constituting the device network 1, data acquired by the devices 10 and the like, and that provides data acquired by the devices 10 to a user (application 3) via a wide area network.
- the M2M cloud server 2 has a device data DB 20 which is a database for managing the devices 10.
- the device data DB 20 is registered, as information relating to the devices, attribute information of the devices (type of device, position and posture of device, entity to which device belongs, device ID, network address, operation history, etc.), attribute information (positional range, temporal range, etc.) of the target region (region in which sensing is performed, region in which actuator acts), attribute information (type, physical attribute, object ID, etc.) of the object (object of sensing, object on which actuator acts), attribute information of operations (controllable items, sampling specifications of sensing, quantization specifications, etc.), and attributes of data (administrator of data or entity to which data belongs, utilization range (e.g., limited to academic utilization, prohibition of commercial utilization, etc.), access authority zone, type of data, accuracy, system of units, reliability, utilizable range, price of utilization, data ID, etc.), for example.
- utilization range e.g., limited to academic utilization, prohibition of commercial utilization,
- the device data DB 20 is stored, as data acquired by the devices, sensing data (sensor measurement value) in the case of a sensor and control data (actuator control values) in the case of an actuator. It is favorable for not only the latest sensing data and control data but also for time-series data for a predetermined period to be stored.
- the application 3 is an apparatus or a software module that utilizes data obtained from the device network 1.
- an application that controls a control target on the basis of the data obtained from the device network 1 an application that predicts an unknown or a future state on the basis of the data obtained from the device network 1 or the like is envisaged.
- any application is applicable, such as an application that improves office productivity, an application that suppresses or predicts energy consumption in a factory, or an application that performs traffic jam prediction.
- the dataflow control apparatus 4 has a function of matching conditions between the devices and the application, and controlling the dataflow such that data required by the application to attain the intended objective (control or prediction) is provided from an appropriate device.
- the dataflow control apparatus 4 implements (1) a function (see Fig. 1 ) of generating a causal network representing a causal relationship between a plurality of indices that include at least data (called a "device index”) that is obtained in each of the devices 10 and an index (called an "objective index”) that the application 3 controls or predicts, and (2) a function (see Fig. 2 ) of selecting a device index having a causal relationship with the objective index, using this causal network, and controlling the dataflow such that the data of the selected device index is provided to the application 3.
- an index that the application controls refers to an index representing the state of the control target that the application controls or the like, and is, for example, an index that can be observed by measuring the state or output of the control target using a sensor or the like.
- an index directly or indirectly representing productivity in the case of an application that improves office productivity the number of transactions per unit time, sales or the like can be used as the objective index.
- an index that the application predicts refers to an index that the application predicts or infers through calculation. For example, in the case of an application that performs traffic jam prediction, the time expected to travel the road, the length of the traffic jam and the like can be used as the objective index. A detailed description thereof will be given.
- the M2M cloud server 2 an apparatus that executes the application 3 and the dataflow control apparatus 4 can all be constituted by a general-purpose computer that has a CPU (central processing unit), a memory, an auxiliary storage device, a communication IF, an input device, a display device, and the like. Functions and processing which will be discussed later are realized by the CPU loading and executing programs stored in the auxiliary storage device.
- the computer may be a personal computer, a smartphone, a portable information terminal or the like, or may be a server computer. Also, the processing may be performed, not by one computer, but through distributed processing by a plurality of computers.
- Figs. 3 and 4 are flowcharts of processing for generating a causal network
- Fig. 5 is an example of time-series data of an objective index
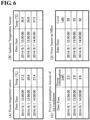
- Figs. 6A to 6D show examples of time-series data of device indices
- Fig. 7 shows an example of causal relationship data
- Fig. 8 shows an example of a causal network.
- a causal network generation unit 40 of the dataflow control apparatus 4 acquires time-series data of the objective index from the application 3 (step S30).
- An example of time-series data of the objective index is shown in Fig. 5 .
- index values (no unit) indicating the hourly productivity of the office are provided.
- This time-series data is data that the application 3 measures and records over a predetermined time period, and, for example, the number of transactions per unit time, sales or the like can be used as the objective index.
- the time period of the time-series data is arbitrary, although when the reliability of causal relationship inference is taken into consideration, it is favorable for time-series data for at least several days and desirably from several weeks to several months to be obtained.
- the causal network generation unit 40 acquires time-series data of the device index of each device 10 from the device data DB 20 of the M2M cloud server 2 (step S31). It is favorable to acquire various device indices such as, for example, time-series data of the room temperature measured with a temperature sensor installed in the office ( Fig. 6A ), time-series data of the outside temperature measured with a temperature sensor installed outside the office ( Fig. 6B ), time-series data of the power consumption amount of an air-conditioner in the office ( Fig. 6C ), and time-series data of the noise level measured by a noise sensor installed in the office ( Fig. 6D ).
- various device indices such as, for example, time-series data of the room temperature measured with a temperature sensor installed in the office ( Fig. 6A ), time-series data of the outside temperature measured with a temperature sensor installed outside the office ( Fig. 6B ), time-series data of the power consumption amount of an air-conditioner in the office (
- sensing data or control data such as, for example, the control value (temperature setting value) of the air-conditioner in the office, the control value of ceiling lighting in the office (brightness setting), the measurement value of an illumination sensor installed in the office, the power consumption amount for the entire office, the network load of the office LAN, and the number of prints of the office printer or photocopier.
- control value temperature setting value
- ceiling lighting in the office ceiling lighting in the office
- measurement value of an illumination sensor installed in the office the power consumption amount for the entire office
- the network load of the office LAN the number of prints of the office printer or photocopier.
- a configuration may be adopted in which, for example, the devices are roughly narrowed down to devices that appear to be relevant, based on the control target or prediction range of the application 3, the positional range or the like, and only the time-series data of the narrowed down devices is acquired from the M2M cloud server 2 (narrowing down of the devices may be performed by one of the M2M cloud server 2 and the dataflow control apparatus 4).
- the calculation cost incurred in generation of a causal network can thereby be reduced.
- the causal network generation unit 40 calculates the causal strength, correlation coefficient and delay time for all combinations of the two indices (cause and effect), based on the time series data of the objective index and the device indices (step S32).
- the processing of step S32 is shown in detail in the flowchart of Fig. 4 .
- m indices E1 to Em are obtained in accordance with the objective index and the device indices.
- the causal network generation unit 40 selects a group (Ei,Ej) of two indices from the m indices E1 to Em (step S41), and performs processing which will be discussed below.
- Ei represents the cause index
- Ej represents the effect index
- the causal network generation unit 40 sets a delay time s to a minimum value smin (step S42). The causal network generation unit 40 then derives the causal strength between the cause index Ei and the effect index Ej obtained after the time s (step S43). In the present embodiment, transfer entropy TEij is used as the causal strength.
- the transfer entropy is a measure or a technique for evaluating a causal relationship that takes into consideration the propagation time (delay time) between the two indices X and Y, and is a way of thinking that regards the average information amount (entropy) transferred from the index X to the index Y obtained after the time s as the strength of the influence that the cause index X exerts on the effect index Y obtained after the time s (i.e., causal strength).
- the correlation coefficient is based on a similar concept, the correlation coefficient differs from transfer entropy in that it only evaluates the degree of the linear relationship between the two indices X and the sign of the linear relationship, and does not take into consideration the direction of cause and effect (which index is cause and which is effect?) or the time delay.
- transfer entropy TE XY (s) relating to the delay time s in which the index X is the cause and the index Y is the effect can be calculated with the following equation.
- TE XY s log 2 P y t + s , y t , x t ⁇ P y t P y t , x t ⁇ P y t + s , y t
- P(a,b) represents the joint probability density variables of P(a) and P(b)
- [*] represents the time average of *.
- the transfer entropy can be calculated by supplying the time-series data and the delay time s of the two indices X and Y.
- TE XY (s) > TE YX (s) holds true between the value of TE XY (s) and the value of TEyx(s) calculated by interchanging cause and effect, in the case where a causal relationship in which X is the cause and Y is the effect exists between the indices X and Y. Therefore, the existence of a causal relationship and the direction of cause and effect can be judged, by evaluating the size relationship of the values of TE XY (s) and TE YX (s).
- the maximum value of the causal strength between the cause index X and the effect index Y and the delay time s at which the causal strength is at the maximum can be derived, by calculating the transfer entropy TE XY (s) for different values of s.
- step S41 the transfer entropy in the opposite direction, that is, transfer entropy TEji from the index Ej obtained after the time s to the index Ei is calculated, and if the transfer entropy in the opposite direction is larger (TEji > TEij), it is judged that a causal relationship in which the index Ei is the cause and the index Ej is the effect does not exist between two indices (Ei,Ej), and it is favorable to set the causal strength to zero.
- the causal network generation unit 40 calculates the correlation coefficient of the cause index Ei and the effect index Ej obtained after the time s (step S45). Since the calculation method of the correlation coefficient is well-known, description thereof is omitted.
- step S46 The processing of the above steps S43 to S45 is executed repeatedly while increasing the value of s by a time step width ⁇ s with each iteration (step S46), and when the processing is ended at a maximum value smax of the delay time (step S47), the causal network generation unit 40 shifts to processing of the next group of indices (step S48: NO).
- step S48: YES When evaluation of the causal relationship is ended for all groups of two indices (step S48: YES), the causal network generation unit 40 advances the processing to step S33 of Fig. 3 .
- the causal network generation unit 40 generates causal relationship data, and stores the generated data in a causal network storage unit 41 (step S33).
- Fig. 7 schematically shows an example of the data structure of the causal relationship data.
- the causal relationship data includes "object identification information" which is information for specifying the application 3 or the objective index, "index identification information” which is information for specifying what device each of the m indices was acquired from, and causal relationship information for every group of two indices.
- the ID of the application 3, the ID of the objective index and the like, for example, are described in the object identification information.
- the ID of the device corresponding to each index and the like, for example, is described in the index identification information. Note that an index 1 is given as the objective index, and the ID of the application 3 is described in the index identification information of the index 1.
- An exemplary data description of a causal relationship information Ark(3,4) of an element number (3,4) is shown below.
- Causality is strength information representing the maximum causal strength (transfer entropy) between the cause index i and the effect index j
- Delay is time information representing the delay time at which the causal strength is at the maximum
- Co_CoEf is correlation information representing the direction of change in the effect index j (is the correlation positive or negative?) relative to an increase or decrease in the cause index i.
- time is used as the unit of Delay
- the correlation coefficient between the cause index i and the effect index j obtained after Delay is used as the correlation information.
- Ark(i,j) is set to NULL, in the case where it is judged there is not a causal relationship between the indices i and j.
- Ark(i,j) of cells in which i j is also set to NULL.
- Fig. 8 is an example of a causal network in which the causal relationship between the indices is shown with a directed graph, on the basis of the causal relationship data of Fig. 7 .
- each node corresponds to an index
- the ID of the index and the ID of the corresponding device are associated with the node.
- the arc linking two nodes indicates the causal relationship between the two nodes and the direction of cause and effect (base end side of the arc is the cause node and arrow side of the arc is the effect node).
- the thickness of the arc shows the causal strength.
- the device index 4, the device index 6 and the device index 3 are useful in inferring the value or state of the objective index 1 of the application 3.
- Fig. 9 is a flowchart of processing for selecting device indices and processing for controlling dataflow
- Fig. 10 is a diagram schematically showing selection of a device index based on a causal network.
- the dataflow control apparatus 4 has a device index selection unit 42 and a dataflow control unit 43 as functions related to dataflow control.
- Causal relationship data already generated for the objective index of the application 3 is assumed to be stored in the causal network storage unit 41.
- the device index selection unit 42 acquires app-side metadata that serves as a data request from the application 3 (step S90).
- the ID of the objective index and the desired utilization time and fee, for example, are included in the app-side metadata.
- the device index selection unit 42 acquires device-side metadata of each device 10 from the device data DB 20 of the M2M cloud server 2 (step S91).
- the aforementioned information relating to the device is described in the device-side metadata. Note that in the case where the number of devices 10 constituting the device network 1 is huge, and it is not realistic to acquire the metadata of all the devices 10 in terms of data volume and calculation cost, only the metadata of some of the devices 10 may be acquired in step S91.
- a configuration may similarly be adopted in which, for example, the devices are roughly narrowed down to devices that appear to be relevant, based on the control target or prediction range of the application 3, the positional range or the like, and only the metadata of the narrowed down devices is acquired from the M2M cloud server 2 (narrowing down of the devices may be performed by one of the M2M cloud server 2 and the dataflow control apparatus 4).
- the device index selection unit 42 selects a device index having a causal relationship with the target index, based on the causal network (causal relationship data) stored in the causal network storage unit 41 (step S92).
- candidate device indices are selected in accordance with the following rules.
- Fig. 10 is a partial network, showing only the causal relationship that satisfies the condition that the causal strength is larger than a threshold value, in the causal network of Fig. 8 .
- candidates will be selected in the following order: index 4 ⁇ index 2 ⁇ index 6 ⁇ index 3.
- Device indices whose relationship with the objective index is strong can thereby be preferentially selected.
- the device index selection unit 42 checks whether the devices corresponding to the candidate indices selected at step S92 are active (step S93). Information indicating whether a device is active or inactive may be obtained directly from the device or may be obtained from the M2M cloud server 2 (e.g., the status of the device is checked using a ping command, etc.). If a device is inactive, that is, if in a state where current data (latest data) cannot be acquired from the device due to stoppage, malfunction, movement or the like of the device (step S93: NO), the device index selection unit 42 returns the processing to step S92 and selects the next candidate index.
- the device index selection unit 42 checks whether other conditions (e.g., price, utilization range, utilization time, etc.) described in the metadata match the request of the application 3 (step S94). If there are conditions that do not match (step S94: NO), the device index selection unit 42 returns the processing to step S92 and selects the next candidate index. As a result of the above processing, a device index having a causal relationship with the objective index, whose device is active and that also satisfies the other conditions is selected.
- other conditions e.g., price, utilization range, utilization time, etc.
- the dataflow control unit 43 then generates a dataflow control command that sets the transmission source to the device 10 corresponding to the selected device index and sets the transmission destination to the application 3, and transmits the dataflow control command to the M2M cloud server 2 (step S95).
- the dataflow control unit 43 transmits a dataflow control command that defines the dataflow from "the device C" to "the application 3" to the M2M cloud server 2.
- the following information, for example, is included in the dataflow control command.
- the M2M cloud server 2 serving as an information processing apparatus that manages devices such as sensors executes the next dataflow control, upon reading the dataflow control command (also called a control command data stream) that is issued (transmitted) from the dataflow control unit 43.
- the M2M cloud server 2 generates a prediction function f 6 ⁇ 4 that predicts (infers) the data of the index 4 from the data of the index 6, based on parameters such as the causal strength, the delay time and the correlation coefficient in the causal relationship information Ark(6,4).
- the M2M cloud server 2 generates a prediction function f 4 ⁇ 1 that predicts (infers) the data of the objective index 1 from the data of the index 4 in a similar manner.
- the data de and causal relationship information Ark(6,4) and Ark(4,1) or the data de and prediction functions f 6 ⁇ 4 , and f 4 ⁇ 1 may be transmitted to the application 3, and calculation of the value dp of the objective index 1 may be executed from the data de on the application 3 side.
- an appropriate device (device capable of acquiring data having a causal relationship with the objective index of the application 3) can be automatically selected, from among the devices that are currently active, and the robustness of the system can be enhanced.
- a causal network was utilized in order to select a device index to be provided to the application 3, but, pursuing this further, it is also possible to utilize a causal network in order for the application 3 to actively adjust the value of the objective index.
- the device indices 2, 4, 6 and 3 have been selected as indices that can affect the objective index 1.
- the value of the objective index 1 it is possible to cause the value of the objective index 1 to be adjusted (increased or decreased), by sending a device control command to the actuators from the application 3.
- indices devices
- devices devices
- sensors and actuators were shown as an example of devices, it is possible to use not only real devices but also virtual devices (e.g., modules configured to output one piece of sensing data generated by combining sensing data obtained with a plurality of sensors, etc.).
- actuators e.g., adjusting pan, tilt and zoom of a camera, changing the sampling period of measurement, etc.).
Description
- The present invention relates to a technology for controlling a dataflow and that provides data obtained in a device such as a sensor to an application that utilizes the data.
- Currently, an IT environment called M2M Cloud is garnering attention. M2M (Machine to Machine) refers to a system in which machines of various application, size and performance exchanges information over a network. By utilizing this information, appropriate control of the respective machines and situation analysis of everyday society becomes possible. As a result of improvements in wireless communication technology, miniaturization of machines, cost reductions and the like that support M2M, expectations for implementation are building.
- The platform obtained by realizing such M2M technology in a cloud computing environment is called an M2M Cloud. This provides basic functions required for M2M and services ranging, for example, from data collection and storage to processing and analysis as applications on a cloud, enabling utilization from anywhere. Collective management of data can enhance reliability and completeness. Also, for users, there is the merit of being able to utilize as much collected data and as many computer resources as needed. Thus, it is possible to analyze big data and obtain added value without building a system individually, and application in a wide range of fields is expected.
- Also, as shown in
Patent Document 1, a technology called a sensor network is being investigated. This technology enables collection, management and seamless utilization of sensing data, by installing sensor devices (hereinafter, also referred to simply as "sensors") having a sensing function and a communication function at various locations or industrial facilities, and networking these sensors. - Usually, sensors are installed in order to collect data that is required by the entity to which the sensors belong. Thus, it is often the case that the sensing data is not utilized (the sensors themselves are not operating or the sensing data is not utilized even when the sensors are operating) except when data is collected by the entity to which the sensors belong. Thus, the distributability of the sensing data is low, and no matter how significant the data is to a third party, analysis and utilization is limited to the entity to which the sensors belong. As a result, this causes overlapping investment of facilities and network congestion due to communication with individually installed sensors.
- Also, a technology called IoT (Internet of Things) is being investigated. Because this technology produces new values by combining information relating to many things that exist in the world over a network, seamless deployment of various services including social infrastructure is expected. In order to produce values from IoT, the state of the thing that is connected to the network needs to be known, and sensing and communication become important element technologies.
- In view of this, the applicant of the present invention, in order to realize a mechanism for appropriately distributing resources such as sensing data in IoT, investigated a system that specifies sensors capable of acquiring sensing data that satisfies a request from an application, and controls the dataflow from the sensors to the application, by performing matching of "sensor-side metadata" in which information relating to the sensors is described with "app-side metadata" in which information relating to the application that utilizes the sensing data is described (see Patent Document 3).
A dataflow control apparatus is known from each of the articles "Graph-based formalism for Machine-to-Machine self-managed communications" by Cédric Eichler et AL (DOI: 10.1109/WETICE.2013.45), "Graph based M2M optimization in an IoT Environment" by Anand Paul, published in PROCEESINGS OF THE 2013 RESEARCH IN ADAPTIVE AND CONVERGENT SYSTEMS ON; RAC'S 13, 1 October 2013, pages 45-46, and "A Survey on M2M Service Networks" by Juhani Latvakoski et AL, published in COMPUTERS, vol. 3, no. 4, pages 130-173. -
- Patent Document 1:
JP 2007-300571A - Patent Document 2:
JP 2000-331284A - Patent Document 3:
WO 2014/041826 - With the system of
Patent Document 3, the type and specification of sensing data that is required by an application must be defined in the app-side metadata. - However, it is not easy for a developer or a designer of an application to appropriately design what kind of sensing data to collect from what kind of device to be useful in control of the application, in order to attain the objective of the application. One of the reasons is that with IoT all of the sensors are connected to a network, and huge amounts of various types of sensing data are available. Also, a second reason is that since various events and elements are intricately related in the real world, it is extremely difficult to appropriately model that and ascertain sensing data (cause) having a strong causal relationship with the objective (effect) of the application.
- Also, even if the type and specification of required sensing data could be defined beforehand, the network configuration (i.e., available sensors and acquirable data) could possibly be ever-changing due to stoppage, malfunction, movement and the like of sensors, and situations in which sensing data is not obtained as defined can also arise. In order to enhance the robustness of the system, a flexible mechanism that is able to provide the most appropriate sensors and sensing data from among the available sensors and acquirable data is desirable.
- Note that while description has been given above taking a sensor network as an example, exactly the same issues can also arise in the case of a network of actuators (controllers). "Sensor" and "actuators (controllers)", despite differing in that one "detects (acquires) a state" whereas the other "changes a state", are similar in the fact that they both perform an action of some sort on a target region having a predetermined range. In the case of an actuator network, control data that is supplied to actuators is distributed, instead of the sensing data that is obtained from sensors. Hereinafter, the term "device" will be used as a concept that encompasses "sensors" and "actuators". Also, the term "device network" will be used as a concept that encompasses "sensor networks" and "actuator networks". It is also possible for both actuators and sensors to be connected in a device network.
- The present invention was made in view of the above situation, and an object thereof is to provide a technology for further facilitating utilization of data in a device network.
- The object is achieved by the features of the independent claims. Further preferred embodiments of the present invention are defined by the dependent claims. Aspects of the present invention are set out below. An aspect is a dataflow control apparatus for controlling a dataflow and that provides data obtained in at least one device among a plurality of devices to an application that utilizes the data, the apparatus including a causal network storage unit that stores a causal network representing a causal relationship between a plurality of indices that include at least a plurality of device indices which are respectively data obtained in the plurality of devices and an objective index which is an index that the application controls or predicts, a device index selection unit that selects, based on the causal network, at least one device index having a causal relationship with the objective index of the application, from among the plurality of device indices, in a case where a data request is received from the application, and a dataflow control unit that controls the dataflow, such that data obtained in the device corresponding to the selected device index is provided to the application.
- According to this aspect, when the objective of the application (index that the application controls or predicts) is supplied, data that has a causal relationship with the objective is automatically provided to the application from a corresponding device. Accordingly, design and development of applications become possible, even without knowing what kind of devices exist in the device network, what kind of data can be acquired, or what kind of data to refer to in order to perform the control or prediction serving as the objective. Therefore, compared with former technologies, design and development of applications utilizing data in the device network is facilitated, and utilization and distribution of data in the device network are promoted.
- According to an aspect, the causal relationship includes information on a causal strength between two indices and information on a delay time taken for an influence of one of the two indices to propagate to the other index. According to this aspect, a causal relationship that takes into consideration the time delay (propagation delay) from one index (cause index) to the other index (effect index) can be evaluated.
- According to an aspect, the causal relationship is defined using transfer entropy. According to this aspect, the causal relationship associated with the time delay (propagation delay) and the causal strength of that relationship can be appropriately derived by using transfer entropy.
- According to an aspect, the device index selection unit preferentially selects, in the causal network, the device index whose distance to the objective index is closest, preferentially selects the device index whose causal strength is strongest in a case where distances are the same, and preferentially selects the device index whose delay time is shortest in a case where distances and causal strengths are the same. According to this aspect, the device index having the strongest relationship with the objective index can be selected. Using a device index selected in this way enables the value of the objective index to be inferred with high validity.
- According to an aspect, the device index selection unit checks whether the devices are active or inactive, and excludes the device indices corresponding to inactive devices from selection. According to this aspect, devices that are in an inactive state (state where data cannot be acquired) due to a cause of some sort, such as malfunction, stoppage, movement or the like, are excluded from selection, for example. Accordingly, an appropriate device (device capable of acquiring data having a causal relationship with the objective index of the application) can be automatically selected, from among the devices that are currently active, and the robustness of the system can be enhanced.
- An aspect is a dataflow control method for controlling a dataflow and that provides data obtained in at least one device among of a plurality of devices to an application that utilizes the data, the method including a step of selecting, based on a causal network representing a causal relationship between a plurality of indices that include at least a plurality of device indices which are respectively data obtained in the plurality of devices and an objective index which is an index that the application controls or predicts, at least one device index having a causal relationship with the objective index of the application, from among the plurality of device indices, in a case where a data request is received from the application, and a step of controlling the dataflow, such that data obtained in the device corresponding to the selected device index is provided to the application.
- According to this aspect, when the objective of the application (index that the application controls or predicts) is supplied, data having a causal relationship with the objective is automatically provided to the application from a corresponding device. Accordingly, design and development of applications become possible, even without knowing what kind of devices exist in the device network, what kind of data can be acquired, or what kind of data to refer to in order to perform the control or prediction serving as the objective. Therefore, compared with former technologies, design and development of applications utilizing data in the device network is facilitated, and utilization and distribution of data in the device network are promoted.
- An aspect is a program that causes a computer to execute the steps of the dataflow control method recited above.
- According to the aspect, when the objective of the application (index that the application controls or predicts) is supplied, data having a causal relationship with the objective is automatically provided to the application from a corresponding device. Accordingly, design and development of applications become possible, even without knowing what kind of devices exist in the device network, what kind of data can be acquired, or what kind of data to refer to in order to perform the control or prediction serving as the objective. Therefore, compared with former technologies, design and development of applications utilizing data in the device network is facilitated, and utilization and distribution of data in the device network are promoted.
- A not claimed aspect is a control command data stream readable by an information processing apparatus for managing sensors that output sensing data, the data stream including information specifying an application that utilizes the sensing data, information specifying a sensor selected to output sensing data having a causal relationship with an objective index which is an index that the application controls or predicts, and information on the causal relationship between the sensing data obtained by the selected sensor and the objective index. With the invention according to claim 8, a dataflow in which sensing data having a causal relationship with the objective of the application (index that the application controls or predicts) is provided to the application from a corresponding sensor can be realized.
- According to a not claimed aspect, the causal relationship information includes information on a causal strength between the sensing data and the objective index and information on a delay time taken for an influence of the sensing data to propagate to the objective index. According to this not claimed aspect, dataflow control that takes into consideration the time delay (propagation delay) from the sensing data (cause index) to the objective index (effect index) can be realized.
- Note that the present invention can be regarded as a dataflow control apparatus having at least part of the above configurations or functions. The present invention can also be regarded as a device network system, a sensor network system or an actuator network system having a dataflow control apparatus. The present invention can also be regarded as a dataflow control method including at least part of the above processing, or a program for causing a computer to execute this method, or a computer-readable recording medium on which such a program is recorded in a non-transitory manner. The present invention can be constituted by combining the above configurations and various processing as long as technical inconsistencies do not occur.
- According to the present invention, utilization of the data in a device network can be facilitated.
-
-
Fig. 1 is a block diagram showing functions related to generation of a causal network of a device network system. -
Fig. 2 is a block diagram showing functions related to a dataflow control of the device network system. -
Fig. 3 is a flowchart of generation processing of the causal network. -
Fig. 4 is a flowchart of generation processing of the causal network. -
Fig. 5 shows an example of time-series data of an objective index. -
Figs. 6A to 6D show examples of time-series data of a device index. -
Fig. 7 shows an example of causal relationship data. -
Fig. 8 shows an example of a causal network. -
Fig. 9 is a flowchart of processing for selecting device indices and processing for controlling dataflow. -
Fig. 10 is a diagram schematically showing selection of device indices that is based on a causal network. -
Fig. 11 is a diagram schematically showing device control that is based on a causal network. - An exemplary configuration of a device network system according to an embodiment of the present invention will be described, with reference to
Figs. 1 and2 .Fig. 1 is a block diagram showing functions related to generation of a causal network of the device network system, andFig. 2 is a block diagram showing functions related to dataflow control of the device network system. - The device network system is a mechanism capable of providing data that is acquired in a large number of devices online and in real time to an application that utilizes the data. The device network system is mainly constituted by a
device network 1, anM2M cloud server 2, anapplication 3, adataflow control apparatus 4, and the like. - The
device network 1 is a network that is constituted by a large number ofdevices 10. Thedevices 10 can be suitably designed in terms of number, type, installation position, network configuration, communication method and the like, and are not particularly limited in these respects. Each of thedevices 10 is able to communicate with theM2M cloud server 2, theapplication 3 and thedataflow control apparatus 4 via a wide area network such as the Internet, for example. - The
devices 10 are each a device that acts on a target region that is designated in space or space-time, and can be broadly divided into "sensors" and "actuators". Here, "space" is a region that is defined in two dimensions (x, y) or three dimensions (x, y, z), and "space-time" is a region in which the dimension of "time(t)" is added to "space", or in other words, a region that is defined in three dimensions (x, y; t) or four dimensions (x, y, z; t). Note that, in this specification, the word "sensor" is used to mean a device that detects (acquires) the state of the target region, and the word "actuator" is used to mean a device that changes the state of the target region. Sensors include image sensors (cameras), temperature sensors, humidity sensors, illumination sensors, force sensors, sound sensors, RFID sensors, infrared sensors, attitude sensors, rainfall sensors, radiation sensors and gas sensors, for example, and any type of sensor can be utilized in the system of the present invention. Also, actuators include various devices such as motors, solenoids, controllers, robots, lighting, speakers, displays, digital signage and air-conditioning, for example, and any type of actuator can be utilized in the system of the present invention. There are also devices provided with both sensors (image sensor, etc.) and actuators (display, speaker, etc.), such as mobile phones, smartphones and slate terminals (tablet PCs). Note that it is possible for various types of devices to exist together in thedevice network 1. - The
M2M cloud server 2 is a server system that manages information relating thedevices 10 constituting thedevice network 1, data acquired by thedevices 10 and the like, and that provides data acquired by thedevices 10 to a user (application 3) via a wide area network. - The
M2M cloud server 2 has adevice data DB 20 which is a database for managing thedevices 10. In thedevice data DB 20 is registered, as information relating to the devices, attribute information of the devices (type of device, position and posture of device, entity to which device belongs, device ID, network address, operation history, etc.), attribute information (positional range, temporal range, etc.) of the target region (region in which sensing is performed, region in which actuator acts), attribute information (type, physical attribute, object ID, etc.) of the object (object of sensing, object on which actuator acts), attribute information of operations (controllable items, sampling specifications of sensing, quantization specifications, etc.), and attributes of data (administrator of data or entity to which data belongs, utilization range (e.g., limited to academic utilization, prohibition of commercial utilization, etc.), access authority zone, type of data, accuracy, system of units, reliability, utilizable range, price of utilization, data ID, etc.), for example. Also, in thedevice data DB 20 is stored, as data acquired by the devices, sensing data (sensor measurement value) in the case of a sensor and control data (actuator control values) in the case of an actuator. It is favorable for not only the latest sensing data and control data but also for time-series data for a predetermined period to be stored. - The
application 3 is an apparatus or a software module that utilizes data obtained from thedevice network 1. As theapplication 3, an application that controls a control target on the basis of the data obtained from thedevice network 1, an application that predicts an unknown or a future state on the basis of the data obtained from thedevice network 1 or the like is envisaged. For example, any application is applicable, such as an application that improves office productivity, an application that suppresses or predicts energy consumption in a factory, or an application that performs traffic jam prediction. - The
dataflow control apparatus 4 has a function of matching conditions between the devices and the application, and controlling the dataflow such that data required by the application to attain the intended objective (control or prediction) is provided from an appropriate device. - With a conventional system (see Patent Document 3), a mechanism was adopted in which app-side metadata that defines the specification of data required by the application is issued and a search is performed for a device that satisfies the required specification. However, in the case of such a mechanism, the developer or designer of an application not only has to know what kind of devices exist in the
device network 1 and what kind of data can be acquired, but also has to know what kind of data to refer to in order to perform the control or prediction serving as the objective and so forth, requiring advanced development skills. Also, there are many cases where it not obvious what kind of data to refer to in order to perform the control or prediction serving as the objective, such as with the aforementioned application that aims to "improve office productivity". Also, even if a problem appears easy at first, various events in the real world can also have an effect. - In view of this, in the system of the present invention, the
dataflow control apparatus 4 implements (1) a function (seeFig. 1 ) of generating a causal network representing a causal relationship between a plurality of indices that include at least data (called a "device index") that is obtained in each of thedevices 10 and an index (called an "objective index") that theapplication 3 controls or predicts, and (2) a function (seeFig. 2 ) of selecting a device index having a causal relationship with the objective index, using this causal network, and controlling the dataflow such that the data of the selected device index is provided to theapplication 3. Here, "an index that the application controls" refers to an index representing the state of the control target that the application controls or the like, and is, for example, an index that can be observed by measuring the state or output of the control target using a sensor or the like. For example, as an index directly or indirectly representing productivity in the case of an application that improves office productivity, the number of transactions per unit time, sales or the like can be used as the objective index. Also, "an index that the application predicts" refers to an index that the application predicts or infers through calculation. For example, in the case of an application that performs traffic jam prediction, the time expected to travel the road, the length of the traffic jam and the like can be used as the objective index. A detailed description thereof will be given. - The
M2M cloud server 2, an apparatus that executes theapplication 3 and thedataflow control apparatus 4 can all be constituted by a general-purpose computer that has a CPU (central processing unit), a memory, an auxiliary storage device, a communication IF, an input device, a display device, and the like. Functions and processing which will be discussed later are realized by the CPU loading and executing programs stored in the auxiliary storage device. The computer may be a personal computer, a smartphone, a portable information terminal or the like, or may be a server computer. Also, the processing may be performed, not by one computer, but through distributed processing by a plurality of computers. - Generation of a causal network by the
dataflow control apparatus 4 of the present embodiment will be described, with reference toFig. 1 andFigs. 3 to 8 .Figs. 3 and4 are flowcharts of processing for generating a causal network,Fig. 5 is an example of time-series data of an objective index, andFigs. 6A to 6D show examples of time-series data of device indices.Fig. 7 shows an example of causal relationship data, andFig. 8 shows an example of a causal network. - In the present embodiment, an
application 3 that improves office productivity is given as a specific example. As shown inFigs. 1 and3 , a causalnetwork generation unit 40 of thedataflow control apparatus 4 acquires time-series data of the objective index from the application 3 (step S30). An example of time-series data of the objective index is shown inFig. 5 . Here, index values (no unit) indicating the hourly productivity of the office are provided. This time-series data is data that theapplication 3 measures and records over a predetermined time period, and, for example, the number of transactions per unit time, sales or the like can be used as the objective index. The time period of the time-series data is arbitrary, although when the reliability of causal relationship inference is taken into consideration, it is favorable for time-series data for at least several days and desirably from several weeks to several months to be obtained. - Next, the causal
network generation unit 40 acquires time-series data of the device index of eachdevice 10 from thedevice data DB 20 of the M2M cloud server 2 (step S31). It is favorable to acquire various device indices such as, for example, time-series data of the room temperature measured with a temperature sensor installed in the office (Fig. 6A ), time-series data of the outside temperature measured with a temperature sensor installed outside the office (Fig. 6B ), time-series data of the power consumption amount of an air-conditioner in the office (Fig. 6C ), and time-series data of the noise level measured by a noise sensor installed in the office (Fig. 6D ). Additionally, it is favorable to acquire various types of sensing data or control data such as, for example, the control value (temperature setting value) of the air-conditioner in the office, the control value of ceiling lighting in the office (brightness setting), the measurement value of an illumination sensor installed in the office, the power consumption amount for the entire office, the network load of the office LAN, and the number of prints of the office printer or photocopier. Note that in the case where the number ofdevices 10 constituting thedevice network 1 is huge, and it is not realistic to acquire the time-series data of the device indices of all thedevices 10 in terms of data volume and calculation cost, only the time-series data of the device index of some of thedevices 10 may be acquired in step S31. For example, a configuration may be adopted in which, for example, the devices are roughly narrowed down to devices that appear to be relevant, based on the control target or prediction range of theapplication 3, the positional range or the like, and only the time-series data of the narrowed down devices is acquired from the M2M cloud server 2 (narrowing down of the devices may be performed by one of theM2M cloud server 2 and the dataflow control apparatus 4). The calculation cost incurred in generation of a causal network can thereby be reduced. - Next, the causal
network generation unit 40 calculates the causal strength, correlation coefficient and delay time for all combinations of the two indices (cause and effect), based on the time series data of the objective index and the device indices (step S32). The processing of step S32 is shown in detail in the flowchart ofFig. 4 . Here, it is assumed that m indices E1 to Em are obtained in accordance with the objective index and the device indices. - The causal
network generation unit 40 selects a group (Ei,Ej) of two indices from the m indices E1 to Em (step S41), and performs processing which will be discussed below. Here, Ei represents the cause index, Ej represents the effect index, and the subscripts i and j representing the index numbers satisfy i = 1 to m, j = 1 to m, i ≠ j. - First, the causal
network generation unit 40 sets a delay time s to a minimum value smin (step S42). The causalnetwork generation unit 40 then derives the causal strength between the cause index Ei and the effect index Ej obtained after the time s (step S43). In the present embodiment, transfer entropy TEij is used as the causal strength. - The transfer entropy is a measure or a technique for evaluating a causal relationship that takes into consideration the propagation time (delay time) between the two indices X and Y, and is a way of thinking that regards the average information amount (entropy) transferred from the index X to the index Y obtained after the time s as the strength of the influence that the cause index X exerts on the effect index Y obtained after the time s (i.e., causal strength). Note that although the correlation coefficient is based on a similar concept, the correlation coefficient differs from transfer entropy in that it only evaluates the degree of the linear relationship between the two indices X and the sign of the linear relationship, and does not take into consideration the direction of cause and effect (which index is cause and which is effect?) or the time delay.
- When the respective time-series data of the indices X and Y are given as x(t) and y(t) and the respective probability density functions are given as P(x(t)) and P(y(t)), transfer entropy TEXY(s) relating to the delay time s in which the index X is the cause and the index Y is the effect can be calculated with the following equation.

- As evident from the above equation, the transfer entropy can be calculated by supplying the time-series data and the delay time s of the two indices X and Y. Here, TEXY(s) > TEYX(s) holds true between the value of TEXY(s) and the value of TEyx(s) calculated by interchanging cause and effect, in the case where a causal relationship in which X is the cause and Y is the effect exists between the indices X and Y. Therefore, the existence of a causal relationship and the direction of cause and effect can be judged, by evaluating the size relationship of the values of TEXY(s) and TEYX(s). Also, the maximum value of the causal strength between the cause index X and the effect index Y and the delay time s at which the causal strength is at the maximum can be derived, by calculating the transfer entropy TEXY(s) for different values of s.
- In the processing of step S41, the transfer entropy in the opposite direction, that is, transfer entropy TEji from the index Ej obtained after the time s to the index Ei is calculated, and if the transfer entropy in the opposite direction is larger (TEji > TEij), it is judged that a causal relationship in which the index Ei is the cause and the index Ej is the effect does not exist between two indices (Ei,Ej), and it is favorable to set the causal strength to zero.
- If a causal relationship is confirmed between the cause index Ei and the effect index Ej (if the causal strength is not zero) (step S44: YES), the causal
network generation unit 40 calculates the correlation coefficient of the cause index Ei and the effect index Ej obtained after the time s (step S45). Since the calculation method of the correlation coefficient is well-known, description thereof is omitted. - The processing of the above steps S43 to S45 is executed repeatedly while increasing the value of s by a time step width Δs with each iteration (step S46), and when the processing is ended at a maximum value smax of the delay time (step S47), the causal
network generation unit 40 shifts to processing of the next group of indices (step S48: NO). When evaluation of the causal relationship is ended for all groups of two indices (step S48: YES), the causalnetwork generation unit 40 advances the processing to step S33 ofFig. 3 . - The causal
network generation unit 40 generates causal relationship data, and stores the generated data in a causal network storage unit 41 (step S33). -
Fig. 7 schematically shows an example of the data structure of the causal relationship data. The causal relationship data includes "object identification information" which is information for specifying theapplication 3 or the objective index, "index identification information" which is information for specifying what device each of the m indices was acquired from, and causal relationship information for every group of two indices. The ID of theapplication 3, the ID of the objective index and the like, for example, are described in the object identification information. The ID of the device corresponding to each index and the like, for example, is described in the index identification information. Note that anindex 1 is given as the objective index, and the ID of theapplication 3 is described in the index identification information of theindex 1. - The causal relationship information is constituted by a two-dimensional array m×m (
Fig. 7 shows an example in which m = 6), and the causal relationship information of the causal relationship between the cause index i and the effect index j is stored in a cell of an element number (i,j). An exemplary data description of a causal relationship information Ark(3,4) of an element number (3,4) is shown below. -
Ark(3,4) = {
            Causality = 0.58;
            Delay = 3;
            Co_CoEf= -0.7
         }
- (1) In a causal network, the device index whose distance to the objective index is closest is given priority. Note that "distance" is defined as the number of arcs between two indices (nodes).
- (2) In the case where the distances are the same, the index whose causal strength is stronger is given priority (indices whose causal strength is less than a predetermined threshold value will, however, not be selected).
- (3) In the case where the distances and the causal strengths are the same, the index whose delay time is shortest is given priority.
- ID of device C
- ID of
application 3 - Index 6 (cause) acquired with device C → Causal relationship information Ark(6,4) of index 4 (effect)
- Index 4 (cause) → Causal relationship information Ark(4,1) of objective index 1 (effect)
- the device C is an air-conditioner, and the
index 6 is a temperature setting value of the air-conditioner - the device E is a room temperature sensor, and the
index 4 is the temperature in an office, and - the
objective index 1 is office productivity,
- 1: Device network
- 10: Device
- 2: M2M cloud server
- 20: Device data DB
- 3: Application
- 4: Dataflow control apparatus
- 40: Causal network generation unit
- 41: Causal network storage unit
- 42: Device index selection unit
- 43: Dataflow control unit
Claims (6)
- A dataflow control apparatus (4) for controlling a dataflow via a network (1) of a plurality of devices (10) and an application (3) and that is adapted to provide data obtained in at least one device (10) among the plurality of devices (10) to the application (3) that utilizes the data, comprising:
a causal network storage unit (41) that is adapted to store a causal network representing a causal relationship between a plurality of indices that include at least a plurality of device indices which are respectively data obtained in the plurality of devices (10) and an objective index which is an index that the application (3) controls or predicts; the dataflow control apparatus (4) further comprises:a device index selection unit (42) that is adapted to receive a data request from the application (3) and to preferentially select, based on the causal network, at least one device index having a stronger causal relationship with the objective index of the application (3), from among the plurality of device indices; anda dataflow control unit (43) that is adapted to control the dataflow, such that data obtained in the device (10) corresponding to the selected device index is provided to the application (3),whereinthe device index is sensing data when the device (10) is a sensor, and control data when the device (10) is an actuator;the index that the application (3) controls is an index representing a state of a control target that the application (3) controls and the index that the application (3) predicts is an index that the application (3) predicts or infers through calculation; andthe causal relationship includes information on a causal strength between two indices and information on a delay time taken for an influence of one of the two indices to propagate to the other index. - The dataflow control apparatus (4) according to claim 1, wherein the causal relationship is defined using transfer entropy.
- The dataflow control apparatus (4) according to claim 1 or 2, wherein the device index selection unit (42) is adapted to preferentially select, in the causal network, the device index whose distance to the objective index is closest, to preferentially select the device index whose causal strength is strongest in a case where distances are the same, and to preferentially select the device index whose delay time is shortest in a case where distances and causal strengths are the same.
- The dataflow control apparatus (4) according to any one of claims 1 to 3, wherein the device index selection unit (42) is adapted to check whether the devices (10) are active or inactive, and to exclude the device indices corresponding to inactive devices (10) from selection.
- A dataflow control method for controlling a dataflow via a network of a plurality of devices (10) and an application (3) and that provides data obtained in at least one device (10) among of the plurality of devices (10) to the application (3) that utilizes the data, wherein the method comprises the steps of:
receiving a data request from the application (3);selecting, based on a causal network representing a causal relationship between a plurality of indices that include at least a plurality of device indices which are respectively data obtained in the plurality of devices (10) and an objective index which is an index that the application (3) controls or predicts, at least one device index having a stronger causal relationship with the objective index of the application (3), from among the plurality of device indices; andcontrolling the dataflow, such that data obtained in the device (10) corresponding to the selected device index is provided to the application (3),whereinthe device index is sensing data when the device (10) is a sensor, and control data when the device (10) is an actuator;the index that the application (3) controls is an index representing a state of a control target that the application (3) controls and the index that the application (3) predicts is an index that the application (3) predicts or infers through calculation; andthe causal relationship includes information on a causal strength between two indices and information on a delay time taken for an influence of one of the two indices to propagate to the other index. - A program, when executed on a computer, causes the computer to execute the steps of the dataflow control method according to claim 5.
Applications Claiming Priority (2)
| Application Number | Priority Date | Filing Date | Title |
|---|---|---|---|
| JP2015131161A JP6398894B2 (en) | 2015-06-30 | 2015-06-30 | Data flow control device and data flow control method |
| PCT/JP2016/069174 WO2017002820A1 (en) | 2015-06-30 | 2016-06-28 | Data flow control device and data flow control method |
Publications (3)
| Publication Number | Publication Date |
|---|---|
| EP3318976A1 EP3318976A1 (en) | 2018-05-09 |
| EP3318976A4 EP3318976A4 (en) | 2019-03-20 |
| EP3318976B1 true EP3318976B1 (en) | 2023-11-29 |
Family
ID=57608639
Family Applications (1)
| Application Number | Title | Priority Date | Filing Date |
|---|---|---|---|
| EP16817928.1A Active EP3318976B1 (en) | 2015-06-30 | 2016-06-28 | Data flow control device and data flow control method |
Country Status (4)
| Country | Link |
|---|---|
| US (1) | US11748326B2 (en) |
| EP (1) | EP3318976B1 (en) |
| JP (1) | JP6398894B2 (en) |
| WO (1) | WO2017002820A1 (en) |
Families Citing this family (9)
| Publication number | Priority date | Publication date | Assignee | Title |
|---|---|---|---|---|
| JP6398894B2 (en) * | 2015-06-30 | 2018-10-03 | オムロン株式会社 | Data flow control device and data flow control method |
| JP6390692B2 (en) * | 2016-12-15 | 2018-09-19 | オムロン株式会社 | Data distribution system, instruction device, data distribution device, sensor management device, data distribution method, and program |
| JP6718827B2 (en) * | 2017-01-27 | 2020-07-08 | ローム株式会社 | Management system utilizing IoT and water heater data transmission system applying the same |
| JP6872919B2 (en) * | 2017-02-03 | 2021-05-19 | 株式会社日立製作所 | Sensor network management method and sensor network management system |
| JP6489250B1 (en) * | 2018-02-13 | 2019-03-27 | オムロン株式会社 | Candidate extraction apparatus, candidate extraction method and program |
| US11093873B2 (en) * | 2018-03-30 | 2021-08-17 | Atlassian Pty Ltd. | Using a productivity index and collaboration index for validation of recommendation models in federated collaboration systems |
| US11249469B2 (en) | 2018-09-28 | 2022-02-15 | Rockwell Automation Technologies, Inc. | Systems and methods for locally modeling a target variable |
| CN110321458B (en) * | 2019-05-21 | 2021-10-15 | 国家电网有限公司 | Data flow analysis method and device based on control flow graph |
| EP4186216A1 (en) * | 2020-08-27 | 2023-05-31 | Siemens Aktiengesellschaft | Centralized management of data flow maps for distributed edge node deployment |
Citations (1)
| Publication number | Priority date | Publication date | Assignee | Title |
|---|---|---|---|---|
| US20140258474A1 (en) * | 2013-03-11 | 2014-09-11 | Kt Corporation | Controlling data collection interval of m2m device |
Family Cites Families (53)
| Publication number | Priority date | Publication date | Assignee | Title |
|---|---|---|---|---|
| JP3501013B2 (en) | 1999-05-20 | 2004-02-23 | 日本電気株式会社 | Group position display device |
| KR100709964B1 (en) * | 2005-01-18 | 2007-04-25 | 삼성전자주식회사 | Routing method in wireless sense network |
| KR100683848B1 (en) * | 2005-10-11 | 2007-02-16 | 삼성전자주식회사 | Method for reducing power consumption of sensor in wireless sensor network and system thereof |
| US20070118496A1 (en) * | 2005-11-21 | 2007-05-24 | Christof Bornhoevd | Service-to-device mapping for smart items |
| US7890568B2 (en) * | 2006-04-28 | 2011-02-15 | Sap Ag | Service-to-device mapping for smart items using a genetic algorithm |
| JP4682912B2 (en) | 2006-05-08 | 2011-05-11 | 株式会社日立製作所 | Sensor network system, sensor network location program |
| US8296413B2 (en) * | 2006-05-31 | 2012-10-23 | Sap Ag | Device registration in a hierarchical monitor service |
| US8131838B2 (en) * | 2006-05-31 | 2012-03-06 | Sap Ag | Modular monitor service for smart item monitoring |
| US8614633B1 (en) * | 2007-01-08 | 2013-12-24 | Lockheed Martin Corporation | Integrated smart hazard assessment and response planning (SHARP) system and method for a vessel |
| JP5297272B2 (en) * | 2009-06-11 | 2013-09-25 | 株式会社日立製作所 | Device abnormality monitoring method and system |
| GB2490738A (en) * | 2011-05-13 | 2012-11-14 | En Twyn Ltd | A power line communications network controlled by an operating system in which network terminals include a processor. |
| JP5533820B2 (en) * | 2011-08-22 | 2014-06-25 | 富士通株式会社 | Sensor information management system, sensor information management method, sensor information management program |
| US20130073576A1 (en) * | 2011-09-19 | 2013-03-21 | International Business Machines Corporation | System and Protocol To Dynamically Query Sensor Data Collections |
| US8873429B2 (en) * | 2011-12-22 | 2014-10-28 | Infosys Limited | Method and system to dynamically detect and form a master slave network |
| WO2013153890A1 (en) * | 2012-04-12 | 2013-10-17 | オムロン株式会社 | Device management apparatus and device search method |
| US9585019B2 (en) * | 2012-08-22 | 2017-02-28 | Omron Corporation | Device management apparatus and device management method |
| AU2013317148A1 (en) * | 2012-09-12 | 2014-08-07 | Omron Corporation | Device for generating data flow control instruction, and sensor management device |
| US9053430B2 (en) * | 2012-11-19 | 2015-06-09 | Qualcomm Incorporated | Method and apparatus for inferring logical dependencies between random processes |
| CN103197445B (en) | 2013-03-27 | 2017-05-31 | 京东方科技集团股份有限公司 | Liquid crystal display and electronic equipment |
| US9319856B1 (en) * | 2014-08-26 | 2016-04-19 | Amazon Technologies, Inc. | Routing messages to user devices |
| WO2016144218A1 (en) * | 2015-03-09 | 2016-09-15 | Telefonaktiebolaget Lm Ericsson (Publ) | Method, system and device for providing live data streams to content-rendering devices |
| JP6398894B2 (en) * | 2015-06-30 | 2018-10-03 | オムロン株式会社 | Data flow control device and data flow control method |
| JP6398944B2 (en) * | 2015-10-28 | 2018-10-03 | オムロン株式会社 | Data distribution management system |
| JP6365519B2 (en) * | 2015-12-03 | 2018-08-01 | オムロン株式会社 | Data flow control device and data flow control method |
| JP6465012B2 (en) * | 2015-12-14 | 2019-02-06 | オムロン株式会社 | Data flow control device and data flow control method |
| JP6458755B2 (en) * | 2016-03-15 | 2019-01-30 | オムロン株式会社 | Data flow control device and data flow control method |
| JP6372508B2 (en) * | 2016-03-15 | 2018-08-15 | オムロン株式会社 | Data flow control device and data flow control method |
| JP6406336B2 (en) * | 2016-11-14 | 2018-10-17 | オムロン株式会社 | Sensor opening test system, sensor opening test management terminal, sensor, sensor opening test method and program |
| JP6406335B2 (en) * | 2016-11-14 | 2018-10-17 | オムロン株式会社 | MATCHING DEVICE, MATCHING METHOD, AND PROGRAM |
| JP6805791B2 (en) * | 2016-12-14 | 2020-12-23 | 株式会社Ihi | Information processing equipment, information processing methods and information processing systems |
| JP6380517B2 (en) * | 2016-12-15 | 2018-08-29 | オムロン株式会社 | Control device, sensor management device, control method, sensor management method, and program |
| JP6390692B2 (en) * | 2016-12-15 | 2018-09-19 | オムロン株式会社 | Data distribution system, instruction device, data distribution device, sensor management device, data distribution method, and program |
| JP6848426B2 (en) * | 2016-12-27 | 2021-03-24 | 富士通株式会社 | Communication devices, communication systems, programs and communication control methods |
| JP6872919B2 (en) * | 2017-02-03 | 2021-05-19 | 株式会社日立製作所 | Sensor network management method and sensor network management system |
| CN109074607B (en) * | 2017-02-03 | 2022-04-29 | 松下知识产权经营株式会社 | Learned model providing method and learned model providing device |
| JP6677828B2 (en) * | 2017-02-03 | 2020-04-08 | 株式会社日立製作所 | Sensor network management system and sensor network management method |
| CN109074601A (en) * | 2017-02-03 | 2018-12-21 | 松下知识产权经营株式会社 | Model generating method, the model generating means that learn of learning and the model that learns utilize device |
| CN109074521A (en) * | 2017-02-03 | 2018-12-21 | 松下知识产权经营株式会社 | The model providing method that learns and the model that learns provide device |
| JP6515937B2 (en) * | 2017-02-08 | 2019-05-22 | 横河電機株式会社 | Event analysis apparatus, event analysis system, event analysis method, event analysis program, and recording medium |
| JP2018147290A (en) * | 2017-03-07 | 2018-09-20 | オムロン株式会社 | Sensor metadata generation apparatus, sensor metadata generation system, sensor metadata generation method, and sensor meta data generation program |
| CN110582759B (en) * | 2017-06-06 | 2024-01-12 | 欧姆龙株式会社 | Score calculating unit, search device, score calculating method, and score calculating program |
| US20200099621A1 (en) * | 2017-08-01 | 2020-03-26 | Omron Corporation | Sensing device management apparatus |
| WO2019026708A1 (en) * | 2017-08-01 | 2019-02-07 | オムロン株式会社 | Sensor management unit, sensor apparatus, sensing data provision method, and sensing data provision program |
| EP3664057B1 (en) * | 2017-08-02 | 2023-05-10 | Omron Corporation | Sensor management unit, sensing data distribution system, sensing data evaluation method, and sensing data evaluation program |
| EP3664056B1 (en) * | 2017-08-02 | 2023-09-06 | Omron Corporation | Sensor device, background noise data transmission method, and background noise data transmission program |
| WO2019026635A1 (en) * | 2017-08-03 | 2019-02-07 | オムロン株式会社 | Matching processing device |
| JP6930276B2 (en) * | 2017-08-09 | 2021-09-01 | オムロン株式会社 | Sensor management unit, sensor device, sensing data management method, and sensing data management program |
| US11146639B2 (en) * | 2017-09-19 | 2021-10-12 | Omron Corporation | Moving sensor management unit, moving sensor apparatus, matching apparatus, sensing data distribution system, data provision method, and data provision program |
| WO2019058726A1 (en) * | 2017-09-19 | 2019-03-28 | オムロン株式会社 | Mobile sensor management unit, mobile sensor apparatus, matching apparatus, sensing data distribution system, data provision method, and data provision program |
| JP6432719B1 (en) * | 2017-09-19 | 2018-12-05 | オムロン株式会社 | MOBILE SENSOR MANAGEMENT UNIT, MOBILE SENSOR DEVICE, MATCHING DEVICE, SENSING DATA DISTRIBUTION SYSTEM, DATA PROVIDING METHOD, AND DATA PROVIDING PROGRAM |
| JP6424993B1 (en) * | 2017-09-19 | 2018-11-21 | オムロン株式会社 | Mobile sensor management unit, mobile sensor device, matching device, sensing data distribution system, data providing method, and data providing program |
| US11140042B2 (en) * | 2019-09-18 | 2021-10-05 | Servicenow, Inc. | Dictionary-based service mapping |
| GB2588107B (en) * | 2019-10-07 | 2022-11-02 | British Telecomm | Secure publish-subscribe communication methods and apparatus |
-
2015
- 2015-06-30 JP JP2015131161A patent/JP6398894B2/en active Active
-
2016
- 2016-06-28 EP EP16817928.1A patent/EP3318976B1/en active Active
- 2016-06-28 US US15/576,470 patent/US11748326B2/en active Active
- 2016-06-28 WO PCT/JP2016/069174 patent/WO2017002820A1/en active Application Filing
Patent Citations (1)
| Publication number | Priority date | Publication date | Assignee | Title |
|---|---|---|---|---|
| US20140258474A1 (en) * | 2013-03-11 | 2014-09-11 | Kt Corporation | Controlling data collection interval of m2m device |
Also Published As
| Publication number | Publication date |
|---|---|
| JP6398894B2 (en) | 2018-10-03 |
| EP3318976A1 (en) | 2018-05-09 |
| US20180157692A1 (en) | 2018-06-07 |
| WO2017002820A1 (en) | 2017-01-05 |
| EP3318976A4 (en) | 2019-03-20 |
| JP2017016306A (en) | 2017-01-19 |
| US11748326B2 (en) | 2023-09-05 |
Similar Documents
| Publication | Publication Date | Title |
|---|---|---|
| EP3318976B1 (en) | Data flow control device and data flow control method | |
| Bittencourt et al. | The internet of things, fog and cloud continuum: Integration and challenges | |
| EP3385852B1 (en) | Data flow control apparatus and data flow control method | |
| Cheng et al. | Virtual network embedding through topology awareness and optimization | |
| JPWO2014050192A1 (en) | Device management apparatus and device search method | |
| Jaiswal et al. | A QoS aware optimal node deployment in wireless sensor network using Grey wolf optimization approach for IoT applications | |
| Gholaminezhad et al. | Multi-objective reliability-based robust design optimization of robot gripper mechanism with probabilistically uncertain parameters | |
| Paul Martin et al. | CREW: Cost and Reliability aware Eagle‐Whale optimiser for service placement in Fog | |
| Tanganelli et al. | A methodology for the design and deployment of distributed cyber–physical systems for smart environments | |
| US9998865B2 (en) | Method for performing distributed geographic event processing and geographic event processing system | |
| Xiong et al. | A self-adaptive approach to service deployment under mobile edge computing for autonomous driving | |
| Mo et al. | Node coordination mechanism based on distributed estimation and control in wireless sensor and actuator networks | |
| Bobbio et al. | Markovian agent models: a dynamic population of interdependent Markovian agents | |
| Huang et al. | Distributed machine learning on smart-gateway network towards real-time indoor data analytics | |
| Asghari et al. | Server placement in mobile cloud computing: a comprehensive survey for edge computing, fog computing and cloudlet | |
| Janabi et al. | A new localization mechanism in IoT using grasshopper optimization algorithm and DVHOP algorithm | |
| Mansouri et al. | Genetic algorithm-based adaptive optimization for target tracking in wireless sensor networks | |
| Makaya et al. | Cost-effective machine learning inference offload for edge computing | |
| Javed et al. | Fog paradigm for local energy management systems | |
| Parsa et al. | A queuing network model for minimizing the total makespan of computational grids | |
| Martella et al. | On-demand and automatic deployment of microservice at the edge based on ngsi-ld | |
| Lujic et al. | Architecturing elastic edge storage services for data-driven decision making | |
| Okhovvat et al. | Task Allocation Approach for Minimizing Make-Span in Wireless Sensor Actor Networks. | |
| Turkina et al. | Interval evaluation of trust and reputation for Internet of Things | |
| Beraldi et al. | On the impact of stale information on distributed online load balancing protocols for edge computing |
Legal Events
| Date | Code | Title | Description |
|---|---|---|---|
| STAA | Information on the status of an ep patent application or granted ep patent |
Free format text: STATUS: THE INTERNATIONAL PUBLICATION HAS BEEN MADE |
|
| PUAI | Public reference made under article 153(3) epc to a published international application that has entered the european phase |
Free format text: ORIGINAL CODE: 0009012 |
|
| STAA | Information on the status of an ep patent application or granted ep patent |
Free format text: STATUS: REQUEST FOR EXAMINATION WAS MADE |
|
| 17P | Request for examination filed |
Effective date: 20171116 |
|
| AK | Designated contracting states |
Kind code of ref document: A1 Designated state(s): AL AT BE BG CH CY CZ DE DK EE ES FI FR GB GR HR HU IE IS IT LI LT LU LV MC MK MT NL NO PL PT RO RS SE SI SK SM TR |
|
| AX | Request for extension of the european patent |
Extension state: BA ME |
|
| DAV | Request for validation of the european patent (deleted) | ||
| DAX | Request for extension of the european patent (deleted) | ||
| A4 | Supplementary search report drawn up and despatched |
Effective date: 20190220 |
|
| RIC1 | Information provided on ipc code assigned before grant |
Ipc: G06F 16/28 20190101ALI20190214BHEP Ipc: H04W 4/70 20180101ALI20190214BHEP Ipc: H04L 29/08 20060101ALI20190214BHEP Ipc: G06F 17/18 20060101AFI20190214BHEP Ipc: G06F 16/901 20190101ALI20190214BHEP Ipc: G06F 13/00 20060101ALI20190214BHEP Ipc: H04M 11/00 20060101ALI20190214BHEP Ipc: G06F 16/22 20190101ALI20190214BHEP |
|
| STAA | Information on the status of an ep patent application or granted ep patent |
Free format text: STATUS: EXAMINATION IS IN PROGRESS |
|
| STAA | Information on the status of an ep patent application or granted ep patent |
Free format text: STATUS: EXAMINATION IS IN PROGRESS |
|
| 17Q | First examination report despatched |
Effective date: 20210915 |
|
| REG | Reference to a national code |
Ref country code: DE Ref legal event code: R079 Ref document number: 602016084426 Country of ref document: DE Free format text: PREVIOUS MAIN CLASS: G06F0013000000 Ipc: H04W0004700000 Ref legal event code: R079 Free format text: PREVIOUS MAIN CLASS: G06F0013000000 Ipc: H04W0004700000 |
|
| GRAP | Despatch of communication of intention to grant a patent |
Free format text: ORIGINAL CODE: EPIDOSNIGR1 |
|
| STAA | Information on the status of an ep patent application or granted ep patent |
Free format text: STATUS: GRANT OF PATENT IS INTENDED |
|
| RIC1 | Information provided on ipc code assigned before grant |
Ipc: G06F 17/18 20060101ALI20230531BHEP Ipc: H04W 4/38 20180101ALI20230531BHEP Ipc: H04W 4/70 20180101AFI20230531BHEP |
|
| INTG | Intention to grant announced |
Effective date: 20230616 |
|
| GRAS | Grant fee paid |
Free format text: ORIGINAL CODE: EPIDOSNIGR3 |
|
| GRAA | (expected) grant |
Free format text: ORIGINAL CODE: 0009210 |
|
| STAA | Information on the status of an ep patent application or granted ep patent |
Free format text: STATUS: THE PATENT HAS BEEN GRANTED |
|
| AK | Designated contracting states |
Kind code of ref document: B1 Designated state(s): AL AT BE BG CH CY CZ DE DK EE ES FI FR GB GR HR HU IE IS IT LI LT LU LV MC MK MT NL NO PL PT RO RS SE SI SK SM TR |
|
| REG | Reference to a national code |
Ref country code: GB Ref legal event code: FG4D |
|
| REG | Reference to a national code |
Ref country code: CH Ref legal event code: EP |
|
| REG | Reference to a national code |
Ref country code: DE Ref legal event code: R096 Ref document number: 602016084426 Country of ref document: DE |
|
| REG | Reference to a national code |
Ref country code: IE Ref legal event code: FG4D |
|
| REG | Reference to a national code |
Ref country code: LT Ref legal event code: MG9D |
|
| REG | Reference to a national code |
Ref country code: NL Ref legal event code: MP Effective date: 20231129 |
|
| PG25 | Lapsed in a contracting state [announced via postgrant information from national office to epo] |
Ref country code: GR Free format text: LAPSE BECAUSE OF FAILURE TO SUBMIT A TRANSLATION OF THE DESCRIPTION OR TO PAY THE FEE WITHIN THE PRESCRIBED TIME-LIMIT Effective date: 20240301 |
|
| PG25 | Lapsed in a contracting state [announced via postgrant information from national office to epo] |
Ref country code: IS Free format text: LAPSE BECAUSE OF FAILURE TO SUBMIT A TRANSLATION OF THE DESCRIPTION OR TO PAY THE FEE WITHIN THE PRESCRIBED TIME-LIMIT Effective date: 20240329 |
|
| PG25 | Lapsed in a contracting state [announced via postgrant information from national office to epo] |
Ref country code: LT Free format text: LAPSE BECAUSE OF FAILURE TO SUBMIT A TRANSLATION OF THE DESCRIPTION OR TO PAY THE FEE WITHIN THE PRESCRIBED TIME-LIMIT Effective date: 20231129 |