JP2012510124A - Project schedule visualization method and system - Google Patents
Project schedule visualization method and system Download PDFInfo
- Publication number
- JP2012510124A JP2012510124A JP2011538610A JP2011538610A JP2012510124A JP 2012510124 A JP2012510124 A JP 2012510124A JP 2011538610 A JP2011538610 A JP 2011538610A JP 2011538610 A JP2011538610 A JP 2011538610A JP 2012510124 A JP2012510124 A JP 2012510124A
- Authority
- JP
- Japan
- Prior art keywords
- project
- information
- resource data
- lines
- actual
- Prior art date
- Legal status (The legal status is an assumption and is not a legal conclusion. Google has not performed a legal analysis and makes no representation as to the accuracy of the status listed.)
- Pending
Links
Images

Classifications
-
- G—PHYSICS
- G06—COMPUTING; CALCULATING OR COUNTING
- G06T—IMAGE DATA PROCESSING OR GENERATION, IN GENERAL
- G06T11/00—2D [Two Dimensional] image generation
- G06T11/20—Drawing from basic elements, e.g. lines or circles
- G06T11/206—Drawing of charts or graphs
-
- G—PHYSICS
- G06—COMPUTING; CALCULATING OR COUNTING
- G06F—ELECTRIC DIGITAL DATA PROCESSING
- G06F17/00—Digital computing or data processing equipment or methods, specially adapted for specific functions
-
- G—PHYSICS
- G06—COMPUTING; CALCULATING OR COUNTING
- G06F—ELECTRIC DIGITAL DATA PROCESSING
- G06F3/00—Input arrangements for transferring data to be processed into a form capable of being handled by the computer; Output arrangements for transferring data from processing unit to output unit, e.g. interface arrangements
- G06F3/14—Digital output to display device ; Cooperation and interconnection of the display device with other functional units
-
- G—PHYSICS
- G06—COMPUTING; CALCULATING OR COUNTING
- G06Q—INFORMATION AND COMMUNICATION TECHNOLOGY [ICT] SPECIALLY ADAPTED FOR ADMINISTRATIVE, COMMERCIAL, FINANCIAL, MANAGERIAL OR SUPERVISORY PURPOSES; SYSTEMS OR METHODS SPECIALLY ADAPTED FOR ADMINISTRATIVE, COMMERCIAL, FINANCIAL, MANAGERIAL OR SUPERVISORY PURPOSES, NOT OTHERWISE PROVIDED FOR
- G06Q10/00—Administration; Management
- G06Q10/06—Resources, workflows, human or project management; Enterprise or organisation planning; Enterprise or organisation modelling
Abstract
【課題】プロジェクト情報を表示する方法、システム及びコンピュータ読取可能記憶媒体を開示する。
【解決手段】プロジェクトに関連した電子的な計画情報を受信し、計画情報は、プロジェクトリソースデータを有し、ユーザに視覚的な表示を行うために、受信した電子的な計画情報を、受信した電子的な計画情報のグラフ表示に変換し、ユーザが知覚するために、受信した計画情報のグラフ表示を提供し、提供されたグラフ表示は、プロジェクトリソースデータに基づいて時間的に対称に幅が変動する一つ以上のラインを有することによって、プロジェクト情報を表示することができる。
【選択図】図3A method, system, and computer readable storage medium for displaying project information are disclosed.
Electronic plan information related to a project is received, the plan information includes project resource data, and the received electronic plan information is received for visual display to a user. Provides a graphical representation of the received planning information for conversion to an electronic graphical representation of the planning information and perceived by the user, and the provided graphical representation is symmetric in time based on the project resource data Project information can be displayed by having one or more lines that fluctuate.
[Selection] Figure 3
Description
ガントチャートは、プロジェクトスケジュールを時間関数として表すために水平バーを用いるバーチャートである。プロジェクトの様々な段階を、ガントチャート上で異なるバーによって表すことができる。プロジェクトスケジュールを追跡するに際し、プロジェクトの段階に関する追加の情報を知ることが有用であることがある。従来のガントチャートは、時間関数としてのプロジェクトスケジュールのみを表示する。他のタイプのプロジェクト追跡技術は、情報の表示を非常に複雑にする傾向がある。したがって、プロジェクト情報を表示するための改善された方法を必要とする。 A Gantt chart is a bar chart that uses horizontal bars to represent a project schedule as a function of time. Different stages of the project can be represented by different bars on the Gantt chart. In tracking the project schedule, it may be useful to know additional information about the stages of the project. Traditional Gantt charts display only the project schedule as a function of time. Other types of project tracking techniques tend to make the display of information very complex. Therefore, there is a need for an improved method for displaying project information.
本発明の態様は、プロジェクト情報を表示する方法、システム及びコンピュータ読取可能記憶媒体で実施される。プロジェクトに関連した電子的な計画情報を受信し、計画情報は、プロジェクトリソースデータを有し、ユーザに視覚的な表示を行うために、受信した電子的な計画情報を、受信した電子的な計画情報のグラフ表示に変換し、ユーザが知覚するために、受信した計画情報のグラフ表示を提供し、提供されたグラフ表示は、プロジェクトリソースデータに基づいて時間的に対称に(symmetrically over time)幅が変動する一つ以上のラインを有することによって、プロジェクト情報を表示することができる。 Aspects of the invention are implemented in a method, system, and computer-readable storage medium for displaying project information. Receive electronic plan information associated with the project, the plan information has project resource data, and the received electronic plan information is received for visual display to the user. Provides a graphical representation of the received planning information for conversion to a graphical representation of the information and perceived by the user, and the provided graphical representation is symmetrically over time based on project resource data Project information can be displayed by having one or more lines that vary.
本発明は、添付図面に関連して読む際に以下の詳細な説明から最もよく理解され、同様な要素は同一の参照番号を有する。複数の同様な要素が存在する場合、単一の参照番号を、特定の要素を言及する小文字表記とともに複数の同様な要素に割り当てる。要素を集合的に言及し又は特定されない一つ以上の要素を言及するとき、小文字表記を省略する。これは、一般的なやり方に従って図面の種々の形態を寸法通りに表さないことを強調する。それどころか、種々の形態の寸法を、明瞭のために任意に増減する。添付図面には以下の図が含まれる。 The invention is best understood from the following detailed description when read in conjunction with the accompanying drawings, in which like elements have the same reference numerals. Where there are multiple similar elements, a single reference number is assigned to the multiple similar elements with a lowercase letter referring to a particular element. When referring to an element collectively or referring to one or more elements not specified, lowercase notation is omitted. This emphasizes that the various forms of the drawings are not drawn to scale in accordance with common practice. On the contrary, the dimensions of the various forms are arbitrarily increased or decreased for clarity. The following drawings are included in the accompanying drawings.
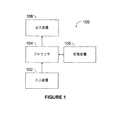
図1は、本発明の一態様によるプロジェクトに関連した情報を表示する典型的なシステム100を表すブロック図である。典型的なプロジェクトは、例えば、ソフトウェア開発プロジェクト、建設プロジェクト、機械装置開発プロジェクト、電子装置開発プロジェクト及び造園又は建築プロジェクトを含むことができるが、それに限定されない。プロジェクト情報は、例えば、プロジェクト段階、プロジェクトスケジュール、又はプロジェクトに関連したリソースデータを有することができる。プロジェクト段階及びプロジェクトスケジュールは、プロジェクト又はプロジェクト段階に対する割り当てられた時間又は期限に関する情報を含むことができる。リソースデータは、例えば、コスト、人材、又はプロジェクト若しくはプロジェクト段階に関連した他のリソースを含むことができる。
FIG. 1 is a block diagram illustrating an
総括として、システム100は、入力装置102、プロセッサ104、記憶装置106及び出力装置108を有する。システム100の他の詳細を、以下説明する。
In summary, the
入力装置102は、ユーザからの入力を受信し、電子的なデータをプロセッサ104に提供する。電子的なデータは、プロジェクト情報を有することができる。典型的な実施の形態において、入力装置102を、キーボード、マウス、又は外部ソースから入力を受信することができる他のコンピュータ周辺機器とすることができる。
プロセッサ104は、入力装置102から電子的なデータを受信し、その電子的なデータを、ユーザに視覚的な表示を行うためのグラフ表示に変換する。プロセッサ104は、受信した電子的なデータを(後に説明する)記憶装置106に格納することができる。典型的な実施の形態において、プロセッサ104は、電子的なデータに含まれるプロジェクト情報のグラフ表示を生成することができる。グラフ表示は、時間関数として変動する一つ以上のラインを有することができる。ラインは、異なるプロジェクト又は同一プロジェクトの異なる段階に対応する。ラインは、プロジェクト又はプロジェクトに関連したリソースデータに対称的に対応するよう幅を変えることができる。プロセッサ104は、グラフ表示を(後に説明する)出力装置108に提供することができる。本発明の使用に適切なプロセッサは、ここの記載から当業者によって理解される。
The
記憶装置106は、プロセッサ104から受信した電子的なデータを記憶する。典型的な実施の形態において、プロセッサ104は、入力装置102からプロジェクト情報を受信することができ、記憶のためにプロジェクト情報及び/又はプロジェクト情報のグラフ表示を記憶装置106に送信することができる。プロセッサ104は、プロジェクト情報のグラフ表示を生成し及び/又は記憶されたグラフ表示にアクセスするために、記憶されたプロジェクト情報にアクセスすることができる。本発明の使用に適切な記憶装置は、ここの記載から当業者によって理解される。
The
出力装置108は、プロセッサ104から電子的なデータを受信し、ユーザに視覚的な表示を行うためにデータを出力する。電子的なデータは、プロジェクト情報のグラフ表示を含むことができる。典型的な実施の形態において、出力装置108を、コンピュータディスプレイ、プリンタ、又はユーザに視覚的な表示を行うために受信した電子的なデータから出力を生成することができる他のコンピュータ周辺機器とすることができる。
The
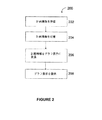
図2は、本発明の一態様によるプロジェクトに関連した情報を表示する典型的なステップのフローチャート200である。説明を簡単にするために、図2のステップを、図1のシステムの構成要素を参照しながら説明する。本発明の精神及び範囲を逸脱することなく一つ以上のステップを省略し及び/又は異なる構成要素を利用できることは、ここの説明から当業者によって理解される。
FIG. 2 is a
ステップ202において、計画情報を受信する。典型的な実施の形態において、プロジェクトに関連した計画情報を、プロセッサ104により入力装置102から受信することができる。典型的な計画情報は、例えば、プロジェクト段階、プロジェクトスケジュール、又はプロジェクトに関連したリソースデータを有することができる。プロジェクト段階及びプロジェクトスケジュールは、プロジェクト又はプロジェクト段階に対する割り当てられた時間又は期限に関する情報を有することができる。リソースデータは、例えば、コスト、人材、又はプロジェクト若しくはプロジェクト段階に関連した他のリソースを含むことができる。計画情報の入力を、データエントリーボックス(data entry box)及び/又はドロップダウンメニュー(drop down menu)を含むグラフィカルユーザインタフェース(GUI)の使用により容易にすることができる。本発明の使用に適切なGUIは、ここの記載から当業者によって理解される。
In
ステップ204において、受信した計画情報を格納する。典型的な実施の形態において、プロセッサ104は、計画情報を記憶装置106に記憶させることができる。
In
ステップ206において、計画情報を、ユーザに対して視覚的な表示を行うためにグラフ表示に変換する。典型的な実施の形態において、プロセッサ104は、プロジェクトに関連した計画情報からグラフ表示を生成することができる。プロセッサ104は、記憶された計画情報又は受信した計画情報から情報を生成することができる。グラフ表示は、時間関数として変動する一つ以上のラインを有することができる。ラインは、異なるプロジェクト又は同一プロジェクトの異なる段階に対応することができる。ラインは、プロジェクト又はプロジェクト段階に関連したリソースデータに対応するように対称的に幅を変動することができる。例えば、ラインの幅は、リソースが増加するに従って増大し、かつ、リソースが減少するに従って減少することができる。
In
ステップ208において、ユーザによる知覚のためにグラフ表示を提供する。典型的な実施の形態において、プロセッサ104は、グラフ表示を出力装置108に送信することができる。その後、出力装置108は、グラフ表示をユーザに提供することができる。例えば、グラフ表示を、モニタのような視覚的な表示装置上で行い又はプリンタを用いて紙に印刷することができる。
In
図3は、本発明の一態様によるプロジェクトに関連した情報の典型的なグラフ表示300である。グラフ表示は、従来のガントチャート形式と同様に、時間的に変動する長さを有する八つのバー302a〜302hを有する。バー302a〜302hはそれぞれ、プロジェクトのスケジュールされた段階に対応することができる。バー302d,302f〜302hは、プロジェクト段階についての追加の情報を搬送するために対称的に幅が変動する。典型的な実施の形態において、バーの幅は、プロジェクト計画情報に付随するリソースデータに対応することができる。そのようなリソース情報は、コスト、人材、又はプロジェクト段階に関連した他のリソースを有することができる。バー302d,302f〜302hは、バーがリソースデータの遷移に対応して幅を増減する遷移領域304a〜304dを有する。遷移領域304aで見られるように幅が増大するバーは、当該プロジェクト段階に要求される対応するリソースの量の増大を表すことができる。遷移領域304dで見られるように幅が減少するバーは、当該プロジェクト段階に要求される対応するリソースの量の減少を表すことができる。遷移領域の形状は、リソースデータのカテゴリーに対応することができる。例えば、遷移領域304aで見られるように湾曲した遷移領域は、コストリソースデータに対応することができる。遷移領域304bで見られるような幅の垂直方向の変化は、人材データ情報に対応することができる。また、遷移領域304cで見られるような時間的な幅の線形的な変化は、リソースデータの他のカテゴリーに対応することができる。
FIG. 3 is an exemplary
一つの典型的な実施の形態において、バー302a〜302hは、プロジェクト計画情報に対応することができ、バー302b及びバー302fにそれぞれ重なるバー306a及びバー306fは、実際のプロジェクト情報に対応することができる。バー306bは、実際のプロジェクト段階についての追加の情報を搬送するために対称的に幅を変動させることができる。幅の変動は、プロジェクト中に受信した実際のリソースデータの遷移に対応することができる。バー306a,306bを、計画情報と実際の情報との間の相違を更に明確に示すためにバー302b,302fと同軸上に表示することができる。実際のリソースデータが、計画情報に含まれるリソースデータを超える場合、実際のリソースデータに対応するバーの幅は、プロジェクトリソースデータに対応するバーの幅を超えることがある(図示せず)。
In one exemplary embodiment, the bars 302a-302h can correspond to project plan information, and the
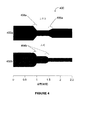
単純化された実世界の例を、説明のために提供する。本例において、ケーキを焼くプロジェクトを説明する。このプロジェクトは、材料を取得する段階、材料を混ぜる段階及び材料を焼く段階を有する。各段階は、要する時間長に関する計画情報を有し、完了のコスト及び必要な人材のコストに関するリソースデータを有する。 A simplified real world example is provided for illustration. In this example, a project for baking cake will be described. This project has the steps of obtaining the material, mixing the material and baking the material. Each stage has planning information about the length of time it takes, and resource data about the cost of completion and the cost of the required personnel.
ユーザは、ケーキの材料を取得する段階が1時間を要することを表す情報を入力することができる。ユーザは、この段階が購入材料の全てに対する追加のコストを有することを指定することもでき、材料を取得するために3人の常勤労働者を必要とする。ユーザは、材料を混合する段階が1時間半を要することを表す情報を更に入力することができる。この段階に対して、ユーザは、材料を混ぜるのに追加のコストを必要としないこと及び段階を1人の常勤労働者によって完了できることを指定することができる。最後に、ユーザは、材料を焼く段階が1時間を要することを表す情報を入力することができ、かつ、この段階がオーブンを操作するコストを含むがオーブンをモニタするために1人のパートタイム労働者しか必要としないことを表す情報を入力することができる。 The user can input information indicating that the stage of obtaining the cake ingredients takes 1 hour. The user can also specify that this stage has an additional cost for all of the purchased material and requires three full-time workers to obtain the material. The user can further input information indicating that the step of mixing the materials takes one and a half hours. For this stage, the user can specify that no additional cost is required to mix the ingredients and that the stage can be completed by one full-time worker. Finally, the user can enter information indicating that the stage of baking the material takes 1 hour, and this stage includes the cost of operating the oven, but one part-time to monitor the oven Information can be entered indicating that only workers are needed.
図4は、上述したプロジェクトに関連した計画情報から生成したグラフ400の典型的な表示である。グラフ400は、必要な時間に対応する長さを有する二つのバー402a,402bを示す。グラフは、遷移領域404a,404b,406aを有するバーも示し、これらのバーは、プロジェクトの間に種々の時間で幅が対称的に変動する。上側のバー402aは、バーの幅の変動がコストの変化に対応するように各段階に必要な時間に加えたコストリソースデータを示す。例えば、遷移領域406aに示すように、コストが増大するとバーの幅が増大し、遷移領域404aに示すように、コストが減少するとバーの幅が減少する。同様に、下側のバー402bは、各段階に対する人材リソースデータを示す。遷移領域404bに示すように、必要な人材が減少するとバーの幅が減少し、必要な人材が増大するとバーの幅が増大する(図示せず)。さらに、遷移領域の形状は、リソースデータのカテゴリーに対応することができる。グラフ400において、遷移領域404a,406aに示すような時間的な線形遷移は、コストの変化に対応し、遷移領域404bに示すような湾曲した遷移は、人材の変化に対応する。
FIG. 4 is an exemplary display of a
上述した一つ以上のステップを、コンピュータ読取可能記憶媒体に記憶されたコンピュータ実行可能な命令で実施することができる。コンピュータ読取可能記憶媒体を、例えば、光ディスク、磁気ディスク、固体素子のような汎用又は特定目的のコンピュータによって実行するための命令を格納することができるほとんど全てのタンジブルな(tangible)記憶媒体とすることができる。 One or more of the steps described above can be implemented with computer-executable instructions stored on a computer-readable storage medium. The computer-readable storage medium may be almost any tangible storage medium that can store instructions for execution by a general purpose or special purpose computer such as an optical disk, magnetic disk, solid state device, etc. Can do.
ここでは、本発明を、特定の実施の形態を参照しながら図示し及び説明したが、本発明は、示した詳細な説明に限定されるものではない。更に正確に言えば、種々の変更を、特許請求の範囲内で本発明を逸脱することなく詳細な説明において行うことができる。 Although the invention has been illustrated and described herein with reference to specific embodiments, the invention is not limited to the detailed description shown. More precisely, various modifications can be made in the detailed description within the scope of the claims without departing from the invention.
Claims (20)
プロジェクトに関連した電子的な計画情報を受信するステップであって、前記計画情報は、プロジェクトリソースデータを有するステップと、
ユーザに視覚的な表示を行うために、受信した前記電子的な計画情報を、受信した前記電子的な計画情報のグラフ表示に変換するステップと、
ユーザによる知覚のために、受信した前記電子的な計画情報の前記グラフ表示を行うステップであって、前記グラフ表示は、前記プロジェクトリソースデータに基づいて、時間的に対称に幅が変動する一つ以上のラインを有するステップと、
を備えることを特徴とする方法。 A method for displaying project information,
Receiving electronic plan information associated with the project, the plan information comprising project resource data;
Converting the received electronic plan information into a graphical display of the received electronic plan information for visual display to a user;
A step of displaying the received electronic plan information in a graph for perception by a user, the graph display having a width that varies symmetrically in time based on the project resource data; A step having the above lines;
A method comprising the steps of:
前記実際の情報を、前記実際の情報のグラフ表示に変換するステップと、
前記実際の情報のグラフ表示を行うステップであって、前記グラフ表示は、前記実際のプロジェクトリソースデータに基づいて、時間的に対称に幅が変動する一つ以上のラインを有するステップと、
を更に備える請求項1に記載の方法。 Receiving actual information associated with the project, the actual information comprising actual project resource data;
Converting the actual information into a graphical representation of the actual information;
Performing a graphical display of the actual information, wherein the graphical display comprises one or more lines whose width varies symmetrically in time based on the actual project resource data;
The method of claim 1, further comprising:
プロジェクトに関連した電子的な計画情報を受信する手段であって、前記計画情報は、プロジェクトリソースデータを有する手段と、
ユーザに視覚的な表示を行うために、受信した前記電子的な計画情報を、受信した前記電子的な計画情報のグラフ表示に変換する手段と、
ユーザによる知覚のために、受信した前記電子的な計画情報の前記グラフ表示を行う手段であって、前記グラフ表示は、前記プロジェクトリソースデータに基づいて、時間的に対称に幅が変動する一つ以上のラインを有する手段と、
を備えることを特徴とするシステム。 A system for displaying project information,
Means for receiving electronic plan information associated with a project, the plan information comprising means for having project resource data;
Means for converting the received electronic plan information into a graphical display of the received electronic plan information for visual display to a user;
Means for displaying the received electronic plan information in a graph for perception by the user, the graph display having a width that varies symmetrically in time based on the project resource data. Means having the above lines;
A system comprising:
前記実際の情報を、前記実際の情報のグラフ表示に変換する手段と、
前記実際の情報のグラフ表示を行う手段であって、前記グラフ表示は、前記実際のプロジェクトリソースデータに基づいて、時間的に対称に幅が変動する一つ以上のラインを有する手段と、
を更に備える請求項15に記載のシステム。 Means for receiving actual information associated with the project, wherein the actual information comprises actual project resource data;
Means for converting the actual information into a graphical representation of the actual information;
Means for displaying a graph of the actual information, wherein the graph display has one or more lines whose width varies symmetrically in time based on the actual project resource data;
The system of claim 15, further comprising:
プロジェクトに関連した電子的な計画情報を受信する動作であって、前記計画情報は、プロジェクトリソースデータを有する動作と、
ユーザに視覚的な表示を行うために、受信した前記電子的な計画情報を、受信した前記電子的な計画情報のグラフ表示に変換する動作と、
ユーザによる知覚のために、受信した前記電子的な計画情報の前記グラフ表示を行う動作であって、前記グラフ表示は、前記プロジェクトリソースデータに基づいて、時間的に対称に幅が変動する一つ以上のラインを有する動作と、
を実行するためのコンピュータ実行可能な命令を有することを特徴とするコンピュータ読取可能記憶媒体。 A computer readable storage medium, the computer readable storage medium for displaying project information
Receiving an electronic plan information associated with a project, the plan information comprising an operation having project resource data;
Converting the received electronic plan information into a graphical display of the received electronic plan information for visual display to the user;
An operation for displaying the received electronic plan information in a graph for perception by a user, the graph display having a width that varies symmetrically in time based on the project resource data. Operation with the above lines;
A computer-readable storage medium having computer-executable instructions for executing
前記プロジェクトに関連した実際の情報を受信する動作であって、前記実際の情報は、実際のプロジェクトリソースデータを有する動作と、
前記実際の情報を、前記実際の情報のグラフ表示に変換する動作と、
前記実際の情報のグラフ表示を行う動作であって、前記グラフ表示は、前記実際のプロジェクトリソースデータに基づいて、時間的に対称に幅が変動する一つ以上のラインを有する動作と、
を更に実行する請求項18に記載のコンピュータ読取可能記憶媒体。 The computer executable instructions are:
Receiving actual information associated with the project, wherein the actual information includes actual project resource data;
Converting the actual information into a graphical representation of the actual information;
An operation of performing a graph display of the actual information, wherein the graph display includes an operation having one or more lines whose width varies symmetrically in time based on the actual project resource data;
The computer-readable storage medium of claim 18, further executing:
Applications Claiming Priority (3)
| Application Number | Priority Date | Filing Date | Title |
|---|---|---|---|
| US12/324,054 US8063904B2 (en) | 2008-11-26 | 2008-11-26 | Project timeline visualization methods and systems |
| US12/324,054 | 2008-11-26 | ||
| PCT/US2009/057268 WO2010062442A1 (en) | 2008-11-26 | 2009-09-17 | Project timeline visualization methods and systems |
Publications (2)
| Publication Number | Publication Date |
|---|---|
| JP2012510124A true JP2012510124A (en) | 2012-04-26 |
| JP2012510124A5 JP2012510124A5 (en) | 2012-11-01 |
Family
ID=42195821
Family Applications (1)
| Application Number | Title | Priority Date | Filing Date |
|---|---|---|---|
| JP2011538610A Pending JP2012510124A (en) | 2008-11-26 | 2009-09-17 | Project schedule visualization method and system |
Country Status (9)
| Country | Link |
|---|---|
| US (1) | US8063904B2 (en) |
| EP (1) | EP2370907A4 (en) |
| JP (1) | JP2012510124A (en) |
| KR (1) | KR20110091557A (en) |
| CN (1) | CN102265270A (en) |
| AU (1) | AU2009320257A1 (en) |
| CA (1) | CA2744528A1 (en) |
| IL (1) | IL213015A0 (en) |
| WO (1) | WO2010062442A1 (en) |
Cited By (1)
| Publication number | Priority date | Publication date | Assignee | Title |
|---|---|---|---|---|
| WO2017109863A1 (en) * | 2015-12-22 | 2017-06-29 | 株式会社日立製作所 | Resource accommodation device, schedule management device, and resource accommodation system |
Families Citing this family (9)
| Publication number | Priority date | Publication date | Assignee | Title |
|---|---|---|---|---|
| CN102981842B (en) * | 2012-11-08 | 2015-06-10 | 北京空间飞行器总体设计部 | Method of generating interactive Gantt chart |
| US20140240320A1 (en) * | 2013-02-04 | 2014-08-28 | Eddy Malik | Smart Timelines |
| US9726750B2 (en) | 2013-08-26 | 2017-08-08 | Specialty Electrical, Llc | Method and apparatus for multi-mode tracking and display of personnel locations in a graphical model |
| JP6287018B2 (en) * | 2013-10-04 | 2018-03-07 | 富士通株式会社 | Visualization method, display method, information processing apparatus, visualization program, and display program |
| US9740457B1 (en) * | 2014-02-24 | 2017-08-22 | Ca, Inc. | Method and apparatus for displaying timeline of software development data |
| KR101927424B1 (en) * | 2016-01-08 | 2018-12-10 | 한국전자통신연구원 | Visualization method of scheduling result in multicore system and apparatus thereof |
| US20190266765A1 (en) * | 2016-10-28 | 2019-08-29 | Nec Corporation | Process management apparatus, process management method, and storage medium |
| GB201621971D0 (en) * | 2016-12-22 | 2017-02-08 | Lingo Unite Ltd See Heidari Zainab Lookiimedia (Uk) Ltd | Dynamic timeline display |
| CN116168116B (en) * | 2023-04-19 | 2023-07-21 | 巴斯夫一体化基地(广东)有限公司 | Method and device for visually displaying test execution plan |
Citations (2)
| Publication number | Priority date | Publication date | Assignee | Title |
|---|---|---|---|---|
| JP2000034835A (en) * | 1998-05-12 | 2000-02-02 | Takiya Kensetsu Kogyo Kk | Construction management system and method, and computer readable medium |
| JP2004227147A (en) * | 2003-01-21 | 2004-08-12 | Ricoh Co Ltd | Device and method for managing resource, program, recording medium, and system designed/manufactured by using same |
Family Cites Families (13)
| Publication number | Priority date | Publication date | Assignee | Title |
|---|---|---|---|---|
| US7082605B2 (en) | 2000-03-31 | 2006-07-25 | Vidus Limited | Contingency planning in a scheduling process |
| US20060095457A1 (en) | 2001-01-12 | 2006-05-04 | Glasspool David W | Interactive tool for knowledge-based support of planning under uncertainty |
| US6993712B2 (en) | 2001-09-28 | 2006-01-31 | Siebel Systems, Inc. | System and method for facilitating user interaction in a browser environment |
| US7028036B2 (en) | 2002-06-28 | 2006-04-11 | Microsoft Corporation | System and method for visualization of continuous attribute values |
| US7131113B2 (en) | 2002-12-12 | 2006-10-31 | International Business Machines Corporation | System and method on generating multi-dimensional trace files and visualizing them using multiple Gantt charts |
| US7263474B2 (en) | 2003-01-29 | 2007-08-28 | Dancing Rock Trust | Cultural simulation model for modeling of agent behavioral expression and simulation data visualization methods |
| US7353223B2 (en) | 2003-08-28 | 2008-04-01 | Sap Aktiengesellschaft | Directed graph for distribution of time-constrained data |
| US20050165881A1 (en) * | 2004-01-23 | 2005-07-28 | Pipelinefx, L.L.C. | Event-driven queuing system and method |
| US20050222881A1 (en) | 2004-04-05 | 2005-10-06 | Garry Booker | Management work system and method |
| US20060044307A1 (en) | 2004-08-24 | 2006-03-02 | Kyuman Song | System and method for visually representing project metrics on 3-dimensional building models |
| KR20060021055A (en) * | 2004-09-02 | 2006-03-07 | 삼성전자주식회사 | Liquid crystal display, driving apparatus and method of liquid crystal display |
| US7471293B2 (en) | 2005-02-09 | 2008-12-30 | International Business Machines Corporation | Method, system, and computer program product for displaying calendar-based SLO results and breach values |
| JP5219378B2 (en) * | 2007-01-18 | 2013-06-26 | 株式会社日立製作所 | Interaction data display device, processing device, and display method |
-
2008
- 2008-11-26 US US12/324,054 patent/US8063904B2/en not_active Expired - Fee Related
-
2009
- 2009-09-17 AU AU2009320257A patent/AU2009320257A1/en not_active Abandoned
- 2009-09-17 CN CN2009801531518A patent/CN102265270A/en active Pending
- 2009-09-17 WO PCT/US2009/057268 patent/WO2010062442A1/en active Application Filing
- 2009-09-17 CA CA2744528A patent/CA2744528A1/en not_active Abandoned
- 2009-09-17 EP EP09829513.2A patent/EP2370907A4/en not_active Withdrawn
- 2009-09-17 KR KR1020117014640A patent/KR20110091557A/en not_active Application Discontinuation
- 2009-09-17 JP JP2011538610A patent/JP2012510124A/en active Pending
-
2011
- 2011-05-19 IL IL213015A patent/IL213015A0/en unknown
Patent Citations (2)
| Publication number | Priority date | Publication date | Assignee | Title |
|---|---|---|---|---|
| JP2000034835A (en) * | 1998-05-12 | 2000-02-02 | Takiya Kensetsu Kogyo Kk | Construction management system and method, and computer readable medium |
| JP2004227147A (en) * | 2003-01-21 | 2004-08-12 | Ricoh Co Ltd | Device and method for managing resource, program, recording medium, and system designed/manufactured by using same |
Cited By (3)
| Publication number | Priority date | Publication date | Assignee | Title |
|---|---|---|---|---|
| WO2017109863A1 (en) * | 2015-12-22 | 2017-06-29 | 株式会社日立製作所 | Resource accommodation device, schedule management device, and resource accommodation system |
| JPWO2017109863A1 (en) * | 2015-12-22 | 2017-12-21 | 株式会社日立製作所 | Resource accommodation device, schedule management device, and resource accommodation system |
| US11393050B2 (en) | 2015-12-22 | 2022-07-19 | Hitachi, Ltd. | Resource accommodation device, schedule management device, and resource accommodation system |
Also Published As
| Publication number | Publication date |
|---|---|
| WO2010062442A1 (en) | 2010-06-03 |
| WO2010062442A8 (en) | 2010-09-10 |
| CN102265270A (en) | 2011-11-30 |
| EP2370907A1 (en) | 2011-10-05 |
| AU2009320257A1 (en) | 2010-06-03 |
| KR20110091557A (en) | 2011-08-11 |
| US20100128040A1 (en) | 2010-05-27 |
| US8063904B2 (en) | 2011-11-22 |
| EP2370907A4 (en) | 2013-11-27 |
| CA2744528A1 (en) | 2010-06-03 |
| IL213015A0 (en) | 2011-07-31 |
Similar Documents
| Publication | Publication Date | Title |
|---|---|---|
| JP2012510124A (en) | Project schedule visualization method and system | |
| CN103020421B (en) | energy dashboard | |
| Lee et al. | Towards extreme (ly) usable software: Exploring tensions between usability and agile software development | |
| US20170061360A1 (en) | Interactive charts with dynamic progress monitoring, notification, and resource allocation | |
| US20120311497A1 (en) | System for business portfolio modeling and analysis | |
| WO2006068182A1 (en) | Spread sheet in-cell graph display method | |
| US20090231339A1 (en) | System, method and product for graphically displaying project status information | |
| Tsai et al. | Workflow re-engineering of design-build projects using a BIM tool | |
| Ivanov et al. | Design of a Dashboard of Software Metrics for Adaptable, Energy Efficient Applications (S). | |
| O'Brien et al. | Cognitive task analysis of superintendent's work: Case study and critique of supporting information technologies. | |
| JP2007018163A (en) | Progress management device | |
| US20100251205A1 (en) | System for implementing business transformation in an enterprise | |
| WO2023095322A1 (en) | Bim data providing system, bim data providing method, and program | |
| JP2012512459A (en) | Project schedule visualization method and system | |
| Huang et al. | Visualization techniques for schedule comparison | |
| St Germain et al. | Development of Improved Graphical Displays for an Advanced Outage Control Center, Employing Human Factors Principles for Outage Schedule Management | |
| JP2015095203A (en) | Working situation visualization system | |
| JP4268151B2 (en) | Production management apparatus, production management program, and production management method | |
| RU2013152141A (en) | METHOD FOR MANAGEMENT OF PROCESSES FOR PREPARING AND OPERATING COMPLEX TECHNICAL OBJECTS AND SYSTEM FOR ITS IMPLEMENTATION | |
| US20220414582A1 (en) | Production schedule change assistance apparatus, production schedule change assistance method, program therefor, and production management system | |
| JP2010061361A (en) | Project progress state display device, program, and recording medium | |
| JP2006185316A (en) | Business analysis support program, device and method | |
| Schneider et al. | A-Plan: Integrating interactive visualization with automated planning for cooperative resource scheduling | |
| US20140136272A1 (en) | System and method for providing gantt-trend chart in a supply chain management environment | |
| US20130066926A1 (en) | Accessible White Space in Graphical Representations of Information |
Legal Events
| Date | Code | Title | Description |
|---|---|---|---|
| A711 | Notification of change in applicant |
Free format text: JAPANESE INTERMEDIATE CODE: A711 Effective date: 20120817 |
|
| A521 | Request for written amendment filed |
Free format text: JAPANESE INTERMEDIATE CODE: A523 Effective date: 20120914 |
|
| A621 | Written request for application examination |
Free format text: JAPANESE INTERMEDIATE CODE: A621 Effective date: 20120914 |
|
| A977 | Report on retrieval |
Free format text: JAPANESE INTERMEDIATE CODE: A971007 Effective date: 20130904 |
|
| A131 | Notification of reasons for refusal |
Free format text: JAPANESE INTERMEDIATE CODE: A131 Effective date: 20131029 |
|
| A02 | Decision of refusal |
Free format text: JAPANESE INTERMEDIATE CODE: A02 Effective date: 20140401 |