KR20110091557A - Project timeline visualization methods and systems - Google Patents
Project timeline visualization methods and systems Download PDFInfo
- Publication number
- KR20110091557A KR20110091557A KR1020117014640A KR20117014640A KR20110091557A KR 20110091557 A KR20110091557 A KR 20110091557A KR 1020117014640 A KR1020117014640 A KR 1020117014640A KR 20117014640 A KR20117014640 A KR 20117014640A KR 20110091557 A KR20110091557 A KR 20110091557A
- Authority
- KR
- South Korea
- Prior art keywords
- information
- project
- displaying
- graphical representation
- resource data
- Prior art date
Links
Images


Classifications
-
- G—PHYSICS
- G06—COMPUTING; CALCULATING OR COUNTING
- G06T—IMAGE DATA PROCESSING OR GENERATION, IN GENERAL
- G06T11/00—2D [Two Dimensional] image generation
- G06T11/20—Drawing from basic elements, e.g. lines or circles
- G06T11/206—Drawing of charts or graphs
-
- G—PHYSICS
- G06—COMPUTING; CALCULATING OR COUNTING
- G06F—ELECTRIC DIGITAL DATA PROCESSING
- G06F17/00—Digital computing or data processing equipment or methods, specially adapted for specific functions
-
- G—PHYSICS
- G06—COMPUTING; CALCULATING OR COUNTING
- G06F—ELECTRIC DIGITAL DATA PROCESSING
- G06F3/00—Input arrangements for transferring data to be processed into a form capable of being handled by the computer; Output arrangements for transferring data from processing unit to output unit, e.g. interface arrangements
- G06F3/14—Digital output to display device ; Cooperation and interconnection of the display device with other functional units
-
- G—PHYSICS
- G06—COMPUTING; CALCULATING OR COUNTING
- G06Q—INFORMATION AND COMMUNICATION TECHNOLOGY [ICT] SPECIALLY ADAPTED FOR ADMINISTRATIVE, COMMERCIAL, FINANCIAL, MANAGERIAL OR SUPERVISORY PURPOSES; SYSTEMS OR METHODS SPECIALLY ADAPTED FOR ADMINISTRATIVE, COMMERCIAL, FINANCIAL, MANAGERIAL OR SUPERVISORY PURPOSES, NOT OTHERWISE PROVIDED FOR
- G06Q10/00—Administration; Management
- G06Q10/06—Resources, workflows, human or project management; Enterprise or organisation planning; Enterprise or organisation modelling
Landscapes
- Engineering & Computer Science (AREA)
- Theoretical Computer Science (AREA)
- Physics & Mathematics (AREA)
- Business, Economics & Management (AREA)
- General Physics & Mathematics (AREA)
- Strategic Management (AREA)
- Human Resources & Organizations (AREA)
- Entrepreneurship & Innovation (AREA)
- Economics (AREA)
- General Engineering & Computer Science (AREA)
- General Business, Economics & Management (AREA)
- Development Economics (AREA)
- Tourism & Hospitality (AREA)
- Educational Administration (AREA)
- Quality & Reliability (AREA)
- Game Theory and Decision Science (AREA)
- Operations Research (AREA)
- Marketing (AREA)
- Data Mining & Analysis (AREA)
- Databases & Information Systems (AREA)
- Mathematical Physics (AREA)
- Software Systems (AREA)
- Human Computer Interaction (AREA)
- Management, Administration, Business Operations System, And Electronic Commerce (AREA)
- User Interface Of Digital Computer (AREA)
- Information Transfer Between Computers (AREA)
Abstract
프로젝트 정보를 표시하기 위한 방법들, 시스템들 및 컴퓨터 판독가능 저장 매체들이 개시된다. 프로젝트 정보는, 프로젝트와 연관된 전자 계획 정보를 수신하고 ― 상기 계획 정보는 프로젝트 자원 데이터를 포함함 ―, 수신된 전자 계획 정보를 사용자에게 시각적으로 표시하기 위해 수신된 전자 계획 정보의 그래픽 표현으로 변환하고, 그리고 사용자에 의한 인식을 위해 수신된 계획 정보의 그래픽 표현을 표시함으로써 표시될 수 있고, 상기 표시된 그래픽 표현은 프로젝트 자원 데이터에 기초하여 시간을 통해 폭이 대칭적으로 변화하는 하나 이상의 라인들을 포함한다. Methods, systems, and computer readable storage media for displaying project information are disclosed. The project information receives electronic plan information associated with the project, the plan information including project resource data, converting the received electronic plan information into a graphical representation of the received electronic plan information for visual display to a user; And displaying a graphical representation of the plan information received for recognition by the user, wherein the displayed graphical representation includes one or more lines whose width varies symmetrically over time based on project resource data. .
Description
본 발명은 프로젝트 타임라인 시각화 방법들 및 시스템들에 관한 것이다.The present invention relates to project timeline visualization methods and systems.
Gantt 차트는 시간의 함수로써 프로젝트 스케줄을 표현하기 위해 수평 막대(bar)를 이용하는 막대 그래프(bar chart)이다. 프로젝트의 상이한 페이즈(phase)들이 상이한 막대들에 의해 Gantt 차트 상에 표현될 수 있다. 프로젝트의 스케줄을 추적(track)함에 있어서 프로젝트의 페이즈들에 관한 추가적인 정보를 아는 것이 유용할 수 있다. 전통적인 Gantt 차트들은 단지 시간의 함수로서 프로젝트 스케줄을 디스플레이한다. 다른 유형의 프로젝트 추적 기술들은 정보의 디스플레이를 과도하게 복잡화하는 경향이 있다. 그러므로 프로젝트 정보를 디스플레이하기 위한 개선된 방법이 필요하다.Gantt charts are bar charts that use horizontal bars to represent project schedules as a function of time. Different phases of the project can be represented on the Gantt chart by different bars. In tracking a project's schedule, it may be useful to know additional information about the phases of the project. Traditional Gantt charts only display project schedules as a function of time. Other types of project tracking techniques tend to overcomplicate the display of information. Therefore, there is a need for an improved method for displaying project information.
본 발명의 양상들은 프로젝트 정보를 표시하기 위한 방법들, 시스템들, 및 컴퓨터 판독가능 저장 매체들로 구현된다. 프로젝트 정보는 프로젝트와 연관된 전자 계획 정보(electronic planning information)를 수신하고 ― 상기 계획 정보는 프로젝트 자원 데이터를 포함함 ―, 수신된 전자 계획 정보를 사용자에게 시각적으로 표시하기 위해 수신된 전자 계획 정보의 그래픽 표현으로 변환하고, 그리고 사용자에 의한 인식을 위해 수신된 계획 정보의 그래픽 표현을 표시함으로써 표시될 수 있고, 상기 표시된 그래픽 표현은 프로젝트 자원 데이터에 기초하여 시간을 통해 폭이 대칭적으로 변화하는 하나 이상의 라인(line)들을 포함한다.Aspects of the invention are implemented with methods, systems, and computer readable storage media for displaying project information. The project information receives electronic planning information associated with the project, wherein the planning information includes project resource data, and a graphic of the received electronic planning information to visually display the received electronic planning information to the user. Converting into representations and displaying graphical representations of received plan information for recognition by the user, wherein the graphical representations displayed are one or more of which widths change symmetrically over time based on project resource data. It includes lines.
본 발명은 첨부된 도면들과 관련하여 판독될 때 다음의 상세한 설명으로부터 가장 잘 이해되고, 유사한 엘리먼트들은 동일한 참조 번호들을 가진다. 다수의 유사한 엘리먼트들이 존재하는 경우, 특정 엘리먼트들을 참조하는 작은 문자 지정(designation)을 이용하여 단일한 참조 번호가 이러한 다수의 유사한 엘리먼트들에 할당될 수 있다. 엘리먼트들을 집합적으로 참조하거나 엘리먼트들 중 불-특정(non-specific) 하나 이상의 엘리먼트들을 참조하는 경우, 이러한 작은 문자 지정은 생략될 수 있다. 이는 통상적인 관습에 따라 도면들 중 다양한 피처들이 일정한 비례로 도시되지 않음을 강조한다. 대조적으로, 다양한 피처들의 치수들은 명확화를 위해 임의로 확대 또는 감소된다. 다음의 도면들이 도면에 포함된다:
도 1은 본 발명의 양상에 따른 프로젝트와 연관된 정보를 표시하기 위한 예시적인 시스템을 도시하는 블록 다이어그램이고;
도 2는 본 발명의 양상에 따른 프로젝트와 연관된 정보를 표시하기 위한 예시적인 단계들의 흐름도이며;
도 3은 본 발명의 양상에 따른 프로젝트와 연관된 정보의 예시적인 그래픽 표현이고; 그리고
도 4는 본 발명의 양상에 따른 예시적인 프로젝트와 연관된 정보의 예시적인 그래픽 표현이다.The invention is best understood from the following detailed description when read in conjunction with the accompanying drawings, in which like elements have the same reference numerals. If there are multiple similar elements, a single reference number may be assigned to these multiple similar elements using small letter designations that refer to particular elements. This small character designation may be omitted when referencing elements collectively or referring to one or more non-specific elements of the elements. This emphasizes that various features in the figures are not drawn to scale in accordance with conventional practice. In contrast, the dimensions of the various features are arbitrarily enlarged or reduced for clarity. The following figures are included in the drawings:
1 is a block diagram illustrating an example system for displaying information associated with a project in accordance with an aspect of the present invention;
2 is a flowchart of exemplary steps for displaying information associated with a project in accordance with an aspect of the present invention;
3 is an exemplary graphical representation of information associated with a project in accordance with an aspect of the present invention; And
4 is an exemplary graphical representation of information associated with an exemplary project in accordance with an aspect of the present invention.
도 1은 본 발명의 일 양상에 따른 프로젝트와 연관된 정보를 표시하기 위한 예시적인 시스템(100)을 도시한다. 예시적인 프로젝트들은 비-제한적인 예로서: 소프트웨어 개발 프로젝트들, 건설 프로젝트들, 기계 장치 개발 프로젝트들, 전자 장치 개발 프로젝트들, 및 조경 또는 건축 프로젝트들을 포함할 수 있다. 프로젝트 정보는 예를 들어, 프로젝트와 연관된 프로젝트 페이즈들, 프로젝트 스케줄들, 또는 자원 데이터를 포함할 수 있다. 프로젝트 페이즈들 및 프로젝트 스케줄들은 프로젝트 또는 프로젝트 페이즈들에 대한 할당된 시간 또는 기한(deadline)들에 관한 정보를 포함할 수 있다. 자원 데이터는 예를 들어 프로젝트 또는 프로젝트 페이즈와 연관된 비용들, 인원(personnel), 또는 다른 자원들을 포함할 수 있다.1 illustrates an
일반적인 개괄로서, 시스템(100)은 입력 디바이스(102), 프로세서(104), 저장 디바이스(106), 및 출력 디바이스(108)를 포함한다. 시스템(100)에 대한 추가적인 세부사항들이 이하 제공된다.As a general overview,
입력 디바이스(102)는 사용자로부터 입력을 수신하고 프로세서(104)에 전자 데이터를 제공한다. 전자 데이터는 프로젝트 정보를 포함할 수 있다. 예시적인 실시예에서, 입력 디바이스(102)는 키보드, 마우스, 또는 외부 소스로부터 입력을 수신할 수 있는 다른 컴퓨터 주변 장치일 수 있다.
프로세서(104)는 입력 디바이스(102)로부터 전자 데이터를 수신하고 이러한 전자 데이터를 사용자에게 시각적으로 표시하기 위해 그래픽 표현으로 변환한다. 프로세서(104)는 저장 디바이스(106)(이하 설명)에 수신된 전자 데이터를 저장할 수 있다. 예시적인 실시예에서, 프로세서(104)는 전자 데이터에 포함된 프로젝트 정보의 그래픽 표현을 생성할 수 있다. 그래픽 표현은 시간의 함수로써 변화하는 하나 이상의 라인(line)들을 포함할 수 있다. 이러한 라인들은 상이한 프로젝트들 또는 동일한 프로젝트의 상이한 페이즈들에 대응할 수 있다. 이러한 라인들은 프로젝트 또는 프로젝트 페이즈와 연관된 자원 데이터에 대응하여 폭이 대칭적으로 변화할 수 있다. 프로세서(104)는 그 후 출력 디바이스(108)(이하 설명)로 상기 그래픽 표현을 제공할 수 있다. 본 발명과 함께 이용하기 위한 적합한 프로세서는 본원의 설명으로부터 당업자에 의해 이해될 것이다.
저장 디바이스(106)는 프로세서(104)로부터 수신된 전자 데이터를 저장한다. 예시적인 실시예에서, 프로세서(104)는 입력 디바이스(102)로부터 프로젝트 정보를 수신할 수 있고 프로젝트 정보 및/또는 상기 프로젝트 정보의 그래픽 표현을 저장을 위해 저장 디바이스(106)로 송신할 수 있다. 프로세서(104)는 프로젝트 정보의 그래픽 표현을 생성하기 위해 저장된 프로젝트 정보에 액세스하고/하거나 저장된 그래픽 표현에 액세스할 수 있다. 본 발명과 함께 이용하기 위한 적합한 저장 디바이스는 본원의 설명으로부터 당업자에 의해 이해될 것이다.
출력 디바이스(108)는 프로세서(104)로부터 전자 데이터를 수신하고 사용자에게 시각적으로 표시하기 위해 데이터를 출력한다. 전자 데이터는 프로젝트 정보의 그래픽 표현들을 포함할 수 있다. 예시적인 실시예에서, 출력 디바이스(108)는 컴퓨터 디스플레이, 프린터, 또는 사용자에게 시각적으로 표시하기 위해 수신된 전자 데이터로부터 출력을 생성할 수 있는 다른 컴퓨터 주변 장치일 수 있다.
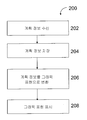
도 2는 본 발명의 일 양상에 따른 프로젝트와 연관된 정보를 표시하기 위한 예시적인 단계들을 도시하는 흐름도(200)이다. 설명을 용이하게 하기 위해, 도 2의 단계들은 도 1의 시스템 컴포넌트들을 참조하여 기술된다. 본 발명의 사상 및 범위를 벗어남이 없이 하나 이상의 단계들이 생략될 수 있고/있거나 상이한 컴포넌트들이 이용될 수 있음을 본원의 설명으로부터 당업자는 이해할 것이다.2 is a flow diagram 200 illustrating exemplary steps for displaying information associated with a project in accordance with an aspect of the present invention. For ease of explanation, the steps of FIG. 2 are described with reference to the system components of FIG. 1. One skilled in the art will understand from the description herein that one or more steps may be omitted and / or different components may be used without departing from the spirit and scope of the invention.
단계(202)에서, 계획 정보가 수신된다. 예시적인 실시예에서, 프로젝트와 연관된 계획 정보는 입력 디바이스(102)로부터 프로세서(104)에 의해 수신될 수 있다. 예시적인 계획 정보는 예를 들어, 프로젝트와 연관된 프로젝트 페이즈들, 프로젝트 스케줄들, 또는 자원 데이터를 포함할 수 있다. 프로젝트 페이즈들 및 프로젝트 스케줄들은 프로젝트 또는 프로젝트 페이즈들에 대해 할당된 시간 또는 기한들에 관한 정보를 포함할 수 있다. 자원 데이터는 예를 들어 프로젝트 또는 프로젝트 페이즈와 연관된 비용들, 인원, 또는 다른 자원들을 포함할 수 있다. 계획 정보의 입력은 데이터 엔트리 박스들 및/또는 드롭다운(drop down) 메뉴들을 포함하는 그래픽 사용자 인터페이스(GUI)의 이용을 통해 용이하게 될 수 있다. 본 발명과 함께 이용하기 위한 적합한 GUI는 본원의 설명으로부터 당업자에 의해 이해될 것이다. In
단계(204)에서, 수신된 계획 정보가 저장된다. 예시적인 실시예에서, 프로세서(104)는 저장 디바이스(106)에 저장 정보를 저장할 수 있다.In
단계(206)에서, 계획 정보는 사용자에게 시각적으로 표시하기 위해서 그래픽 표현으로 변환된다. 예시적인 실시예에서, 프로세서(104)는 프로젝트와 연관된 계획 정보로부터 그래픽 표현을 생성할 수 있다. 프로세서(104)는 저장된 계획 정보로부터 또는 수신된 계획 정보로부터 정보를 생성할 수 있다. 그래픽 표현은 시간의 함수로써 변화하는 하나 이상의 라인들을 포함할 수 있다. 이러한 라인들은 상이한 프로젝트들 또는 동일한 프로젝트의 상이한 페이즈들에 대응할 수 있다. 이러한 라인들은 프로젝트 또는 프로젝트 페이즈와 연관된 자원 데이터에 대응하여 폭이 대칭적으로 변화할 수 있다. 예를 들어, 라인의 폭은 자원들이 증가함에 따라 증가할 수 있고 자원들이 감소함에 따라 감소할 수 있다.In
단계(208)에서, 그래픽 표현은 사용자에 의한 인식을 위해 표시된다. 예시적인 실시예에서, 프로세서(104)는 상기 그래픽 표현을 출력 디바이스(108)로 송신할 수 있다. 그리고 나서 출력 디바이스(108)는 사용자에게 상기 그래픽 표현을 표시할 수 있다. 예를 들어, 그래픽 표현은 모니터와 같은 시각적 디스플레이 디바이스 상에 디스플레이되거나 프린터를 이용하여 종이 위에 프린트될 수 있다.In
도 3은 본 발명의 일 양상에 따라 사용자에게 표시하기 위한 프로젝트 정보의 예시적인 그래픽 표현(300)이다. 그래픽 표현은 전통적인 Gantt 차트 포맷과 유사하게, 시간을 통해 변화하는 길이를 갖는 8개의 막대들(302a-h)을 도시한다. 각각의 막대(302a-h)는 프로젝트의 스케줄링된 페이즈에 대응할 수 있다. 막대들(302d 및 302f-h)은 프로젝트 페이즈에 관한 추가적인 정보를 전달하기 위해 폭이 대칭적으로 변화한다. 예시적인 실시예에서, 막대의 폭은 프로젝트 계획 정보와 함께 포함된 자원 데이터에 대응할 수 있다. 이러한 자원 데이터는 프로젝트 페이즈와 연관된 비용들, 인원, 또는 다른 자원들을 포함할 수 있다. 막대들(302d 및 302f-h)은 자원 데이터에 있어서의 전이(transition)에 대응하여 막대 폭이 증가/감소하는 전이 영역들(304a-d)을 포함한다. 전이 영역(304a)에서 볼 수 있는 것과 같은, 폭이 증가하는 막대는 그러한 프로젝트 페이즈를 위해 요구되는 대응하는 자원의 양이 증가함을 나타낼 수 있다. 전이 영역(304d)에서 볼 수 있는 것과 같은, 폭이 감소하는 막대는 그러한 프로젝트 페이즈를 위해 요구되는 대응하는 자원의 양이 감소함을 나타낼 수 있다. 전이 영역의 형상은 자원 데이터의 카테고리에 대응할 수 있다. 예를 들어, 전이 영역(304a)에서 볼 수 있는 것과 같은, 곡선형 전이 영역은 비용 자원 데이터에 대응할 수 있다. 전이 영역(304b)에서 볼 수 있는 것과 같은, 폭의 수직한(perpendicular) 변화는 인원 데이터 정보에 대응할 수 있다. 전이 영역(304c)에서 볼 수 있는 것과 같은, 시간을 통한 폭의 선형(linear) 변화는 자원 데이터의 또 다른 카테고리에 대응할 수 있다.3 is an exemplary
하나의 예시적인 실시예에서, 막대들(302a-h)은 프로젝트 계획 정보에 대응할 수 있고, 막대들(302b 및 302f)과 중첩되는 막대들(306a-b)은 실제 프로젝트 정보에 대응할 수 있다. 막대(306b)는 실제 프로젝트 페이즈에 관한 추가적인 정보를 전달하기 위해 폭이 대칭적으로 변화할 수 있다. 폭의 변화는 프로젝트 동안 수신된 실제 자원 데이터에 있어서의 전이에 대응할 수 있다. 막대들(306a-b)은 계획 정보와 실제 정보 간의 불일치들을 보다 잘 도시하기 위해 막대들(302b 및 302f)과 동축으로(coaxially) 디스플레이될 수 있다. 실제 자원 데이터가 계획 정보에 포함된 자원 데이터를 초과하는 경우, 실제 자원 데이터에 대응하는 막대의 폭은 프로젝트 자원 데이터에 대응하는 막대의 폭을 초과할 수 있다(미도시). In one exemplary embodiment, the
단순화된 현실 세계의 예가 예시의 목적으로 이제 제공된다. 이러한 예에서, 케이크를 굽기 위한 프로젝트가 기술될 것이다. 이러한 프로젝트는 원료들을 획득하고, 원료들을 혼합하며, 혼합물을 굽는 페이즈들을 포함한다. 각 페이즈는 그것이 필요로 할 시간 길이에 관한 계획 정보를 가질 것이고, 완료를 위한 비용 및 요구되는 인원에 관한 자원 데이터를 포함할 것이다.An example of a simplified real world is now provided for purposes of illustration. In this example, a project for baking a cake will be described. This project involves phases of obtaining raw materials, mixing the raw materials, and baking the mixture. Each phase will have planning information about the length of time it will require, and will include resource data about the costs required to complete and the required personnel.
사용자는 케이크를 위한 원료들을 획득하는 페이즈가 한 시간을 필요로 할 것임을 나타내는 정보를 입력할 수 있다. 사용자는 또한 이러한 페이즈가 구입한 원료들 모두에 대한 추가적인 비용들을 포함할 것이고, 원료들을 획득하기 위해 3명의 풀-타임 노동자들을 필요로 할 것임을 특정할 수 있다. 사용자는 원료를 혼합하는 페이즈가 반 시간을 필요로 할 것임을 나타내는 정보를 추가로 입력할 수 있다. 이러한 페이즈에 대해, 사용자는 원료를 혼합하기 위한 어떠한 추가적인 비용들도 없을 것이고 한 명의 풀-타임 노동자에 의해 페이즈가 완료될 수 있음을 특정할 수 있다. 최종적으로, 사용자는 원료를 굽는 페이즈가 한 시간을 필요로 할 것임을 표시하는 정보를 입력할 수 있고, 이러한 페이즈가 오븐을 작동하기 위한 비용들을 포함할 것이지만 오븐을 모니터링하기 위해 단지 한 명의 파트-타임 노동자를 필요로 할 것임을 나타내는 정보를 입력할 수 있다. The user may enter information indicating that the phase of obtaining raw materials for the cake will require one hour. The user may also specify that this phase will include additional costs for all of the purchased raw materials and will require three full-time workers to obtain the raw materials. The user may further enter information indicating that the phase of mixing the raw materials would require half an hour. For this phase, the user may specify that there will be no additional costs for mixing the raw materials and that the phase can be completed by one full-time worker. Finally, the user can enter information indicating that the phase of baking the raw material will require an hour, and this phase will include costs for operating the oven, but only one part-time to monitor the oven. You can enter information to indicate that you will need workers.
도 4는 상기 프로젝트와 연관된 계획 정보로부터 생성된 그래프(400)의 예시적인 표현이다. 그래프(400)는 각 막대의 길이가 요구되는 시간에 대응하는 2개의 막대들(402a 및 402b)을 도시한다. 그래프는 또한 프로젝트의 진행 과정을 통해 막대들이 다양한 시간들에서 폭이 대칭적으로 변화하는 전이 영역들(404a-b 및 406a)을 갖는 막대들을 도시한다. 상부 막대(402a)는 막대 폭의 변화가 비용들의 변화에 대응하도록 각 페이즈에 대한 요구되는 시간 외에도 비용 자원 데이터를 도시한다. 예를 들어, 비용들이 증가하는 경우, 전이 영역(406a)에 도시된 것처럼 막대의 폭이 증가하고, 비용들이 감소하는 경우, 전이 영역(404a)에 도시된 것처럼 막대의 폭이 감소한다. 하부 막대(402b)는 각 페이즈에 대한 인원 자원 데이터를 유사하게 도시한다. 요구되는 인원이 감소하는 경우, 전이 영역(404b)에 도시된 것처럼 막대의 폭이 감소하고, 요구되는 인원이 증가하는 경우, 막대의 폭이 증가한다(미도시). 부가적으로, 전이 영역의 형상은 자원 데이터의 카테고리에 대응할 수 있다. 그래프(400)에서, 전이 영역들(404a 및 406a)에 도시된 것과 같은, 시간을 통한 선형 전이는 비용들의 변화에 대응하고; 전이 영역들(404b)에 도시된 것과 같은, 곡선형 전이는 인원 변화에 대응한다. 4 is an exemplary representation of a
상기 단계들 중 하나 이상은 컴퓨터 판독가능 저장 매체 상에 저장된 컴퓨터-실행가능 명령들에서 구현될 수 있다. 컴퓨터 판독가능 저장 매체는 예를 들어, 광학 디스크, 자기 디스크, 또는 솔리드 스테이트 소자와 같은, 범용 또는 전용 컴퓨터에 의해 수행되기 위한 명령들을 저장할 수 있는 실질적으로 임의의 유형의(tangible) 저장 매체일 수 있다.One or more of the above steps may be embodied in computer-executable instructions stored on a computer readable storage medium. A computer readable storage medium can be substantially any tangible storage medium that can store instructions for execution by a general purpose or dedicated computer, such as, for example, an optical disk, magnetic disk, or solid state element. have.
본 발명은 특정 실시예들을 참조하여 본원에서 도시되고 기술되지만, 본 발명은 도시된 세부사항들로 제한되도록 의도되지 않는다. 오히려, 청구범위의 균등물들의 범위 내에서 그리고 본 발명으로부터 벗어남이 없이 세부사항들에 있어서 다양한 수정들이 이루어질 수 있다. Although the present invention is shown and described herein with reference to specific embodiments, the present invention is not intended to be limited to the details shown. Rather, various modifications may be made in the details within the scope of equivalents of the claims and without departing from the invention.
Claims (20)
프로젝트와 연관된 전자 계획 정보(electronic planning information)를 수신하는 단계 ― 상기 계획 정보는 프로젝트 자원 데이터를 포함함 ―;
상기 수신된 전자 계획 정보를 사용자에게 시각적으로 표시하기 위해 상기 수신된 전자 계획 정보의 그래픽 표현으로 변환하는 단계; 및
상기 사용자에 의한 인식을 위해 상기 수신된 계획 정보의 상기 그래픽 표현을 표시하는 단계 ― 상기 표시된 그래픽 표현은 상기 프로젝트 자원 데이터에 기초하여 시간을 통해 폭이 대칭적으로 변화하는 하나 이상의 라인(line)들을 포함함 ―
를 포함하는, 프로젝트 정보를 표시하기 위한 방법.As a method for displaying project information,
Receiving electronic planning information associated with the project, the planning information including project resource data;
Converting the received electronic plan information into a graphical representation of the received electronic plan information for visual display to a user; And
Displaying the graphical representation of the received plan information for recognition by the user, wherein the displayed graphical representation comprises one or more lines whose width varies symmetrically over time based on the project resource data. Included ―
A method for displaying project information comprising a.
상기 그래픽 표현을 표시하는 단계는:
직선으로서 상기 하나 이상의 라인들 각각을 표시하는 단계
를 포함하는, 프로젝트 정보를 표시하기 위한 방법.The method of claim 1,
Displaying the graphical representation includes:
Marking each of the one or more lines as a straight line
A method for displaying project information comprising a.
상기 프로젝트 자원 데이터는 적어도 하나의 자원 전이(transition)를 포함하고 상기 그래픽 표현을 표시하는 단계는:
상기 적어도 하나의 자원 전이에 대응하는 전이 영역을 가진 상기 하나 이상의 라인들을 표시하는 단계
를 포함하는, 프로젝트 정보를 표시하기 위한 방법.The method of claim 1,
The project resource data includes at least one resource transition and displaying the graphical representation:
Indicating the one or more lines with a transition region corresponding to the at least one resource transition
A method for displaying project information comprising a.
상기 프로젝트 자원 데이터는 카테고리를 포함하고 상기 전이 영역은 상기 카테고리에 대응하는 형상을 가지는,
프로젝트 정보를 표시하기 위한 방법.The method of claim 3, wherein
The project resource data includes a category and the transition area has a shape corresponding to the category.
How to display project information.
상기 하나 이상의 라인들은 제 1 방향으로 연장되고 상기 전이 영역의 형상은 상기 하나 이상의 라인들에 수직한(perpendicular) 추가적인 라인인,
프로젝트 정보를 표시하기 위한 방법.The method of claim 4, wherein
Wherein the one or more lines extend in a first direction and the shape of the transition region is an additional line perpendicular to the one or more lines,
How to display project information.
상기 전이 영역의 형상은 시간을 통한 선형 전이인,
프로젝트 정보를 표시하기 위한 방법.The method of claim 4, wherein
The shape of the transition region is a linear transition over time,
How to display project information.
상기 전이 영역의 형상은 시간을 통한 곡선형 전이인,
프로젝트 정보를 표시하기 위한 방법.The method of claim 4, wherein
The shape of the transition region is a curved transition over time,
How to display project information.
상기 프로젝트와 연관된 실제 정보를 수신하는 단계 ― 상기 실제 정보는 실제 프로젝트 자원 데이터를 포함함 ―;
상기 실제 정보를 상기 실제 정보의 그래픽 표현으로 변환하는 단계; 및
상기 실제 정보의 상기 그래픽 표현을 표시하는 단계 ― 상기 표시된 그래픽 표현은 상기 실제 프로젝트 자원 데이터에 기초하여 시간을 통해 폭이 대칭적으로 변화하는 하나 이상의 라인들을 포함함 ―
를 더 포함하는, 프로젝트 정보를 표시하기 위한 방법.The method of claim 1,
Receiving actual information associated with the project, the actual information including actual project resource data;
Converting the actual information into a graphical representation of the actual information; And
Displaying the graphical representation of the actual information, wherein the displayed graphical representation includes one or more lines whose width varies symmetrically over time based on the actual project resource data
Further comprising a method for displaying project information.
상기 그래픽 표현을 표시하는 단계는:
상기 계획 정보에 대응하는 상기 하나 이상의 라인들과 동축으로(coaxially) 상기 실제 정보에 대응하는 상기 하나 이상의 라인들을 표시하는 단계
를 포함하는, 프로젝트 정보를 표시하기 위한 방법.The method of claim 8,
Displaying the graphical representation includes:
Displaying the one or more lines corresponding to the actual information coaxially with the one or more lines corresponding to the plan information.
A method for displaying project information comprising a.
상기 그래픽 표현을 표시하는 단계는:
상기 실제 정보에 대응하는 상기 하나 이상의 라인들의 폭이 상기 계획 정보에 대응하는 상기 하나 이상의 라인들의 폭을 초과하도록 상기 실제 정보에 대응하는 상기 하나 이상의 라인들을 표시하는 단계
를 포함하는, 프로젝트 정보를 표시하기 위한 방법.The method of claim 9,
Displaying the graphical representation includes:
Displaying the one or more lines corresponding to the actual information such that the width of the one or more lines corresponding to the actual information exceeds the width of the one or more lines corresponding to the plan information.
A method for displaying project information comprising a.
상기 표시하는 단계는:
그래픽 정보를 시각적 디스플레이 상에 디스플레이하는 단계
를 포함하는, 프로젝트 정보를 표시하기 위한 방법.The method of claim 1,
The displaying step is:
Displaying graphical information on a visual display
A method for displaying project information comprising a.
상기 변환하는 단계는:
컴퓨터 프로세서에 의해서, 상기 수신된 계획 정보를 상기 그래픽 표현으로 변환하는 단계
를 포함하는, 프로젝트 정보를 표시하기 위한 방법.The method of claim 1,
The converting step is:
Converting, by a computer processor, the received plan information into the graphical representation
A method for displaying project information comprising a.
상기 수신하는 단계는:
상기 컴퓨터 프로세서에 의해서, 상기 계획 정보를 수신하는 단계
를 포함하는, 프로젝트 정보를 표시하기 위한 방법.The method of claim 12,
The receiving step is:
Receiving, by the computer processor, the planning information
A method for displaying project information comprising a.
상기 표시된 하나 이상의 라인들은 제 1 방향으로 연장되고 상기 프로젝트 자원 데이터에 기초하여 시간을 통해 상기 제 1 방향에 적어도 실질적으로 수직인 2개의 방향들로 폭이 대칭적으로 변화하는,
프로젝트 정보를 표시하기 위한 방법.The method of claim 1,
The one or more displayed lines extend in a first direction and vary symmetrically in width in two directions at least substantially perpendicular to the first direction over time based on the project resource data;
How to display project information.
프로젝트와 연관된 전자 계획 정보를 수신하기 위한 수단 ― 상기 계획 정보는 프로젝트 자원 데이터를 포함함 ―;
상기 수신된 전자 계획 정보를 사용자에게 시각적으로 표시하기 위해 상기 수신된 전자 계획 정보의 그래픽 표현으로 변환하기 위한 수단; 및
상기 사용자에 의한 인식을 위해 상기 수신된 계획 정보의 상기 그래픽 표현을 표시하기 위한 수단 ― 상기 표시된 그래픽 표현은 상기 프로젝트 자원 데이터에 기초하여 시간을 통해 폭이 대칭적으로 변화하는 하나 이상의 라인들을 포함함―
을 포함하는, 프로젝트 정보를 표시하기 위한 시스템.As a system for displaying project information,
Means for receiving electronic plan information associated with the project, wherein the plan information includes project resource data;
Means for converting the received electronic plan information into a graphical representation of the received electronic plan information for visual display to a user; And
Means for displaying the graphical representation of the received plan information for recognition by the user, wherein the displayed graphical representation includes one or more lines whose width varies symmetrically over time based on the project resource data ―
Including a system for displaying project information.
상기 프로젝트 자원 데이터는 적어도 하나의 자원 전이를 포함하고 상기 그래픽 표현을 표시하기 위한 수단은:
상기 적어도 하나의 자원 전이에 대응하는 전이 영역을 가진 상기 하나 이상의 라인들을 표시하기 위한 수단
을 포함하는, 프로젝트 정보를 표시하기 위한 시스템.The method of claim 15,
The project resource data includes at least one resource transition and means for displaying the graphical representation is:
Means for indicating the one or more lines with a transition region corresponding to the at least one resource transition
Including a system for displaying project information.
상기 프로젝트와 연관된 실제 정보를 수신하기 위한 수단 ― 상기 실제 정보는 실제 프로젝트 자원 데이터를 포함함 ―;
상기 실제 정보를 상기 실제 정보의 그래픽 표현으로 변환하기 위한 수단; 및
상기 실제 정보의 상기 그래픽 표현을 표시하기 위한 수단 ― 상기 표시된 그래픽 표현은 상기 실제 프로젝트 자원 데이터에 기초하여 시간을 통해 폭이 대칭적으로 변화하는 하나 이상의 라인들을 포함함 ―
을 더 포함하는, 프로젝트 정보를 표시하기 위한 시스템.The method of claim 15,
Means for receiving real information associated with the project, the real information including real project resource data;
Means for converting the actual information into a graphical representation of the actual information; And
Means for displaying the graphical representation of the actual information, wherein the displayed graphical representation includes one or more lines whose width varies symmetrically over time based on the actual project resource data
The system for displaying the project information, further comprising.
프로젝트와 연관된 전자 계획 정보를 수신하는 동작 ― 상기 계획 정보는 프로젝트 자원 데이터를 포함함 ―;
상기 수신된 전자 계획 정보를 사용자에게 시각적으로 표시하기 위해 상기 수신된 전자 계획 정보의 그래픽 표현으로 변환하는 동작; 및
상기 사용자에 의한 인식을 위해 상기 수신된 계획 정보의 상기 그래픽 표현을 표시하는 동작 ― 상기 표시된 그래픽 표현은 상기 프로젝트 자원 데이터에 기초하여 시간을 통해 폭이 대칭적으로 변화하는 하나 이상의 라인들을 포함함 ―
을 포함하는 동작들을 수행하기 위한 것인,
프로젝트 정보를 표시하기 위한 컴퓨터-실행가능 명령들을 가지는 컴퓨터 판독가능 저장 매체.A computer readable storage medium having computer-executable instructions for displaying project information, the computer-executable instructions comprising:
Receiving electronic plan information associated with the project, wherein the plan information includes project resource data;
Converting the received electronic plan information into a graphical representation of the received electronic plan information for visual display to a user; And
Displaying the graphical representation of the received plan information for recognition by the user, wherein the displayed graphical representation includes one or more lines whose width varies symmetrically over time based on the project resource data.
To perform the operations comprising a,
Computer-readable storage medium having computer-executable instructions for displaying project information.
상기 프로젝트 자원 데이터는 적어도 하나의 자원 전이를 포함하고 상기 그래픽 표현을 표시하는 동작은:
상기 적어도 하나의 자원 전이에 대응하는 전이 영역을 가진 상기 하나 이상의 라인들을 표시하는 동작
을 포함하는, 프로젝트 정보를 표시하기 위한 컴퓨터-실행가능 명령들을 가지는 컴퓨터 판독가능 저장 매체.The method of claim 18,
The project resource data includes at least one resource transition and displaying the graphical representation:
Indicating the one or more lines with a transition region corresponding to the at least one resource transition
And computer-executable instructions for displaying project information.
상기 컴퓨터-실행가능 명령들은:
상기 프로젝트와 연관된 실제 정보를 수신하는 동작 ― 상기 실제 정보는 실제 프로젝트 자원 데이터를 포함함 ―;
상기 실제 정보를 상기 실제 정보의 그래픽 표현으로 변환하는 동작; 및
상기 실제 정보의 상기 그래픽 표현을 표시하는 동작 ― 상기 표시된 그래픽 표현은 상기 실제 프로젝트 자원 데이터에 기초하여 시간을 통해 폭이 대칭적으로 변화하는 하나 이상의 라인들을 포함함 ―
을 더 포함하는 동작들을 수행하기 위한 것인, 프로젝트 정보를 표시하기 위한 컴퓨터-실행가능 명령들을 가지는 컴퓨터 판독가능 저장 매체.
The method of claim 18,
The computer-executable instructions are:
Receiving real information associated with the project, the real information including real project resource data;
Converting the actual information into a graphical representation of the actual information; And
Displaying the graphical representation of the actual information, wherein the displayed graphical representation includes one or more lines whose width varies symmetrically over time based on the actual project resource data
And computer-executable instructions for displaying project information for performing operations further comprising.
Applications Claiming Priority (2)
| Application Number | Priority Date | Filing Date | Title |
|---|---|---|---|
| US12/324,054 US8063904B2 (en) | 2008-11-26 | 2008-11-26 | Project timeline visualization methods and systems |
| US12/324,054 | 2008-11-26 |
Publications (1)
| Publication Number | Publication Date |
|---|---|
| KR20110091557A true KR20110091557A (en) | 2011-08-11 |
Family
ID=42195821
Family Applications (1)
| Application Number | Title | Priority Date | Filing Date |
|---|---|---|---|
| KR1020117014640A KR20110091557A (en) | 2008-11-26 | 2009-09-17 | Project timeline visualization methods and systems |
Country Status (9)
| Country | Link |
|---|---|
| US (1) | US8063904B2 (en) |
| EP (1) | EP2370907A4 (en) |
| JP (1) | JP2012510124A (en) |
| KR (1) | KR20110091557A (en) |
| CN (1) | CN102265270A (en) |
| AU (1) | AU2009320257A1 (en) |
| CA (1) | CA2744528A1 (en) |
| IL (1) | IL213015A0 (en) |
| WO (1) | WO2010062442A1 (en) |
Cited By (1)
| Publication number | Priority date | Publication date | Assignee | Title |
|---|---|---|---|---|
| KR20170083416A (en) * | 2016-01-08 | 2017-07-18 | 한국전자통신연구원 | Visualization method of scheduling result in multicore system and apparatus thereof |
Families Citing this family (9)
| Publication number | Priority date | Publication date | Assignee | Title |
|---|---|---|---|---|
| CN102981842B (en) * | 2012-11-08 | 2015-06-10 | 北京空间飞行器总体设计部 | Method of generating interactive Gantt chart |
| US20140240320A1 (en) * | 2013-02-04 | 2014-08-28 | Eddy Malik | Smart Timelines |
| US9726750B2 (en) | 2013-08-26 | 2017-08-08 | Specialty Electrical, Llc | Method and apparatus for multi-mode tracking and display of personnel locations in a graphical model |
| JP6287018B2 (en) * | 2013-10-04 | 2018-03-07 | 富士通株式会社 | Visualization method, display method, information processing apparatus, visualization program, and display program |
| US9740457B1 (en) * | 2014-02-24 | 2017-08-22 | Ca, Inc. | Method and apparatus for displaying timeline of software development data |
| WO2017109863A1 (en) * | 2015-12-22 | 2017-06-29 | 株式会社日立製作所 | Resource accommodation device, schedule management device, and resource accommodation system |
| CN109891441A (en) * | 2016-10-28 | 2019-06-14 | 日本电气株式会社 | Process management device, process control method and storage medium |
| GB201621971D0 (en) * | 2016-12-22 | 2017-02-08 | Lingo Unite Ltd See Heidari Zainab Lookiimedia (Uk) Ltd | Dynamic timeline display |
| CN116168116B (en) * | 2023-04-19 | 2023-07-21 | 巴斯夫一体化基地(广东)有限公司 | Method and device for visually displaying test execution plan |
Family Cites Families (15)
| Publication number | Priority date | Publication date | Assignee | Title |
|---|---|---|---|---|
| JP2000034835A (en) * | 1998-05-12 | 2000-02-02 | Takiya Kensetsu Kogyo Kk | Construction management system and method, and computer readable medium |
| US7082605B2 (en) | 2000-03-31 | 2006-07-25 | Vidus Limited | Contingency planning in a scheduling process |
| US20060095457A1 (en) | 2001-01-12 | 2006-05-04 | Glasspool David W | Interactive tool for knowledge-based support of planning under uncertainty |
| US6993712B2 (en) | 2001-09-28 | 2006-01-31 | Siebel Systems, Inc. | System and method for facilitating user interaction in a browser environment |
| US7028036B2 (en) | 2002-06-28 | 2006-04-11 | Microsoft Corporation | System and method for visualization of continuous attribute values |
| US7131113B2 (en) | 2002-12-12 | 2006-10-31 | International Business Machines Corporation | System and method on generating multi-dimensional trace files and visualizing them using multiple Gantt charts |
| JP2004227147A (en) * | 2003-01-21 | 2004-08-12 | Ricoh Co Ltd | Device and method for managing resource, program, recording medium, and system designed/manufactured by using same |
| US7263474B2 (en) | 2003-01-29 | 2007-08-28 | Dancing Rock Trust | Cultural simulation model for modeling of agent behavioral expression and simulation data visualization methods |
| US7353223B2 (en) | 2003-08-28 | 2008-04-01 | Sap Aktiengesellschaft | Directed graph for distribution of time-constrained data |
| US20050165881A1 (en) * | 2004-01-23 | 2005-07-28 | Pipelinefx, L.L.C. | Event-driven queuing system and method |
| US20050222881A1 (en) | 2004-04-05 | 2005-10-06 | Garry Booker | Management work system and method |
| US20060044307A1 (en) | 2004-08-24 | 2006-03-02 | Kyuman Song | System and method for visually representing project metrics on 3-dimensional building models |
| KR20060021055A (en) * | 2004-09-02 | 2006-03-07 | 삼성전자주식회사 | Liquid crystal display, driving apparatus and method of liquid crystal display |
| US7471293B2 (en) | 2005-02-09 | 2008-12-30 | International Business Machines Corporation | Method, system, and computer program product for displaying calendar-based SLO results and breach values |
| JP5219378B2 (en) * | 2007-01-18 | 2013-06-26 | 株式会社日立製作所 | Interaction data display device, processing device, and display method |
-
2008
- 2008-11-26 US US12/324,054 patent/US8063904B2/en not_active Expired - Fee Related
-
2009
- 2009-09-17 AU AU2009320257A patent/AU2009320257A1/en not_active Abandoned
- 2009-09-17 CN CN2009801531518A patent/CN102265270A/en active Pending
- 2009-09-17 EP EP09829513.2A patent/EP2370907A4/en not_active Withdrawn
- 2009-09-17 WO PCT/US2009/057268 patent/WO2010062442A1/en active Application Filing
- 2009-09-17 KR KR1020117014640A patent/KR20110091557A/en not_active Application Discontinuation
- 2009-09-17 JP JP2011538610A patent/JP2012510124A/en active Pending
- 2009-09-17 CA CA2744528A patent/CA2744528A1/en not_active Abandoned
-
2011
- 2011-05-19 IL IL213015A patent/IL213015A0/en unknown
Cited By (1)
| Publication number | Priority date | Publication date | Assignee | Title |
|---|---|---|---|---|
| KR20170083416A (en) * | 2016-01-08 | 2017-07-18 | 한국전자통신연구원 | Visualization method of scheduling result in multicore system and apparatus thereof |
Also Published As
| Publication number | Publication date |
|---|---|
| AU2009320257A1 (en) | 2010-06-03 |
| US20100128040A1 (en) | 2010-05-27 |
| JP2012510124A (en) | 2012-04-26 |
| EP2370907A4 (en) | 2013-11-27 |
| CN102265270A (en) | 2011-11-30 |
| IL213015A0 (en) | 2011-07-31 |
| WO2010062442A1 (en) | 2010-06-03 |
| US8063904B2 (en) | 2011-11-22 |
| EP2370907A1 (en) | 2011-10-05 |
| WO2010062442A8 (en) | 2010-09-10 |
| CA2744528A1 (en) | 2010-06-03 |
Similar Documents
| Publication | Publication Date | Title |
|---|---|---|
| KR20110091557A (en) | Project timeline visualization methods and systems | |
| CN103020421B (en) | energy dashboard | |
| US7970639B2 (en) | Project management systems and methods | |
| US20090235194A1 (en) | Multi-step progress indicator and method for indicating progress in a multi-step computer application | |
| US20200320248A1 (en) | Method for managing and selectively arranging sets of multiple documents and pages within documents | |
| US20120304121A1 (en) | Method, processing device, and article of manufacture for providing instructions for displaying time-dependent information and for allowing user selection of time ranges | |
| WO2006068182A1 (en) | Spread sheet in-cell graph display method | |
| JP2012527693A (en) | Summary tasks for top-down project planning | |
| US20120042269A1 (en) | System and method for nesting timelines | |
| JP5982568B2 (en) | Web page display method and apparatus used for portable information terminal | |
| WO2014001060A1 (en) | A user interaction system for displaying digital objects | |
| WO2012027946A1 (en) | Method and system for realizing graphical user interface | |
| US10313558B2 (en) | Determining image rescale factors | |
| KR20110104956A (en) | Project timeline visualization methods and systems | |
| US20170255605A1 (en) | Annotations and Issue Tracking for Graphical Data | |
| EP2602712A1 (en) | Program-producing device and image control system | |
| Ferguson et al. | Vista: Spatial Data Representation for Smart Buildings | |
| St Germain et al. | Development of Improved Graphical Displays for an Advanced Outage Control Center, Employing Human Factors Principles for Outage Schedule Management | |
| Gallik et al. | DyVProMo-A Lightweight Web-Based Tool for the Dynamic Visualization of Additional Information in Business Process Models | |
| US20060174191A1 (en) | Information processing apparatus and method and storage medium storing information processing program | |
| JP2009157538A (en) | Activity management apparatus, system and program | |
| JP2008041071A (en) | Technique for creating policy information map in public policy | |
| CN104281637B (en) | Graphics System and recording medium | |
| Sugawara et al. | A novel intuitive GUI method for user-friendly operation | |
| JP2005250765A (en) | Schedule display device, schedule display method, program and recording medium |
Legal Events
| Date | Code | Title | Description |
|---|---|---|---|
| N231 | Notification of change of applicant | ||
| WITN | Application deemed withdrawn, e.g. because no request for examination was filed or no examination fee was paid |