WO2025013403A1 - 処理装置および処理方法 - Google Patents
処理装置および処理方法 Download PDFInfo
- Publication number
- WO2025013403A1 WO2025013403A1 PCT/JP2024/017902 JP2024017902W WO2025013403A1 WO 2025013403 A1 WO2025013403 A1 WO 2025013403A1 JP 2024017902 W JP2024017902 W JP 2024017902W WO 2025013403 A1 WO2025013403 A1 WO 2025013403A1
- Authority
- WO
- WIPO (PCT)
- Prior art keywords
- mass spectrum
- mass
- processor
- partial
- laser power
- Prior art date
- Legal status (The legal status is an assumption and is not a legal conclusion. Google has not performed a legal analysis and makes no representation as to the accuracy of the status listed.)
- Ceased
Links
Images




Classifications
-
- G—PHYSICS
- G01—MEASURING; TESTING
- G01N—INVESTIGATING OR ANALYSING MATERIALS BY DETERMINING THEIR CHEMICAL OR PHYSICAL PROPERTIES
- G01N27/00—Investigating or analysing materials by the use of electric, electrochemical, or magnetic means
- G01N27/62—Investigating or analysing materials by the use of electric, electrochemical, or magnetic means by investigating the ionisation of gases, e.g. aerosols; by investigating electric discharges, e.g. emission of cathode
-
- H—ELECTRICITY
- H01—ELECTRIC ELEMENTS
- H01J—ELECTRIC DISCHARGE TUBES OR DISCHARGE LAMPS
- H01J49/00—Particle spectrometers or separator tubes
-
- H—ELECTRICITY
- H01—ELECTRIC ELEMENTS
- H01J—ELECTRIC DISCHARGE TUBES OR DISCHARGE LAMPS
- H01J49/00—Particle spectrometers or separator tubes
- H01J49/02—Details
- H01J49/10—Ion sources; Ion guns
- H01J49/16—Ion sources; Ion guns using surface ionisation, e.g. field-, thermionic- or photo-emission
-
- H—ELECTRICITY
- H01—ELECTRIC ELEMENTS
- H01J—ELECTRIC DISCHARGE TUBES OR DISCHARGE LAMPS
- H01J49/00—Particle spectrometers or separator tubes
- H01J49/26—Mass spectrometers or separator tubes
- H01J49/34—Dynamic spectrometers
- H01J49/42—Stability-of-path spectrometers, e.g. monopole, quadrupole, multipole, farvitrons
Definitions
- This disclosure relates to a processing device that processes a mass spectrum acquired by a mass spectrometer that includes an ionization unit that ionizes a sample by laser desorption ionization and an analysis unit that analyzes the ionized sample by ion trap mass spectrometry, and a method for processing the mass spectrum.
- Patent Document 1 a method for ionizing a sample using a laser desorption/ionization method such as MALDI (Matrix Assisted Laser Desorption/Ionization).
- MALDI Microwave Assisted Laser Desorption/Ionization
- Patent Document 2 JP 2014-224732 A discloses a MALDI mass spectrometer that has a search function that changes the irradiation position of the laser light on the sample, detects ions generated at each irradiation position, and selects a suitable position for irradiating the laser light during measurement based on the amount of ions detected.
- Patent Document 3 discloses an ion trap mass spectrometer that uses an ion trap to ionize a sample using a laser desorption ionization method such as MALDI and capture the ions obtained using an electric field.
- the present disclosure has been made in consideration of such problems, and its purpose is to facilitate the process of adjusting the laser power in a mass spectrometer that uses ion trap mass spectrometry to analyze a sample ionized by laser desorption ionization.
- the processing device disclosed herein processes mass spectra acquired by a mass spectrometer equipped with an ionization section that ionizes a sample by laser desorption ionization and an analysis section that analyzes the ionized sample by ion trap mass spectrometry.
- the processing device includes a memory that stores multiple pre-accumulation mass spectra acquired by the mass spectrometer by measuring a sample prepared under the same conditions in one or multiple wells multiple times, a processor that processes the multiple pre-accumulation mass spectra stored in the memory, and a display device.
- the processor divides the multiple pre-accumulation mass spectra into multiple groups according to the order of the total ion amount obtained by accumulating the intensity in a predetermined mass-to-charge ratio range, and for each of the multiple groups, accumulates the pre-accumulation mass spectra contained in that group to obtain a partial accumulated mass spectrum, and displays specific information corresponding to the partial accumulated mass spectrum obtained for each group on the display device.
- the processing method disclosed herein is a method for processing a mass spectrum obtained by a mass spectrometer equipped with an ionization section that ionizes a sample by laser desorption ionization and an analysis section that analyzes the ionized sample by ion trap mass spectrometry.
- the processing method includes the steps of dividing a plurality of pre-accumulation mass spectra obtained by the mass spectrometer measuring a sample prepared under the same conditions in one or more wells multiple times into a plurality of groups according to the order of the total ion amount obtained by accumulating the intensity in a predetermined mass-to-charge ratio range, accumulating the pre-accumulation mass spectra contained in each of the plurality of groups to obtain a partial accumulated mass spectrum, and displaying specific information corresponding to the partial accumulated mass spectrum obtained for each group on a display device.
- the user can easily evaluate the appropriateness of the laser power, facilitating the process of adjusting the laser power.
- FIG. 1 is a schematic diagram showing a configuration of a mass spectrometry system.
- 4 is a flowchart showing a process executed by a processor.
- FIG. 4 is a diagram showing an example of a screen displayed on a display device.
- FIG. 13 is a diagram showing an example of a measurement result screen.
- FIG. 13 is a diagram showing a GUI for setting group boundaries according to a modified example.
- FIG. 13 is a diagram showing an example of a reference screen.
- FIG. 13 is a diagram showing an example of a measurement result screen according to a modified example.
- 13 is a flowchart showing a process according to a modified example executed by a processor.
- 9 is a flowchart showing the process of S107 in FIG. 8.
- [Configuration of mass spectrometry system] 1 is a schematic diagram showing the configuration of a mass spectrometry system.
- the mass spectrometry system 100 includes a mass spectrometry apparatus 10 and a processing apparatus 30.
- the mass spectrometry apparatus 10 is a matrix-assisted laser desorption ionization digital ion trap mass spectrometry apparatus (MALDI-DIT-MS).
- the mass spectrometry apparatus 10 is a mass spectrometry apparatus that ionizes a sample by laser desorption ionization and analyzes the generated ions by ion trap mass spectrometry, and is not limited to MALDI-DIT-MS as long as it ejects ions captured by the ion trap from the ion trap according to their mass-to-charge ratio and separates them by mass.
- the mass spectrometer 10 includes an ion source 1, an ion trap 2, a laser driver 3, an ion trap power supply 4, an ion detector 5, an output unit 6, and a controller 7.
- the ion source 1 is a MALDI ion source.
- the controller 7 controls the laser driver 3 and the ion trap power supply 4.
- the ion source 1 includes a sample plate 11, a laser irradiation unit 13, and an extraction electrode 14. A number of wells are arranged on the sample plate 11, and a sample 12 mixed with a matrix is prepared in at least one of the wells.
- the control unit 7 controls the laser driving unit 3.
- the laser driving unit 3 drives the laser irradiation unit 13 in accordance with a control command from the control unit 7.
- the laser irradiation unit 13 irradiates the sample 12 on the sample plate 11 with a pulsed laser light.
- various components contained in the sample 12 are ionized.
- the generated ions are extracted by an electric field for extracting ions formed between the sample plate 11 and the extraction electrode 14.
- the ion source 1 ionizes the sample by laser desorption ionization and corresponds to the ionization section in this disclosure.
- the ion trap 2 is a three-dimensional quadrupole ion trap.
- the ion trap 2 is not limited to a three-dimensional quadrupole ion trap, and may be another type of quadrupole ion trap or a linear ion trap.
- the ion trap 2 includes a ring electrode 21 and a pair of end cap electrodes 22, 24. The pair of end cap electrodes 22, 24 are disposed opposite each other, sandwiching the ring electrode 21.
- An ion introduction port 23 is provided approximately at the center of the end cap electrode 22.
- An ion exhaust port 25 is provided approximately at the center of the end cap electrode 24. Ions extracted from the ion source 1 are introduced into the ion trap 2 through the ion introduction port 23.
- the ion trap power supply 4 applies a square wave voltage to the ring electrode 21 as a trapping voltage. This creates a trapping electric field that vibrates the ions and traps them in the ion trap 2. With the square wave voltage applied to the ring electrode 21, the ion trap power supply 4 applies a radio frequency signal of a predetermined frequency to the end cap electrodes 22, 24. This causes ions with a specific mass-to-charge ratio to be resonantly excited (excited). The resonantly excited ions are ejected from the ion ejection port 25.
- the control unit 7 changes the frequency of the capture voltage applied to the ring electrode 21 and the frequency of the auxiliary voltage applied to the end cap electrodes 22 and 24. This sequentially changes the mass-to-charge ratio of the ions ejected from the ion ejection port 25.
- the ion detector 5 includes, for example, a conversion dynode and a secondary electron multiplier, and outputs a charge corresponding to the amount of ions detected as a detection signal.
- the detection signal output from the ion detector 5 is provided to the output section 6.
- the sample ionized in the ion source 1 is captured by the ion trap 2, and the captured ions are ejected from the ion trap 2 according to their mass-to-charge ratio and sequentially detected by the ion detector 5.
- the ion trap 2 and the ion detector 5 correspond to the analysis unit in this disclosure that analyzes the ionized sample by ion trap mass spectrometry.
- the output unit 6 generates a mass spectrum by converting the detection signal into digital data.
- the output unit 6 sends the generated mass spectrum to the control unit 7.
- the mass spectrum obtained in one measurement is referred to as the "mass spectrum before accumulation.”
- the processing device 30 is composed of an input/output interface (I/F) 31, a processor 32, a memory 34, an input device 36, and a display device 38, and is, for example, a personal computer.
- the input/output I/F 31, the processor 32, the memory 34, the input device 36, and the display device 38 are connected to a bus 39.
- the processing device 30 receives the pre-accumulation mass spectrum obtained by measurement from the control unit 7 of the mass spectrometer 10. It also accepts input of measurement conditions and instructions to start measurement, and sends various commands to the control unit 7.
- the input/output I/F 31 is connected to the control unit 7 of the mass spectrometer 10, and receives the pre-accumulation mass spectrum obtained by measurement from the control unit 7, and transmits various information received via the input device 36 to the control unit 7.
- Memory 34 includes a ROM (Read Only Memory), a RAM (Random Access Memory), and a HDD (Hard Disk Drive).
- the ROM stores the programs executed by the processor 32.
- the RAM temporarily stores data generated by the execution of the programs in the processor 32, and data input via the input/output I/F.
- the RAM can function as a temporary data memory used as a working area.
- the HDD is a non-volatile storage device. Also, a semiconductor storage device such as a flash memory may be used instead of the HDD.
- the program stored in the ROM may also be stored on a storage medium and distributed as a program product.
- the program may be provided by an information provider as a program product that can be downloaded via the Internet, etc.
- the storage medium is not limited to DVD-ROM (Digital Versatile Disk Read-Only Memory), CD-ROM (compact disc read-only memory), FD (Flexible Disk), and hard disk, but may also be a medium that carries a program in a fixed manner, such as magnetic tape, cassette tape, optical disk (MO (Magnetic Optical Disc)/MD (Mini Disc)/DVD (Digital Versatile Disc)), optical card, mask ROM, EPROM (Electronically Programmable Read-Only Memory), EEPROM (Electronically Erasable Programmable Read-Only Memory), flash ROM, and other semiconductor memory.
- the recording medium is a non-transitory medium that allows a computer to read programs, etc.
- the memory 34 stores the pre-accumulation mass spectrum obtained by the mass spectrometer 10 and the measurement conditions under which the pre-accumulation mass spectrum was obtained.
- the memory 34 also stores in advance reference information for the user to interpret the mass spectrum.
- the input device 36 includes a keyboard, a pointing device, etc., and is used for inputting various data and performing various operations.
- the input device 36 accepts input of measurement conditions such as the intensity of the laser light irradiated from the laser irradiation unit 13, mass spectrum processing conditions, etc.
- the display device 38 includes a liquid crystal display or an organic electroluminescence display, and displays the mass spectrum, various information, and images.
- the input device 36 and the display device 38 may be configured as a touch panel display.
- the mass spectrometer 10 performs mass analysis by generating ions in the ion source 1, trapping the generated ions in the ion trap 2, and ejecting the trapped ions according to their mass-to-charge ratio.
- the amount of ions generated in the ion source 1 is too large, many ions will be trapped in the ion trap 2, and the quality of the mass spectrum will deteriorate due to the effect of space charge caused by the trapped ions.
- the amount of ions generated in the ion source 1 is too small due to reasons such as the laser power being too low, peaks cannot be detected due to the effect of noise. Therefore, by appropriately setting the laser power, it is possible to obtain a high-quality mass spectrum with high mass resolution and signal-to-noise ratio (S/N ratio).
- the amount of ions generated varies even when the laser power is constant, due to differences in the ionization efficiency of the sample at the irradiated position.
- the amount of ions generated by ion source 1 increases even if the laser power is set to an appropriate level, and the quality of the mass spectrum deteriorates.
- the processing device 30 disclosed herein makes it easier to identify the cause of deterioration in the quality of the mass spectrum and facilitates the process of adjusting the laser power. Below, a specific method for facilitating the process of adjusting the laser power is described.
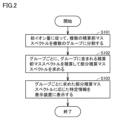
- FIG. 2 is a flowchart showing the process executed by the processor 32.
- the process shown in Fig. 2 is executed by the processor 32 executing a program stored in the memory 34.
- steps will be abbreviated as "S”.
- the processor 32 processes the pre-accumulation mass spectrum obtained by the mass spectrometer 10 and displays the processing results on the display device 38.
- the processor 32 processes multiple pre-accumulation mass spectra obtained by the mass spectrometer 10 by measuring samples prepared under the same conditions in one or multiple wells multiple times.
- the pre-accumulation mass spectra processed by the processor 32 are stored in the memory 34.
- a sample is prepared under the same conditions in at least one of multiple wells on the sample plate 11.
- the mass spectrometer 10 may measure a sample placed in one well multiple times to obtain multiple pre-accumulation mass spectra, or may measure each sample placed in multiple wells once or multiple times to obtain multiple pre-accumulation mass spectra.
- the processor 32 divides the multiple pre-accumulation mass spectra into multiple groups according to the order of the total ion amount.
- the “total ion amount” is obtained by accumulating the intensities of a predetermined range of mass-to-charge ratios in the pre-accumulation mass spectrum.
- the ions trapped in the ion trap 2 are detected by the ion detector 5, so the “total ion amount” corresponds to a feature value indicating the total amount of ions trapped in the ion trap 2.
- the “total ion amount” is the “Total Ion Current (TIC)” obtained by adding up the signal intensities of all peaks observed in one pre-accumulation mass spectrum.
- the predetermined range is preferably from the lower limit to the upper limit of the mass-to-charge ratio discharged from the ion trap.
- the TIC may be calculated by the control unit 7 of the mass spectrometer 10 based on the mass spectrum generated by the output unit 6 or the detection results of the ion detector 5. In this case, the TIC is stored in the memory 34 in association with the pre-accumulation mass spectrum. The TIC may also be calculated by the processor 32 based on the pre-accumulation mass spectrum.
- the number of groups may be two or more, and may be three or more.
- the number of groups may be predetermined, or may be set by the user via the input device 36.
- the number of pre-accumulation mass spectra included in each of the multiple groups may be the same, or at least some of the groups may be different.
- the processor 32 divides multiple pre-accumulation mass spectra into four groups so that each of the four groups contains a common number of pre-accumulation mass spectra.
- the mass spectrometer 10 measures 100 times a sample prepared under the same conditions in one or more wells, thereby obtaining 100 pre-accumulation mass spectra.
- the processor 32 classifies the bottom 25 pre-accumulation mass spectra with the lowest TIC into Group 1, the bottom 26th to 50th pre-accumulation mass spectra into Group 2, the bottom 51st to 75th pre-accumulation mass spectra into Group 3, and the bottom 76th to 100th pre-accumulation mass spectra into Group 4.
- processor 32 accumulates the pre-accumulation mass spectra contained in each group for each group.
- a mass spectrum obtained by accumulating the pre-accumulation mass spectra contained in one group is referred to as a "partially accumulated mass spectrum.”
- processor 32 accumulates the 25 pre-accumulation mass spectra contained in each of Group 1 to Group 4 to obtain a partially accumulated mass spectrum. In this way, processor 32 obtains the first to fourth partially accumulated mass spectra from Group 1 to Group 4, respectively.
- the processor 32 displays specific information corresponding to the partial integrated mass spectrum obtained for each group on the display device 38.
- the processor 32 may display the partial integrated mass spectrum as the specific information, or may display information obtained based on the partial integrated mass spectrum.
- Information obtained based on the partial integrated mass spectrum includes, for example, an evaluation result indicating whether or not the laser power is appropriate.
- the processor 32 is described as displaying the partial integrated mass spectrum as the specific information.
- the specific information is useful to the user as further information for determining whether the laser power is appropriate.
- the user can easily evaluate the appropriateness of the laser power, facilitating the process of adjusting the laser power.
- Display example 3 is a diagram showing an example of a screen displayed on the display device.
- the screen 300 includes a measurement result screen 40 and a reference screen 50, and is generated by the processor 32.
- the processor 32 displays the measurement result screen 40 and the reference screen 50 side by side on one screen 300.
- the processor 32 may also display the measurement result screen 40 and the reference screen 50 so that they can be moved separately on the display screen of the display device 38.
- the measurement result screen 40 displays the results of measurements under certain measurement conditions in order to set the measurement conditions including the laser power.
- the measurement result screen 40 displays specific information 44.
- the first partial integrated mass spectrum 441 to the fourth partial integrated mass spectrum 444 obtained for each group are displayed as the specific information 44.
- the measurement result screen 40 also displays a GUI (Graphical User Interface) 42 for receiving input of the group division conditions, a GUI 46 for receiving input of the display range of the first partial integrated mass spectrum 441 to the fourth partial integrated mass spectrum 444, and a graph 48 showing one mass spectrum obtained by integrating all the obtained partial integrated mass spectra.
- the one mass spectrum obtained by integrating all the obtained partial integrated mass spectra is referred to as the "post-integration mass spectrum".
- the post-integration mass spectrum can also be obtained by integrating all the multiple pre-integration spectra obtained by the mass spectrometer 10 measuring a sample prepared under the same conditions in one or multiple wells multiple times.
- the user can evaluate the quality of the accumulated mass spectrum based on the shape of each partial accumulation mass spectrum, and can evaluate the appropriateness of the laser power in more detail based on the evaluation results for each partial accumulation mass spectrum.
- the processor 32 accepts the input of the mass-to-charge ratio range by the user operating the GUI 46 using the input device 36.
- the processor 32 displays the partially integrated mass spectrum of the accepted mass-to-charge ratio range on the display device 38 for each group. Since the display area of the display device 38 is limited, when the partially integrated mass spectrum of the entire range of the acquired mass-to-charge ratio is displayed, it is difficult to display each partially integrated mass spectrum side by side, making it difficult to compare them. In addition, when the partially integrated mass spectrum of the entire range of the acquired mass-to-charge ratio is displayed, it is difficult to evaluate each small peak.
- the part of the mass-to-charge ratio range displayed in the partially integrated mass spectrum is a predetermined range (for example, ⁇ 5 Da) centered on the mass-to-charge ratio of one reference peak.
- the reference peak is a peak with high signal intensity, such as a peak of a specific compound in a standard sample contained in the sample, or a high-quality peak with an S/N ratio of greater than 3.
- the reference screen 50 displays reference information for interpreting the appropriateness of the laser power based on the displayed specific information 44.
- the user can proceed with interpreting the appropriateness of the laser power based on the specific information 44 displayed on the measurement result screen 40 based on the reference information, and can more easily evaluate the appropriateness of the laser power.
- the reference information includes partial integrated mass spectra for each group obtained by dividing the multiple sample mass spectra into multiple groups in the order of the total ion amount, and interpretation information indicating the result of interpreting whether the laser power is appropriate or not based on the partial integrated mass spectrum for each group.
- the partial integrated mass spectrum created based on the multiple sample mass spectra is referred to as a "sample partial integrated mass spectrum.”
- the sample partial integrated mass spectrum for each group and the interpretation information are displayed on the display device 38.
- the reference screen 50 displays a sample partial integrated mass spectrum for each typical group obtained under an appropriate laser power, a sample partial integrated mass spectrum for each typical group obtained under a laser power stronger than the appropriate laser power, or a sample partial integrated mass spectrum for each typical group obtained under a laser power weaker than the appropriate laser power. Display examples of the reference screen 50 will be described later with reference to FIG. 6.
- [Measurement results screen] 4 is a diagram showing an example of the measurement result screen. As described above, the measurement result screen 40 displays the GUI 42, the specific information 44, the GUI 46, and the graph 48.
- GUI 42 accepts input of group division conditions.
- GUI 42 includes input fields 421 to 423.
- input device 36 By using input device 36 to input numerical values into input fields 421 to 423, the user can set the division of each group, such as classifying a certain number into Group 1 and a certain number into Group 2 according to the order of the total ion amount.
- FIG. 5 is a diagram showing a GUI for setting the divisions of groups according to a modified example.
- GUI 42a includes sliders 421a to 423a. The user can set the divisions of each group by moving sliders 421a to 423a using input device 36. Furthermore, instead of dividing by the number contained in the group, division by percentile (percentage) may also be used.
- processor 32 displays mass resolution 445 as a feature indicating the quality of the partial integration mass spectrum, in association with each of first partial integration mass spectrum 441 to fourth partial integration mass spectrum 444.
- Processor 32 extracts peaks from the partial integration mass spectrum for each of first partial integration mass spectrum 441 to fourth partial integration mass spectrum 444, and determines mass resolution 445 for each extracted peak.
- Processor 32 displays the determined mass resolution 445 on display device 38 in association with the peak. Note that the method of extracting peaks and the method of calculating mass resolution 445 are publicly known, and therefore will not be described in detail here.
- the feature quantity indicating the quality of the partial integrated mass spectrum is displayed on the display device 38 in association with each partial integrated mass spectrum, allowing the user to more easily evaluate the quality of each partial integrated mass spectrum and more easily evaluate the appropriateness of the laser power.
- the processor 32 displays a signal intensity range 447 indicating the maximum and minimum values of the actual values measured by the ion detector 5, corresponding to each of the first partial integration mass spectrum 441 to the fourth partial integration mass spectrum 444. Since relative intensities are often used in the first partial integration mass spectrum 441 to the fourth partial integration mass spectrum 444, it is not possible to simply compare the intensities of the peaks shown in the first partial integration mass spectrum 441 to the fourth partial integration mass spectrum 444. Therefore, by displaying the signal intensity range 447 corresponding to the actual measurements on the display device 38, the signal intensities of the first partial integration mass spectrum 441 to the fourth partial integration mass spectrum 444 can be compared.
- the GUI 46 includes tabs 461 and buttons 462.
- a list 461a is displayed.
- the user sets the mass-to-charge ratio range, which is the display range of the partially integrated mass spectrum to be displayed as the specific information 44, by selecting one of the mass-to-charge ratios in the list 461a via the input device 36.
- the processor 32 may also display the set mass-to-charge ratio range as a setting frame 481 in the graph 48. This allows the user to easily identify which range of the entire measured mass-to-charge ratio range is being displayed as the specific information 44.
- Button 462 is, for example, a GUI for registering a new mass-to-charge ratio in list 461a.
- the user can register a new mass-to-charge ratio in list 461a by operating button 462 via input device 36.
- processor 32 may extract peaks from the accumulated mass spectrum shown in graph 48, and set the mass-to-charge ratio of each peak as the mass-to-charge ratio displayed in list 461a.
- FIG. 6 is a diagram showing an example of the reference screen. At least one piece of reference information 52 is displayed on the reference screen 50. In the example shown in Fig. 6, four pieces of reference information 52a to 52d are displayed.
- the processor 32 displays, as the reference information 52, a sample partial integrated mass spectrum 522, an interpretation result 521 of the sample partial integrated mass spectrum, and consideration information 523 showing the process of obtaining the interpretation result 521 from the sample partial integrated mass spectrum 522.
- Interpretation result 521 is information showing the result of interpreting whether the laser power, which is one of the measurement conditions of the sample partial integrated mass spectrum used to obtain sample partial integrated mass spectrum 522, is appropriate. In the example shown in FIG. 6, whether the laser power is appropriate or not is shown by displaying "Good Example” or "Bad Example.”
- the consideration information 523 is information showing how to interpret the sample partial integrated mass spectrum 522, for example, information explaining why the interpretation result 521 is obtained from the obtained sample partial integrated mass spectrum 522.
- the reference information 52 is obtained, for example, as follows.
- the business or user providing the mass spectrometry system 100 acquires multiple sample partial integrated mass spectra in advance, and obtains multiple sample partial integrated mass spectra 522 based on the acquired multiple sample partial integrated mass spectra.
- the business or user evaluates whether the laser power is appropriate based on the acquired multiple sample partial integrated mass spectra 522.
- the business or user stores the evaluation result as interpretation result 521 in memory 34 in association with the multiple sample partial integrated mass spectra 522, and stores the reason for the evaluation result as consideration information 523 in processor 32 in association with the multiple sample partial integrated mass spectra 522.
- the user can easily evaluate the appropriateness of the laser power by analyzing the specific information 44 in the measurement result screen 40 while checking the reference information 52.
- Reference information 52a and 52b are information relating to a sample partial integrated mass spectrum when the laser power is considered to be appropriate.
- Reference information 52c is information relating to a sample partial integrated mass spectrum when the laser power is considered to be too strong.
- Reference information 52d is information relating to a sample partial integrated mass spectrum when the laser power is considered to be too weak.
- the user can determine from reference information 52a that isotope peaks appear in the partial integrated mass spectra of all groups, the mass resolution of the partial integrated mass spectra of all groups is high, and the quality of the partial integrated mass spectrum of the group with the smallest total ion amount is the best, the user can evaluate that the laser power is appropriate.
- the user can determine from reference information 52b that the peak position is shifted only in the partial integrated mass spectrum of the group with the highest total ion amount, and isotope peaks appear in the partial integrated mass spectra other than the group with the highest total ion amount, then the user can determine that the deterioration in quality of the partial integrated mass spectrum of the group with the highest total ion amount is merely the effect of the sweet spot, and that the laser power is appropriate.
- the user can determine from reference information 52c that the laser power is too high if no isotope peaks appear or the number of isotope peaks is small in the partially integrated mass spectrum other than the group with the smallest total ion amount.
- the user can determine from reference information 52d that if the maximum value of the signal intensity (peak intensity) is less than a predetermined value (1.0 mV in the example shown in Figure 6) in any of the partially integrated mass spectra, the laser power is too low.
- the user can more easily evaluate the appropriateness of the laser power. Furthermore, by further displaying consideration information 523 as reference information 52, the user can evaluate the laser power with more evidence.
- the processing device 30 may determine the appropriateness of the laser power based on the partial integrated mass spectrum obtained for each group, and display the result of this determination on the display device 38 as the identification information 44.
- FIG. 7 is a diagram showing an example of a measurement result screen according to the modified example.
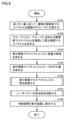
- FIG. 8 is a flowchart showing the processing according to the modified example executed by the processor.
- FIG. 9 is a flowchart showing the processing of S107 in FIG. 8.
- the processor 32 may display, as the specific information, a judgment result 448 of the judgment on the appropriateness of the laser power. Furthermore, in addition to the judgment result 448, the processor 32 may further display information 449 indicating the reason for arriving at the judgment result 448. The user need only adjust the laser power based on the displayed judgment result 448, making the laser power adjustment process easier. Note that in the example shown in FIG. 7, the judgment result 448 and information 449 are displayed in addition to the partially accumulated mass spectrum of each group, but the processor 32 may display only the judgment result 448 as the specific information 44.
- the processor 32 determines the mass resolution for each partially integrated mass spectrum.
- the mass resolution is a feature that indicates the quality of the partially integrated mass spectrum.
- the process of S104 is an example of a process for determining, for each partially integrated mass spectrum, a feature that indicates the quality of the partially integrated mass spectrum.
- the processor 32 extracts the peak with the highest intensity from the partially integrated mass spectrum, and determines the mass resolution from that peak.
- the processor 32 determines the peak shift for each partially integrated mass spectrum.
- a shift in the peak position means that the quality of the peak is reduced, so the peak shift corresponds to a feature that indicates the quality of the mass spectrum.
- the process of S105 is an example of a process for determining a feature that indicates the quality of each partially integrated mass spectrum.
- the processor 32 determines the peak shift by determining the shift from the reference position, which is the position of the peak in the partially integrated mass spectrum of the group with the smallest total ion amount. Note that the method of determining the peak shift is not limited to this method.
- the processor 32 may extract a peak corresponding to the standard substance and determine the difference between the position of the extracted peak and the position of the peak theoretically predicted from the mass of the standard substance to determine the peak shift.
- the mass-to-charge ratio (the peak position) shifts to the lower or higher mass side due to the effect of the space charge of the trapped ions.
- the shift in the peak can be said to be a characteristic quantity that indicates the degree of effect of the space charge of the trapped ions.
- processor 32 evaluates the quality of each partially integrated mass spectrum based on features that indicate the quality of the mass spectrum. As an example, processor 32 evaluates the quality of the partially integrated mass spectrum as follows. Processor 32 evaluates the quality of the mass spectrum as poor if the mass resolution is equal to or less than a predetermined first threshold value, or if the peak shift is equal to or more than a predetermined second threshold value. Processor 32 also evaluates the quality of the mass spectrum as good if the mass resolution is higher than the first threshold value and the peak shift is less than the second threshold value. Note that the method of evaluating the quality of the partially integrated mass spectrum is not limited to this method.
- the processor 32 determines the appropriateness of the laser power based on the results of evaluating the quality of each partial integrated mass spectrum.
- the processor 32 determines the appropriateness of the laser power based on the results of evaluating the quality of each partial integrated mass spectrum as follows. As described above, in this embodiment, Groups 1, 2, 3, and 4 are set in ascending order of total ion amount. In the following, the quality of the partial integrated mass spectrum of each group of Groups 1 to 4 will be described as being evaluated.
- the processor 32 determines whether the quality of all the partially accumulated mass spectra is poor. If it is determined that the quality is poor (YES in S71), the processor 32 executes the process of S72.
- the processor 32 determines whether the maximum signal strength is equal to or greater than a predetermined value.
- the maximum signal strength is the maximum value of the actual signal strength measured by the ion detector 5.
- the processor 32 determines in S81 that the laser power is stronger than the target value, terminates processing in S107, and proceeds to processing in S108.
- the "target value” is the laser power suitable for obtaining a high-quality mass spectrum, and differs depending on the analysis conditions.
- the processor 32 determines in S82 that the laser power is weaker than the target value, terminates processing in S107, and proceeds to processing in S108.
- the processor 32 determines that all of the partially accumulated mass spectra are of poor quality, it determines that the laser power is inappropriate.
- the processor 32 executes the process of S73.
- the processor 32 determines whether the quality of at least the partial integrated mass spectrum of Group 1 is good and the quality of both the partial integrated mass spectra of Groups 3 and 4 is poor.
- Group 1 refers to the group with the smallest total ion amount, and the total ion amount increases in the order of Groups 2, 3, and 4. If it is determined that the quality of at least the partial integrated mass spectrum of Group 1 is good and the quality of both the partial integrated mass spectra of Groups 3 and 4 is poor (YES in S73), the processor 32 executes the process of S81.
- the processor 32 determines that the laser power is stronger than the target value, terminates the processing of S107, and proceeds to the processing of S108. That is, if the quality of the partial integrated mass spectrum of Group 1 is good and the quality of the partial integrated mass spectra of Groups 2, 3, and 4 other than Group 1 is poor, or if the quality of the partial integrated mass spectra of Groups 1 and 2 is good and the quality of the partial integrated mass spectra of Groups 3 and 4 is poor, the processor 32 determines that the laser power is stronger than the target value.
- the processor 32 executes the process of S74.
- the processor 32 determines whether the quality of the partial integrated mass spectrum of Group 4 is poor and the quality of all the partial integrated mass spectra of groups other than Group 4 is good. If it is determined that the quality of the partial integrated mass spectrum of Group 4 is poor and the quality of all the partial integrated mass spectra of groups other than Group 4 is good (YES in S74), the processor 32 executes the process of S83.
- processor 32 determines that the laser power is appropriate and that the partially integrated mass spectrum of Group 4 has deteriorated in quality due to the influence of the sweet spot, terminates processing of S107, and proceeds to processing of S108. In other words, if the quality of only the partially integrated mass spectrum of the group with the largest total ion quantity is poor, processor 32 determines that the quality of only a portion of the pre-integration spectrum has deteriorated due to the influence of the sweet spot, and that the laser power is appropriate.
- the processor 32 executes the process of S75.
- processor 32 determines whether the quality of any of the partial integrated mass spectra of Groups 2 to 4 is good. If it is determined that the quality of any of the partial integrated mass spectra of Groups 2 to 4 is good (YES in S75), processor 32 determines that the laser power is appropriate, terminates processing of S107, and proceeds to processing of S108. In other words, if the quality of all of the partial integrated mass spectra of Groups 1 to 4 is good, or if the quality of only the partial integrated mass spectrum of Group 1 is poor, processor 32 determines that the laser power is appropriate.
- the processor 32 determines in S85 that an individual judgment is required, terminates processing of S107, and proceeds to processing of S108.
- the requirement of an individual judgment means that the appropriateness of the laser power cannot be uniquely judged, and it is better for the user to interpret it.
- the processor 32 determines that an individual judgment is required when (1) the quality of the partial integrated mass spectrum of Groups 1 and 4 is good and the quality of at least one of the partial integrated mass spectra of Groups 2 and 3 is poor, (2) the quality of the partial integrated mass spectrum of Groups 1 and 4 is poor and the quality of at least one of the partial integrated mass spectra of Groups 2 and 3 is good, (3) the quality of the partial integrated mass spectrum of Groups 1 and 3 is good and the quality of the partial integrated mass spectrum of Groups 2 and 4 is poor, (4) the quality of the partial integrated mass spectrum of Group 1 is poor, the quality of the partial integrated mass spectrum of Group 4 is good and the quality of at least one of the partial integrated mass spectra of Groups 2 and 3 is good, or (5) the quality of the partial integrated mass spectrum of Group 4 is good and the quality of the partial integrated mass spectra of Groups 1 to 3 is poor.
- the processor 32 executes the process of S108.
- the processor 32 displays the judgment result of the appropriateness of the laser power obtained in S107 on the display device 38.
- the processor 32 may display information on the display device 38 as the judgment result, such as whether the laser power should be increased or decreased. If the processor 32 judges that an individual judgment is necessary in the processing of S107, the processor 32 may display information on the display device 38 indicating that the laser power should be judged with reference to each partially integrated mass spectrum.
- the processor 32 evaluates the quality of the partially integrated mass spectrum in S106, and then determines the appropriateness of the laser power in S107 based on the evaluation result obtained in S106.
- the processor 32 may also determine the appropriateness of the laser power based on features that indicate the quality of the mass spectrum, such as mass resolution and peak shift.
- the user adjusts the laser power based on the information displayed on the display device 38. This allows the user to set an appropriate laser power to obtain a good quality mass spectrum.
- the user can obtain a good quality mass spectrum by setting an appropriate laser power and performing mass analysis of the same sample as the sample used to adjust the laser power.
- the same sample as the sample used to adjust the laser power refers to a sample adjusted under the same conditions on one sample plate 11, and includes a sample in a well that has already been irradiated with a laser and a sample in a well that has not been irradiated with a laser. Furthermore, when evaluating the appropriateness of the adjusted laser power, the user only needs to perform mass analysis of the same sample as the sample used to evaluate the appropriateness of the laser power before adjustment.
- a processing device processes mass spectra acquired by a mass spectrometer equipped with an ionization section that ionizes a sample by laser desorption ionization and an analysis section that analyzes the ionized sample by ion trap mass spectrometry.
- the processing device includes a memory that stores multiple pre-accumulation mass spectra acquired by the mass spectrometer by measuring samples prepared under the same conditions in one or multiple wells multiple times, a processor that processes the multiple pre-accumulation mass spectra stored in the memory, and a display device.
- the processor divides the multiple pre-accumulation mass spectra into multiple groups according to the order of the total ion amount obtained by accumulating the intensity in a predetermined mass-to-charge ratio range, and for each of the multiple groups, accumulates the pre-accumulation mass spectra contained in that group to obtain a partial accumulated mass spectrum, and displays specific information corresponding to the partial accumulated mass spectrum obtained for each group on the display device.
- specific information is displayed as further information for evaluating the laser power in the ionization section, allowing the user to easily evaluate the appropriateness of the laser power and facilitating the process of adjusting the laser power.
- the processor displays at least a portion of the mass-to-charge ratio range of the partially integrated mass spectrum for each group on the display device as the specific information.
- the processing device described in paragraph 2 displays at least a portion of the mass-to-charge ratio range of the partial integrated mass spectrum, allowing the quality of the mass spectrum to be evaluated based on the shape of the partial integrated mass spectrum, and allowing the appropriateness of the laser power to be evaluated in more detail based on the evaluation results for each partial integrated mass spectrum.
- the processing device described in clause 2 further includes an input device that accepts user operations.
- the processor displays the partially integrated mass spectrum for the accepted mass-to-charge ratio range on the display device for each group.
- the display area of the display device of the processing device described in paragraph 3 is limited, by making it possible to display only the partial integrated mass spectrum of a certain range of mass-to-charge ratios, it is possible to easily display each partial integrated mass spectrum in a format that is easy to compare, and each partial integrated mass spectrum can be more easily compared.
- the memory stores reference information for the user to interpret whether the laser power of the ionization unit is appropriate based on the specific information.
- the processor displays the reference information on the display device.
- the processing device described in paragraph 4 allows the user to interpret the appropriateness of the laser power based on the specific information on the basis of the reference information, making it easier to evaluate the appropriateness of the laser power.
- the reference information includes a sample partial integrated mass spectrum for each group obtained by dividing a plurality of sample mass spectra into a plurality of groups according to the order of the total ion amount, and interpretation information indicating the result of interpreting whether the laser power of the ionization unit is appropriate based on the sample partial integrated mass spectrum for each group.
- the user can more easily evaluate the appropriateness of the laser power by comparing the sample partial integrated mass spectrum for each group with the partial integrated mass spectrum for each group displayed as specific information.
- the processor determines, for each partially integrated mass spectrum, a feature quantity indicating the quality of the mass spectrum from the partially integrated mass spectrum, and displays, on the display device, the feature quantity determined from the partially integrated mass spectrum in correspondence with each partially integrated mass spectrum.
- the feature quantity indicating the quality of the mass spectrum is displayed in correspondence with each partially accumulated mass spectrum, allowing the user to more easily evaluate the quality of each partially accumulated mass spectrum and more easily evaluate the appropriateness of the laser power.
- the characteristic quantity is mass resolution.
- the processor determines, for each partially integrated mass spectrum, a feature quantity indicating the quality of the mass spectrum from the partially integrated mass spectrum, determines whether or not the laser power in the ionization unit is appropriate based on the feature quantity determined from each partially integrated mass spectrum, and displays the determination result as to whether or not the laser power is appropriate on the display device as specific information.
- the user can adjust the laser power based on the displayed judgment result, making the laser power adjustment process easier.
- the processor evaluates the quality of each partial integrated mass spectrum based on the feature quantity obtained from each partial integrated mass spectrum, and if, based on the evaluation results of each partial integrated mass spectrum, the quality of the partial integrated mass spectrum of the first group having the smallest total ion amount is good and the quality of the partial integrated mass spectrum of the groups other than the first group is poor, it is determined that the laser power in the ionization section is stronger than the target value.
- the processor determines that the laser power in the ionization section is stronger than the target value if the maximum value of the signal intensity of the multiple partial integrated mass spectra is equal to or greater than a predetermined value.
- the processor determines that the laser power in the ionization section is weaker than the target value if the maximum value of the signal intensity of the multiple partial integrated mass spectra is less than a predetermined value.
- the processor determines, based on the feature quantities of each partial integrated mass spectrum, that the quality of the partial integrated mass spectrum of the second group, which has the largest total ion amount, is poor, and that the quality of the partial integrated mass spectra of groups other than the second group is good, the processor determines that the laser power in the ionization section is appropriate.
- a processing method is a method for processing a mass spectrum acquired by a mass spectrometer equipped with an ionization section that ionizes a sample by laser desorption ionization and an analysis section that analyzes the ionized sample by ion trap mass spectrometry.
- the processing method includes the steps of dividing a plurality of pre-accumulation mass spectra obtained by the mass spectrometer measuring a sample prepared under the same conditions in one or a plurality of wells multiple times into a plurality of groups according to the order of the total ion amount obtained by accumulating the intensity in a predetermined mass-to-charge ratio range, accumulating the pre-accumulation mass spectra included in each of the plurality of groups to obtain a partial accumulated mass spectrum, and displaying specific information corresponding to the partial accumulated mass spectrum obtained for each group on a display device.
- a program according to one embodiment is a program for causing a computer to execute the processing method described in Clause 14.
- a computer-readable medium stores the program described in Clause 15.
Landscapes
- Chemical & Material Sciences (AREA)
- Analytical Chemistry (AREA)
- Physics & Mathematics (AREA)
- Electrochemistry (AREA)
- Plasma & Fusion (AREA)
- Chemical Kinetics & Catalysis (AREA)
- Engineering & Computer Science (AREA)
- Health & Medical Sciences (AREA)
- Life Sciences & Earth Sciences (AREA)
- Biochemistry (AREA)
- General Health & Medical Sciences (AREA)
- General Physics & Mathematics (AREA)
- Immunology (AREA)
- Pathology (AREA)
- Other Investigation Or Analysis Of Materials By Electrical Means (AREA)
Priority Applications (1)
| Application Number | Priority Date | Filing Date | Title |
|---|---|---|---|
| JP2025532398A JPWO2025013403A1 (cg-RX-API-DMAC7.html) | 2023-07-07 | 2024-05-15 |
Applications Claiming Priority (2)
| Application Number | Priority Date | Filing Date | Title |
|---|---|---|---|
| JP2023112014 | 2023-07-07 | ||
| JP2023-112014 | 2023-07-07 |
Publications (1)
| Publication Number | Publication Date |
|---|---|
| WO2025013403A1 true WO2025013403A1 (ja) | 2025-01-16 |
Family
ID=94215325
Family Applications (1)
| Application Number | Title | Priority Date | Filing Date |
|---|---|---|---|
| PCT/JP2024/017902 Ceased WO2025013403A1 (ja) | 2023-07-07 | 2024-05-15 | 処理装置および処理方法 |
Country Status (2)
| Country | Link |
|---|---|
| JP (1) | JPWO2025013403A1 (cg-RX-API-DMAC7.html) |
| WO (1) | WO2025013403A1 (cg-RX-API-DMAC7.html) |
Citations (5)
| Publication number | Priority date | Publication date | Assignee | Title |
|---|---|---|---|---|
| JP2015516570A (ja) * | 2012-04-10 | 2015-06-11 | ビオスパーク・ベー・フェーBiosparq B.V. | スペクトルデータに基づいたサンプルの分類方法、データベースの作成方法及び該データベースの使用方法、並びに対応するコンピュータプログラム、データ記憶媒体及びシステム |
| WO2018173223A1 (ja) * | 2017-03-23 | 2018-09-27 | 株式会社島津製作所 | 質量分析装置及びクロマトグラフ質量分析装置 |
| JP2019132751A (ja) * | 2018-02-01 | 2019-08-08 | 日本電子株式会社 | マススペクトル処理装置及び方法 |
| JP2020077554A (ja) * | 2018-11-08 | 2020-05-21 | 株式会社島津製作所 | 質量分析装置、レーザ光強度調整方法およびレーザ光強度調整プログラム |
| WO2021215038A1 (ja) * | 2020-04-20 | 2021-10-28 | 株式会社島津製作所 | レーザー脱離イオン化質量分析装置及びレーザーパワー調整方法 |
-
2024
- 2024-05-15 JP JP2025532398A patent/JPWO2025013403A1/ja active Pending
- 2024-05-15 WO PCT/JP2024/017902 patent/WO2025013403A1/ja not_active Ceased
Patent Citations (5)
| Publication number | Priority date | Publication date | Assignee | Title |
|---|---|---|---|---|
| JP2015516570A (ja) * | 2012-04-10 | 2015-06-11 | ビオスパーク・ベー・フェーBiosparq B.V. | スペクトルデータに基づいたサンプルの分類方法、データベースの作成方法及び該データベースの使用方法、並びに対応するコンピュータプログラム、データ記憶媒体及びシステム |
| WO2018173223A1 (ja) * | 2017-03-23 | 2018-09-27 | 株式会社島津製作所 | 質量分析装置及びクロマトグラフ質量分析装置 |
| JP2019132751A (ja) * | 2018-02-01 | 2019-08-08 | 日本電子株式会社 | マススペクトル処理装置及び方法 |
| JP2020077554A (ja) * | 2018-11-08 | 2020-05-21 | 株式会社島津製作所 | 質量分析装置、レーザ光強度調整方法およびレーザ光強度調整プログラム |
| WO2021215038A1 (ja) * | 2020-04-20 | 2021-10-28 | 株式会社島津製作所 | レーザー脱離イオン化質量分析装置及びレーザーパワー調整方法 |
Also Published As
| Publication number | Publication date |
|---|---|
| JPWO2025013403A1 (cg-RX-API-DMAC7.html) | 2025-01-16 |
Similar Documents
| Publication | Publication Date | Title |
|---|---|---|
| US11107666B2 (en) | Systems and methods for using variable mass selection window widths in tandem mass spectrometry | |
| JP6737396B2 (ja) | 質量分析装置及びクロマトグラフ質量分析装置 | |
| US10600625B2 (en) | Method of calibrating a mass spectrometer | |
| US8030611B2 (en) | Mass spectrometer, method of mass spectrometry and program for mass spectrometry | |
| EP2850644B1 (en) | Modulation of instrument resolution dependant upon the complexity of a previous scan | |
| US10564135B2 (en) | Chromatograph mass spectrometer | |
| JP6702501B2 (ja) | タンデム型質量分析装置及び該装置用プログラム | |
| WO2025013403A1 (ja) | 処理装置および処理方法 | |
| JP5252205B2 (ja) | 質量欠損によりトリガされる情報依存収集 | |
| US20140306107A1 (en) | Methods for Predictive Automatic Gain Control for Hybrid Mass Spectrometers | |
| JP7070692B2 (ja) | 質量分析装置及び質量分析方法 | |
| WO2025062288A1 (en) | Methods and systems for performing data independent acquistion mass spectrometry | |
| WO2024223367A1 (en) | A method for predicting one or more sample metric values by machine learning | |
| JP4921302B2 (ja) | 質量分析システム | |
| US20250069875A1 (en) | Method for characterization of a mass spectrometry instrument comprising at least one mass analyzing cell | |
| JP7225743B2 (ja) | スペクトル演算処理装置、スペクトル演算処理方法、スペクトル演算処理プログラム、イオントラップ質量分析システムおよびイオントラップ質量分析方法 | |
| WO2024161624A1 (ja) | 質量分析方法及び質量分析装置 |
Legal Events
| Date | Code | Title | Description |
|---|---|---|---|
| 121 | Ep: the epo has been informed by wipo that ep was designated in this application |
Ref document number: 24839301 Country of ref document: EP Kind code of ref document: A1 |
|
| ENP | Entry into the national phase |
Ref document number: 2025532398 Country of ref document: JP Kind code of ref document: A |
|
| WWE | Wipo information: entry into national phase |
Ref document number: 2025532398 Country of ref document: JP |
|
| NENP | Non-entry into the national phase |
Ref country code: DE |