WO2025013258A1 - 人流データ補正装置、人流データ補正方法、及び人流データ補正プログラム - Google Patents
人流データ補正装置、人流データ補正方法、及び人流データ補正プログラム Download PDFInfo
- Publication number
- WO2025013258A1 WO2025013258A1 PCT/JP2023/025780 JP2023025780W WO2025013258A1 WO 2025013258 A1 WO2025013258 A1 WO 2025013258A1 JP 2023025780 W JP2023025780 W JP 2023025780W WO 2025013258 A1 WO2025013258 A1 WO 2025013258A1
- Authority
- WO
- WIPO (PCT)
- Prior art keywords
- people
- flow data
- people flow
- data
- time period
- Prior art date
- Legal status (The legal status is an assumption and is not a legal conclusion. Google has not performed a legal analysis and makes no representation as to the accuracy of the status listed.)
- Pending
Links
Images






Classifications
-
- G—PHYSICS
- G06—COMPUTING OR CALCULATING; COUNTING
- G06Q—INFORMATION AND COMMUNICATION TECHNOLOGY [ICT] SPECIALLY ADAPTED FOR ADMINISTRATIVE, COMMERCIAL, FINANCIAL, MANAGERIAL OR SUPERVISORY PURPOSES; SYSTEMS OR METHODS SPECIALLY ADAPTED FOR ADMINISTRATIVE, COMMERCIAL, FINANCIAL, MANAGERIAL OR SUPERVISORY PURPOSES, NOT OTHERWISE PROVIDED FOR
- G06Q10/00—Administration; Management
- G06Q10/04—Forecasting or optimisation specially adapted for administrative or management purposes, e.g. linear programming or "cutting stock problem"
-
- G—PHYSICS
- G06—COMPUTING OR CALCULATING; COUNTING
- G06Q—INFORMATION AND COMMUNICATION TECHNOLOGY [ICT] SPECIALLY ADAPTED FOR ADMINISTRATIVE, COMMERCIAL, FINANCIAL, MANAGERIAL OR SUPERVISORY PURPOSES; SYSTEMS OR METHODS SPECIALLY ADAPTED FOR ADMINISTRATIVE, COMMERCIAL, FINANCIAL, MANAGERIAL OR SUPERVISORY PURPOSES, NOT OTHERWISE PROVIDED FOR
- G06Q50/00—Information and communication technology [ICT] specially adapted for implementation of business processes of specific business sectors, e.g. utilities or tourism
- G06Q50/10—Services
Definitions
- the disclosed technology relates to a people flow data correction device, a people flow data correction method, and a people flow data correction program.
- Vieureka Co., Ltd. (Vieureka), https://www.vieureka.com/, 2023/4/10 Mobile Spatial Statistics, https://mobaku.jp/about/, 2023/4/6
- the disclosed technology has been developed in consideration of the above points, and aims to provide a people flow data correction device, a people flow data correction method, and a people flow data correction program that can obtain people flow data with fine temporal and spatial granularity and high reliability.
- a first aspect of the present disclosure is a people flow data correction device, comprising: a first acquisition unit that acquires first people flow data representing the flow of people in a predetermined first range; a second acquisition unit that acquires second people flow data representing the flow of people in a second range including at least a part of the first range, the second people flow data having at least one of a temporal granularity and a spatial granularity that is coarser than the first people flow data and has a higher statistical reliability than the first people flow data; and a correction unit that corrects the first people flow data using the second people flow data.
- a second aspect of the present disclosure is a people flow data correction method, in which a people flow data correction device acquires first people flow data representing the flow of people in a predetermined first range, acquires second people flow data representing the flow of people in a second range including at least a part of the first range, the second people flow data having at least one of a temporal granularity and a spatial granularity that is coarser than the first people flow data and has a higher statistical reliability than the first people flow data, and corrects the first people flow data using the second people flow data.
- a third aspect of the present disclosure is a people flow data correction program that causes a computer to execute a process of acquiring first people flow data representing the flow of people in a predetermined first range, acquiring second people flow data representing the flow of people in a second range including at least a part of the first range, the second people flow data having at least one of a temporal granularity and a spatial granularity that is coarser than the first people flow data and has a higher statistical reliability than the first people flow data, and correcting the first people flow data using the second people flow data.
- the disclosed technology has the advantage of being able to obtain people flow data with fine temporal and spatial granularity and high reliability.
- FIG. 2 is a block diagram showing an example of a hardware configuration of the people flow data correction device according to the first embodiment.
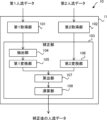
- FIG. 2 is a block diagram showing an example of a functional configuration of a people flow data correction device according to the first embodiment.
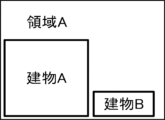
- FIG. FIG. 4 is a diagram illustrating an example of a first range and a second range according to the embodiment.
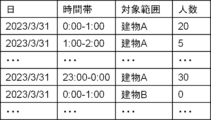
- FIG. 11 is a diagram showing an example of first people flow data according to the embodiment.
- FIG. 11 is a diagram showing an example of second people flow data according to the embodiment.
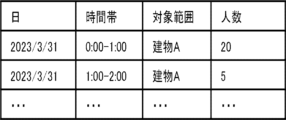
- FIG. 11 is a diagram illustrating an example of place people flow data according to the embodiment.
- FIG. 11 is a diagram showing an example of place people flow data converted into a first number of people according to the embodiment;
- FIG. 11 is a diagram showing an example of second people flow data converted into a second number of people according to the embodiment.
- FIG. 11 is a diagram illustrating an example of a correction coefficient according to the embodiment.
- FIG. 13 is a diagram illustrating an example of the number of people after correction according to the embodiment. 13 is a flowchart showing an example of a flow of people flow data correction processing by a people flow data correction program according to the first embodiment.
- 11 is a diagram conceptually showing each process of the people flow data correction process.
- FIG. FIG. 11 is a diagram showing an example of a time period for which second people flow data is to be deleted.
- FIG. 11 is a block diagram showing an example of a functional configuration of a people flow data correction device according to a second embodiment.
- FIG. 13 is a block diagram showing an example of a functional configuration of a people flow data correction device according to a third embodiment.
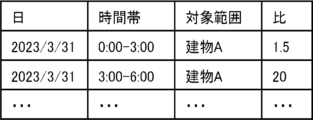
- FIG. 10 is a diagram showing an example of a ratio of corresponding data points of first people flow data and second
- the people flow data correction device provides certain improvements over conventional methods of acquiring people flow data, and represents an advancement in the technical field of acquiring people flow data.
- the people flow data correction device combines multiple people flow data acquired using different methods, and corrects people flow data that has fine temporal and spatial granularity but low reliability with people flow data that has coarse temporal and spatial granularity but high reliability.
- people flow data that has coarse temporal and spatial granularity and low reliability may be corrected with people flow data that has fine temporal and spatial granularity and high reliability. This makes it possible to obtain people flow data that has fine temporal and spatial granularity and is highly reliable.
- people flow data is data that indicates when and where people are present and how many people there are.
- FIG. 1 is a block diagram showing an example of a hardware configuration of a people flow data correction device 10 according to the first embodiment.
- the people flow data correction device 10 includes a CPU (Central Processing Unit) 11, a ROM (Read Only Memory) 12, a RAM (Random Access Memory) 13, a storage 14, an input unit 15, a display unit 16, and a communication interface (I/F) 17.
- a CPU Central Processing Unit
- ROM Read Only Memory
- RAM Random Access Memory
- storage 14 an input unit 15, a display unit 16, and a communication interface (I/F) 17.
- I/F communication interface
- the CPU 11 is a central processing unit that executes various programs and controls each part. That is, the CPU 11 reads out a program from the ROM 12 or storage 14, and executes the program using the RAM 13 as a working area. The CPU 11 controls each of the above components and performs various calculation processes according to the program stored in the ROM 12 or storage 14.
- the ROM 12 or storage 14 stores a people flow data correction program for correcting people flow data according to this embodiment. Note that instead of the CPU, for example, a GPU (Graphics Processing Unit) may be used.
- ROM 12 stores various programs and data.
- RAM 13 temporarily stores programs or data as a working area.
- Storage 14 is composed of a HDD (Hard Disk Drive) or SSD (Solid State Drive) and stores various programs including the operating system and various data.
- the input unit 15 includes a pointing device such as a mouse and a keyboard, and is used to perform various inputs to the device itself.
- the display unit 16 is, for example, a liquid crystal display, and displays various information.
- the display unit 16 may also function as the input unit 15 by adopting a touch panel system.
- the communication interface 17 is, for example, an interface for communicating with other external devices.
- a wired communication standard such as Ethernet (registered trademark) or FDDI (Fiber Distributed Data Interface)
- a wireless communication standard such as 4G, 5G, or Wi-Fi (registered trademark) is used.
- the people flow data correction device 10 is implemented using a general-purpose computer device such as a server computer or a personal computer (PC).
- a general-purpose computer device such as a server computer or a personal computer (PC).
- FIG. 2 is a block diagram showing an example of the functional configuration of the people flow data correction device 10 according to the first embodiment.
- the people flow data correction device 10 has, as its functional components, a first acquisition unit 101, a second acquisition unit 102, and a correction unit 103.
- Each functional component is realized by the CPU 11 reading out a people flow data correction program stored in the ROM 12 or storage 14, expanding it in the RAM 13, and executing it.
- the first acquisition unit 101 acquires first people flow data from the storage 14 or from an external source.
- the first people flow data is people flow data that represents the flow of people in a predetermined first range.
- the first range is, for example, one or more locations.
- the “location” here is shown as, for example, one or more buildings. Note that the "location” is not limited to a building, and may be any location that is the subject of people flow acquisition.
- the second acquisition unit 102 acquires second people flow data from the storage 14 or from outside.
- the second people flow data is people flow data that represents the flow of people in a second range that includes at least a part of the first range.
- the second people flow data for example, has at least one of the temporal granularity and spatial granularity of the data that is coarser than the first people flow data, and has higher statistical reliability than the first people flow data.
- both the temporal granularity and the spatial granularity may be coarse, or one of them may be coarse and the other the same.
- the second range is, for example, an area that includes multiple locations that are the first range.
- the "area" here is shown as an example as an area that includes multiple buildings.
- the correction unit 103 corrects the first people flow data acquired by the first acquisition unit 101 using the second people flow data acquired by the second acquisition unit 102.
- the correction unit 103 includes an extraction unit 104, a first conversion unit 105, a second conversion unit 106, a calculation unit 107, and an operation unit 108.
- the extraction unit 104 extracts, from the first people flow data, location people flow data that represents the number of people for each time period for a first location that is a location included in the multiple locations.
- the first conversion unit 105 converts the number of people for each time period in the place people flow data into a first number of people, which is the number of people for a time period that is coarser than the granularity of the time period in the second people flow data.
- the second conversion unit 106 converts the number of people for each time period in the second people flow data into a second number of people, which is the number of people at the first location.
- the second conversion unit 106 may convert the number of people for each time period in the second people flow data into the second number of people by multiplying the number of people for each time period in the second people flow data by a conversion coefficient (described later) corresponding to at least one of the day of the week, public holiday, temperature, and weather. This makes it possible to obtain more reliable second people flow data.
- the second conversion unit 106 may also delete data for a predetermined time period (e.g., late night hours) from the second people flow data or replace the corresponding number of people with 0 before converting the number of people for each time period in the second people flow data into the second number of people.
- a predetermined time period e.g., late night hours
- the data for the predetermined time period may also be deleted from the first people flow data, or the data for the predetermined time period (e.g., late night hours) may only be deleted from the first people flow data. This makes it possible to obtain more reliable second people flow data and first people flow data, for example, when it is known in advance that there will be false detections during times when no people should be present.
- the calculation unit 107 calculates a correction coefficient for each time period from the first number of people and the second number of people.
- the correction coefficient may be calculated taking into account the influence of the day of the week, public holidays, temperature, and weather.
- the calculation unit 108 calculates the corrected number of people for the first people flow data by multiplying the number of people for each time period in the place people flow data by the correction coefficient for the corresponding time period.
- FIG. 3 is a diagram showing a schematic example of a first range and a second range according to this embodiment. Buildings A and B are an example of the first range, and area A including buildings A and B is an example of the second range.
- FIG. 4A is a diagram showing an example of first people flow data according to this embodiment.
- the first people flow data is people flow data for buildings A and B, and is people flow data for multiple locations every hour.
- the first people flow data is an example of data that has fine temporal and spatial granularity but low reliability.
- FIG. 4B is a diagram showing an example of second people flow data according to this embodiment.
- the second people flow data is people flow data for area A, and is people flow data for one area every three hours.
- the second people flow data is an example of data that has coarser temporal and spatial granularity but is highly reliable compared to the first people flow data.
- the first people flow data shown in FIG. 4A is statistically unreliable data
- the second people flow data shown in FIG. 4B is statistically reliable data.
- FIG. 5A is a diagram showing an example of place people flow data according to this embodiment. That is, the extraction unit 104 extracts place people flow data representing the number of people for each time period for building A, which is an example of the first place, from the first people flow data shown in FIG. 4A.
- the first conversion unit 105 converts the number of people for each time period in the place people flow data shown in FIG. 5A into the first number of people, which is the number of people for a time period with a granularity equal to or larger than that of the time period of the second people flow data shown in FIG. 4B.
- the first number of people e.g., "30", "10", ...) for every three hours of the second people flow data shown in FIG. 4B is calculated from the number of people in the place people flow data for every hour shown in FIG. 5A. Specifically, the number of people in the place people flow data shown in FIG. 5A is added every three hours.
- the number of people for "0:00-1:00”, the number of people for "1:00-2:00”, and the number of people for "2:00-3:00" shown in FIG. 5A is added to obtain the first number of people ("30") for "0:00-3:00" shown in FIG. 5B.
- the first number of people is the total value for every three hours, but it may be the average value for every three hours.
- 5C is a diagram showing an example of the second people flow data converted into the second number of people according to this embodiment. That is, the second conversion unit 106 converts the number of people for each time period in the second people flow data shown in FIG. 4B into the second number of people, which is the number of people at the first location (e.g., building A) in the first people flow data.
- the second number of people e.g., "36", "11", ...) for each time period for building A is calculated from the second people flow data shown in FIG. 4B.
- the second number of people in building A is calculated according to the ratio between the area of area A and the area of building A.
- the second number of people in building A may be calculated by multiplying the number of people in area A by a conversion coefficient according to at least one of the day of the week, public holiday, temperature, and weather.
- the conversion coefficient for example, the ratio of people in area A and building A may be obtained by analyzing in advance according to at least one of the day of the week, public holiday, temperature, and weather, and this number of people ratio may be used.
- the calculation unit 107 calculates the correction coefficient for each time period from the first number of people and the second number of people. Specifically, for example, the correction coefficient is calculated by dividing the second number of people in the second people flow data shown in FIG. 5C by the first number of people in the same time period in the place people flow data shown in FIG. 5B. If the second number of people in FIG. 5C is "36" and the first number of people in FIG. 5B is "30", the correction coefficient in FIG. 5D is "1.2". If the second number of people in FIG. 5C is "11" and the first number of people in FIG. 5B is "10", the correction coefficient in FIG. 5D is "1.1". Note that, here, as an example, the day information is omitted, but if it is desired to take into account small fluctuations, correction may be performed without omitting the day information. In this case, the correction coefficient may be calculated for the day and the time period.
- FIG. 5E is a diagram showing an example of the corrected number of people according to this embodiment. That is, the calculation unit 108 calculates the corrected number of people for the first people flow data by multiplying the number of people for each time period in the place people flow data shown in FIG. 5A by the correction coefficient for the corresponding time period among the correction coefficients shown in FIG. 5D. For example, the same correction coefficient is used for all three-hour time intervals, and each of the data for each hour in FIG. 5A is multiplied by the corresponding correction coefficient. For example, the number of people for each of the time periods "0:00-1:00", “1:00-2:00", and "2:00-3:00" in FIG. 5A is multiplied by the correction coefficient for the corresponding time period "0:00-3:00" (here, "1.2") among the correction coefficients shown in FIG. 5D. As a result, the corrected number of people shown in FIG. 5E is obtained.
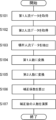
- FIG. 6 is a flowchart showing an example of the flow of the people flow data correction process by the people flow data correction program according to the first embodiment.
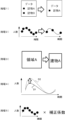
- FIG. 7 is a diagram conceptually showing each step 1 to 5 of the people flow data correction process.
- the people flow data correction process by the people flow data correction program is realized by the CPU 11 of the people flow data correction device 10 writing the people flow data correction program stored in the ROM 12 or storage 14 to the RAM 13 and executing it.
- step S101 of FIG. 6 the CPU 11 acquires the first people flow data shown in FIG. 4A above, as an example.
- step S102 the CPU 11 acquires, as an example, the second people flow data shown in FIG. 4B above.
- step S103 the CPU 11 extracts, from the first people flow data acquired in step S101, location people flow data that indicates the number of people for each time period for building A, which is an example of the first location, as shown in (Process 1) of FIG. 7 as an example.
- An example of the extracted location people flow data is shown in FIG. 5A above.
- step S104 the CPU 11 converts the number of people for each time period (e.g., every hour) of the location people flow data extracted in step S103 into a first number of people, which is the number of people for each time period (e.g., every three hours) of the second people flow data acquired in step S102, as shown in (Process 2) of FIG. 7 as an example.
- a first number of people which is the number of people for each time period (e.g., every three hours) of the second people flow data acquired in step S102, as shown in (Process 2) of FIG. 7 as an example.
- An example of the second people flow data converted into the first number of people is shown in FIG. 5B above.
- step S105 the CPU 11 converts the number of people for each time period (e.g., every three hours) of the second people flow data acquired in step S102 into a second number of people, which is the number of people in the first location (e.g., building A), as shown in FIG. 7 (Process 3) as an example.
- a second number of people which is the number of people in the first location (e.g., building A), as shown in FIG. 7 (Process 3) as an example.
- FIG. 5C An example of the second people flow data converted into the second number of people is shown in FIG. 5C above.
- step S106 the CPU 11 calculates a correction coefficient for each time period (e.g., every 3 hours) from the first number of people (data D1) converted in step S104 and the second number of people (data D2) converted in step S105, as shown in FIG. 7 (Process 4).
- a correction coefficient for each time period e.g., every 3 hours
- FIG. 7 An example of the calculated correction coefficient is shown in FIG. 5D above.
- step S107 the CPU 11 calculates the corrected number of people for the first people flow data by multiplying the number of people for each time period (e.g., each hour) of the location people flow data extracted in step S103 by the correction coefficient for the corresponding time period, as shown in (Process 5) of FIG. 7, for example, and ends the series of processes by the person flow data correction program.
- the second number of people in building A may be calculated by multiplying the number of people in area A by a conversion coefficient (e.g., a preset ratio of the number of people) corresponding to at least one of the day of the week, public holiday, temperature, and weather. This makes it possible to obtain even more reliable people flow data.
- a conversion coefficient e.g., a preset ratio of the number of people
- the number of people flow data used is not limited to two, but may be three or more.
- the corrected people flow data obtained using two people flow data may be further corrected using the third people flow data. This makes it possible to obtain even more reliable people flow data.
- second people flow data For the people flow data to be corrected (second people flow data), for example, it is assumed that data that is spatially coarse is used. If there is reliable people flow data for area A that is temporally coarse but spatially finer than the second people flow data, the scale of the people flow data to be corrected can be adjusted based on the ratio of the number of people in an area as close as possible to building A in that flow data to the number of people in area A, and the adjusted data can be used to correct the first people flow data. When adjusting the scale, the effects of the day of the week, holidays, temperature, and weather may also be taken into account.
- a modified example of the first embodiment will be described. For example, suppose that building C is located within or outside area A shown in FIG. 3 above. Assume that the people flow data for building C is included in the data in FIG. 4A or similar data has been obtained separately, and the reliability of the people flow data is low. In this case, consider correcting the people flow data for building C. If buildings A and C are close to each other and the people flows per day can be considered to be similar, the people flow data for building C can be corrected using the correction coefficient shown in FIG. 5D above, which is calculated for building A. In other words, correction can also be performed for building C for which multiple people flow data have not been obtained. Note that in this modified example, buildings A and C are close to each other, but this can be applied to any buildings that are expected to show a similar trend, such as those that house many offices.
- the number of people is calculated using a device that can obtain location information, such as a mobile phone, and the case where the number of people is calculated using a camera.
- location information such as a mobile phone
- the number of people calculated using a camera will be less reliable due to overlapping people, etc.
- the number of people calculated using a device is more reliable, and the number of people calculated using a camera is less reliable.
- the number of people calculated using a device can be used to correct the number of people calculated using a camera.
- the data may still be unreliable. For example, if one person has multiple devices, or if there are people such as small children who do not have any devices, it is not appropriate to consider the number of devices as the number of people. In such cases, the number of people calculated using a camera may be more accurate. In such a situation, it is possible to use the number of people calculated using a camera to correct the number of people calculated using a device. If the area covered by the number of people calculated using a device is spatially wider than the area covered by the number of people calculated using a camera, the spatially narrow data will be used to correct the spatially wider data. In this example, the first people flow data, which has a relatively fine spatial granularity and high reliability, is used to correct the second people flow data, which has a relatively coarse spatial granularity and low reliability.
- a process is performed to align the spatial range of the data, as in the case of correcting the first people flow data with the second people flow data described above. That is, in the example used here, a process is performed to align the spatially narrow data to a spatially wide data range.
- the extraction unit 104 extracts place people flow data representing the number of people for each time period for building A from the first people flow data.
- the first conversion unit 105 converts the number of people for each time period in the place people flow data to a first number of people, which is the number of people for a time period that is finer than the granularity of the time period of the second people flow data.
- the first number of people for each time period is converted to a second number of people, which is the number of people in area A.
- the second conversion unit 106 performs a process to change the granularity of the second people flow data to match the granularity of the first number of people, and if the granularity matches, passes the second people flow data as is to the calculation unit 107.
- the calculation unit 107 calculates a correction coefficient for each time period from the second people flow data and the second number of people.
- the calculation unit 108 calculates the corrected number of people for the second people flow data by multiplying the number of people for each time period in the second people flow data by the correction coefficient for the corresponding time period. Note that if there is people flow data that is spatially finer and more reliable than the first people flow data (place people flow data), the other people flow data may be used. In other words, the ratio of the number of people in the spatially narrow data range and the spatially wide data range is calculated, and the ratio is multiplied by the first people flow data, which is spatially narrow data, or the place people flow data, or the first number of people.
- Another correction method would be to obtain in advance the percentage of people who own multiple devices or who do not own any devices, and use that percentage to correct the number of people using devices. This percentage could be set to reflect, for example, the expectation that in areas with many businesses there are more people who own multiple devices, or that in residential areas where there are likely to be many small children, the percentage of people who do not own a device is higher. Another possible method would be to obtain in advance or estimate the percentage of telecommunications carriers for people who own multiple devices and use that for correction.
- the data in Figure 4A which contains data on multiple buildings, for explanation, but the data does not have to contain multiple buildings. In that case, there is no need to extract data on the building to be corrected, such as extracting data on building A.
- the data in Figure 4B may contain people flow data for other areas. In that case, a process may be performed to extract people flow data for area A.
- the time granularity to the coarser one is hourly data and the second people flow data is every three hours, data for every six hours can be created from both data or data derived from either of them to obtain a correction coefficient.
- the correction coefficient can be obtained only from the data for the period for which both data are available, or the correction coefficient can be obtained without matching the periods by using the average number of people for each day of the week and time period. Even if the data to be corrected is longer-term data, as long as a correction coefficient that can be applied even if the periods are different, such as a correction coefficient for each time period, is obtained, correction can be applied to any period of the data to be corrected.
- both the first people flow data and the second people flow data are past data, and a form in which the past first people flow data is corrected is described.
- a form in which the current first people flow data acquired in real time is corrected is described.
- FIG. 9 is a block diagram showing an example of the functional configuration of a people flow data correction device 10A according to the second embodiment.
- the correction unit 103 of the people flow data correction device 10A includes an extraction unit 104 and a calculation unit 108.
- the correction coefficients calculated by the people flow data correction device 10 according to the first embodiment are stored in the storage 14 and can be referenced by the correction unit 103.
- the correction unit 103 receives the current first people flow data and the correction coefficient acquired in real time.
- the extraction unit 104 extracts location people flow data for building A, which is an example of a first location, from the input first people flow data.
- the calculation unit 108 multiplies the number of people for each time period (or other conditions such as each day of the week) of the location people flow data extracted by the extraction unit 104 by the correction coefficient for the corresponding time period to calculate the corrected number of people for the first people flow data.
- the correction coefficient to be used for correction is determined based on the current date and time of the first people flow data, and the current first people flow data can be corrected using the determined correction coefficient. For example, if the current timing is when data was acquired for "0:00-1:00” on “3/31/2023", the correction coefficient "1.2" for the time period "0:00-3:00" shown in FIG. 5D above can be used for correction.
- FIG. 10 is a block diagram showing an example of the functional configuration of a people flow data correction device 10B according to the third embodiment.
- the correction unit 103 of the people flow data correction device 10B includes an extraction unit 104, a first conversion unit 105, a second conversion unit 106, a calculation unit 107, an operation unit 108, and a detection unit 109.
- the detection unit 109 detects, as inappropriate data, the first people flow data in which the ratio between the first number of people obtained by conversion by the first conversion unit 105 and the second number of people obtained by conversion by the second conversion unit 106 is outside a predetermined range.
- the calculation unit 108 replaces the first number of people in the location people flow data obtained by conversion by the first conversion unit 105 with the second number of people in the second people flow data for the corresponding time period for the inappropriate data detected by the detection unit 109.
- the data in Figures 5B and 5C are obtained by aligning the temporal and spatial granularity of the first and second people flow data, respectively. Then, as shown in Figure 11, a ratio is calculated for each corresponding data point in the obtained Figures 5B and 5C.
- FIG. 11 is a diagram showing an example of the ratio of corresponding data points of the first people flow data and the second people flow data according to this embodiment. If the ratio calculated in FIG. 11 is outside a predetermined range (i.e., a range determined by an upper limit value and a lower limit value), the data is detected as being inappropriate.
- a predetermined range i.e., a range determined by an upper limit value and a lower limit value
- the data in FIG. 5C is used instead, and for non-inappropriate data, correction is performed using the correction coefficient calculated by the calculation unit 107, or correction is not required even by calculation.
- the upper limit value for the ratio obtained in FIG. 11 is set to "10”
- data with a ratio of "20" in FIG. 11 is detected as inappropriate data.
- the number of people in the data corresponding to the data with the ratio "20" among the data in FIG. 5B described above is replaced with the corresponding data in FIG. 5C (same day, same time period, same target range).
- the data in FIG. 5A e.g., data for every hour
- FIG. 5B e.g., data for every three hours.
- a method of allocating the replaced number of people in FIG. 5B in the ratio of the original number of people in FIG. 5A is conceivable.
- the inappropriate data can be detected and corrected to appropriate data.
- the people flow data correction process executed by the CPU by reading the program may be executed by various processors other than the CPU.
- processors in this case include PLDs (Programmable Logic Devices) such as FPGAs (Field-Programmable Gate Arrays) whose circuit configuration can be changed after manufacture, and dedicated electrical circuits such as ASICs (Application Specific Integrated Circuits), which are processors with circuit configurations designed specifically to execute specific processes.
- the people flow data correction process may be executed by one of these various processors, or by a combination of two or more processors of the same or different types (e.g., multiple FPGAs, and a combination of a CPU and an FPGA).
- the hardware structure of these various processors is, more specifically, an electrical circuit that combines circuit elements such as semiconductor elements.
- the people flow data correction program is described as being pre-stored (also called “installed") in ROM or storage, but this is not limiting.
- the people flow data correction program may be provided in a form stored in a non-transitory storage medium such as a CD-ROM (Compact Disk Read Only Memory), a DVD-ROM (Digital Versatile Disk Read Only Memory), or a USB (Universal Serial Bus) memory.
- the people flow data correction program may also be downloaded from an external device via a network.
- Memory at least one processor coupled to the memory; Including, The processor, Acquire first people flow data representing a flow of people in a predetermined first range; Acquire second people flow data representing a flow of people in a second range including at least a part of the first range, the second people flow data having at least one of a temporal granularity and a spatial granularity that is coarser than the first people flow data and a statistical reliability of the data being higher than that of the first people flow data; A people flow data correction device that corrects the first people flow data using the second people flow data.
- a non-transitory storage medium storing a program executable by a computer to execute a people flow data correction process
- the people flow data correction process includes: Acquire first people flow data representing a flow of people in a predetermined first range; Acquire second people flow data representing a flow of people in a second range including at least a part of the first range, the second people flow data having at least one of a temporal granularity and a spatial granularity that is coarser than the first people flow data and a statistical reliability of the data being higher than that of the first people flow data; Correcting the first people flow data with the second people flow data.
Landscapes
- Business, Economics & Management (AREA)
- Engineering & Computer Science (AREA)
- Strategic Management (AREA)
- Economics (AREA)
- Tourism & Hospitality (AREA)
- Human Resources & Organizations (AREA)
- Theoretical Computer Science (AREA)
- Physics & Mathematics (AREA)
- Marketing (AREA)
- General Physics & Mathematics (AREA)
- General Business, Economics & Management (AREA)
- Quality & Reliability (AREA)
- Game Theory and Decision Science (AREA)
- Entrepreneurship & Innovation (AREA)
- Operations Research (AREA)
- Development Economics (AREA)
- Health & Medical Sciences (AREA)
- General Health & Medical Sciences (AREA)
- Primary Health Care (AREA)
- Management, Administration, Business Operations System, And Electronic Commerce (AREA)
Abstract
人流データ補正装置は、予め定めた第1範囲における人の流れを表す第1人流データを取得する第1取得部と、第1範囲の少なくとも一部を含む第2範囲における人の流れを表す第2人流データであって、データの時間的粒度及び空間的粒度の少なくとも一方が前記第1人流データよりも粗く、かつ、データの統計的な信頼性が第1人流データよりも高い第2人流データを取得する第2取得部と、第1人流データを、第2人流データを用いて補正する補正部と、を備える。
Description
開示の技術は、人流データ補正装置、人流データ補正方法、及び人流データ補正プログラムに関する。
従来、人流データを取得する方法として、例えば、人流を測定可能なカメラを用いる方法(例えば、非特許文献1参照)、携帯端末の位置を利用する方法(例えば、非特許文献2参照)等が知られている。
Vieureka株式会社(ビューレカ), https://www.vieureka.com/, 2023/4/10
モバイル空間統計, https://mobaku.jp/about/, 2023/4/6
カメラを利用して人流を測定する場合、人流を求めたいある領域の全ての出入り口にカメラを設置するのはコストがかかると考えられる。このため、一部の出入り口にのみカメラを設置する場合がある。しかしながら、全ての出入り口にカメラを設置しないと正しく人流を求めることができない可能性が高く、信頼性の低いデータとなる場合がある。
開示の技術は、上記の点に鑑みてなされたものであり、データの時間的粒度及び空間的粒度が細かく信頼性も高い人流データを得ることができる人流データ補正装置、人流データ補正方法、及び人流データ補正プログラムを提供することを目的とする。
本開示の第1態様は、人流データ補正装置であって、予め定めた第1範囲における人の流れを表す第1人流データを取得する第1取得部と、前記第1範囲の少なくとも一部を含む第2範囲における人の流れを表す第2人流データであって、データの時間的粒度及び空間的粒度の少なくとも一方が前記第1人流データよりも粗く、かつ、データの統計的な信頼性が前記第1人流データよりも高い前記第2人流データを取得する第2取得部と、前記第1人流データを、前記第2人流データを用いて補正する補正部と、を備える。
本開示の第2態様は、人流データ補正方法であって、人流データ補正装置が、予め定めた第1範囲における人の流れを表す第1人流データを取得し、前記第1範囲の少なくとも一部を含む第2範囲における人の流れを表す第2人流データであって、データの時間的粒度及び空間的粒度の少なくとも一方が前記第1人流データよりも粗く、かつ、データの統計的な信頼性が前記第1人流データよりも高い前記第2人流データを取得し、前記第1人流データを、前記第2人流データを用いて補正する。
本開示の第3態様は、人流データ補正プログラムであって、予め定めた第1範囲における人の流れを表す第1人流データを取得し、前記第1範囲の少なくとも一部を含む第2範囲における人の流れを表す第2人流データであって、データの時間的粒度及び空間的粒度の少なくとも一方が前記第1人流データよりも粗く、かつ、データの統計的な信頼性が前記第1人流データよりも高い前記第2人流データを取得し、前記第1人流データを、前記第2人流データを用いて補正する処理を、コンピュータに実行させる。
開示の技術によれば、データの時間的粒度及び空間的粒度が細かく信頼性も高い人流データを得ることができる、という効果を有する。
以下、開示の技術の実施形態の一例を、図面を参照しつつ説明する。なお、各図面において、同一又は等価な構成要素及び部分には同一の参照符号を付与している。また、図面の寸法比率は、説明の都合上誇張されており、実際の比率とは異なる場合がある。
本実施形態に係る人流データ補正装置は、人流データを取得する従来の手法に対して特定の改善を提供するものであり、人流データを取得する技術分野の向上を示すものである。
本実施形態に係る人流データ補正装置は、人流データの取得方法が異なる複数の人流データを組み合わせ、データの時間的粒度及び空間的粒度は細かいが信頼性は低い人流データを、データの時間的粒度及び空間的粒度は粗いが信頼性は高い人流データで補正する。あるいは、データの時間的粒度及び空間的粒度は粗く信頼性は低い人流データを、データの時間的粒度及び空間的粒度は細かく信頼性は高い人流データで補正してもよい。これにより、データの時間的粒度及び空間的粒度が細かく信頼性も高い人流データを得ることができる。なお、人流データとは、人がいつどこに何人いるのかを示すデータである。
[第1の実施形態]
図1は、第1の実施形態に係る人流データ補正装置10のハードウェア構成の一例を示すブロック図である。
図1は、第1の実施形態に係る人流データ補正装置10のハードウェア構成の一例を示すブロック図である。
図1に示すように、人流データ補正装置10は、CPU(Central Processing Unit)11、ROM(Read Only Memory)12、RAM(Random Access Memory)13、ストレージ14、入力部15、表示部16、及び通信インタフェース(I/F)17を備えている。各構成は、バス18を介して相互に通信可能に接続されている。
CPU11は、中央演算処理ユニットであり、各種プログラムを実行したり、各部を制御したりする。すなわち、CPU11は、ROM12又はストレージ14からプログラムを読み出し、RAM13を作業領域としてプログラムを実行する。CPU11は、ROM12又はストレージ14に記憶されているプログラムに従って、上記各構成の制御及び各種の演算処理を行う。ROM12又はストレージ14には、本実施形態に係る人流データを補正するための人流データ補正プログラムが格納されている。なお、CPUに代えて、例えば、GPU(Graphics Processing Unit)を用いるようにしてもよい。
ROM12は、各種プログラム及び各種データを格納する。RAM13は、作業領域として一時的にプログラム又はデータを記憶する。ストレージ14は、HDD(Hard Disk Drive)又はSSD(Solid State Drive)により構成され、オペレーティングシステムを含む各種プログラム、及び各種データを格納する。
入力部15は、マウス等のポインティングデバイス、及びキーボードを含み、自装置に対して各種の入力を行うために使用される。
表示部16は、例えば、液晶ディスプレイであり、各種の情報を表示する。表示部16は、タッチパネル方式を採用して、入力部15として機能しても良い。
通信インタフェース17は、例えば、他の外部機器と通信するためのインタフェースである。当該通信には、例えば、イーサネット(登録商標)若しくはFDDI(Fiber Distributed Data Interface)等の有線通信の規格、又は、4G、5G、若しくはWi-Fi(登録商標)等の無線通信の規格が用いられる。
本実施形態に係る人流データ補正装置10には、例えば、サーバコンピュータ、パーソナルコンピュータ(PC)等の汎用的なコンピュータ装置が適用される。
次に、図2を参照して、人流データ補正装置10の機能構成について説明する。
図2は、第1の実施形態に係る人流データ補正装置10の機能構成の一例を示すブロック図である。
本実施形態に係る人流データ補正装置10は、機能構成として、第1取得部101、第2取得部102、及び補正部103を備えている。各機能構成は、CPU11がROM12又はストレージ14に記憶された人流データ補正プログラムを読み出し、RAM13に展開して実行することにより実現される。
第1取得部101は、ストレージ14又は外部から第1人流データを取得する。第1人流データは、予め定めた第1範囲における人の流れを表す人流データである。第1範囲は、例えば、1箇所以上の場所である。ここでいう「場所」は、一例として、1棟以上の建物として示される。なお、「場所」は、建物に限定されるものではなく、人流の取得対象とされる場所であればよい。
第2取得部102は、ストレージ14又は外部から第2人流データを取得する。第2人流データは、第1範囲の少なくとも一部を含む第2範囲における人の流れを表す人流データである。第2人流データは、例えば、データの時間的粒度及び空間的粒度の少なくとも一方が第1人流データよりも粗く、かつ、データの統計的な信頼性が第1人流データよりも高い。例えば、時間的粒度及び空間的粒度の両方が粗くてもよいし、何れか一方が粗く他方が同じであってもよい。第2範囲は、例えば、第1範囲である複数の場所を含む領域である。ここでいう「領域」は、一例として、複数の建物を含む領域として示される。
補正部103は、第1取得部101により取得された第1人流データを、第2取得部102により取得された第2人流データを用いて補正する。具体的には、補正部103は、抽出部104、第1変換部105、第2変換部106、算出部107、及び演算部108を含む。
抽出部104は、第1人流データから複数の場所に含まれる場所である第1場所についての時間帯毎の人数を表す場所人流データを抽出する。
第1変換部105は、場所人流データの時間帯毎の人数を、第2人流データが持つ時間帯の粒度以上の粗さの時間帯での人数である第1人数に変換する。
第2変換部106は、第2人流データの時間帯毎の人数を、第1場所での人数である第2人数に変換する。また、第2変換部106は、第2人流データの時間帯毎の人数に対して、曜日、祝日、気温、及び天候の少なくとも1つに応じた変換係数(後述)を乗じることにより、第2人数に変換してもよい。これにより、更に信頼性の高い第2人流データを得ることができる。また、第2変換部106は、第2人流データの時間帯毎の人数を第2人数に変換する前に、第2人流データから予め定めた時間帯(例えば、深夜帯)のデータを削除したり、対応する人数を0に置き換えたりしてもよい。このとき、第1人流データについても予め定めた時間帯(例えば、深夜帯)のデータを削除してもよいし、第1人流データのみ予め定めた時間帯(例えば、深夜帯)のデータを削除してもよい。これにより、本来は人がいないはずの時間帯において誤検出があることが予め分かっている場合等に、更に信頼性の高い第2人流データや第1人流データを得ることができる。
算出部107は、第1人数及び第2人数から時間帯毎の補正係数を算出する。なお、曜日や、祝日、気温、天気の影響を考慮して補正係数を求めても良い。
演算部108は、場所人流データの時間帯毎の人数に対して、対応する時間帯の補正係数を乗じることにより、第1人流データについての補正後の人数を演算する。
次に、図3、図4A、図4B,図5A~図5Eを参照して、本実施形態に係る人流データ補正処理について具体的に説明する。
図3は、本実施形態に係る第1範囲及び第2範囲の一例を模式的に示す図である。建物A及び建物Bは、第1範囲の一例であり、建物A及び建物Bを含む領域Aは、第2範囲の一例である。
図4Aは、本実施形態に係る第1人流データの一例を示す図である。第1人流データは、一例として、建物A及び建物Bの人流データであり、1時間毎で複数の場所についての人流データである。第1人流データは、データの時間的粒度及び空間的粒度は細かいが信頼性は低いデータの一例である。
図4Bは、本実施形態に係る第2人流データの一例を示す図である。第2人流データは、領域Aの人流データであり、3時間毎で1つの領域についての人流データである。第2人流データは、第1人流データと比較して、データの時間的粒度及び空間的粒度は粗いが信頼性は高いデータの一例である。
つまり、図4Aに示す第1人流データは統計的に信頼性の低いデータであり、図4Bに示す第2人流データは統計的に信頼性の高いデータである。このとき、建物Aについての信頼性の高い人流データを得たい場合について考える。そこで、図4Aに示す建物A及び建物Bの第1人流データのうち建物Aの人流データに対して、図4Bに示す領域Aの第2人流データを用いて補正を行う。
図5Aは、本実施形態に係る場所人流データの一例を示す図である。つまり、抽出部104は、図4Aに示す第1人流データから第1場所の一例である建物Aについての時間帯毎の人数を表す場所人流データを抽出する。
図5Bは、本実施形態に係る第1人数に変換された場所人流データの一例を示す図である。つまり、第1変換部105は、図5Aに示す場所人流データの時間帯毎の人数を、図4Bに示す第2人流データが持つ時間帯の粒度以上の粗さの時間帯での人数である第1人数に変換する。ここでは、図5Aに示す1時間毎の場所人流データの人数から、図4Bに示す第2人流データの3時間毎での第1人数(例えば、「30」、「10」、・・・)を算出する。具体的には、図5Aに示す場所人流データの人数を3時間毎に加算する。例えば、図5Aに示す「0:00-1:00」の人数と、「1:00-2:00」の人数と、「2:00-3:00」の人数とを加算して、図5Bに示す「0:00-3:00」の第1人数(「30」)を得る。なお、ここでは、第1人数を3時間毎の合計値としたが、3時間毎の平均値としてもよい。
図5Cは、本実施形態に係る第2人数に変換された第2人流データの一例を示す図である。つまり、第2変換部106は、図4Bに示す第2人流データの時間帯毎の人数を、第1人流データの第1場所(例えば、建物A)での人数である第2人数に変換する。ここでは、図4Bに示す第2人流データから建物Aについて各時間帯に対する第2人数(例えば、「36」、「11」、・・・)を算出する。具体的には、例えば、領域Aの面積と建物Aの面積との比に応じて建物Aの第2人数を算出する。また、領域Aの人数に対して、曜日、祝日、気温、及び天候の少なくとも1つに応じた変換係数を乗じることにより、建物Aの第2人数を算出してもよい。ここで、変換係数としては、例えば、曜日、祝日、気温、及び天候の少なくとも1つに応じて、領域Aと建物Aとの人数比率を予め分析して得ておき、この人数比率を用いることが考えられる。
図5Dは、本実施形態に係る補正係数の一例を示す図である。つまり、算出部107は、第1人数及び第2人数から時間帯毎の補正係数を算出する。具体的には、例えば、図5Cに示す第2人流データの第2人数を、図5Bに示す場所人流データの同時間帯の第1人数で除することにより、補正係数を算出する。図5Cの第2人数が「36」、図5Bの第1人数が「30」であれば、図5Dの補正係数は「1.2」と求まる。図5Cの第2人数が「11」、図5Bの第1人数が「10」であれば、図5Dの補正係数は「1.1」と求まる。なお、ここでは、一例として、日の情報は落としているが、細かい変動も考慮したい場合には、日の情報を落とさずに補正してもよい。この場合、日と時間帯に対して補正係数を求めるようにすればよい。
図5Eは、本実施形態に係る補正後人数の一例を示す図である。つまり、演算部108は、図5Aに示す場所人流データの時間帯毎の人数に対して、図5Dに示す補正係数のうち対応する時間帯の補正係数を乗じることにより、第1人流データについての補正後の人数を演算する。例えば、3時間の時間間隔では全て同じ補正係数を用いるものとし、図5Aの1時間毎のデータのそれぞれに対して、対応する補正係数を乗じる。例えば、図5Aの「0:00-1:00」、「1:00-2:00」、及び「2:00-3:00」の時間帯のそれぞれの人数に対して、図5Dに示す補正係数のうち対応する時間帯「0:00-3:00」の補正係数(ここでは「1.2」)を乗じる。この結果、図5Eに示す補正後人数が得られる。
次に、図6及び図7を参照して、第1の実施形態に係る人流データ補正装置10の作用について説明する。
図6は、第1の実施形態に係る人流データ補正プログラムによる人流データ補正処理の流れの一例を示すフローチャートである。また、図7は、人流データ補正処理の各処理1~5を概念的に示す図である。人流データ補正プログラムによる人流データ補正処理は、人流データ補正装置10のCPU11が、ROM12又はストレージ14に記憶されている人流データ補正プログラムをRAM13に書き込んで実行することにより、実現される。
図6のステップS101では、CPU11が、一例として、上述の図4Aに示す第1人流データを取得する。
ステップS102では、CPU11が、一例として、上述の図4Bに示す第2人流データを取得する。
ステップS103では、CPU11が、一例として、図7の(処理1)に示すように、ステップS101で取得した第1人流データから第1場所の一例である建物Aについての時間帯毎の人数を表す場所人流データを抽出する。抽出した場所人流データの一例を上述の図5Aに示す。
ステップS104では、CPU11が、一例として、図7の(処理2)に示すように、ステップS103で抽出した場所人流データの時間帯毎(例えば1時間毎)の人数を、ステップS102で取得した第2人流データの時間帯毎(例えば3時間毎)の人数である第1人数に変換する。第1人数に変換した第2人流データの一例を上述の図5Bに示す。
ステップS105では、CPU11が、一例として、図7の(処理3)に示すように、ステップS102で取得した第2人流データの時間帯毎(例えば3時間毎)の人数を、第1場所(例えば建物A)での人数である第2人数に変換する。第2人数に変換した第2人流データの一例を上述の図5Cに示す。
ステップS106では、CPU11が、一例として、図7の(処理4)に示すように、ステップS104で変換した第1人数(データD1)と、ステップS105で変換した第2人数(データD2)から時間帯毎(例えば3時間毎)の補正係数を算出する。算出した補正係数の一例を上述の図5Dに示す。
ステップS107では、CPU11が、一例として、図7の(処理5)に示すように、ステップS103で抽出した場所人流データの時間帯毎(例えば1時間毎)の人数に対して、対応する時間帯の補正係数を乗じることにより、第1人流データについての補正後の人数を演算し、本人流データ補正プログラムによる一連の処理を終了する。
ここで、上述したように、領域Aの人数に対して、曜日、祝日、気温、及び天候の少なくとも1つに応じた変換係数(例えば、予め設定した人数比率)を乗じることにより、建物Aの第2人数を算出してもよい。これにより、更に信頼性の高い人流データを得ることができる。
また、使用する人流データは、2つに限らず、3つ以上でもよい。例えば、3つの人流データがあると、2つの人流データによって得られた補正後の人流データに対して、3つ目の人流データを用いて更に補正を行うようにしてもよい。これにより、更に信頼性の高い人流データを得ることができる。
3つの人流データを使う場合の別の方法について説明する。補正をかける側の人流データ(第2人流データ)については、例えば、空間的には粗いものを使用することを想定する。仮に領域Aに対して、時間的には粗いが、空間的にはより粒度の細かい信頼できる人流データが第2人流データとはまた別にある場合、その人流データの建物Aに可能な限り近づけた領域の人数と領域Aの人数の比率により、補正をかける側の人流データのスケールを調整し、その調整後のデータを使って第1人流データに対して補正をかけることが考えられる。スケールを調整するとき、曜日や、祝日や、気温や、天気の影響を考慮するようにしても良い。
また、各人流データに対する処理として、いくつかの処理を組み合わせることも考えられる。例えば、領域Aの第2人流データに対する図7の(処理3)を行う前に、一例として、図8に示すように、本来は人数が0であるべきなのに0でない時間帯(例えば、深夜帯)は、対応するデータを削除したり、対応する人数を0に置き換えたりしてもよい。これにより、本来は人がいないはずの時間帯において誤検出があることが予め分かっている場合等に、更に信頼性の高い人流データを得ることができる。
このように本実施形態によれば、データの時間的粒度及び空間的粒度は細かいが信頼性は低い人流データに対して、信頼性が高くなるように補正することができる。
第1の実施形態の変形例について説明する。例えば、上述の図3に示す領域A内又は領域A外に建物Cがあるとする。建物Cの人流データは図4Aのデータに含まれているか、同様のデータが別途得られているとし、その人流データの信頼性は低いものとする。このとき、建物Cの人流データを補正することを考える。建物Aと建物Cの距離が近く、一日の人流が同様とみなすことができる場合には、建物Aに対して算出された上述の図5Dに示す補正係数を利用して、建物Cの人流データを補正することができる。つまり、複数の人流データが得られていない建物Cについても補正を行うことができる。なお、本変形例において、建物Aと建物Cの距離が近いとしたが、例えば、多くのオフィスが入っている等、同様の傾向を示すことが予想される建物であれば適用可能である。
ここで、例えば、携帯電話などの位置情報を取得できるデバイスを利用して人数を求める場合と、カメラで人数を求める場合とについて想定する。このようなケースでは、通常、カメラで求めた人数の方が人物の重なり等があるため信頼性が低くなると考えられる。つまり、デバイスを利用して求めた人数の方が信頼性が高く、カメラで求めた人数の方が信頼性が低いと言える。この場合、デバイスを利用して求めた人数を使用してカメラで求めた人数を補正するようにすればよい。
但し、デバイスを利用して人数を求める場合でも信頼できないデータとなる可能性がある。例えば、一人が複数のデバイスを所持していたり、小さな子供などデバイスを一台も所持していない人がいたりすると、デバイスの数を人数と捉えるのは適切ではないことが理由として挙げられる。その場合、カメラで求めた人数の方が正しい可能性がある。このような状況では、カメラで求めた人数を使用してデバイスを利用して求めた人数を補正するということが考えられる。仮に、デバイスを利用して求めた人数の対象領域が、カメラで求めた人数の対象領域よりも空間的には広かった場合、空間的には狭いデータを使用して、空間的に広いデータを補正することになる。この例では、空間的粒度が比較的細かく信頼性が高い第1人流データにより、空間的粒度が比較的粗く信頼性が低い第2人流データを補正する。
この場合、補正係数を求める前に、上述した第2人流データにより第1人流データを補正する場合と同様に、データの空間的な範囲を揃える処理を行う。つまり、ここで扱っている例で言えば、空間的に狭いデータを空間的に広いデータの範囲に合わせるような処理を行う。その処理の例としては、抽出部104は、第1人流データから建物Aについての時間帯毎の人数を表す場所人流データを抽出する。第1変換部105は、場所人流データの時間帯毎の人数を、第2人流データが持つ時間帯の粒度以上の細かさの時間帯での人数である第1人数に変換する。更に、第1人数の時間帯毎の人数を、領域Aでの人数である第2人数に変換する。ここで、第2変換部106は、第1人数と第2人流データの時間的な粒度が異なっているならば、第1人数の粒度に合うように第2人流データの粒度を変える処理をし、粒度が合っていれば、 第2人流データをそのまま算出部107に渡す。算出部107は、第2人流データ及び第2人数から時間帯毎の補正係数を算出する。演算部108は、第2人流データの時間帯毎の人数に対して、対応する時間帯の補正係数を乗じることにより、第2人流データについての補正後の人数を演算する。なお、空間的にはより粒度が細かく信頼性が高い人流データが第1人流データ(場所人流データ)とはまた別にある場合、その別の人流データを用いてもよい。つまり、空間的に狭いデータの範囲と空間的に広いデータの範囲の人数の比率を求め、それを空間的に狭いデータである第1人流データ、または、場所人流データ、または、第1人数にかける処理を行う。
例えば、ある時点における正確な人数が取得できていて、その時点のデバイスを利用して求めた人数よりも、その時点のカメラで求めた人数の方が、その正確な人数に近い場合は、第2人流データを第1人流データで補正する方が良い。
このような補正を行うメリットについて説明する。一つの例として、第1人流データと第2人流データの期間が異なっており、第2人流データの方が長い期間に対してデータが手元にある状況であれば、同じ期間のデータを用いて算出した補正係数を利用することで、第1人流データはないが、第2人流データはあるという期間の第2人流データを補正することができる。仮に、第2人流データがリアルタイムに得られるとしたら、そのデータに対しても、補正可能である。 また、第2人流データの取得地域と近い地域の人流データなど、第2人流データと特徴が似ていると考えられる人流データがあれば、同じ補正係数を利用して、そのデータも補正できると考えられる。
また、別の補正方法として、複数のデバイスを所持している人や、一台も所持していな人の割合を事前に得ておき、その割合を用いてデバイスを利用して求めた人数を補正する方法も考えられる。この割合について、例えば、会社が多い地域では複数のデバイスを所持している人が多いという予想や、小さな子供が多そうな住宅街ではデバイスを所持していない人の割合は上がるという予想などを反映して設定することが考えられる。さらに、複数のデバイスを持っている人の通信キャリアの割合を事前に得ておくか、想定して補正に利用する方法も考えられる。
ここでは、複数の建物のデータが含まれている図4Aのデータを使用して説明してきたが、複数の建物が含まれたデータでなくても良い。その場合、建物Aのデータを抽出するというような補正対象の建物のデータを抽出する処理は不要となる。反対に、図4Bのデータに他の領域の人流データが含まれていても良い。その場合、領域Aの人流データを抽出する処理を行っても良い。
また、図4Aのデータと図4Bのデータで時間的な粒度と空間的な粒度がそれぞれ異なっている場合で説明したが、どちらかの粒度が同じでも良く、時間的な粒度が同じであれば、時間的な粒度を合わせる処理は不要となり、空間的な粒度が同じであれば、空間的な粒度を合わせる処理は不要となる。
また、ここまで時間的な粒度について、粗い方に合わせることを考えてきたが、粗い方よりもさらに粗い粒度で合わせても良い。例えば、第1人流データが1時間毎のデータであり、第2人流データが3時間毎のデータであった場合には、両方のデータやいずれかに由来するデータから、6時間毎のデータを作り出し、補正係数を求めても良い。また、第1人流データと第2人流データが得られている期間にずれがある場合は、両方のデータがある期間のデータだけで補正係数を求めても良いし、曜日毎時間帯毎の平均人数を利用するなどして期間を合わせることなく補正係数を得ても良い。補正対象のデータの方が長期間のデータであっても、例えば時間帯毎の補正係数といった期間が異なっていても適用できる補正係数が得られていれば、補正対象のデータのどの期間のデータに対しても補正をかけられる。
[第2の実施形態]
上記第1の実施形態では、第1人流データ及び第2人流データは共に過去のデータであり、過去の第1人流データの補正を行う形態について説明した。第2の実施形態では、リアルタイムで取得した現在の第1人流データの補正を行う形態について説明する。
上記第1の実施形態では、第1人流データ及び第2人流データは共に過去のデータであり、過去の第1人流データの補正を行う形態について説明した。第2の実施形態では、リアルタイムで取得した現在の第1人流データの補正を行う形態について説明する。
図9は、第2の実施形態に係る人流データ補正装置10Aの機能的な構成の一例を示すブロック図である。
図9に示すように、本実施形態に係る人流データ補正装置10Aの補正部103は、抽出部104と、演算部108と、を含む。なお、本実施形態では、上記第1の実施形態に係る人流データ補正装置10により算出して得られた補正係数(上述の図5D参照)がストレージ14に格納されており、補正部103により参照可能とされる。
補正部103には、リアルタイムで取得された現在の第1人流データ及び補正係数が入力される。抽出部104は、入力された第1人流データから第1場所の一例である建物Aについての場所人流データを抽出する。
演算部108は、抽出部104により抽出された場所人流データの時間帯毎(または、曜日毎等の他の条件でもよい。)の人数に対して、対応する時間帯の補正係数を乗じることにより、第1人流データについての補正後の人数を演算する。
つまり、本実施形態では、第1人流データの現在の日時に基づいて補正に使用する補正係数を決定し、決定した補正係数を用いて、現在の第1人流データを補正することができる。例えば、現在が「2023/3/31」の「0:00-1:00」のデータを取得したタイミングであるとすると、上述の図5Dに示す時間帯「0:00-3:00」の補正係数「1.2」を用いて補正すればよい。
このように本実施形態によれば、データの時間的粒度及び空間的粒度は細かいが信頼性は低い人流データが現在の人流データであっても、信頼性が高くなるように補正することができる。
[第3の実施形態]
第3の実施形態では、第1人流データに含まれる不適切なデータを検出して補正する形態について説明する。
第3の実施形態では、第1人流データに含まれる不適切なデータを検出して補正する形態について説明する。
図10は、第3の実施形態に係る人流データ補正装置10Bの機能的な構成の一例を示すブロック図である。
図10に示すように、本実施形態に係る人流データ補正装置10Bの補正部103は、抽出部104と、第1変換部105と、第2変換部106と、算出部107と、演算部108と、検出部109と、を含む。
検出部109は、第1変換部105により変換して得られた第1人数と、第2変換部106により変換して得られた第2人数との比が予め定めた範囲外となる第1人流データを不適切なデータとして検出する。
演算部108は、検出部109により検出された不適切なデータに対して、第1変換部105により変換して得られた場所人流データの第1人数を、対応する時間帯の第2人流データの第2人数に置き換える。
つまり、本実施形態では、上述したように、第1人流データ及び第2人流データについて、データの時間的粒度と空間的粒度を揃えて、それぞれ図5B及び図5Cのデータを得る。そして、図11に示すように、得られた図5B及び図5Cの対応する各データ点について比を求める。
図11は、本実施形態に係る第1人流データ及び第2人流データの対応する各データ点の比の一例を示す図である。図11で求めた比が予め定めた範囲(つまり、上限値と下限値で定まる範囲)外であれば、不適切なデータであるとして検出する。
検出された不適切なデータについては、図5Cのデータを代わりに使用し、不適切ではないデータについては、算出部107で算出して得られた補正係数を用いて補正を行う、あるいは、算出までして補正しなくてもよい。例えば、図11で求めた比に対する上限値を「10」とした場合、図11の比「20」のデータは不適切なデータとして検出される。この場合、上述の図5Bのデータのうち、当該比「20」のデータに対応するデータの人数については、図5Cの対応するデータ(同日、同時間帯、同対象範囲)に置き換える。そして、置き換えた図5Bのデータ(例えば、3時間毎のデータ)に基づいて、図5Aのデータ(例えば、1時間毎のデータ)を補正する。このときの補正は、例えば、図5Bの置き換えた人数を、図5Aの元の人数の比率で割り振る方法が考えられる。
このように本実施形態によれば、第1人流データの中で不適切なデータが含まれる場合であっても、不適切なデータを検出して適切なデータに補正することができる。
上記実施形態でCPUがプログラムを読み込んで実行した人流データ補正処理を、CPU以外の各種のプロセッサが実行してもよい。この場合のプロセッサとしては、FPGA(Field-Programmable Gate Array)等の製造後に回路構成を変更可能なPLD(Programmable Logic Device)、及びASIC(Application Specific Integrated Circuit)等の特定の処理を実行させるために専用に設計された回路構成を有するプロセッサである専用電気回路等が例示される。また、人流データ補正処理を、これらの各種のプロセッサのうちの1つで実行してもよいし、同種又は異種の2つ以上のプロセッサの組み合わせ(例えば、複数のFPGA、及びCPUとFPGAとの組み合わせ等)で実行してもよい。また、これらの各種のプロセッサのハードウェア的な構造は、より具体的には、半導体素子等の回路素子を組み合わせた電気回路である。
また、上記実施形態では、人流データ補正プログラムがROM又はストレージに予め記憶(「インストール」ともいう)されている態様を説明したが、これに限定されない。人流データ補正プログラムは、CD-ROM(Compact Disk Read Only Memory)、DVD-ROM(Digital Versatile Disk Read Only Memory)、及びUSB(Universal Serial Bus)メモリ等の非一時的(non-transitory)記憶媒体に記憶された形態で提供されてもよい。また、人流データ補正プログラムは、ネットワークを介して外部装置からダウンロードされる形態としてもよい。
本明細書に記載された全ての文献、特許出願、及び技術規格は、個々の文献、特許出願、及び技術規格が参照により取り込まれることが具体的かつ個々に記された場合と同程度に、本明細書中に参照により取り込まれる。
以上の実施形態に関し、更に以下の付記を開示する。
(付記項1)
メモリと、
前記メモリに接続された少なくとも1つのプロセッサと、
を含み、
前記プロセッサは、
予め定めた第1範囲における人の流れを表す第1人流データを取得し、
前記第1範囲の少なくとも一部を含む第2範囲における人の流れを表す第2人流データであって、データの時間的粒度及び空間的粒度の少なくとも一方が前記第1人流データよりも粗く、かつ、データの統計的な信頼性が前記第1人流データよりも高い前記第2人流データを取得し、
前記第1人流データを、前記第2人流データを用いて補正する
人流データ補正装置。
メモリと、
前記メモリに接続された少なくとも1つのプロセッサと、
を含み、
前記プロセッサは、
予め定めた第1範囲における人の流れを表す第1人流データを取得し、
前記第1範囲の少なくとも一部を含む第2範囲における人の流れを表す第2人流データであって、データの時間的粒度及び空間的粒度の少なくとも一方が前記第1人流データよりも粗く、かつ、データの統計的な信頼性が前記第1人流データよりも高い前記第2人流データを取得し、
前記第1人流データを、前記第2人流データを用いて補正する
人流データ補正装置。
(付記項2)
人流データ補正処理を実行するようにコンピュータによって実行可能なプログラムを記憶した非一時的記憶媒体であって、
前記人流データ補正処理は、
予め定めた第1範囲における人の流れを表す第1人流データを取得し、
前記第1範囲の少なくとも一部を含む第2範囲における人の流れを表す第2人流データであって、データの時間的粒度及び空間的粒度の少なくとも一方が前記第1人流データよりも粗く、かつ、データの統計的な信頼性が前記第1人流データよりも高い前記第2人流データを取得し、
前記第1人流データを、前記第2人流データを用いて補正する
非一時的記憶媒体。
人流データ補正処理を実行するようにコンピュータによって実行可能なプログラムを記憶した非一時的記憶媒体であって、
前記人流データ補正処理は、
予め定めた第1範囲における人の流れを表す第1人流データを取得し、
前記第1範囲の少なくとも一部を含む第2範囲における人の流れを表す第2人流データであって、データの時間的粒度及び空間的粒度の少なくとも一方が前記第1人流データよりも粗く、かつ、データの統計的な信頼性が前記第1人流データよりも高い前記第2人流データを取得し、
前記第1人流データを、前記第2人流データを用いて補正する
非一時的記憶媒体。
10、10A、10B 人流データ補正装置
11 CPU
12 ROM
13 RAM
14 ストレージ
15 入力部
16 表示部
17 通信I/F
18 バス
101 第1取得部
102 第2取得部
103 補正部
104 抽出部
105 第1変換部
106 第2変換部
107 算出部
108 演算部
109 検出部
11 CPU
12 ROM
13 RAM
14 ストレージ
15 入力部
16 表示部
17 通信I/F
18 バス
101 第1取得部
102 第2取得部
103 補正部
104 抽出部
105 第1変換部
106 第2変換部
107 算出部
108 演算部
109 検出部
Claims (8)
- 予め定めた第1範囲における人の流れを表す第1人流データを取得する第1取得部と、
前記第1範囲の少なくとも一部を含む第2範囲における人の流れを表す第2人流データであって、データの時間的粒度及び空間的粒度の少なくとも一方が前記第1人流データよりも粗く、かつ、データの統計的な信頼性が前記第1人流データよりも高い前記第2人流データを取得する第2取得部と、
前記第1人流データを、前記第2人流データを用いて補正する補正部と、
を備えた人流データ補正装置。 - 予め定めた第1範囲における人の流れを表す第1人流データを取得する第1取得部と、
前記第1範囲の少なくとも一部を含む第2範囲における人の流れを表す第2人流データであって、データの時間的粒度及び空間的粒度の少なくとも一方が前記第1人流データよりも粗く、かつ、データの統計的な信頼性が前記第1人流データよりも低い前記第2人流データを取得する第2取得部と、
前記第2人流データを、前記第1人流データを用いて補正する補正部と、
を備えた人流データ補正装置。 - 前記補正部は、
前記第1人流データから前記第1範囲内の第1場所についての時間帯毎の人数を表す場所人流データを抽出する抽出部と、
前記場所人流データの時間帯毎の人数を、前記第2人流データが持つ時間帯の粒度以上の粗さの時間帯での人数である第1人数に変換する第1変換部と、
前記第2人流データの時間帯毎の人数を、前記第1場所での人数である第2人数に変換する第2変換部と、
前記第1人数及び前記第2人数から時間帯毎の補正係数を算出する算出部と、
前記場所人流データの時間帯毎の人数に対して、対応する時間帯の前記補正係数を乗じることにより、前記第1人流データについての補正後の人数を演算する演算部と、
を含む、
請求項1に記載の人流データ補正装置。 - 前記第2変換部は、前記第2人流データの時間帯毎の人数に対して、曜日、祝日、気温、及び天候の少なくとも1つに応じた変換係数を乗じることにより、前記第2人数に変換する、
請求項3に記載の人流データ補正装置。 - 前記第2変換部は、前記第2人流データの時間帯毎の人数を前記第2人数に変換する前に、前記第2人流データから予め定めた時間帯のデータを削除、又は、対応する人数を0に置き換える、
請求項3に記載の人流データ補正装置。 - 前記補正部は、前記第1人数と前記第2人数との比が予め定めた範囲外となる前記第1人流データを不適切なデータとして検出する検出部を更に含む、
請求項3に記載の人流データ補正装置。 - 人流データ補正装置が、
予め定めた第1範囲における人の流れを表す第1人流データを取得し、
前記第1範囲の少なくとも一部を含む第2範囲における人の流れを表す第2人流データであって、データの時間的粒度及び空間的粒度の少なくとも一方が前記第1人流データよりも粗く、かつ、データの統計的な信頼性が前記第1人流データよりも高い前記第2人流データを取得し、
前記第1人流データを、前記第2人流データを用いて補正する、
人流データ補正方法。 - コンピュータを、
請求項1又は請求項2に記載の人流データ補正装置が備える各部として機能させるための人流データ補正プログラム。
Priority Applications (3)
| Application Number | Priority Date | Filing Date | Title |
|---|---|---|---|
| PCT/JP2023/025780 WO2025013258A1 (ja) | 2023-07-12 | 2023-07-12 | 人流データ補正装置、人流データ補正方法、及び人流データ補正プログラム |
| PCT/JP2024/008096 WO2025013337A1 (ja) | 2023-07-12 | 2024-03-04 | 人流データ補正装置、人流データ補正方法、人流データ補正プログラム、人流データ補正係数算出装置、及び人流データ補正係数算出プログラム |
| JP2025532374A JPWO2025013337A1 (ja) | 2023-07-12 | 2024-03-04 |
Applications Claiming Priority (1)
| Application Number | Priority Date | Filing Date | Title |
|---|---|---|---|
| PCT/JP2023/025780 WO2025013258A1 (ja) | 2023-07-12 | 2023-07-12 | 人流データ補正装置、人流データ補正方法、及び人流データ補正プログラム |
Publications (1)
| Publication Number | Publication Date |
|---|---|
| WO2025013258A1 true WO2025013258A1 (ja) | 2025-01-16 |
Family
ID=94214821
Family Applications (2)
| Application Number | Title | Priority Date | Filing Date |
|---|---|---|---|
| PCT/JP2023/025780 Pending WO2025013258A1 (ja) | 2023-07-12 | 2023-07-12 | 人流データ補正装置、人流データ補正方法、及び人流データ補正プログラム |
| PCT/JP2024/008096 Pending WO2025013337A1 (ja) | 2023-07-12 | 2024-03-04 | 人流データ補正装置、人流データ補正方法、人流データ補正プログラム、人流データ補正係数算出装置、及び人流データ補正係数算出プログラム |
Family Applications After (1)
| Application Number | Title | Priority Date | Filing Date |
|---|---|---|---|
| PCT/JP2024/008096 Pending WO2025013337A1 (ja) | 2023-07-12 | 2024-03-04 | 人流データ補正装置、人流データ補正方法、人流データ補正プログラム、人流データ補正係数算出装置、及び人流データ補正係数算出プログラム |
Country Status (2)
| Country | Link |
|---|---|
| JP (1) | JPWO2025013337A1 (ja) |
| WO (2) | WO2025013258A1 (ja) |
Citations (3)
| Publication number | Priority date | Publication date | Assignee | Title |
|---|---|---|---|---|
| WO2011024379A1 (ja) * | 2009-08-24 | 2011-03-03 | ソフトバンクBb株式会社 | 流動性人口推定システム、流動性人口推定方法及び流動性人口推定プログラム |
| JP2014112292A (ja) * | 2012-12-05 | 2014-06-19 | Hitachi Ltd | 人流調査支援システム及び方法 |
| US20200074164A1 (en) * | 2017-03-01 | 2020-03-05 | Carrier Corporation | People flow estimation system and people flow estimation method |
-
2023
- 2023-07-12 WO PCT/JP2023/025780 patent/WO2025013258A1/ja active Pending
-
2024
- 2024-03-04 WO PCT/JP2024/008096 patent/WO2025013337A1/ja active Pending
- 2024-03-04 JP JP2025532374A patent/JPWO2025013337A1/ja active Pending
Patent Citations (3)
| Publication number | Priority date | Publication date | Assignee | Title |
|---|---|---|---|---|
| WO2011024379A1 (ja) * | 2009-08-24 | 2011-03-03 | ソフトバンクBb株式会社 | 流動性人口推定システム、流動性人口推定方法及び流動性人口推定プログラム |
| JP2014112292A (ja) * | 2012-12-05 | 2014-06-19 | Hitachi Ltd | 人流調査支援システム及び方法 |
| US20200074164A1 (en) * | 2017-03-01 | 2020-03-05 | Carrier Corporation | People flow estimation system and people flow estimation method |
Also Published As
| Publication number | Publication date |
|---|---|
| WO2025013337A1 (ja) | 2025-01-16 |
| JPWO2025013337A1 (ja) | 2025-01-16 |
Similar Documents
| Publication | Publication Date | Title |
|---|---|---|
| Esteve et al. | Living alone over the life course: Cross‐national variations on an emerging issue | |
| EP3138283B1 (en) | Automatic white balancing with chromaticity measure of raw image data | |
| De Diego | Testing tests on active galactic nuclei microvariability | |
| CN105138238B (zh) | 一种用于显示时间的方法和装置 | |
| US9280820B2 (en) | Creating camera clock transforms from image information | |
| CN112395038A (zh) | 一种共享桌面时调整文字的方法和装置 | |
| CN109816743A (zh) | 生成标识图案的方法和终端设备 | |
| KR102935495B1 (ko) | SSP(shared socioeconomic pathways) 시나리오 기반 고해상도 다중지역기후모델에 편의보정 기법 적용을 통한 미래 극한강수변화 정보의 불확실성 요인을 표출하는 전자 장치 및 동작 방법 | |
| Quest et al. | Multi‐Annual Year‐on‐Year: Minimising the Uncertainty in Photovoltaic System Performance Loss Rates | |
| WO2025013258A1 (ja) | 人流データ補正装置、人流データ補正方法、及び人流データ補正プログラム | |
| Jahangiri et al. | BiLSTM-Kalman framework for precipitation downscaling under multiple climate change scenarios | |
| KR100987030B1 (ko) | 화이트밸런스 보정 방법 및 장치 | |
| Rutten et al. | Solar H α features with hot onsets: IV. Network fibrils | |
| Bulíček et al. | Well posedness of nonlinear parabolic systems beyond duality | |
| JP2015197851A (ja) | 画像処理方法、画像処理用プログラム及び情報管理システム | |
| JP2018005341A (ja) | 画面転送方法、画面転送プログラム及び画面転送装置 | |
| CN112651349B (zh) | 一种无线干扰检测方法、装置、设备及可读存储介质 | |
| US20160277494A1 (en) | Synchronization control device, synchronization system, and synchronization control method | |
| WO2020022052A1 (ja) | 発電情報出力方法、発電情報出力装置及びプログラム | |
| Smith | Tropical Pacific sea level variations (1948–98) | |
| US20200092457A1 (en) | Method of measuring light using dual cameras | |
| JP6552076B1 (ja) | 日射量出現確率分布解析法、日射量出現確率分布解析システムおよび日射量出現確率分布解析プログラム | |
| Jurčák et al. | Temporal downflows in a penumbra | |
| Straub et al. | HelioNet‐IR: Combining Infrared and Visible Satellite Images for Solar Irradiance Forecasting in the Early‐Morning Hours | |
| US9665579B2 (en) | Date and time format generation method, program, and system for reference and elapsed timestamps to produce a formatted target timestamp for use in stream processing |
Legal Events
| Date | Code | Title | Description |
|---|---|---|---|
| 121 | Ep: the epo has been informed by wipo that ep was designated in this application |
Ref document number: 23945132 Country of ref document: EP Kind code of ref document: A1 |
|
| NENP | Non-entry into the national phase |
Ref country code: DE |