WO2024257617A1 - 監視システム、監視方法および記録媒体 - Google Patents
監視システム、監視方法および記録媒体 Download PDFInfo
- Publication number
- WO2024257617A1 WO2024257617A1 PCT/JP2024/019838 JP2024019838W WO2024257617A1 WO 2024257617 A1 WO2024257617 A1 WO 2024257617A1 JP 2024019838 W JP2024019838 W JP 2024019838W WO 2024257617 A1 WO2024257617 A1 WO 2024257617A1
- Authority
- WO
- WIPO (PCT)
- Prior art keywords
- plant
- environmental information
- unmeasurable
- measurement data
- deterioration
- Prior art date
- Legal status (The legal status is an assumption and is not a legal conclusion. Google has not performed a legal analysis and makes no representation as to the accuracy of the status listed.)
- Ceased
Links
Images




Classifications
-
- G—PHYSICS
- G05—CONTROLLING; REGULATING
- G05B—CONTROL OR REGULATING SYSTEMS IN GENERAL; FUNCTIONAL ELEMENTS OF SUCH SYSTEMS; MONITORING OR TESTING ARRANGEMENTS FOR SUCH SYSTEMS OR ELEMENTS
- G05B23/00—Testing or monitoring of control systems or parts thereof
- G05B23/02—Electric testing or monitoring
-
- G—PHYSICS
- G06—COMPUTING OR CALCULATING; COUNTING
- G06N—COMPUTING ARRANGEMENTS BASED ON SPECIFIC COMPUTATIONAL MODELS
- G06N20/00—Machine learning
-
- G—PHYSICS
- G06—COMPUTING OR CALCULATING; COUNTING
- G06Q—INFORMATION AND COMMUNICATION TECHNOLOGY [ICT] SPECIALLY ADAPTED FOR ADMINISTRATIVE, COMMERCIAL, FINANCIAL, MANAGERIAL OR SUPERVISORY PURPOSES; SYSTEMS OR METHODS SPECIALLY ADAPTED FOR ADMINISTRATIVE, COMMERCIAL, FINANCIAL, MANAGERIAL OR SUPERVISORY PURPOSES, NOT OTHERWISE PROVIDED FOR
- G06Q50/00—Information and communication technology [ICT] specially adapted for implementation of business processes of specific business sectors, e.g. utilities or tourism
- G06Q50/04—Manufacturing
Definitions
- This disclosure relates to surveillance systems, etc.
- equipment maintenance is performed.
- plant equipment maintenance for example, inspection of the inside and outside of the equipment, replacement of parts used in the equipment, or cleaning of the parts used in the equipment is performed.
- plant equipment maintenance for example, if plant equipment maintenance is performed earlier than appropriate, the efficiency of plant operation may decrease due to, for example, operation being stopped or parts being used more frequently. Also, if plant equipment maintenance is performed later than appropriate, for example, accidents or a decrease in production efficiency may occur. For this reason, it is desirable to perform plant equipment maintenance at the appropriate time.
- the maintenance management system in Patent Document 1 compares actual measurement data for each inspection target in the power plant with the results of calculations using a physical model. Then, based on the comparison results, the maintenance management system in Patent Document 1 selects the inspection targets for the next inspection.
- Patent Document 1 The technology described in Patent Document 1 can make it difficult to properly estimate the maintenance timing.
- the present disclosure aims to provide a monitoring system etc. that can improve the accuracy of estimating the timing of maintenance in order to solve the above problems.
- the monitoring system disclosed herein includes an acquisition means for acquiring measurement data related to the plant's equipment, an estimation means for estimating unmeasurable environmental information related to the plant based on the measurement data, a prediction means for predicting the deterioration state of the plant based on at least the unmeasurable environmental information, a maintenance timing estimation means for estimating the timing of maintenance for the plant based on the predicted result of the deterioration state, and an output means for outputting the estimated maintenance timing.
- the monitoring method disclosed herein acquires measurement data related to plant equipment, estimates unmeasurable environmental information related to the plant based on the measurement data, predicts the deterioration state of the equipment based on at least the unmeasurable environmental information, estimates the timing of maintenance for the plant based on the predicted deterioration state, and outputs the estimated maintenance timing.
- the recording medium of the present disclosure non-temporarily records a monitoring program that causes a computer to execute the following processes: acquiring measurement data related to the plant's equipment; estimating unmeasurable environmental information related to the plant based on the measurement data; predicting the deterioration state of the equipment based on at least the unmeasurable environmental information; estimating the timing of maintenance of the plant based on the predicted result of the deterioration state; and outputting the estimated maintenance timing.
- This disclosure makes it possible to improve the accuracy of estimating conservation timing.
- FIG. 1 is a diagram illustrating an example of a configuration of a plant monitoring system according to the present disclosure.
- FIG. 1 is a diagram illustrating an example of a configuration of a chemical plant in the present disclosure.
- FIG. 1 is a diagram illustrating an example of a configuration of a monitoring system according to the present disclosure.
- FIG. 2 is a diagram illustrating an example of a display screen according to the present disclosure.
- FIG. 2 is a diagram illustrating an example of a display screen according to the present disclosure.
- FIG. 2 is a diagram illustrating an example of a display screen according to the present disclosure.
- FIG. 2 is a diagram illustrating an example of an operation flow of the monitoring system according to the present disclosure.
- FIG. 2 is a diagram illustrating an example of a hardware configuration of a monitoring system according to the present disclosure.
- FIG. 1 is a diagram showing an example of the configuration of a plant monitoring system of this embodiment.
- the plant monitoring system includes, for example, a monitoring system 10, a sensor 20, and a terminal device 30.
- the monitoring system 10 is connected to the sensor 20, for example, via a network.
- the monitoring system 10 is also connected to the terminal device 30, for example, via a network.
- the monitoring system 10 may acquire measurement data of the sensor 20 via a storage medium.
- a plant monitoring system is, for example, a system that monitors the operating status of a plant.
- a plant monitor for example, refers to the operating status and makes decisions regarding plant control and plant maintenance. Decisions regarding plant maintenance include, for example, determining the targets of maintenance, the work items, and the timing of maintenance.
- the monitoring system 10 is, for example, a system that estimates the timing of plant maintenance.
- Plant maintenance is, for example, an activity to maintain a plant so that it can operate in an appropriate state.
- Plant maintenance is, for example, the maintenance of the plant's equipment.
- Plant maintenance is, for example, one or more tasks among inspection, replacement, repair, adjustment, and cleaning of the plant's equipment.
- Plant maintenance is not limited to the above.
- Plant maintenance may also include maintenance of the plant's power unit.
- the timing of plant maintenance is the time to perform work related to plant maintenance. For example, if plant maintenance is the maintenance of the plant's equipment, the timing of plant maintenance is the time to perform one or more tasks among inspection, replacement, repair, adjustment, and cleaning of the plant's equipment.
- the plant is, for example, a chemical plant.
- the plant may be a plant in a factory other than a chemical plant.
- the plant may be a steel plant.
- the plant may also be a waste incineration plant, a power plant, a dam, a sewage treatment plant, or a water purification plant.
- the facilities in which the plant is used are not limited to the above.
- the plant may also be an internal combustion engine, a power generation unit, a cooling unit, a supply unit, a purification unit, or an air conditioning unit.
- the equipment that corresponds to the plant is not limited to the above.
- the plant equipment is, for example, one or more units selected from the following: piping, valves, pressurizers, pressure reducers, combustors, reactors, distillers, coolers, molding machines, filters, injectors, and mixers.
- the plant equipment is not limited to the above.
- the plant power unit is, for example, one or more units selected from the following: pumps, blowers, fans, and compressors. The plant power unit is not limited to the above.
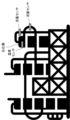
- FIG. 2 is a schematic diagram of an example of a chemical plant.
- multiple sensors are attached to measure data related to a reactor.
- flow rate sensors are attached to the inlet pipe and the outlet pipe of the reactor.
- a temperature sensor is attached to the reactor.
- the flow rate sensor and the temperature sensor are examples of the sensor 20.
- the sensor 20 is not limited to a flow rate sensor and a temperature sensor.
- the sensor 20 may be attached to measure data related to a unit other than the reactor.
- the plant maintenance timing is estimated, for example, using the results of a deterioration prediction for the plant.
- the deterioration prediction for the plant is, for example, based on unmeasurable environmental information.
- the unmeasurable environmental information is, for example, environmental information that cannot be measured while the plant is in operation.
- the unmeasurable environmental information is, for example, environmental information that cannot be measured in principle, or environmental information from which meaningful data cannot be obtained during plant operation in monitoring the plant.
- the unmeasurable environmental information may include environmental information for which it is difficult to prepare a measurement environment.
- the unmeasurable environmental information is, for example, data related to the internal state of the plant's equipment or the internal state of the power plant that operates the equipment.
- the internal state includes, for example, the state of materials present inside.
- the measurement data is data obtained by measuring the plant's equipment.
- the measurement data may include data obtained by measuring the power plant of the plant.
- the measurement data is, for example, measured by the sensor 20.
- Unmeasurable environmental information is, for example, data on a state of a monitored object that cannot be directly measured.
- unmeasurable environmental information may be data on a monitored object for which a sample cannot be collected for measurement.
- the inability to collect a sample for measurement means that the monitored object has characteristics different from its original characteristics when a sample for measurement is collected. Inability to collect a sample for measurement may also mean that changes progress so quickly that a sample suitable for measurement cannot be obtained.
- the monitored object is activity, which indicates the activity of a catalyst inside a reactor. In this case, when the catalyst is removed from the reactor, the catalyst is deactivated, and it may not be possible to measure the activity of the catalyst. For this reason, the activity of the catalyst is unmeasurable environmental information.
- Environmental information that cannot be measured is, for example, data whose values cannot be obtained within the time required for monitoring the plant.
- Not being able to measure means, for example, that measurements cannot be made in real time using a sensor.
- Not being able to measure means, for example, that measurement results cannot be obtained within the time allowed for monitoring. For example, if the object of monitoring is a clogged pipe, the pipe must be removed from the plant to check for a clog, so that clogging inside the pipe cannot be confirmed during normal operation. In other words, clogging of the pipe cannot be measured in real time.
- the object of monitoring is the degree of polymerization of a product generated by a chemical reaction
- the degree of polymerization must be measured, for example, using a measuring instrument outside the plant using a sampled product. For this reason, it is difficult to measure the degree of polymerization, which needs to be measured with an external measuring instrument, in real time within the time allowed for monitoring. Also, not being able to measure in real time may mean that the change progresses so quickly that the state cannot be identified from the measurement data.
- the environmental information that cannot be measured is, for example, data that cannot be measured by a sensor.
- the data that cannot be measured by a sensor is, for example, data that cannot be directly measured by a sensor.
- the data that cannot be measured by a sensor is, for example, the internal state of the equipment and power unit of the plant.
- the internal state of the equipment of the plant is, for example, one or more of the reaction rate, degree of polymerization, degree of dispersion, catalytic activity, clogging of piping, solvent, and scale.
- the internal state that cannot be measured is not limited to the above.
- the environmental information that cannot be measured may be, for example, data of the equipment and power unit to which a sensor cannot be attached.
- the data that cannot be measured by a sensor may be, for example, data that cannot be measured normally due to vibration or heat generation.
- the environmental information that cannot be measured may be, for example, data that requires a special measurement environment or expensive measurement equipment to measure.
- the monitoring system 10 also predicts the deterioration state of the plant based on, for example, unmeasurable environmental information. Then, the monitoring system 10 estimates the timing of plant maintenance based on, for example, the predicted deterioration state of the plant. The monitoring system 10 outputs the estimated maintenance timing of the plant to, for example, a terminal device 30 used by a plant monitor. In this way, by predicting the deterioration state of the plant based on unmeasurable environmental information such as the internal state of the plant's equipment, the accuracy of the prediction of the deterioration state of the plant is improved. Therefore, by estimating the maintenance timing using the predicted deterioration state based on unmeasurable environmental information, the accuracy of the estimation of the maintenance timing of the plant can be improved.
- FIG. 3 is a diagram showing an example of the configuration of the monitoring system 10.
- the monitoring system 10 basically comprises an acquisition unit 101, an estimation unit 102, a prediction unit 103, a maintenance timing estimation unit 104, and an output unit 109.
- the monitoring system 10 also comprises, for example, a cause estimation unit 105, an effect estimation unit 106, an accuracy estimation unit 107, a plan creation unit 108, and a memory unit 110.
- the acquisition unit 101 acquires measurement data of the plant equipment.
- the acquisition unit 101 acquires the measurement data of the plant equipment from, for example, the sensor 20.
- the acquisition unit 101 may acquire the measurement data of the plant equipment from a plurality of sensors 20.
- the acquisition unit 101 may also acquire the measurement data of the plant equipment via a storage medium.
- the measurement data of the plant equipment is, for example, data obtained by measuring the internal environment of the plant equipment.
- the measurement data of the plant equipment is, for example, data on one or more items of temperature, humidity, pressure, flow rate, flow velocity, transmittance, viscosity, rotation speed, and torque.
- the measurement data of the plant equipment may be data measured from outside the plant equipment.
- the measurement data of the plant equipment may be data obtained by measuring the temperature of the outer surface of the piping.
- the measurement data of the plant equipment is not limited to the above.
- the acquiring unit 101 may acquire the control data of the plant.
- the acquiring unit 101 acquires the control data of the plant, for example, from a control system of the plant, not shown.
- the control data of the plant is, for example, the setting values of the control parameters of the plant.
- the control data of the plant may be the setting values of the control parameters of the plant at multiple points in time on a time series.
- the control data of the plant is, for example, the setting values indicating the operating conditions of the equipment and power unit of the plant.
- the control data of the plant is, for example, data on the setting values of one or more items of temperature, amount of heating, humidity, pressure, amount of pressurization, flow rate, flow velocity, mixing ratio, rotation speed, and torque.
- the control data of the plant is not limited to the above.
- the estimation unit 102 estimates unmeasurable environmental information related to the plant based on the measurement data.
- the estimation unit 102 estimates the unmeasurable environmental information using, for example, an estimation model.
- the estimation model is, for example, a model that estimates unmeasurable environmental information from the measurement data.
- the estimation model is also called an agent.
- the estimation unit 102 estimates the internal state of the plant equipment based on the measurement data.
- the estimation unit 102 may also estimate the unmeasurable environmental information of a power unit that operates the plant equipment based on the measurement data.
- the estimation model is generated, for example, by system identification.
- the estimation model is generated, for example, by using a behavior estimation model that reproduces the behavior of the plant.
- the behavior estimation model estimates output data from input data based on a model that reproduces the internal state of the plant.
- each parameter of the behavior estimation model is determined so that the actually measured input data and output data match the input data and output data of the behavior estimation model.
- the input data may include control data.
- the estimation model estimates the internal state of the plant from the measured input data and output data using each parameter of the determined behavior estimation model.
- the estimation model outputs, for example, a value indicating the estimated internal state as unmeasurable environmental information.
- the measurement data on the inlet side of the unit is, for example, the measurement data upstream of the unit that estimates the internal state.
- the measurement data on the outlet side of the unit is, for example, the measurement data downstream of the unit that estimates the internal state.
- a chemical plant includes pipes A, B, a reactor R, and C.
- the reactor R reacts raw material X supplied through pipe A with raw material Y supplied through pipe B using a catalyst inside.
- the reactor R supplies the synthesized product Z to pipe C.
- the unmeasurable environmental information to be estimated is the activity of the catalyst used in the reaction in the reactor R.
- the measurement data on the inlet side is, for example, the flow rate and temperature of raw material A measured in pipe A, and the flow rate and temperature of raw material B measured in pipe B.
- the measurement data on the outlet side is, for example, the flow rate of product Z measured in pipe C.
- an estimation model that estimates the activity of the catalyst in the reactor R as the unmeasurable environmental information is generated using the measurement data on the inlet side and the measurement data on the outlet side.
- the estimation model is, for example, a model that uses a function with unmeasurable environmental information and entrance measurement data as explanatory variables and exit measurement data as the objective variable.
- the estimation model may be a learning model generated by machine learning.
- the estimation model is generated by learning the relationship between the time series data of the measurement data and the unmeasurable environmental information.
- the estimation model may be generated by learning the relationship between the time series data of the measurement data and the time series data of the control data, and the unmeasurable environmental information.
- the estimation model is generated by deep learning using a neural network, for example.
- the estimation model may also be generated by reinforcement learning.
- the learning algorithm for generating the estimation model is not limited to the above.
- the estimation model is generated in a system external to the monitoring system 10.
- the estimation model may be generated in a learning unit (not shown) in the monitoring system 10.
- the prediction unit 103 predicts the deterioration state of the plant based on at least unmeasurable environmental information.
- the prediction unit 103 may predict the deterioration state of the plant based on measurement data and unmeasurable environmental information.
- the prediction unit 103 may also predict the deterioration state of the plant based on measurement data, control data, and unmeasurable environmental information.
- the deterioration state of the plant is the deterioration state of at least one of the equipment and the power unit of the plant.
- the prediction unit 103 predicts the deterioration state of the equipment based on, for example, the internal state of the equipment.
- the prediction unit 103 may also predict the deterioration state of the power unit based on unmeasurable environmental information of the power unit.
- the prediction unit 103 predicts the time series change in the deterioration degree of the plant based on, for example, unmeasurable environmental information.
- the deterioration degree of the plant is, for example, an index that indicates the progress of deterioration of the plant.
- the deterioration degree of the plant is, for example, an index whose value increases as the deterioration of the plant progresses.
- the deterioration degree of the plant may be, for example, an index whose value decreases as the deterioration of the plant progresses.
- the prediction unit 103 may predict the time series change in the deterioration degree of the plant based on measurement data and unmeasurable environmental information.
- the prediction unit 103 may predict the time series change in the deterioration degree of the plant based on measurement data, control data, and unmeasurable environmental information.
- the time series change in the deterioration degree of a plant is, for example, the result of predicting how the deterioration degree will change in the future based on measurement data up to the present time and unmeasurable environmental information.
- the prediction unit 103 predicts, for example, time series data of the deterioration degree of the plant as the time series change in the deterioration degree of the plant.
- the deterioration degree of the plant is, for example, an index based on unmeasurable information. For example, when maintenance of a plant is performed according to the degree of clogging of piping used in the plant's equipment, the deterioration degree of the plant is an index based on the extent to which the piping is clogged.
- the prediction unit 103 predicts time series data of downstream measurement data based on time series data of measurement data upstream of the unit for which the degree of deterioration is to be predicted and control data, for example, using a simulator.
- the prediction unit 103 obtains time series data of unmeasurable environmental information estimated by an estimation model based on values calculated by the simulator.
- the prediction unit 103 then predicts time series data of the degree of deterioration based on the time series data of unmeasurable environmental information.
- the prediction unit 103 may estimate the degree of deterioration using a deterioration prediction model.
- the deterioration prediction model is, for example, a learning model that estimates the degree of deterioration based on unmeasurable environmental information.
- the deterioration prediction model predicts time series data of the degree of deterioration based on time series data of unmeasurable environmental information.
- the deterioration prediction model may be a learning model that estimates the degree of deterioration based on measurement data and unmeasurable environmental information.
- the deterioration prediction model may be a learning model that estimates the degree of deterioration based on measurement data, control data, and unmeasurable environmental information.
- the deterioration prediction model is generated by learning the relationship between the unmeasurable environmental information and the deterioration degree.
- the deterioration prediction model may be generated by learning the relationship between the measurement data and unmeasurable environmental information, and the deterioration degree.
- the deterioration prediction model may be generated by learning the relationship between the measurement data, control data, and unmeasurable environmental information, and the deterioration degree.
- the deterioration prediction model is generated by, for example, deep learning using a neural network.
- the learning algorithm for generating the deterioration prediction model is not limited to the above.
- the deterioration prediction model is generated, for example, in a system external to the monitoring system 10.
- the deterioration prediction model may be generated in a learning unit (not shown) within the monitoring system 10.
- the degree of deterioration of the plant may be an index estimated based on multiple pieces of unmeasurable environmental information.
- the degree of deterioration of the plant may be an index estimated by weighting each of the multiple pieces of unmeasurable environmental information.
- the maintenance timing estimation unit 104 estimates the maintenance timing of the plant based on the predicted result of the deterioration state.
- the maintenance timing estimation unit 104 estimates the maintenance timing of the plant based on, for example, the time when the deterioration state of the plant in the predicted result of the deterioration state exceeds a predetermined standard.
- the maintenance timing estimation unit 104 estimates, for example, the time when the value of the time-series data of the deterioration degree exceeds a predetermined standard as the maintenance timing of the plant.
- the predetermined standard is set, for example, as the standard for performing maintenance of the plant when the value of the deterioration degree reaches a value indicated by the standard. In other words, the predetermined standard is set, for example, using the value of the deterioration degree when the state of the plant reaches a state where it is necessary to perform plant maintenance.
- the predetermined standard is set, for example, by a plant supervisor or manager.
- the maintenance timing estimation unit 104 may estimate the maintenance timing of multiple stages.
- a predetermined criterion is set for each of the multiple stages.
- the piping inspection may be further divided into multiple stages.
- the piping inspection may be further divided into multiple stages with different inspection items. For example, the inspection items are divided into hammering inspection, inspection using equipment, and inspection by sample acquisition according to the elapsed time since the piping was replaced.
- the maintenance timing estimation unit 104 may estimate the maintenance timing of the later stage in each of the cases where the multiple stages of maintenance have been performed and where they have not been performed. For example, when maintenance is divided into two stages, piping cleaning and replacement, the maintenance timing estimation unit 104 may estimate the maintenance timing of piping replacement depending on whether the piping has been cleaned or not.
- the cause estimation unit 105 estimates the cause of the deterioration state of the plant based on, for example, the measurement data and the unmeasurable environmental information. For example, the cause estimation unit 105 compares each of the measurement data and the unmeasurable environmental information with a reference value. Then, the cause estimation unit estimates the cause of the deterioration based on, for example, items in the measurement data and the unmeasurable environmental information that deviate from the reference value. The cause estimation unit 105 estimates the cause of the deterioration based on events assumed from items in the measurement data and the unmeasurable environmental information that deviate from the reference value. For example, if the temperature in the reactor is higher than the appropriate range, the catalyst activity decreases faster and deterioration progresses.
- the cause estimation unit 105 estimates that the deterioration state is caused by the deterioration of the catalyst activity due to the temperature in the reactor.
- the cause of the deterioration state is set in a table showing, for example, each item of the measurement data and the unmeasurable environmental information and the cause of the deterioration state.
- the cause estimation unit 105 may estimate the cause of the deterioration state of the plant based on the measurement data, control data, and unmeasurable environmental information. For example, the cause estimation unit 105 compares each of the measurement data, control data, and unmeasurable environmental information with a reference value.
- the cause estimation unit 105 estimates the cause of the deterioration based on, for example, items of the measurement data, control data, and unmeasurable environmental information that deviate from the reference value.
- the reference values of the measurement data, control data, and unmeasurable environmental information are set, for example, in a table that indicates the relationship between the measurement data, control data, and unmeasurable environmental information and the reference values.
- the cause estimation unit 105 may estimate the cause of deterioration of the plant based on, for example, the deviation of the measurement data and the non-measurable environmental information from their respective reference values.
- the cause estimation unit 105 may score the degree of influence on the deterioration state of the plant based on, for example, the deviation of the measurement data and the non-measurable environmental information from their respective reference values. For example, the score is set so that the greater the influence on the deterioration state of the plant, the higher the score. Then, the cause estimation unit 105 estimates the cause of deterioration based on the item with the highest score.
- the score indicating the degree of influence on the deterioration level is set, for example, in a table indicating the relationship between the deviation of the measurement data and the non-measurable environmental information from their respective reference values and the score.
- the score indicating the degree of influence on the deterioration level may be set using a function indicating the relationship between the deviation of the measurement data and the non-measurable environmental information from their respective reference values and the score.
- the cause estimation unit 105 may estimate an item with a score equal to or higher than the reference value as the cause of deterioration.
- the cause estimation unit 105 may also estimate a predetermined number of items with the highest scores as the cause of deterioration.
- the cause estimation unit 105 may estimate the cause of deterioration of the plant based on at least one of the length of time and the number of times that the measurement data and the unmeasurable environmental information deviate from the standard, and the amount of deviation from the standard value.
- the cause estimation unit 105 may estimate the cause of deterioration of the plant using a cause estimation model.
- the cause estimation model is, for example, a learning model that has learned the relationship between the measurement data and unmeasurable environmental information, and the cause of deterioration.
- the cause estimation model estimates the cause of deterioration based on, for example, the measurement data and unmeasurable environmental information.
- the cause estimation model takes, for example, the measurement data and unmeasurable environmental information as input, and outputs an estimation result of the cause of deterioration.
- the cause estimation model may be a learning model that has learned the relationship between the measurement data, control data, and unmeasurable environmental information, and the cause of deterioration.
- the cause estimation model estimates the cause of deterioration based on, for example, the measurement data, control data, and unmeasurable environmental information.
- the cause estimation model takes, for example, the measurement data, control data, and unmeasurable environmental information as input, and outputs an estimation result of the cause of deterioration.
- the cause estimation model is generated, for example, by deep learning using a neural network.
- the cause estimation model is generated, for example, by learning using feature vectors converted from the time series data of the measurement data and the unmeasurable environmental information as input data and the causes of deterioration as labels.
- the learning algorithm for generating the cause estimation model is not limited to the above.
- the cause estimation model is generated, for example, in a system external to the monitoring system 10.
- the cause estimation model may also be generated in a learning unit (not shown) within the monitoring system 10.
- the effect estimation unit 106 estimates the effect of plant maintenance to be performed at the estimated maintenance time, for example, based on the predicted values of measurement data and the predicted values of unmeasurable environmental information in the case where plant maintenance is not performed.
- the effect estimation unit 106 may estimate the effect of plant maintenance to be performed at the estimated maintenance time, based on the predicted values of measurement data, control data, and the predicted values of unmeasurable environmental information.
- the effect estimation unit 106 estimates the degree of improvement of the deterioration state of the plant due to the maintenance performed at the estimated maintenance time.
- the effect estimation unit 106 estimates the degree of improvement based on, for example, the state of the plant if maintenance was not performed and the state of the plant expected after maintenance.
- the effect estimation unit 106 for example, predicts time series data of the time series data from the time series data of the measurement data up to the current time point.
- the current time point is, for example, the time point on the time series at which the effect estimation unit 106 estimates the degree of improvement of the deterioration state of the plant.
- the effect estimation unit 106 estimates the value of the unmeasurable environmental information at each time point after the current time point using, for example, an estimation model.
- the effect estimation unit 106 sets, for example, the estimated value of the unmeasurable environmental information at each time point after the current time point as the predicted value at each time point. For example, data on the state of the plant after maintenance performed in the past is used for the state of the plant expected after maintenance.
- the effect estimation unit 106 estimates, for example, the degree of improvement in the production efficiency of the plant due to maintenance performed at the estimated maintenance time.
- the production efficiency of the plant is calculated, for example, based on unmeasurable environmental information.
- the effect estimation unit 106 estimates the degree of improvement in the production efficiency based, for example, on an index of production efficiency calculated based on unmeasurable environmental information and an estimated value of an index of production efficiency when maintenance is performed.
- the effect estimation unit 106 calculates the yield of the reactant based on the activity of the catalyst. Then, the effect estimation unit 106 estimates the degree of improvement in the yield of the reactant based on the calculated yield of the reactant and the estimated yield of the reactant after maintenance.
- the target for estimating the effect of maintenance is not limited to the above.
- the accuracy estimation unit 107 estimates, for example, the accuracy of the estimated value of the unmeasurable environmental information.
- the accuracy estimation unit 107 estimates the accuracy of the estimated value of the unmeasurable environmental information based on, for example, the result of comparing the measurement data of the plant with the value of the simulator. For example, assume that a discrepancy occurs between the measurement data of the plant corresponding to the output value of the simulator and the output value of the simulator. In this case, the accuracy estimation unit 107 matches, for example, a parameter of the simulator that corresponds to the unmeasurable environmental information with the estimated value of the unmeasurable environmental information estimated by the estimation unit 102.
- the accuracy estimation unit 107 determines that the accuracy of the estimated value of the unmeasurable environmental information is high.
- the predetermined standard is set, for example, by a monitor or a manager.
- the unmeasurable environmental information is the activity of a catalyst
- the measurement data is temperature.
- the accuracy estimation unit 107 matches the parameters of the simulator to the estimated value of the activity of the catalyst, which is the unmeasurable environmental information. If, as a result of the matching, the difference between the temperature of the measurement data and the temperature of the output value of the simulator falls within a predetermined standard, the accuracy estimation unit 107 determines that the accuracy of the estimated value of the unmeasurable environmental information is high.
- the accuracy estimation unit 107 may also estimate an index of the accuracy of the estimated value of the unmeasurable environmental information based on the difference between the measurement data and the output value of the simulator.
- the accuracy estimation unit 107 normalizes the difference between the measurement data and the output value of the simulator using the average value of the corresponding measurement data. Then, the accuracy estimation unit 107 estimates the accuracy of the estimated value of the unmeasurable environmental information using, for example, the absolute value of the normalized value as an index. For example, the accuracy estimation unit 107 estimates the accuracy of the estimated value of the unmeasurable environmental information such that the smaller the absolute value of the normalized value is, the higher the accuracy of the estimated value of the environmental information is.
- the plan creation unit 108 creates an operation plan for the plant to improve the deterioration state based on, for example, the measurement data, the unmeasurable environmental information, and the control data of the plant.
- the plan creation unit 108 creates, for example, control data to suppress the progression of deterioration of the plant.
- the plan creation unit 108 may determine a change value of the control data so that the progression of deterioration of the plant can be suppressed based on the measurement data and the unmeasurable environmental information. Then, the plan creation unit 108 creates control data to suppress the progression of deterioration of the plant based on, for example, the change value of the control data.
- the relationship between the measurement data and the unmeasurable environmental information, and the control data that suppresses deterioration or the change value of the control data is set as data in a table format.
- the relationship between the measurement data and the unmeasurable environmental information, and the control data that suppresses deterioration may be established using a function.
- the plan creation unit 108 creates, for example, time series data of the control data as an operation plan. For example, when suppressing the temperature of the reactor will lengthen the time until the maintenance period, the plan creation unit 108 creates, for example, time series data of the temperature setting value as an operation plan.
- the output unit 109 outputs the maintenance timing estimated by the maintenance timing estimation unit 104.
- the output unit 109 outputs the maintenance timing estimated by the maintenance timing estimation unit 104 to, for example, the terminal device 30.
- the output unit 109 outputs the maintenance timing estimated by the maintenance timing estimation unit 104 to a display device (not shown) connected to the monitoring system 10.
- the output unit 109 may output at least one of the measurement data, the estimated non-measurable environmental information, and the control data.
- the output unit 109 outputs at least one of the measurement data, the estimated non-measurable environmental information, and the control data to, for example, the terminal device 30.
- the output unit 109 may output the cause of deterioration estimated by the cause estimation unit 105.
- the output unit 109 outputs the cause of deterioration estimated by the cause estimation unit 105 to, for example, the terminal device 30.
- the output unit 109 may output information on the items that cause the deterioration of the plant estimated by the cause estimation unit 105 in association with the maintenance timing.
- the output unit 109 may output the effect of the maintenance estimated by the effect estimation unit 106 in addition to the estimated maintenance timing.
- the output unit 109 outputs the effect of the maintenance to, for example, the terminal device 30.
- the output unit 109 may output the accuracy of the estimation of the maintenance timing estimated by the accuracy estimation unit 107 in addition to the estimated maintenance timing.
- the output unit 109 outputs the accuracy of the estimation of the maintenance timing estimated by the accuracy estimation unit 107 to, for example, the terminal device 30.
- the output unit 109 may output the operation plan created by the plan creation unit 108 in addition to the estimated maintenance timing.
- the output unit 109 outputs the created operation plan to, for example, the terminal device 30.
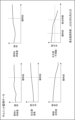
- FIG. 4 shows an example of a display screen showing the results of estimating the timing of maintenance.
- the example of the display screen in FIG. 4 is a screen that displays data related to the "R unit", which is a reactor.
- the example of the display screen in FIG. 4 shows graphs of "Feedstock A supply amount”, “Feedstock B supply amount”, “Reactor temperature”, “Catalyst activity”, and "Deterioration level (estimated value)".
- the vertical axis of the graph of "raw material A supply amount” is a graph showing the flow rate of "raw material A” supplied to the reactor.
- the horizontal axis of the graph of "raw material A supply amount” is a graph showing time.
- the "current time” on the horizontal axis of the graph of "raw material A supply amount” shows, for example, the time at the time of displaying the display screen.
- the data on the left side of the current time is the measurement data of the flow rate by the sensor 20.
- the data on the right side of the current time shows the estimated value of the flow rate after the current time, which is estimated based on the measurement data.
- the vertical axis of the graph of "raw material B supply amount” is a graph showing the flow rate of "raw material B" supplied to the reactor.
- the horizontal axis of the graph of "raw material B supply amount” shows time.
- the vertical axis of the graph of "reactor temperature” shows the measured value of the temperature inside the reactor.
- the horizontal axis of the graph for "Reactor temperature” indicates time.
- the data to the left of the current time is flow rate measurement data obtained by sensor 20. Additionally, in the graph for "Feedstock A supply amount,” the data to the right of the current time indicates the estimated flow rate from the current time onward, estimated based on the measurement data.
- the vertical axis of the "catalyst activity” graph indicates an estimate of the activity of the catalyst in the reactor.
- the estimate of the catalyst activity is unmeasurable environmental information estimated by the estimation unit 102 based on measurement data.
- the horizontal axis of the "reactor temperature” graph indicates time.
- the data to the left of the current time is an estimate of the catalyst activity estimated based on the measurement data by the sensor 20.
- the data to the right of the current time indicates an estimate of the catalyst activity from the current time onwards, estimated by the estimation unit 102 based on the estimate up to the current time.
- the vertical axis of the graph of "Deterioration level (predicted value)" is the value of the deterioration level of the plant. It is the predicted value of the deterioration level of the plant predicted by the prediction unit 103.
- the data on the left side of the current time is the deterioration level calculated by the prediction unit 103.
- the deterioration level is an index whose value becomes smaller as deterioration progresses.
- the data on the right side of the current time indicates, for example, the predicted value of the deterioration level after the current time predicted by the prediction unit 103.
- “Maintenance timing” indicates the time of the maintenance timing estimated by the maintenance timing estimation unit 104.
- information indicating the maintenance timing estimated by the maintenance timing estimation unit 104 is displayed as "Recommended maintenance timing: June 24, 2023". For example, a plant supervisor can appropriately determine the maintenance timing of the plant equipment by referring to the display screen of FIG. 4.
- FIG. 5 is a diagram showing an example of a display screen that further displays the accuracy of the estimation result of the maintenance timing in addition to the display contents similar to those of FIG. 4.
- graphs of "Feedstock A supply amount”, “Feedstock B supply amount”, “Reactor temperature”, “Catalyst activity” and “Deterioration degree (estimated value)" are displayed as in FIG. 4.
- information indicating the maintenance timing estimated by the maintenance timing estimation unit 104 is displayed as in FIG. 4.
- the accuracy of the estimation of the maintenance timing estimated by the accuracy estimation unit 107 is further displayed.
- information indicating the estimation accuracy estimated by the accuracy estimation unit 107 is displayed as "Estimated accuracy 95 percent".
- a plant supervisor can judge the validity of the estimation result of the maintenance timing of the plant equipment by referring to the display screen of FIG. 5.
- FIG. 6 is a diagram showing an example of a display screen that further displays the results of estimating the cause of the deterioration state of the plant in addition to the display contents similar to those of FIG. 4.
- graphs of "Feedstock A supply amount”, “Feedstock B supply amount”, “Reactor temperature”, “Catalyst activity” and “Deterioration degree (estimated value)" are displayed, as in FIG. 4.
- information indicating the maintenance timing estimated by the maintenance timing estimation unit 104 is displayed, as in FIG. 4.
- "Cause of deterioration” is information indicating the cause of deterioration of the plant estimated by the cause estimation unit 105.
- the cause of deterioration of the plant estimated by the cause estimation unit 105 is displayed as "Reactor temperature high" and "Feedstock A supply amount large”.
- the plant supervisor can easily grasp the cause of the deterioration state of the plant and the maintenance timing.
- the plant supervisor can more appropriately determine the operation and maintenance timing of the plant.
- the memory unit 110 stores, for example, data related to the plant.
- the data related to the plant is, for example, data related to prediction of the deterioration state of the plant.
- the data related to prediction of the deterioration state of the plant is, for example, measurement data of the plant's equipment and control data of the plant. It is the estimation result of unmeasurable environmental information and the prediction result of the deterioration state of the plant.
- the data related to prediction of the deterioration state of the plant may be, for example, the estimation result of the cause of deterioration of the plant, the estimation result of the effect of plant maintenance, the estimation result of the accuracy of the estimated value of unmeasurable environmental information, and the plant operation plan.
- the data related to prediction of the deterioration state of the plant stored in the memory unit 110 is not limited to the above.
- the storage unit 110 may further store a table relating to standards set for predicting the deterioration state of the plant.
- the storage unit 110 may store a learning model relating to predicting the deterioration state of the plant.
- the storage unit 110 stores, for example, an estimation model.
- the storage unit 110 stores, for example, a deterioration degree prediction model.
- the storage unit 110 stores, for example, a cause estimation model.
- the estimation model, the deterioration degree prediction model, and the cause estimation model may be stored in a storage means other than the storage unit 110.
- the sensor 20 measures, for example, the state of the plant equipment.
- the sensor 20 outputs the measured data to, for example, the acquisition unit 101 of the monitoring system 10.
- the sensor 20 may be installed at multiple locations in the plant equipment. Also.
- the sensor 20 may be installed in each of the multiple facilities of the plant.
- a type of sensor according to the physical quantity to be measured is used for the sensor 20.
- a temperature sensor, a pressure sensor, a flow meter, a flow meter, a viscometer, a transmittance sensor, or a torque measuring instrument is used for the sensor 20.
- the sensor 20 is not limited to the above.
- the sensor 20 measures data of at least one item of, for example, temperature, flow rate, flow velocity, pressure, vibration, and transmittance in the piping of the plant.
- the data items that the sensor 20 measures are not limited to the above.
- the measurement target is not limited to the piping of the plant.
- the sensor 20 may be installed in a power plant of the plant.
- the sensor 20 measures, for example, the state of the power plant of the plant.
- the terminal device 30 is, for example, a terminal device used to monitor the state of the plant.
- the terminal device 30 is, for example, a terminal device used by a plant monitor to check the estimation result of the maintenance timing.
- the terminal device 30 acquires the estimation result of the maintenance timing from, for example, the output unit 109 of the monitoring system 10. Then, the terminal device 30 outputs the estimation result of the maintenance timing to a display device not shown.
- the terminal device 30 may acquire the effect of maintenance from the output unit 109 of the monitoring system 10. Then, for example, the terminal device 30 outputs the effect of maintenance to a display device not shown.
- the terminal device 30 may acquire the cause of deterioration of the plant from the output unit 109 of the monitoring system 10.
- the terminal device 30 outputs the cause of deterioration of the plant to, for example, a display device not shown.
- the terminal device 30 may acquire an operation plan from, for example, the output unit 109 of the monitoring system 10. Then, the terminal device 30 outputs the operation plan to, for example, a display device not shown.
- terminal device 30 For example, a personal computer, a tablet computer, a smartphone, or a wearable terminal device is used as the terminal device 30.
- terminal devices used as the terminal device 30 are not limited to the above.
- Figure 7 is a diagram showing an example of the operation flow in the process of the monitoring system 10 to estimate the maintenance timing.
- the acquisition unit 101 acquires measurement data related to the plant equipment (step S11).
- the acquisition unit 101 acquires the measurement data related to the plant equipment from, for example, the sensor 20.
- the estimation unit 102 estimates unmeasurable environmental information on the plant based on the measurement data on the equipment (step S12).
- step S13 If there is unmeasurable environmental information data required for deterioration prediction (Yes in step S13), the prediction unit 103 predicts the deterioration state of the plant based on the unmeasurable environmental information (step S14).
- the maintenance timing estimation unit 104 estimates the maintenance timing of the plant based on the predicted deterioration state (step S15).
- the output unit 109 When the plant maintenance time is estimated, the output unit 109 outputs the plant maintenance time (step S16). The output unit 109 outputs the plant maintenance time to, for example, the terminal device 30.
- step S13 if there is no unmeasurable environmental information data required for deterioration prediction (No in step S13), for example, the process returns to step S11, and the acquisition unit 101 acquires measurement data of the plant equipment.
- the monitoring system 10 estimates unmeasurable environmental information related to the plant based on the measurement data of the plant's equipment.
- the monitoring system 10 also estimates the deterioration state of the plant based on the estimated unmeasurable environmental information.
- the monitoring system 10 estimates the maintenance timing of the plant based on the predicted deterioration state of the plant. For example, the monitoring system 10 estimates the internal state of the equipment based on the measurement data of the plant's equipment.
- the monitoring system 10 also predicts, for example, the deterioration state of the plant's equipment.
- the monitoring system 10 estimates the maintenance timing of the plant's equipment based on the predicted deterioration state of the plant's nodal equipment.
- the monitoring system 10 can appropriately estimate the maintenance timing according to the unmeasurable state of the plant. Therefore, by using the monitoring system 10, the accuracy of estimating the maintenance timing of the plant can be improved.
- the monitoring system 10 can estimate the appropriate maintenance timing according to the internal state of the plant equipment. For example, if the plant equipment is piping, the monitoring system 10 can estimate the maintenance timing according to the internal state of the piping. By estimating the maintenance timing according to the internal state of the piping, it is possible to prevent the occurrence of malfunctions in the plant due to delays in replacement and maintenance of piping while it is still in a usable state. In other words, the monitoring system 10 can appropriately estimate the maintenance timing of the piping. In this way, by using the monitoring system 10, it is possible to estimate the appropriate maintenance timing of the plant.
- the processes in the monitoring system 10 may be distributed and executed in a plurality of information processing devices connected via a network.
- the process of estimating unmeasurable environmental information in the estimation unit 102, the process of predicting the deterioration state of the plant in the prediction unit 103, and the process of estimating the maintenance timing in the maintenance timing estimation unit 104 may be executed in different information processing devices.
- the process of estimating unmeasurable environmental information in the estimation unit 102, the process of predicting the deterioration state of the plant in the prediction unit 103, and the process of estimating the maintenance timing in the maintenance timing estimation unit 104 may be executed in different information processing devices. Which of the processes executed in the monitoring system 10 is executed in the terminal device can be set as appropriate.
- FIG. 8 shows an example of the configuration of a computer 200 that executes a computer program that performs each process in the monitoring system 10.
- the computer 200 comprises a CPU (Central Processing Unit) 201, memory 202, a storage device 203, an input/output I/F (Interface) 204, and a communication I/F 205.
- CPU Central Processing Unit
- the CPU 201 reads out and executes computer programs for performing each process from the storage device 203.
- the CPU 201 may be configured by a combination of multiple CPUs.
- the memory 202 is configured by a DRAM (Dynamic Random Access Memory) or the like, and temporarily stores the computer programs executed by the CPU 201 and data being processed.
- the storage device 203 stores the computer programs executed by the CPU 201.
- the storage device 203 is configured by, for example, a non-volatile semiconductor storage device. Other storage devices such as a hard disk drive may be used for the storage device 203.
- the input/output I/F 204 is an interface that receives input from the operator and outputs display data, etc.
- the communication I/F 205 is an interface that transmits and receives data between the sensor 20 and the terminal device 30.
- the terminal device 30 may also have a similar configuration to the computer 200.
- the computer programs used to execute each process can also be distributed by storing them on a computer-readable recording medium that non-temporarily records data.
- a computer-readable recording medium for example, a magnetic tape for recording data or a magnetic disk such as a hard disk can be used.
- an optical disk such as a CD-ROM (Compact Disc Read Only Memory) can also be used as the recording medium.
- a non-volatile semiconductor memory device can also be used as the recording medium.
- a surveillance system comprising:
- the estimation means estimates an internal state of the equipment based on the measurement data,
- the prediction means predicts a deterioration state of the inside of the facility based on the internal state of the facility. 2.
- the estimation means estimates unmeasurable environmental information of a power plant that operates equipment of the plant based on the measurement data;
- the prediction means predicts a deterioration state of the power plant based on unmeasurable environmental information of the power plant. 2.
- the acquiring means further acquires control data relating to the plant;
- the estimation means estimates unmeasurable environmental information regarding the plant based on the measurement data and the control data. 4.
- a monitoring system according to any one of claims 1 to 3.
- the prediction means predicts a deterioration state of the plant based on the measurement data, the control data, and the unmeasurable environmental information. 5. The monitoring system of claim 4.
- Appendix 7 an effect estimation means for estimating an effect of the maintenance of the plant based on the estimated value of the measurement data and the estimated value of the unmeasurable environmental information;
- the output means further outputs the effect of the maintenance. 4.
- a monitoring system according to any one of claims 1 to 3.
- Appendix 8 an influence estimation unit that estimates an influence of at least one of the measurement data and the unmeasurable environmental information on the prediction of the degradation state, The output means further outputs the estimated degree of influence. 4. A monitoring system according to any one of claims 1 to 3.
- the system further includes an accuracy estimation unit for estimating accuracy of the estimated value of the unmeasurable environmental information,
- the output means further outputs the estimated accuracy. 4.
- a monitoring system according to any one of claims 1 to 3.
- Appendix 10 a planning unit that creates an operation plan for the plant to improve the deteriorated state based on the measurement data, the unmeasurable environmental information, and control data of the plant; The output means further outputs the operation plan. 4.
- a monitoring system according to any one of claims 1 to 3.
- [Appendix 11] Acquire measurement data on plant equipment, estimating unmeasurable environmental information about the plant based on the measurement data; predicting a deterioration state of the facility based on at least the unmeasurable environmental information; estimating a maintenance timing for the plant based on the predicted deterioration state; outputting the estimated maintenance time; Monitoring methods.
- Appendix 12 A process of acquiring measurement data relating to equipment of a plant; estimating non-measurable environmental information about the plant based on the measurement data; A process of predicting a deterioration state of the facility based on at least the unmeasurable environmental information; A process of estimating a maintenance timing of the plant based on the predicted result of the deterioration state; and a process of outputting the estimated maintenance time.
Landscapes
- Engineering & Computer Science (AREA)
- General Physics & Mathematics (AREA)
- Theoretical Computer Science (AREA)
- Physics & Mathematics (AREA)
- Software Systems (AREA)
- Business, Economics & Management (AREA)
- Mathematical Physics (AREA)
- Automation & Control Theory (AREA)
- Medical Informatics (AREA)
- Data Mining & Analysis (AREA)
- Computing Systems (AREA)
- General Engineering & Computer Science (AREA)
- Computer Vision & Pattern Recognition (AREA)
- Artificial Intelligence (AREA)
- Manufacturing & Machinery (AREA)
- Evolutionary Computation (AREA)
- Health & Medical Sciences (AREA)
- Economics (AREA)
- General Health & Medical Sciences (AREA)
- Human Resources & Organizations (AREA)
- Marketing (AREA)
- Primary Health Care (AREA)
- Strategic Management (AREA)
- Tourism & Hospitality (AREA)
- General Business, Economics & Management (AREA)
- Testing And Monitoring For Control Systems (AREA)
Abstract
監視システムは、取得部と、推定部と、予測部と、出力部を備える。取得部は、プラントの設備に関する計測データを取得する。推定部は、計測データに基づいて、プラントに関する計測できない環境情報を推定する。予測部は、少なくとも計測できない環境情報に基づいて、プラントの劣化状態を予測する。出力部は、推定した保全時期を出力する。
Description
本開示は、監視システム等に関する。
工場のプラントでは、例えば、設備の保全が行われる。プラントの設備の保全では、例えば、設備の内外の状態の点検、設備に用いられている部材の交換、または、設備に用いられている部材の清掃の作業が行われる。プラントの設備の保全において、例えば、プラントの設備の保全が適切な時期よりも早い場合には、例えば、稼働の停止または部材の使用が頻繁に行われることによってプラント運転の効率が低下し得る。また、プラントの設備の保全が適切な時期よりも遅い場合には、例えば、事故または生産効率の低下が生じ得る。このため、プラントの設備の保全は、適切な時期に行われることが望ましい。
特許文献1の保守管理システムは、発電プラントの点検対象それぞれについて実測データと、物理モデルを用いた演算結果を比較する。そして、特許文献1の保守管理システムは、比較結果に基づいて、次回の点検における点検対象を選別する。
特許文献1に記載された技術では、保全時期を適切に推定することが難しい場合がある。
本開示は、上記の課題を解決するため、保全時期の推定の精度を向上することができる監視システム等を提供することを目的とする。
上記の課題を解決するため、本開示の監視システムは、プラントの設備に関する計測データを取得する取得手段と、計測データに基づいて、プラントに関する計測できない環境情報を推定する推定手段と、少なくとも計測できない環境情報に基づいて、プラントの劣化状態を予測する予測手段と、劣化状態の予測結果に基づいて、プラントの保全時期を推定する保全時期推定手段と、推定した保全時期を出力する出力手段とを備える。
本開示の監視方法は、プラントの設備に関する計測データを取得し、計測データに基づいて、プラントに関する計測できない環境情報を推定し、少なくとも計測できない環境情報に基づいて、設備の劣化状態を予測し、劣化状態の予測結果に基づいて、プラントの保全時期を推定し、推定した前記保全時期を出力する。
本開示の記録媒体は、プラントの設備に関する計測データを取得する処理と、計測データに基づいて、プラントに関する計測できない環境情報を推定する処理と、少なくとも計測できない環境情報に基づいて、設備の劣化状態を予測する処理と、劣化状態の予測結果に基づいて、プラントの保全時期を推定する処理と、推定した保全時期を出力する処理とをコンピュータに実行させる監視プログラムを非一時的に記録する。
本開示によると、保全時期の推定の精度を向上することができる。
本開示の実施形態について図を参照して詳細に説明する。図1は、本実施形態のプラント監視システムの構成の例を示す図である。プラント監視システムは、例えば、監視システム10と、センサ20と、端末装置30を備える。監視システム10は、例えば、ネットワークを介して、センサ20と接続する。また、監視システム10は、例えば、ネットワークを介して、端末装置30と接続する。監視システム10は、記憶媒体を介して、センサ20の計測データを取得してもよい。センサ20および端末装置30は、複数であってもよい。センサ20および端末装置30の数は、適宜、設定され得る。
プラント監視システムは、例えば、プラントの稼働状態を監視するシステムである。プラントの監視員は、例えば、稼働状態を参照して、プラントの制御およびプラントの保全に関する決定を行う。プラントの保全に関する決定は、例えば、保全の対象、作業項目および保全の時期の決定である。
監視システム10は、例えば、プラントの保全時期を推定するシステムである。プラントの保全とは、例えば、プラントを適切な状態で稼働できるように維持する活動である。プラントの保全とは、例えば、プラントの設備の保全である。プラントの保全は、例えば、プラントの設備の点検、交換、補修、調整および清掃のうち1つまたは複数の作業である。プラントの保全は、上記に限られない。プラントの保全には、プラントの動力装置の保全が含まれてもよい。また、プラントの保全時期は、プラントの保全に関する作業を行う時期である。例えば、プラントの保全がプラントの設備の保全である場合に、プラントの保全時期は、プラントの設備の点検、交換、補修、調整および清掃のうち1つまたは複数の作業を行う時期である。
プラントは、例えば、化学工場のプラントである。プラントは、化学工場以外の工場のプラントであってもよい。例えば、プラントは、製鉄工場のプラントであってもよい。また、プラントは、ごみ焼却場、発電所、ダム、下水処理場または浄水場のプラントであってもよい。プラントが用いられる施設は、上記に限られない。また、プラントは、内燃機関、発電装置、冷却装置、供給装置、浄化装置または空調装置であってもよい。プラントに該当する機器は、上記に限られない。
プラントの設備は、例えば、配管、バルブ、加圧器、減圧器、燃焼器、反応器、蒸留器、冷却器、成型器、濾過器、射出器および撹拌器のうち1つまたは複数のユニットである。プラントの設備は、上記に限られない。また、プラントの動力装置は、例えば、ポンプ、ブロワ、ファンおよびコンプレッサーのうち1つまたは複数の装置である。プラントの動力装置は、上記に限られない。
図2は、化学プラントの例を模式的に示す図である。図2の化学プラントの例では、反応器に関するデータを計測する複数のセンサが取り付けられている。図2の化学プラントの例では、反応器の入口側の配管と、出口側の配管に流量センサが取り付けられている。また、図2の化学プラントの例では、反応器に温度センサが取り付けられている。流量センサおよび温度センサは、センサ20の例である。センサ20は、流量センサおよび温度センサに限られない。また、センサ20は、反応器以外のユニットに関するデータを計測するように取り付けられていてもよい。
プラントの保全時期の推定には、例えば、プラントの劣化予測の結果が用いられる。プラントの劣化予測は、例えば、計測できない環境情報を基に行われる。計測できない環境情報は、例えば、プラントの稼働中に計測できない環境情報である。プラントの稼働中に計測できない環境情報は、例えば、原理的に計測できない環境情報、または、プラントの監視する上で、プラントの稼働中に有意なデータを得ることができない環境情報である。計測できない環境情報には、計測環境を整えることが困難な環境情報が含まれてもよい。計測できない環境情報は、例えば、プラントの設備の内部状態または設備を動作させる動力装置の内部状態に関するデータである。内部状態には、例えば、内部に存在する物質の状態が含まれる。また、計測データは、プラントの設備を計測したデータである。計測データは、プラントの動力装置を計測したデータが含まれてもよい。計測データは、例えば、センサ20によって計測される。
計測できない環境情報とは、例えば、監視対象の状態のうち、直接、計測することができない状態に関するデータである。例えば、計測できない環境情報は、計測用の試料を採取できない監視対象に関するデータであってもよい。計測用の試料を採取できないことには、計測用の試料を採取すると監視の対象が本来の特性とは異なる特性になることをいう。また、計測用の試料を採取できないことは、変化の進行が早く、計測に適切な試料を得られないことであってもよい。図2の化学プラントの例において、監視の対象が反応器の内部における触媒の活性を示す活性度であるとする。この場合において、触媒を反応器から取り出すと、触媒が失活してしまい、触媒の活性度を計測できないことがある。このため、触媒の活性度は、計測できない環境情報である。
計測できない環境情報とは、例えば、プラントを監視する上で要求される時間内において、値を取得することができないデータである。計測できないとは、例えば、センサによってリアルタイムに計測を行えないことである。計測できないとは、例えば、監視において許容される時間内において、計測結果を得られないことをいう。例えば、監視の対象が配管のつまりである場合に、つまりの確認のためには配管をプラントから外す必要があるため通常の運転時には配管の内部のつまりを確認することはできない。すなわち、配管のつまりは、リアルタイムに計測を行うことができない。また、監視の対象が化学反応によって生成される生成物の重合度である場合に、重合度は、例えば、サンプリングした生成物を用いて、プラント外の計測器によって計測する必要がある。このため、外部の計測器で計測が必要な重合度は、監視において許容される時間内においてリアルタイムに計測を行うことが難しい。また、リアルタイムに計測できないとは、変化の進行が早く、計測データから状態を識別できないことであってもよい。
また、計測できない環境情報は、例えば、センサによって計測できないデータである。センサによって計測できないデータは、例えば、直接、センサによって計測できないデータである。センサによって計測できないデータは、例えば、プラントの設備および動力装置の内部状態である。プラントの設備の内部状態は、例えば、反応率、重合度、分散度、触媒活性、配管のつまり、溶媒およびスケールのうち、1つまたは複数である。計測できない内部状態は、上記に限られない。計測できない環境情報は、例えば、センサを取り付けることができない設備および動力装置のデータであってもよい。また、センサによって計測できないデータは、例えば、振動または発熱によって、正常な計測を行うことができないデータであってもよい。また、計測できない環境情報は、例えば、計測を行うためには、特殊な計測環境または高額な計測機器が必要なデータであってもよい。
また、監視システム10は、例えば、計測できない環境情報に基づいて、プラントの劣化状態を予測する。そして、監視システム10は、例えば、予測したプラントの劣化状態に基づいて、プラントの保全時期を推定する。監視システム10は、例えば、プラントの監視員が用いる端末装置30に、推定したプラントの保全時期を出力する。このように、プラントの設備の内部状態のような計測できない環境情報を基に、プラントの劣化状態を予測することで、プラントの劣化状態の予測の精度が向上する。このため、計測できない環境情報を基に予測した劣化状態を用いて保全時期を推定することで、プラントの保全時期の推定の精度を向上することができる。
ここで、監視システム10の構成の具体例について説明する。図3は、監視システム10の構成の例を示す図である。監視システム10は、基本構成として、取得部101と、推定部102と、予測部103と、保全時期推定部104と、出力部109を備える。また、監視システム10は、例えば、原因推定部105と、効果推定部106と、精度推定部107と、計画作成部108と、記憶部110を備える。
取得部101は、プラントの設備の計測データを取得する。取得部101は、例えば、センサ20から、プラントの設備の計測データを取得する。取得部101は、複数のセンサ20から、プラントの設備の計測データを取得してもよい。また、取得部101は、記憶媒体を介して、プラントの設備の計測データを取得してもよい。プラントの設備の計測データは、例えば、プラントの設備の内部環境を計測したデータである。プラントの設備の計測データは、例えば、温度、湿度、圧力、流量、流速、透過率、粘度、回転数およびトルクのうち1つまたは複数の項目のデータである。プラントの設備の計測データは、プラントの設備の外部から計測したデータであってもよい。例えば、プラントの設備が配管である場合に、プラントの設備の計測データは、配管の外側表面の温度を計測したデータであってもよい。プラントの設備の計測データは、上記に限られない。
取得部101は、プラントの制御データを取得してもよい。取得部101は、例えば、図示しない、プラントの制御システムからプラントの制御データを取得する。プラントの制御データは、例えば、プラントの制御パラメータの設定値である。プラントの制御データは、時系列上の複数の時点におけるプラントの制御パラメータの設定値であってもよい。プラントの制御データは、例えば、プラントの設備および動力装置の動作条件を示す設定値である。プラントの制御データは、例えば、温度、加熱量、湿度、圧力、加圧量、流量、流速、混合比、回転数およびトルクのうち1つまたは複数の項目の設定値のデータである。プラントの制御データは、上記に限られない。
推定部102は、計測データに基づいて、プラントに関する計測できない環境情報を推定する。推定部102は、例えば、推定モデルを用いて計測できない環境情報を推定する。推定モデルは、例えば、計測データから、計測できない環境情報を推定するモデルである。推定モデルは、エージェントともいう。推定部102は、計測データに基づいて、プラントの設備の内部状態を推定する。また、推定部102は、計測データに基づいて、プラントの設備を動作させる動力装置の計測できない環境情報を推定してもよい。
推定モデルは、例えば、システム同定によって生成される。推定モデルは、例えば、プラントの挙動を再現した挙動推定モデルを用いて生成される。挙動推定モデルは、例えば、プラントの内部状態を再現したモデルに基づいて、入力データから出力データを推定する。推定モデルの生成において、例えば、実際に計測された入力データおよび出力データと、挙動推定モデルの入力データおよび出力データが一致するように、挙動推定モデルの各パラメータが決定される。入力データには、制御データが含まれていてもよい。プラントの内部状態の推定時に、推定モデルは、決定された挙動推定モデルの各パラメータを用いて、計測された入力データと出力データから、プラントの内部状態を推定する。このとき、推定モデルが推定の対象とするプラントの内部状態が、計測できない環境情報である。そして、推定モデルは、例えば、推定した内部状態を示す値を計測できない環境情報として出力する。
計測できない環境情報がプラントのあるユニットの内部状態である場合に、ユニットの入口側の計測データは、例えば、内部状態を推定するユニットよりも上流側における計測データである。また、計測できない環境情報がプラントのあるユニットの内部状態である場合に、ユニットの出口側の計測データは、例えば、内部状態を推定するユニットよりも下流側における計測データである。
例えば、化学プラントが、配管A、配管B、反応器Rおよび配管Cを備えるとする。また、反応器Rは、配管Aによって供給される原料Xと、配管Bによって供給される原料Yを、内部において触媒を用いて反応させるとする。そして、反応器Rは、合成された生成物Zを配管Cに供給するとする。また、推定の対象となる計測できない環境情報は、反応器Rにおいて反応に用いられる触媒の活性度であるとする。この場合において、入口側の計測データは、例えば、配管Aにおいて計測された原料Aの流量および温度、並びに、配管Bにおいて計測された原料Bの流量および温度である。また、出口側の計測データは、例えば、配管Cにおいて計測された生成物Zの流量である。このような場合に、例えば、反応器R内における触媒の活性度を計測できない環境情報として推定する推定モデルが、入口側の計測データおよび出口側の計測データを用いて生成される。
推定モデルは、例えば、計測できない環境情報および入口側の計測データを説明変数、出口側の計測データを目的変数とした関数を用いるモデルである。
推定モデルは、機械学習によって生成された学習モデルであってもよい。機械学習によって生成される場合に、推定モデルは、計測データの時系列データと、計測できない環境情報との関係を学習することによって生成される。計測できない環境情報には、例えば、サンプリングすることによって、プラントの外部において計測されたデータが用いられる。推定モデルは、計測データの時系列データおよび制御データの時系列データと、計測できない環境情報との関係を学習することによって生成されてもよい。機械学習によって生成される場合に、推定モデルは、例えば、ニューラルネットワークを用いた深層学習によって生成される。また、推定モデルは、強化学習によって生成されてもよい。推定モデルを生成する学習アルゴリズムは、上記に限られない。推定モデルは、例えば、監視システム10の外部のシステムにおいて生成される。推定モデルは、監視システム10内の図示しない学習部において生成されてもよい。
予測部103は、少なくとも、計測できない環境情報に基づいて、プラントの劣化状態を予測する。予測部103は、計測データおよび計測できない環境情報に基づいて、プラントの劣化状態を予測してもよい。また、予測部103は、計測データ、制御データおよび計測できない環境情報に基づいて、プラントの劣化状態を予測してもよい。プラントの劣化状態は、プラントの設備および動力装置の少なくとも一方の劣化の状態である。予測部103は、例えば、設備の内部状態に基づいて、設備の劣化状態を予測する。また、予測部103は、動力装置の計測できない環境情報に基づいて、動力装置の劣化状態を予測してもよい。
予測部103は、例えば、計測できない環境情報に基づいて、プラントの劣化度の時系列変化を予測する。プラントの劣化度は、例えば、プラントの劣化の進み具合を示す指標である。プラントの劣化度は、例えば、プラントの劣化が進むほど値が大きくなる指標である。プラントの劣化度は、例えば、プラントの劣化が進むほど値が小さくなる指標であってもよい。また、予測部103は、計測データおよび計測できない環境情報に基づいて、プラントの劣化度の時系列変化を予測してもよい。また、予測部103は、計測データ、制御データおよび計測できない環境情報に基づいて、プラントの劣化度の時系列変化を予測してもよい。
プラントの劣化度の時系列変化は、例えば、現時点までの計測データおよび計測できない環境情報を基に、将来、どのように劣化度が変化するかを予測した結果である。予測部103は、例えば、プラントの劣化度の時系列変化として、プラントの劣化度の時系列データを予測する。プラントの劣化度は、例えば、計測できない情報を基にした指標である。例えば、プラントの設備に用いられている配管のつまりの進行度に応じてプラントの保全が行われる場合に、プラントの劣化度は、配管がどの程度つまっているかに基づいた指標である。
予測部103は、例えば、シミュレータを用いて、劣化度を予測する対象のユニットの上流側の計測データの時系列データと、制御データを基に、下流側の計測データの時系列データを予測する。予測部103は、シミュレータが算出した値を基に推定モデルが推定する計測できない環境情報の時系列データを取得する。そして、予測部103は、計測できない環境情報の時系列データを基に、劣化度の時系列データを予測する。
予測部103は、劣化度予測モデルを用いて、劣化度を推定してもよい。劣化度予測モデルは、例えば、計測できない環境情報を基に、劣化度を推定する学習モデルである。劣化度予測モデルは、例えば、計測できない環境情報の時系列データを基に、劣化度の時系列データを予測する。劣化度予測モデルは、計測データおよび計測できない環境情報を基に、劣化度を推定する学習モデルであってもよい。劣化度予測モデルは、計測データ、制御データおよび計測できない環境情報を基に、劣化度を推定する学習モデルであってもよい。劣化度予測モデルは、計測できない環境情報と、劣化度との関係を学習することによって生成される。劣化度予測モデルは、計測データおよび計測できない環境情報と、劣化度との関係を学習することによって生成されてもよい。劣化度予測モデルは、計測データ、制御データおよび計測できない環境情報と、劣化度との関係を学習することによって生成されてもよい。劣化度予測モデルは、例えば、ニューラルネットワークを用いた深層学習によって生成される。劣化予測モデルを生成する学習アルゴリズムは、上記に限られない。また、劣化度予測モデルは、例えば、監視システム10の外部のシステムにおいて生成される。劣化度予測モデルは、監視システム10内の図示しない学習部において生成されてもよい。
プラントの劣化度は、複数の計測できない環境情報を基に推定された指標であってもよい。プラントの劣化度は、複数の計測できない環境情報それぞれに重み付けすることによって推定された指標であってもよい。
保全時期推定部104は、劣化状態の予測結果に基づいて、プラントの保全時期を推定する。保全時期推定部104は、例えば、劣化状態の予測結果におけるプラントの劣化状態が所定の基準を超える時期を基に、プラントの保全時期を推定する。保全時期推定部104は、例えば、劣化度の時系列データの値が所定の基準を超える時期をプラントの保全時期として推定する。所定の基準は、例えば、基準が示す値に劣化度の値が達したときに、プラントの保全を行う基準として設定される。すなわち、所定の基準は、例えば、プラントの保全を実施することが必要な状態にプラントの状態が達したときにおける劣化度の値を用いて設定される。所定の基準は、例えば、プラントの監視員または管理者によって設定される。
保全時期推定部104は、複数の段階の保全時期を推定してもよい。複数の段階の保全時期を推定する場合に、所定の基準は、複数の段階それぞれに設定される。例えば、プラントの設備が配管である場合に、保全時期推定部104は、配管の点検と配管の交換の2段階の保全時期を推定する。この場合において、所定の基準は、配管の点検と、配管の交換それぞれに設定される。また、配管の点検は、さらに複数の段階に分けられていてもよい。配管の点検は、点検項目が異なる複数の段階にさらに分けられていてもよい。例えば、配管の交換からの経過時間に応じて、打音検査、機器を用いた検査およびサンプル取得による検査のように点検項目が分けられる。また、保全時期推定部104は、複数段階の保全を行った場合と、行わなかった場合それぞれにおける、後段階の保全時期を推定してもよい。例えば、保全が配管の清掃と交換の2段階に分けられている場合に、保全時期推定部104は、配管の清掃の有無ごとに、配管の交換の保全時期を推定してもよい。
原因推定部105は、例えば、計測データおよび計測できない環境情報を基に、プラントの劣化状態の原因を推定する。原因推定部105は、例えば、計測データおよび計測できない環境情報それぞれを基準値と比較する。そして、原因推定部は、例えば、計測データおよび計測できない環境情報のうち、基準値から外れている項目を基に、劣化の原因を推定する。原因推定部105は、例えば、計測データおよび計測できない環境情報のうち、基準値から外れている項目から想定される事象を基に、劣化の原因を推定する。例えば、反応器内の温度が適正な範囲よりも高いと、触媒の活性度の低下が早くなり、劣化が進行するとする。この場合において、反応器内の温度が基準値よりも高いとき、原因推定部105は、反応器内の温度によって触媒の活性度の低下が進行していることが劣化状態の原因であると推定する。また、劣化状態の原因は、例えば、計測データおよび計測できない環境情報それぞれの項目と、劣化状態の原因を示すテーブルに設定されている。原因推定部105は、計測データ、制御データおよび計測できない環境情報を基に、プラントの劣化状態の原因を推定してもよい。原因推定部105は、例えば、計測データ、制御データおよび計測できない環境情報それぞれを基準値と比較する。そして、原因推定部105は、例えば、計測データ、制御データおよび計測できない環境情報のうち、基準値から外れている項目を基に劣化の原因を推定する。計測データ、制御データおよび計測できない環境情報それぞれの基準値は、例えば、計測データ、制御データおよび計測できない環境情報と、基準値の関係を示すテーブルに設定されている。
原因推定部105は、例えば、計測データおよび計測できない環境情報それぞれの基準値とのずれ量を基に、プラントの劣化の原因を推定してもよい。原因推定部105は、例えば、計測データおよび計測できない環境情報それぞれの基準値とのずれ量を基に、プラントの劣化状態への影響の度合いをスコア化する。スコアは、例えば、プラントの劣化状態への影響が大きいほど高くなるように設定される。そして、原因推定部105は、スコアが最も高い項目を基に、劣化の原因を推定する。劣化度への影響の度合いを示すスコアは、例えば、計測データおよび計測できない環境情報それぞれの基準値とのずれ量と、スコアの関係を示すテーブルに設定されている。劣化度への影響の度合いを示すスコアは、計測データおよび計測できない環境情報それぞれの基準値とのずれ量と、スコアの関係を示す関数を用いて設定されてもよい。原因推定部105は、スコアが基準以上の項目を劣化の原因として推定してもよい。また、原因推定部105は、スコアが上位から所定の数までの項目を劣化の原因として推定してもよい。また、原因推定部105は、計測データおよび計測できない環境情報それぞれの基準からずれている時間の長さおよび回数少なくとも一方と、基準値とのずれ量とを基に、プラントの劣化の原因を推定してもよい。
原因推定部105は、原因推定モデルを用いて、プラントの劣化の原因を推定してもよい。原因推定モデルは、例えば、計測データおよび計測できない環境情報と、劣化の原因の関係を学習した学習モデルである。原因推定モデルは、例えば、計測データおよび計測できない環境情報に基づいて、劣化の原因を推定する。原因推定モデルは、例えば、計測データおよび計測できない環境情報を入力として、劣化の原因の推定結果を出力する。原因推定モデルは、計測データ、制御データおよび計測できない環境情報と、劣化の原因の関係を学習した学習モデルであってもよい。原因推定モデルは、例えば、計測データ、制御データおよび計測できない環境情報に基づいて、劣化の原因を推定する。原因推定モデルは、例えば、計測データ、制御データおよび計測できない環境情報を入力として、劣化の原因の推定結果を出力する。
原因推定モデルは、例えば、ニューラルネットワークを用いた深層学習によって生成される。原因推定モデルは、例えば、計測データおよび計測できない環境情報それぞれの時系列データから変換した特徴ベクトルを入力データ、劣化の原因をラベルとして学習を行うことによって生成される。原因推定モデルを生成する学習アルゴリズムは、上記に限られない。原因推定モデルは、例えば、監視システム10の外部のシステムにおいて生成される。原因推定モデルは、監視システム10内の図示しない学習部において生成されてもよい。
効果推定部106は、例えば、プラントの保全を実施しなかった場合における計測データの予測値および計測できない環境情報の予測値に基づいて、推定された保全時期に実施されるプラントの保全の効果を推定する。効果推定部106は、計測データの予測値、制御データおよび計測できない環境情報の予測値に基づいて、推定された保全時期に実施されるプラントの保全の効果を推定してもよい。
効果推定部106は、例えば、推定された保全時期に実施される保全によるプラントの劣化状態の改善の度合いを推定する。効果推定部106は、例えば、保全をしなかった場合におけるプラントの状態と、保全後に想定されるプラントの状態を基に、改善の度合いを推定する。効果推定部106は、例えば、計測データの現時点までの時系列データから、当該時系列データの現時点以降における時系列データを予測する。現時点は、例えば、効果推定部106がプラントの劣化状態の改善の度合いを推定する時系列上の時点である。また、効果推定部106は、例えば、推定モデルを用いて、現時点以降のそれぞれの時点における計測できない環境情報の値を推定する。そして、効果推定部106は、例えば、現時点以降のそれぞれの時点における計測できない環境情報の推定値を、それぞれの時点における予測値とする。保全後に想定されるプラントの状態には、例えば、過去に行われた保全における保全後のプラントの状態のデータが用いられる。効果推定部106は、例えば、推定された保全時期に実施される保全によるプラントの生産効率の改善の度合いを推定する。プラントの生産効率は、例えば、計測できない環境情報を基に算出される。効果推定部106は、例えば、計測できない環境情報を基に算出される生産効率に関する指標と、保全を行った場合における生産効率に関する指標の想定値を基に、生産効率の改善の度合いを推定する。例えば、プラントが化学プラントである場合に、効果推定部106は、触媒の活性度を基に、反応物の収率を算出する。そして、効果推定部106は、算出した反応物の収率を、保全後に想定される反応物の収率を基に、反応物の収率の改善の度合いを推定する。保全の効果を推定する対象は、上記に限られない。
精度推定部107は、例えば、計測できない環境情報の推定値の精度を推定する。精度推定部107は、例えば、プラントの計測データと、シミュレータの値の比較結果を基に、計測できない環境情報の推定値の精度を推定する。例えば、シミュレータの出力値に対応するプラントの計測データと、シミュレータの出力値にずれが生じたとする。この場合に、精度推定部107は、例えば、シミュレータのパラメータのうち計測できない環境情報に対応するパラメータを、推定部102が推定する計測できない環境情報の推定値と一致させる。一致させた結果、計測データと、シミュレータの出力値の差が所定の基準内となった場合に、精度推定部107は、計測できない環境情報の推定値の精度が高いと判断する。所定の基準は、例えば、監視員または管理者によって設定される。
例えば、計測できない環境情報が触媒の活性度であり、計測データが温度であるとする。この場合に、精度推定部107は、例えば、計測できない環境情報が触媒の活性度の推定値にシミュレータのパラメータを一致させる。一致させた結果、計測データの温度と、シミュレータの出力値の温度との差が所定の基準内となった場合に、精度推定部107は、計測できない環境情報の推定値の精度が高いと判断する。また、精度推定部107は、計測データと、シミュレータの出力値の差を基に、計測できない環境情報の推定値の精度の指標を推定してもよい。精度推定部107は、例えば、計測データと、シミュレータの出力値の差を、該当する計測データの平均値を用いて規格化する。そして、精度推定部107は、例えば、規格化した値の絶対値を指標として計測できない環境情報の推定値の精度を推定する。精度推定部107は、例えば、規格化した値の絶対値が小さいほど環境情報の推定値の推定の精度が高くなるように、計測できない環境情報の推定値の精度を推定する。
計画作成部108は、例えば、計測データ、計測できない環境情報およびプラントの制御データに基づいて、劣化状態を改善するプラントの運転計画を作成する。計画作成部108は、例えば、プラントの劣化の進行を抑制する制御データを作成する。計画作成部108は、計測データおよび計測できない環境情報を基に、プラントの劣化の進行が抑制できるように制御データの変更値を決定してもよい。そして、計画作成部108は、例えば、制御データの変更値を基に、プラントの劣化の進行を抑制する制御データを作成する。計測データおよび計測できない環境情報と、劣化を抑制する制御データまたは制御データの変更値の関係は、テーブル形式のデータとして設定されている。計測データおよび計測できない環境情報と、劣化を抑制する制御データの関係は、関数を用いて設置されてもよい。計画作成部108は、例えば、制御データの時系列データを運転計画として作成する。例えば、反応器の温度を抑制すると保全時期まで時間が長くなる場合に、計画作成部108は、例えば、温度の設定値の時系列データを運転計画として作成する。
出力部109は、保全時期推定部104が推定した保全時期を出力する。出力部109は、例えば、端末装置30に、保全時期推定部104が推定した保全時期を出力する。出力部109は、監視システム10に接続されている図示しない表示装置に、保全時期推定部104が推定した保全時期を出力する。また、出力部109は、推定した保全時期に加え、計測データ、推定した計測できない環境情報および制御データのうち、少なくとも1つを出力してもよい。出力部109は、例えば、端末装置30に、計測データ、推定した計測できない環境情報および制御データのうち、少なくとも1つを出力する。また、出力部109は、推定した保全時期に加え、原因推定部105が推定した劣化の原因を出力してもよい。出力部109は、例えば、端末装置30に、原因推定部105が推定した劣化の原因を出力する。出力部109は、原因推定部105が推定したプラントの劣化の原因となる項目の情報と、保全時期とを関連付けて出力してもよい。また、出力部109は、推定した保全時期に加え、効果推定部106が推定した保全の効果を出力してもよい。出力部109は、例えば、端末装置30に、保全の効果を出力する。また、出力部109は、推定した保全時期に加え、精度推定部107が推定した保全の時期の推定の精度を出力してもよい。出力部109は、例えば、端末装置30に、精度推定部107が推定した保全の時期の推定の精度を出力する。出力部109は、推定した保全時期に加え、計画作成部108が作成した運転計画を出力してもよい。出力部109は、例えば、端末装置30に、作成した運転計画を出力する。
図4は、保全時期の推定結果の表示画面の例を示す図である。図4の表示画面の例は、反応器である「Rユニット」に関するデータを表示する画面である。図4の表示画面の例では、「原料A供給量」、「原料B供給量」、「反応器温度」、「触媒活性度」および「劣化度(推定値)」のグラフが表示されている。
図4の表示画面の例において、「原料A供給量」のグラフの縦軸は、反応器に供給される「原料A」の流量を示すグラフである。図4の表示画面の例において、「原料A供給量」のグラフの横軸は、時間を示す。「原料A供給量」のグラフの横軸の「現時刻」は、例えば、表示画面の表示時点における時刻を示す。また、「原料A供給量」のグラフにおいて、現時刻よりも左側のデータは、センサ20による流量の計測データである。また、「原料A供給量」のグラフにおいて、現時刻よりも右側のデータは、計測データを基に推定される、現時刻以降の流量の推定値を示す。また、図4の表示画面の例において、「原料B供給量」のグラフの縦軸は、反応器に供給される「原料B」の流量を示すグラフである。また、図4の表示画面の例において、「原料B供給量」のグラフの横軸は、時間を示す。図4の表示画面の例において、「反応器温度」のグラフの縦軸は、反応器内の温度の計測値を示す。図4の表示画面の例において、「反応器温度」のグラフの横軸は、時間を示す。また、「原料B供給量」のグラフにおいて、現時刻よりも左側のデータは、センサ20による流量の計測データである。また、「原料A供給量」のグラフにおいて、現時刻よりも右側のデータは、計測データを基に推定される、現時刻以降の流量の推定値を示す。
また、図4の表示画面の例において、「触媒活性度」のグラフの縦軸は、反応器内の触媒の活性度の推定値を示す。触媒の活性度の推定値は、推定部102によって計測データを基に推定される計測できない環境情報である。図4の表示画面の例において、「反応器温度」のグラフの横軸は、時間を示す。「触媒活性度」のグラフにおいて、現時刻よりも左側のデータは、センサ20による計測データを基に推定される触媒活性度の推定値である。また、「触媒活性度」のグラフにおいて、現時刻よりも右側のデータは、推定部102によって現時刻までの推定値を基に推定される現時刻以降の触媒活性度の推定値を示す。
また、図4の表示画面の例において、「劣化度(予測値)」のグラフの縦軸は、プラントの劣化度の値である。予測部103によって予測されるプラントの劣化度の予測値である。「劣化度(予測値)」のグラフにおいて、現時刻よりも左側のデータは、予測部103によって算出される劣化度である。図4の表示画面の例において、劣化度は、劣化が進むほど値が小さくなる指標である。また、「劣化度(予測値)」のグラフにおいて、現時刻よりも右側のデータは、例えば、予測部103によって予測される、現時刻以降の劣化度の予測値を示す。また、「劣化度(予測値)」のグラフにおいて、「保全時期」は、保全時期推定部104によって推定される保全時期の時点を示す。また、図4の表示画面の例では、保全時期推定部104によって推定される保全時期を示す情報が、「保全推奨時期 2023年6月24日」として表示されている。プラントの監視員は、例えば、図4の表示画面を参照することで、プラントの設備の保全時期を適切に決定することができる。
図5は、図4の同様の表示内容に加え、保全時期の推定結果の推定の精度をさらに表示する表示画面の例を示す図である。図5の表示画面の例では、図4と同様に、「原料A供給量」、「原料B供給量」、「反応器温度」、「触媒活性度」および「劣化度(推定値)」のグラフが表示されている。また、図5の表示画面の例では、図4と同様に、保全時期推定部104によって推定される保全時期を示す情報が表示されている。図5の表示画面の例では、保全時期の推定結果に加え、精度推定部107によって推定される、保全時期の推定の精度がさらに表示されている。図5の表示画面の例では、精度推定部107によって推定される推定精度を示す情報が、「推定精度 95パーセント」として表示されている。プラントの監視員は、例えば、図5の表示画面を参照することで、プラントの設備の保全時期の推定結果の妥当性を判断することができる。
図6は、図4の同様の表示内容に加え、プラントの劣化状態原因の推定結果をさらに表示する表示画面の例を示す図である。図6の表示画面の例では、図4と同様に、「原料A供給量」、「原料B供給量」、「反応器温度」、「触媒活性度」および「劣化度(推定値)」のグラフが表示されている。また、図6の表示画面の例では、図4と同様に、保全時期推定部104によって推定される保全時期を示す情報が表示されている。図6の表示画面の例において、「劣化原因」は、原因推定部105によって推定されるプラントの劣化の原因を示す情報である。図6の表示画面の例では、原因推定部105によって推定されるプラントの劣化の原因が、「反応器温度 高」および「原料A 供給量大」として表示されている。プラントの監視員は、例えば、図6の表示画面の例を参照することで、プラントの劣化状態原因と、保全時期を容易に把握することができる。このため、プラントの監視員は、図6の表示画面の例を参照することで、例えば、プラントの操作および保全時期の決定をより適切に行うことができる。
記憶部110は、例えば、プラントに関するデータを保存する。プラントに関するデータは、例えば、プラントの劣化状態の予測に関するデータである。プラントの劣化状態の予測に関するデータは、例えば、プラントの設備の計測データ、プラントの制御データ。計測できない環境情報の推定結果およびプラントの劣化状態の予測結果である。プラントの劣化状態の予測に関するデータは、例えば、プラントの劣化の原因の推定結果、プラントの保全の効果の推定結果、計測できない環境情報の推定値の精度の推定結果およびプラントの運転計画であってもよい。記憶部110が保存するプラントの劣化状態の予測に関するデータは、上記に限られない。
記憶部110は、プラントの劣化状態の予測に関して設定されている基準に関するテーブルをさらに保存してもよい。記憶部110は、プラントの劣化状態の予測に関する学習モデルを保存してもよい。記憶部110は、例えば、推定モデルを保存する。記憶部110は、例えば、劣化度予測モデルを保存する。記憶部110は、例えば、原因推定モデルを保存する。また、推定モデル、劣化度予測モデルをおよび原因推定モデルは、記憶部110以外の記憶手段に保存されてもよい。
センサ20は、例えば、プラントの設備の状態を計測する。センサ20は、例えば、監視システム10の取得部101に、計測したデータを出力する。センサ20は、プラントの設備の複数の箇所に設置されてもよい。また。センサ20は、プラントの複数の設備それぞれに設置されてもよい。センサ20には、例えば、計測対象となる物理量に応じた種類のセンサが用いられる。センサ20には、例えば、温度センサ、圧力センサ、流速計、流量計、粘度計、透過率センサまたはトルク測定器が用いられる。センサ20は、上記に限られない。計測対象がプラントの配管である場合に、センサ20は、例えば、プラントの配管内の温度、流量、流速、圧力、振動および透過率のうち少なくとも1つの項目のデータを計測する。センサ20が計測の対象とするデータの項目は、上記に限られない。また、計測対象は、プラントの配管に限られない。センサ20は、プラントの動力装置に設置されてもよい。センサ20は、例えば、プラントの動力装置の状態を計測する。
端末装置30は、例えば、プラントの状態の監視に用いる端末装置である。端末装置30は、例えば、プラントの監視員が保全時期の推定結果の確認に用いる端末装置である。端末装置30は、例えば、監視システム10の出力部109から、保全時期の推定結果を取得する。そして、端末装置30は、図示しない表示装置に、保全時期の推定結果を出力する。端末装置30は、監視システム10の出力部109から、保全の効果を取得してもよい。そして、例えば、端末装置30は、図示しない表示装置に、保全の効果を出力する。端末装置30は、監視システム10の出力部109から、プラントの劣化の原因を取得してよい。そして、端末装置30は、例えば、図示しない表示装置に、プラントの劣化の原因を出力する。端末装置30は、例えば、監視システム10の出力部109から、運転計画を取得してもよい。そして、端末装置30は、例えば、図示しない表示装置に、運転計画を出力する。
端末装置30には、例えば、パーソナルコンピュータ、タブレット型コンピュータ、スマートフォンまたはウェアラブル端末装置が用いられる。端末装置30に用いる端末装置の例は、上記に限られない。
監視システム10が保全時期を推定する動作の例について説明する。図7は、監視システム10が保全時期を推定する処理における動作フローの例を示す図である。
取得部101は、プラントの設備に関する計測データを取得する(ステップS11)。取得部101は、例えば、センサ20から、プラントの設備に関する計測データを取得する。
プラントの設備に関する計測データが取得されると、推定部102は、設備に関する計測データに基づいて、プラントに関する計測できない環境情報を推定する(ステップS12)。
劣化予測に必要な計測できない環境情報のデータが存在する場合に(ステップS13でYes)、予測部103は、計測できない環境情報に基づいて、プラントの劣化状態を予測する(ステップS14)。
プラントの劣化状態が予測されると、保全時期推定部104は、劣化状態の予測結果に基づいて、プラントの保全時期を推定する(ステップS15)。
プラントの保全時期が推定されると、出力部109は、プラントの保全時期を出力する(ステップS16)。出力部109は、例えば、端末装置30に、プラントの保全時期を出力する。
ステップS13において、劣化予測に必要な計測できない環境情報のデータが存在しない場合に(ステップS13でNo)、例えば、ステップS11に戻り、取得部101によるプラントの設備の計測データの取得が行われる。
監視システム10は、プラントの設備の計測データを基に、プラントに関する計測できない環境情報を推定する。また、監視システム10は、推定した計測できない環境情報を基にプラントの劣化状態を推定する。そして、監視システム10は、予測したプラントの劣化状態を基に、プラントの保全時期を推定する。例えば、監視システム10は、プラントの設備の計測データを基に、設備の内部状態を推定する。また、監視システム10は、例えば、プラントの設備の劣化状態を予測する。そして、監視システム10は、予測したプラントの節設備の劣化状態を基に、プラントの設備の保全時期を推定する。このように、計測できない環境情報を基にプラントの保全時期を推定することで、監視システム10は、計測できないプラントの状態に応じて保全時期を適切に推定することができる。このため、監視システム10を用いることで、プラントの保全時期の推定の精度を向上することができる。
例えば、監視システム10は、プラントの設備の内部状態に応じた適切な保全時期を推定することができる。例えば、プラントの設備が配管である場合に、監視システム10は、配管の内部の状態に応じて保全時期を推定することができる。配管の内部の状態に応じて保全時期を推定することで、使用可能な状態での配管の交換および保全の遅れによるプラントの不具合の発生を抑制することができる。すなわち、監視システム10は、配管の保全時期を適切に推定することができる。このように、監視システム10を用いることで、プラントの適切な保全時期を推定することができる。
監視システム10における各処理は、ネットワークを介して接続されている複数の情報処理装置において分散されて実行されてもよい。例えば、推定部102における計測できない環境情報を推定する処理と、予測部103におけるプラントの劣化状態を予測する処理および保全時期推定部104における保全時期を推定する処理は、別の情報処理装置において行われてもよい。また、例えば、推定部102における計測できない環境情報を推定する処理および予測部103におけるプラントの劣化状態を予測する処理と、保全時期推定部104における保全時期を推定する処理が、別の情報処理装置において行われてもよい。監視システム10において行われる処理のうちいずれの処理を端末装置において行うかは、適宜、設定され得る。
監視システム10における各処理は、コンピュータプログラムをコンピュータで実行することによって実現することができる。図8は、監視システム10における各処理を行うコンピュータプログラムを実行するコンピュータ200の構成の例を示したものである。コンピュータ200は、CPU(Central Processing Unit)201と、メモリ202と、記憶装置203と、入出力I/F(Interface)204と、通信I/F205を備える。
CPU201は、記憶装置203から各処理を行うコンピュータプログラムを読み出して実行する。CPU201は、複数のCPUの組み合わせによって構成されてもよい。メモリ202は、DRAM(Dynamic Random Access Memory)等によって構成され、CPU201が実行するコンピュータプログラムや処理中のデータが一時記憶される。記憶装置203は、CPU201が実行するコンピュータプログラムを記憶している。記憶装置203は、例えば、不揮発性の半導体記憶装置によって構成されている。記憶装置203には、ハードディスクドライブ等の他の記憶装置が用いられてもよい。入出力I/F204は、作業者からの入力の受付および表示データ等の出力を行うインタフェースである。通信I/F205は、センサ20および端末装置30との間でデータの送受信を行うインタフェースである。また、端末装置30は、コンピュータ200と同様の構成としてもよい。
各処理の実行に用いられるコンピュータプログラムは、データを非一時的に記録するコンピュータ読み取り可能な記録媒体に格納して頒布することもできる。記録媒体としては、例えば、データ記録用磁気テープや、ハードディスクなどの磁気ディスクを用いることができる。また、記録媒体としては、CD-ROM(Compact Disc Read Only Memory)等の光ディスクを用いることもできる。不揮発性の半導体記憶装置を記録媒体として用いてもよい。
上記の実施形態の一部または全部は、以下の付記のようにも記載されうるが、以下には限られない。
[付記1]
プラントの設備に関する計測データを取得する取得手段と、
前記計測データに基づいて、前記プラントに関する計測できない環境情報を推定する推定手段と、
少なくとも前記計測できない環境情報に基づいて、前記プラントの劣化状態を予測する予測手段と、
前記劣化状態の予測結果に基づいて、前記プラントの保全時期を推定する保全時期推定手段と、
推定した前記保全時期を出力する出力手段と、
を備える監視システム。
プラントの設備に関する計測データを取得する取得手段と、
前記計測データに基づいて、前記プラントに関する計測できない環境情報を推定する推定手段と、
少なくとも前記計測できない環境情報に基づいて、前記プラントの劣化状態を予測する予測手段と、
前記劣化状態の予測結果に基づいて、前記プラントの保全時期を推定する保全時期推定手段と、
推定した前記保全時期を出力する出力手段と、
を備える監視システム。
[付記2]
前記推定手段は、前記計測データに基づいて、前記設備の内部状態を推定し、
前記予測手段は、前記設備の内部状態に基づいて、前記設備の内部の劣化状態を予測する、
付記1に記載の監視システム。
前記推定手段は、前記計測データに基づいて、前記設備の内部状態を推定し、
前記予測手段は、前記設備の内部状態に基づいて、前記設備の内部の劣化状態を予測する、
付記1に記載の監視システム。
[付記3]
前記推定手段は、前記計測データに基づいて、前記プラントの設備を動作させる動力装置の計測できない環境情報を推定し、
前記予測手段は、前記動力装置の計測できない環境情報に基づいて、前記動力装置の劣化状態を予測する、
付記1に記載の監視システム。
前記推定手段は、前記計測データに基づいて、前記プラントの設備を動作させる動力装置の計測できない環境情報を推定し、
前記予測手段は、前記動力装置の計測できない環境情報に基づいて、前記動力装置の劣化状態を予測する、
付記1に記載の監視システム。
[付記4]
前記取得手段は、前記プラントに関する制御データをさらに取得し、
前記推定手段は、前記計測データおよび前記制御データに基づいて、前記プラントに関する計測できない環境情報を推定する、
付記1から3いずれかに記載の監視システム。
前記取得手段は、前記プラントに関する制御データをさらに取得し、
前記推定手段は、前記計測データおよび前記制御データに基づいて、前記プラントに関する計測できない環境情報を推定する、
付記1から3いずれかに記載の監視システム。
[付記5]
前記予測手段は、前記計測データ、前記制御データおよび前記計測できない環境情報に基づいて、前記プラントの劣化状態を予測する、
付記4に記載の監視システム。
前記予測手段は、前記計測データ、前記制御データおよび前記計測できない環境情報に基づいて、前記プラントの劣化状態を予測する、
付記4に記載の監視システム。
[付記6]
前記計測データおよび前記計測できない環境情報を基に、前記プラントの劣化の原因を推定する原因推定手段をさらに備え、
前記出力手段は、前記プラントの劣化の原因をさらに出力する、
付記1から3いずれかに記載の監視システム。
前記計測データおよび前記計測できない環境情報を基に、前記プラントの劣化の原因を推定する原因推定手段をさらに備え、
前記出力手段は、前記プラントの劣化の原因をさらに出力する、
付記1から3いずれかに記載の監視システム。
[付記7]
前記計測データの推定値および前記計測できない環境情報の推定値に基づいて、前記プラントの保全の効果を推定する効果推定手段をさらに備え、
前記出力手段は、前記保全の効果をさらに出力する、
付記1から3いずれかに記載の監視システム。
前記計測データの推定値および前記計測できない環境情報の推定値に基づいて、前記プラントの保全の効果を推定する効果推定手段をさらに備え、
前記出力手段は、前記保全の効果をさらに出力する、
付記1から3いずれかに記載の監視システム。
[付記8]
前記計測データおよび前記計測できない環境情報の少なくとも一方についての前記劣化状態の予測に対する影響度を推定する影響度推定手段をさらに備え、
前記出力手段は、推定した前記影響度をさらに出力する、
付記1から3いずれかに記載の監視システム。
前記計測データおよび前記計測できない環境情報の少なくとも一方についての前記劣化状態の予測に対する影響度を推定する影響度推定手段をさらに備え、
前記出力手段は、推定した前記影響度をさらに出力する、
付記1から3いずれかに記載の監視システム。
[付記9]
前記計測できない環境情報の推定値の精度を推定する精度推定手段をさらに備え、
前記出力手段は、推定した前記精度をさらに出力する、
付記1から3いずれかに記載の監視システム。
前記計測できない環境情報の推定値の精度を推定する精度推定手段をさらに備え、
前記出力手段は、推定した前記精度をさらに出力する、
付記1から3いずれかに記載の監視システム。
[付記10]
前記計測データ、前記計測できない環境情報および前記プラントの制御データに基づいて、前記劣化状態を改善する前記プラントの運転計画を作成する計画作成手段をさらに備え、
前記出力手段は、前記運転計画をさらに出力する、
付記1から3いずれかに記載の監視システム。
前記計測データ、前記計測できない環境情報および前記プラントの制御データに基づいて、前記劣化状態を改善する前記プラントの運転計画を作成する計画作成手段をさらに備え、
前記出力手段は、前記運転計画をさらに出力する、
付記1から3いずれかに記載の監視システム。
[付記11]
プラントの設備に関する計測データを取得し、
前記計測データに基づいて、プラントに関する計測できない環境情報を推定し、
少なくとも前記計測できない環境情報に基づいて、前記設備の劣化状態を予測し、
前記劣化状態の予測結果に基づいて、前記プラントの保全時期を推定し、
推定した前記保全時期を出力する、
監視方法。
プラントの設備に関する計測データを取得し、
前記計測データに基づいて、プラントに関する計測できない環境情報を推定し、
少なくとも前記計測できない環境情報に基づいて、前記設備の劣化状態を予測し、
前記劣化状態の予測結果に基づいて、前記プラントの保全時期を推定し、
推定した前記保全時期を出力する、
監視方法。
[付記12]
プラントの設備に関する計測データを取得する処理と、
前記計測データに基づいて、プラントに関する計測できない環境情報を推定する処理と、
少なくとも前記計測できない環境情報に基づいて、前記設備の劣化状態を予測する処理と、
前記劣化状態の予測結果に基づいて、前記プラントの保全時期を推定する処理と、
推定した前記保全時期を出力する処理と
をコンピュータに実行させる監視プログラムを非一時的に記録する記録媒体。
プラントの設備に関する計測データを取得する処理と、
前記計測データに基づいて、プラントに関する計測できない環境情報を推定する処理と、
少なくとも前記計測できない環境情報に基づいて、前記設備の劣化状態を予測する処理と、
前記劣化状態の予測結果に基づいて、前記プラントの保全時期を推定する処理と、
推定した前記保全時期を出力する処理と
をコンピュータに実行させる監視プログラムを非一時的に記録する記録媒体。
また、上述した付記1に従属する付記2から10に記載した構成の一部または全ては、付記11、付記12に対しても付記2から10と同様の従属関係により従属し得る。さらには、付記1、付記11、付記12に限らず、上述した各実施の形態から逸脱しない範囲において、様々なハードウェア、ソフトウェア、ソフトウェアを記録するための種々の記録手段、またはシステムに対しても同様に、付記として記載した構成の一部または全てを従属させ得る。
以上、実施の形態を参照して本開示を説明したが、本開示は上述の実施の 形態に限定されるものではない。本開示の構成や詳細には、本開示のスコープ内で当業者が理解し得る様々な変更をすることができる。そして、各実施の形態は、適宜他の実施の形態と組み合わせることができる。
この出願は、2023年6月12日に出願された日本出願特願2023-096106を基礎とする優先権を主張し、その開示の全てをここに取り込む。
10 監視システム
101 取得部
102 推定部
103 予測部
104 保全時期推定部
105 原因推定部
106 効果推定部
107 精度推定部
108 計画作成部
109 出力部
110 記憶部
20 センサ
30 端末装置
200 コンピュータ
201 CPU
202 メモリ
203 記憶装置
204 入出力I/F
205 通信I/F
101 取得部
102 推定部
103 予測部
104 保全時期推定部
105 原因推定部
106 効果推定部
107 精度推定部
108 計画作成部
109 出力部
110 記憶部
20 センサ
30 端末装置
200 コンピュータ
201 CPU
202 メモリ
203 記憶装置
204 入出力I/F
205 通信I/F
Claims (20)
- プラントの設備に関する計測データを取得する取得手段と、
前記計測データに基づいて、前記プラントに関する計測できない環境情報を推定する推定手段と、
少なくとも前記計測できない環境情報に基づいて、前記プラントの劣化状態を予測する予測手段と、
前記劣化状態の予測結果に基づいて、前記プラントの保全時期を推定する保全時期推定手段と、
推定した前記保全時期を出力する出力手段と、
を備える監視システム。 - 前記推定手段は、前記計測データに基づいて、前記設備の内部状態を推定し、
前記予測手段は、前記設備の内部状態に基づいて、前記設備の内部の劣化状態を予測する、
請求項1に記載の監視システム。 - 前記推定手段は、前記計測データに基づいて、前記プラントの設備を動作させる動力装置の計測できない環境情報を推定し、
前記予測手段は、前記動力装置の計測できない環境情報に基づいて、前記動力装置の劣化状態を予測する、
請求項1に記載の監視システム。 - 前記取得手段は、前記プラントに関する制御データをさらに取得し、
前記推定手段は、前記計測データおよび前記制御データに基づいて、前記プラントに関する計測できない環境情報を推定する、
請求項1から3いずれかに記載の監視システム。 - 前記予測手段は、前記計測データ、前記制御データおよび前記計測できない環境情報に基づいて、前記プラントの劣化状態を予測する、
請求項4に記載の監視システム。 - 前記計測データおよび前記計測できない環境情報を基に、前記プラントの劣化の原因を推定する原因推定手段をさらに備え、
前記出力手段は、前記プラントの劣化の原因をさらに出力する、
請求項1から3いずれかに記載の監視システム。 - 前記プラントの保全を実施しなかった場合における前記計測データの予測値および前記計測できない環境情報の予測値に基づいて、前記プラントの保全の効果を推定する効果推定手段をさらに備え、
前記出力手段は、前記保全の効果をさらに出力する、
請求項1から3いずれかに記載の監視システム。 - 前記計測データおよび前記計測できない環境情報の少なくとも一方についての前記劣化状態の予測に対する影響度を推定する影響度推定手段をさらに備え、
前記出力手段は、推定した前記影響度をさらに出力する、
請求項1から3いずれかに記載の監視システム。 - 前記計測できない環境情報の推定値の精度を推定する精度推定手段をさらに備え、
前記出力手段は、推定した前記精度をさらに出力する、
請求項1から3いずれかに記載の監視システム。 - 前記計測データ、前記計測できない環境情報および前記プラントの制御データに基づいて、前記劣化状態を改善する前記プラントの運転計画を作成する計画作成手段をさらに備え、
前記出力手段は、前記運転計画をさらに出力する、
請求項1から3いずれかに記載の監視システム。 - プラントの設備に関する計測データを取得し、
前記計測データに基づいて、プラントに関する計測できない環境情報を推定し、
少なくとも前記計測できない環境情報に基づいて、前記設備の劣化状態を予測し、
前記劣化状態の予測結果に基づいて、前記プラントの保全時期を推定し、
推定した前記保全時期を出力する、
監視方法。 - 前記計測データに基づいて、前記設備の内部状態を推定し、
前記設備の内部状態に基づいて、前記設備の内部の劣化状態を予測する、
請求項11に記載の監視方法。 - 前記計測データに基づいて、前記プラントの設備を動作させる動力装置の計測できない環境情報を推定し、
前記動力装置の計測できない環境情報に基づいて、前記動力装置の劣化状態を予測する、
請求項11に記載の監視方法。 - 前記プラントに関する制御データをさらに取得し、
前記計測データおよび前記制御データに基づいて、前記プラントに関する計測できない環境情報を推定する、
請求項11から13いずれかに記載の監視方法。 - 前記計測データおよび前記計測できない環境情報を基に、前記プラントの劣化の原因を推定し、
前記プラントの劣化の原因をさらに出力する、
請求項11から13いずれかに記載の監視方法。 - 前記プラントの保全を実施しなかった場合における前記計測データの予測値および前記計測できない環境情報の予測値に基づいて、前記プラントの保全の効果を推定し、
前記保全の効果をさらに出力する、
請求項11から13いずれかに記載の監視方法。 - 前記計測データおよび前記計測できない環境情報の少なくとも一方についての前記劣化状態の予測に対する影響度を推定し、
推定した前記影響度をさらに出力する、
請求項11から13いずれかに記載の監視方法。 - 前記計測できない環境情報の推定値の精度を推定し、
推定した前記精度をさらに出力する、
請求項11から13いずれかに記載の監視方法。 - 前記計測データ、前記計測できない環境情報および前記プラントの制御データに基づいて、前記劣化状態を改善する前記プラントの運転計画を作成し、
前記運転計画をさらに出力する、
請求項11から13いずれかに記載の監視方法。 - プラントの設備に関する計測データを取得する処理と、
前記計測データに基づいて、プラントに関する計測できない環境情報を推定する処理と、
少なくとも前記計測できない環境情報に基づいて、前記設備の劣化状態を予測する処理と、
前記劣化状態の予測結果に基づいて、前記プラントの保全時期を推定する処理と、
推定した前記保全時期を出力する処理と
をコンピュータに実行させる監視プログラムを非一時的に記録する記録媒体。
Priority Applications (1)
| Application Number | Priority Date | Filing Date | Title |
|---|---|---|---|
| JP2025527645A JPWO2024257617A5 (ja) | 2024-05-30 | 監視システム、監視方法および監視プログラム |
Applications Claiming Priority (2)
| Application Number | Priority Date | Filing Date | Title |
|---|---|---|---|
| JP2023-096106 | 2023-06-12 | ||
| JP2023096106 | 2023-06-12 |
Publications (1)
| Publication Number | Publication Date |
|---|---|
| WO2024257617A1 true WO2024257617A1 (ja) | 2024-12-19 |
Family
ID=93852102
Family Applications (1)
| Application Number | Title | Priority Date | Filing Date |
|---|---|---|---|
| PCT/JP2024/019838 Ceased WO2024257617A1 (ja) | 2023-06-12 | 2024-05-30 | 監視システム、監視方法および記録媒体 |
Country Status (1)
| Country | Link |
|---|---|
| WO (1) | WO2024257617A1 (ja) |
Citations (9)
| Publication number | Priority date | Publication date | Assignee | Title |
|---|---|---|---|---|
| JP2003114294A (ja) * | 2001-10-04 | 2003-04-18 | Toshiba Corp | 発電プラントの監視・診断・検査・保全システム |
| JP2004240642A (ja) * | 2003-02-05 | 2004-08-26 | Hitachi Ltd | プラント機器の保守支援装置 |
| JP2014139774A (ja) * | 2012-12-21 | 2014-07-31 | Mitsubishi Heavy Ind Ltd | プラント設備保全計画の提案支援システム |
| JP2015088079A (ja) * | 2013-11-01 | 2015-05-07 | 株式会社日立パワーソリューションズ | 異常診断システム及び異常診断方法 |
| JP2019021032A (ja) * | 2017-07-18 | 2019-02-07 | 株式会社Ihi | シミュレーション装置およびシミュレーション方法 |
| WO2019107360A1 (ja) * | 2017-11-28 | 2019-06-06 | 株式会社安川電機 | 制御システム、工場システム、学習システム、推定用モデルの生成方法及びアクチュエータの状態推定方法 |
| JP2021068037A (ja) * | 2019-10-18 | 2021-04-30 | 株式会社日立製作所 | 性能診断システム |
| JP2021144637A (ja) * | 2020-03-13 | 2021-09-24 | 株式会社東芝 | 情報処理装置、情報処理方法およびプログラム |
| JP2022142459A (ja) * | 2021-03-16 | 2022-09-30 | 株式会社栗本鐵工所 | 異常予測装置およびプログラム |
-
2024
- 2024-05-30 WO PCT/JP2024/019838 patent/WO2024257617A1/ja not_active Ceased
Patent Citations (9)
| Publication number | Priority date | Publication date | Assignee | Title |
|---|---|---|---|---|
| JP2003114294A (ja) * | 2001-10-04 | 2003-04-18 | Toshiba Corp | 発電プラントの監視・診断・検査・保全システム |
| JP2004240642A (ja) * | 2003-02-05 | 2004-08-26 | Hitachi Ltd | プラント機器の保守支援装置 |
| JP2014139774A (ja) * | 2012-12-21 | 2014-07-31 | Mitsubishi Heavy Ind Ltd | プラント設備保全計画の提案支援システム |
| JP2015088079A (ja) * | 2013-11-01 | 2015-05-07 | 株式会社日立パワーソリューションズ | 異常診断システム及び異常診断方法 |
| JP2019021032A (ja) * | 2017-07-18 | 2019-02-07 | 株式会社Ihi | シミュレーション装置およびシミュレーション方法 |
| WO2019107360A1 (ja) * | 2017-11-28 | 2019-06-06 | 株式会社安川電機 | 制御システム、工場システム、学習システム、推定用モデルの生成方法及びアクチュエータの状態推定方法 |
| JP2021068037A (ja) * | 2019-10-18 | 2021-04-30 | 株式会社日立製作所 | 性能診断システム |
| JP2021144637A (ja) * | 2020-03-13 | 2021-09-24 | 株式会社東芝 | 情報処理装置、情報処理方法およびプログラム |
| JP2022142459A (ja) * | 2021-03-16 | 2022-09-30 | 株式会社栗本鐵工所 | 異常予測装置およびプログラム |
Also Published As
| Publication number | Publication date |
|---|---|
| JPWO2024257617A1 (ja) | 2024-12-19 |
Similar Documents
| Publication | Publication Date | Title |
|---|---|---|
| CN106404403B (zh) | 用于涡轮机的分析的方法和系统 | |
| US8116990B2 (en) | Method and system for real-time prognosis analysis and usage based residual life assessment of turbine engine components and display | |
| US7827006B2 (en) | Heat exchanger fouling detection | |
| JP4138267B2 (ja) | 半導体製造装置、真空ポンプの寿命予測方法及び真空ポンプの修理タイミング決定方法 | |
| CN113574358B (zh) | 异常检测装置及异常检测方法 | |
| US20120296606A1 (en) | Method, computer program, and system for performing interpolation on sensor data for high system availability | |
| JP4289602B2 (ja) | プロセス監視方法 | |
| US10233786B2 (en) | Actuator spring lifetime supervision module for a valve and actuator monitoring system | |
| EP3507464B1 (en) | Tightness test evaluation module for a valve and actuator monitoring system | |
| EP3507663B1 (en) | Advanced startup counter module for a valve and actuator monitoring system | |
| JP7392566B2 (ja) | 制御支援装置、制御支援方法、制御支援プログラム、および制御システム | |
| US20200103883A1 (en) | Indicator detection system and indicator detection method | |
| JP6702297B2 (ja) | プロセスの異常状態診断方法および異常状態診断装置 | |
| JP2010181188A (ja) | プラント運転状態監視方法 | |
| CN101025093B (zh) | 确定极限超过值的方法 | |
| US20180058249A1 (en) | Valve Stroke And Spindle Way Counter Module For A Valve And Actuator Monitoring System | |
| US10066501B2 (en) | Solid particle erosion indicator module for a valve and actuator monitoring system | |
| EP3301522A1 (en) | Plant simulation device and plant simulation method | |
| EP4102322B1 (en) | Prediction device, prediction method, and program | |
| US20180058251A1 (en) | Flexible Service Interval Counter Module For A Valve And Actuator Monitoring System | |
| CN118114063A (zh) | 一种用于火电机组旋转设备的故障诊断方法及系统 | |
| US10394255B2 (en) | Diagnostic device and method for monitoring frictional behavior in a control loop | |
| JPH0735655A (ja) | プラントプロセス監視装置 | |
| Salamat | Gas path diagnostics for compressors | |
| WO2021157666A1 (ja) | 制御装置、制御方法及びプログラム |
Legal Events
| Date | Code | Title | Description |
|---|---|---|---|
| 121 | Ep: the epo has been informed by wipo that ep was designated in this application |
Ref document number: 24823237 Country of ref document: EP Kind code of ref document: A1 |
|
| ENP | Entry into the national phase |
Ref document number: 2025527645 Country of ref document: JP Kind code of ref document: A |
|
| WWE | Wipo information: entry into national phase |
Ref document number: 2025527645 Country of ref document: JP |
|
| NENP | Non-entry into the national phase |
Ref country code: DE |