WO2024252992A1 - 製造条件選定方法、材料の製造方法、製造条件選定装置及びプログラム - Google Patents
製造条件選定方法、材料の製造方法、製造条件選定装置及びプログラム Download PDFInfo
- Publication number
- WO2024252992A1 WO2024252992A1 PCT/JP2024/019602 JP2024019602W WO2024252992A1 WO 2024252992 A1 WO2024252992 A1 WO 2024252992A1 JP 2024019602 W JP2024019602 W JP 2024019602W WO 2024252992 A1 WO2024252992 A1 WO 2024252992A1
- Authority
- WO
- WIPO (PCT)
- Prior art keywords
- value
- characteristic value
- manufacturing
- predicted
- data group
- Prior art date
- Legal status (The legal status is an assumption and is not a legal conclusion. Google has not performed a legal analysis and makes no representation as to the accuracy of the status listed.)
- Ceased
Links
Images





Classifications
-
- G—PHYSICS
- G16—INFORMATION AND COMMUNICATION TECHNOLOGY [ICT] SPECIALLY ADAPTED FOR SPECIFIC APPLICATION FIELDS
- G16C—COMPUTATIONAL CHEMISTRY; CHEMOINFORMATICS; COMPUTATIONAL MATERIALS SCIENCE
- G16C60/00—Computational materials science, i.e. ICT specially adapted for investigating the physical or chemical properties of materials or phenomena associated with their design, synthesis, processing, characterisation or utilisation
-
- G—PHYSICS
- G16—INFORMATION AND COMMUNICATION TECHNOLOGY [ICT] SPECIALLY ADAPTED FOR SPECIFIC APPLICATION FIELDS
- G16C—COMPUTATIONAL CHEMISTRY; CHEMOINFORMATICS; COMPUTATIONAL MATERIALS SCIENCE
- G16C20/00—Chemoinformatics, i.e. ICT specially adapted for the handling of physicochemical or structural data of chemical particles, elements, compounds or mixtures
- G16C20/10—Analysis or design of chemical reactions, syntheses or processes
-
- G—PHYSICS
- G16—INFORMATION AND COMMUNICATION TECHNOLOGY [ICT] SPECIALLY ADAPTED FOR SPECIFIC APPLICATION FIELDS
- G16C—COMPUTATIONAL CHEMISTRY; CHEMOINFORMATICS; COMPUTATIONAL MATERIALS SCIENCE
- G16C20/00—Chemoinformatics, i.e. ICT specially adapted for the handling of physicochemical or structural data of chemical particles, elements, compounds or mixtures
- G16C20/70—Machine learning, data mining or chemometrics
-
- G—PHYSICS
- G16—INFORMATION AND COMMUNICATION TECHNOLOGY [ICT] SPECIALLY ADAPTED FOR SPECIFIC APPLICATION FIELDS
- G16C—COMPUTATIONAL CHEMISTRY; CHEMOINFORMATICS; COMPUTATIONAL MATERIALS SCIENCE
- G16C20/00—Chemoinformatics, i.e. ICT specially adapted for the handling of physicochemical or structural data of chemical particles, elements, compounds or mixtures
- G16C20/30—Prediction of properties of chemical compounds, compositions or mixtures
Definitions
- This disclosure relates to a manufacturing condition selection method, a material manufacturing method, a manufacturing condition selection device, and a program.
- DP steel sheets are made by adding alloying elements such as 0.1% C, 1.0% Si, and 1.0% Mn, annealing them at a temperature in the two-phase region of ferrite and austenite, and then tempering them at a temperature of about 200 to 400°C. This type of treatment achieves both high tensile strength and high ductility (high elongation value).
- the higher the annealing temperature during DP steel sheet production the higher the volume fraction of austenite generally becomes, and as a result, the volume fraction of martensite after quenching becomes higher, so DP steel sheets with high tensile strength tend to be obtained.
- the higher the tempering temperature and the longer the tempering time during DP steel sheet production the more the martensite is tempered and the strain in the martensite is relaxed, so DP steel sheets with low tensile strength and high elongation tend to be obtained.
- steel materials are developed by adjusting manufacturing conditions such as annealing temperature, annealing time, tempering temperature, and tempering time to improve mechanical properties such as tensile strength and elongation.
- Materials informatics utilizes digital technology in materials development. Specifically, it predicts the manufacturing conditions for materials to obtain the desired material properties from a huge amount of accumulated data on the manufacturing conditions and properties of materials.
- Patent Document 1 discloses a production evaluation system that automatically performs sample production, measurement, and optimization.
- the production evaluation system of Patent Document 1 includes a production device that produces samples, a measurement device that measures material information that represents the physical properties or structure of the sample produced by the production device, and an estimation device connected to the production device and the measurement device.
- the estimation device includes an estimation unit that estimates optimal production conditions based on a data set including the production conditions and material information of the sample, and a data addition unit that adds the production conditions estimated by the estimation unit and material information measured on the sample produced according to the production conditions to the data set. Therefore, the estimation unit can sequentially estimate the production conditions based on the added data set.
- the results of an experiment to minimize the electrical resistance of a Nb-doped TiO2 thin film formed on a glass substrate are disclosed.
- a sputtering method is used for film formation, and two types of targets, Ti0.94Nb0.06O2 and Ti1.98Nb0.02O3, which have different ratios of Ti and O, are used.
- the mixture ratio of Ar gas and a mixture of Ar (99%) and O2 (1%) the oxygen content (oxygen partial pressure) in the thin film at which the electrical resistance is at its minimum is sought.
- the upper and lower limits of the oxygen partial pressure which correspond to the manufacturing conditions of the sample, are determined, divided into a grid, and the minimum value of the acquisition function is sought.
- the minimum value of electrical resistance was found in 18 experiments.
- the purpose of this disclosure is to provide a manufacturing condition selection method, a material manufacturing method, a manufacturing condition selection device, and a program that can efficiently select manufacturing conditions that improve the characteristic values of a material.
- a manufacturing condition selection method an input step of inputting an initial data group including initial manufacturing condition data and characteristic value data of the material as a manufacturing object; a search range setting step of setting a search range for manufacturing conditions of the material based on the initial data group; a calculation step of calculating a predicted characteristic value, which is a predicted value of a characteristic value of the material in the search range based on the initial data group, and a prediction error, which is an estimated error of the predicted characteristic value, using a machine learning model; and a selection step of selecting manufacturing conditions for the material to be used as experimental points based on a calculated value of an acquisition function that uses parameters based on the initial data group, the predicted characteristic value, and the prediction error.
- the acquisition function is expressed by the following formula (1), where A is the calculated value, R is a random number corresponding to the magnitude of the measurement error for correcting the measurement error when measuring the characteristic value of the material, y av is the predicted characteristic value, y ⁇ is the error of the predicted characteristic value, Y is the actual measured value of the characteristic value, Y ⁇ is the standard deviation of the actual measured values, max(Y) is the maximum value of the actual measured values, and ⁇ 1 , ⁇ 2, and ⁇ 3 are parameters for correcting the predicted error.
- a method for producing a material according to an embodiment of the present disclosure includes the steps of: The material is manufactured using manufacturing conditions selected by any one of the manufacturing condition selection methods [1] to [3].
- a manufacturing condition selection device an input unit for inputting an initial data group including initial manufacturing condition data and characteristic value data of the material as a manufacturing object; a search range setting unit that sets a search range for manufacturing conditions of the material based on the initial data group; A calculation unit that calculates a predicted characteristic value that is a predicted value of a characteristic value of the material in the search range based on the initial data group using a machine learning model, and a prediction error that is an estimated error of the predicted characteristic value; A selection unit selects manufacturing conditions for the material to be used as experimental points based on a calculated value of an acquisition function that uses parameters based on the initial data group, the predicted characteristic value, and the prediction error.
- a program Computer, an input unit for inputting an initial data group including initial manufacturing condition data and characteristic value data of the material as a manufacturing object; a search range setting unit that sets a search range for manufacturing conditions of the material based on the initial data group; A calculation unit that calculates a predicted characteristic value that is a predicted value of a characteristic value of the material in the search range based on the initial data group using a machine learning model, and a prediction error that is an estimated error of the predicted characteristic value; The apparatus functions as a selection unit that selects manufacturing conditions for the material to be used as an experiment point based on a calculated value of an acquisition function that uses a parameter based on the initial data group, the predicted characteristic value, and the prediction error.
- the present disclosure provides a manufacturing condition selection method, a material manufacturing method, a manufacturing condition selection device, and a program that can efficiently select manufacturing conditions to improve the characteristic values of a material.
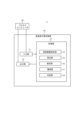
- FIG. 1 is a schematic diagram illustrating a configuration example of a manufacturing condition selection system including a manufacturing condition selection device according to an embodiment of the present disclosure.
- FIG. 2 is a flowchart showing the process of a manufacturing condition selection method according to an embodiment of the present disclosure.
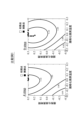
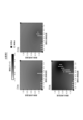
- FIG. 3 is a diagram showing the distribution of characteristic values based on measured values obtained by the experiment in Example 1.
- FIG. 4 is a diagram showing the relationship between the number of steps and the maximum value of the characteristic value in the first embodiment.
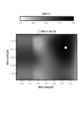
- FIG. 5 is a diagram showing the distribution of characteristic values according to the number of steps in the first example of the invention.
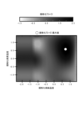
- FIG. 6 is a diagram showing the distribution of characteristic values according to the number of steps in the second example of the invention.
- FIG. 1 is a schematic diagram illustrating a configuration example of a manufacturing condition selection system including a manufacturing condition selection device according to an embodiment of the present disclosure.
- FIG. 2 is a flowchart showing the process of a manufacturing condition selection method according to an embodiment of the present disclosure.
- FIG. 7 is a diagram showing the distribution of characteristic values according to the number of steps in Comparative Example 1.
- FIG. 8A is a diagram showing the distribution of a plurality of characteristic values based on measured values obtained by an experiment in Example 2.
- FIG. 8B is a diagram showing the distribution of a plurality of characteristic values based on measured values obtained by an experiment in Example 2.
- FIG. 8C is a diagram showing the distribution of a plurality of characteristic values based on measured values obtained by an experiment in Example 2.
- FIG. 9 is a diagram showing the relationship between the number of steps and the maximum value of the characteristic value in the second embodiment.
- FIG. 10 is a diagram showing the distribution of characteristic values according to the number of steps in the third example of the invention.
- FIG. 11 is a diagram showing the distribution of characteristic values according to the number of steps in the fourth example of the invention.
- FIG. 12 is a diagram showing the distribution of characteristic values according to the number of steps in Comparative Example 2.
- FIG. 13 is a diagram showing the distribution of characteristic values according to the number of steps in Comparative Example 3.
- FIG. 12 is a diagram showing the distribution of characteristic values according to the number of steps in Comparative Example 2.
- FIG. 1 is a block diagram of a manufacturing condition selection system 1 including a manufacturing condition selection device 10 according to the present embodiment.
- the manufacturing condition selection system 1 includes the manufacturing condition selection device 10.
- the manufacturing condition selection device 10 includes an input unit 11, an output unit 12, and a processing unit 13.
- the processing unit 13 includes a search range setting unit 14, a calculation unit 15, a selection unit 16, an acquisition unit 17, and a judgment unit 18.
- the manufacturing condition selection system 1 may further include a process computer 30, as in the configuration example of FIG. 1.
- the configuration of the manufacturing condition selection system 1 is not limited to that shown in FIG. 1.
- the manufacturing condition selection system 1 may further include a display (display device) that displays data from the output unit 12.
- the manufacturing condition selection system 1 may further include a server computer that aggregates data together with the process computer 30 or instead of the process computer 30.
- a server computer that aggregates data together with the process computer 30 or instead of the process computer 30.
- an operator may be able to input data to the server computer via an input device (e.g., a mouse, a keyboard, etc.), and the input data may be transferred from the server computer to the input unit 11.
- the process computer 30 may be a computer located above a plurality of control computers each of which controls a specific manufacturing device. In this case, data may be input to the input unit 11 directly from some or all of the control computers.
- the process computer 30 is a computer that controls manufacturing equipment in a line (production line) that manufactures a manufacturing object, or a computer that controls experimental conditions related to manufacturing in a lab (laboratory).
- the manufacturing object may be, for example, a metal material including a steel material, but is not limited to a metal material and may be a general material.
- the process computer 30 can also function as a data server that aggregates data related to manufacturing.
- a server computer that aggregates data related to manufacturing may be used instead of the process computer 30.
- the data related to manufacturing includes, for example, manufacturing conditions and measured values obtained by measuring the manufactured material.
- the process computer 30 may be capable of communicating with the manufacturing condition selection device 10 via a network.
- the manufacturing condition selection device 10 is a device for selecting manufacturing conditions so as to improve the characteristic values of the material to be manufactured.
- the characteristic values are values that represent the characteristics of the material, such as the strength of a metal material, It may be a value obtained by combining proof stress, elongation, hardness, or the like.
- the input unit 11 is an input interface of the manufacturing condition selection device 10.
- An initial data group including initial manufacturing condition data and material characteristic value data for the material to be manufactured is input to the input unit 11.
- “initial” indicates that it has already been set, already measured, or already predicted.
- the initial data group includes initial manufacturing conditions, which are manufacturing conditions, and characteristic values already obtained by actual measurement or prediction (calculation) of the material.
- the input unit 11 executes an input process, which will be described later.
- the manufacturing conditions include not only the conditions on the manufacturing line but also experimental conditions in the laboratory.
- the output unit 12 is an output interface of the manufacturing condition selection device 10.
- the output unit 12 may output the manufacturing conditions selected by the manufacturing condition selection device 10 to the process computer 30.
- the output unit 12 may also display the manufacturing conditions selected by the manufacturing condition selection device 10 on a display device such as various displays so that an operator of the manufacturing line can confirm the manufacturing conditions.
- the output unit 12 executes an output process described later.
- the processing unit 13 performs calculations for the manufacturing condition selection device 10 to select manufacturing conditions.
- the processing unit 13 may also have a function as a control unit that controls the entire manufacturing condition selection device 10.
- the processing unit 13 may be one or more processors.
- the processor is, for example, a general-purpose processor or a dedicated processor specialized for a specific process, but is not limited to these and may be any processor.
- the processing unit 13 includes a search range setting unit 14, a calculation unit 15, a selection unit 16, an acquisition unit 17, and a judgment unit 18.
- the functions of the search range setting unit 14, the calculation unit 15, the selection unit 16, the acquisition unit 17, and the judgment unit 18 may be realized by software.
- one or more programs may be stored in a storage device accessible to the processing unit 13. When a program stored in the storage device is read by the processing unit 13, which is a processor, it may cause the processing unit 13 to function as the search range setting unit 14, the calculation unit 15, the selection unit 16, the acquisition unit 17, and the judgment unit 18.
- the search range setting unit 14 sets a search range for the manufacturing conditions of the material based on the initial data group. That is, the search range setting unit 14 sets a limit on the range of the manufacturing conditions to be selected. Details of the process executed by the search range setting unit 14 will be described later. The search range setting unit 14 also executes a search range setting step to be described later.
- the calculation unit 15 uses the model to calculate a predicted property value, which is a predicted value of a property value of a material in a search range based on an initial data group, and a prediction error, which is an estimated error of the predicted property value.
- the model is a machine learning model. Details of the process executed by the calculation unit 15 will be described later.
- the calculation unit 15 also executes a calculation step, which will be described later.
- the selection unit 16 selects the manufacturing conditions of the material to be the experimental points based on the calculated values of the acquisition function using parameters based on the initial data group, the predicted characteristic values, and the prediction errors.
- the experimental points are the specific manufacturing conditions under which an experiment (manufacturing of the material in this embodiment) has been performed or will be performed. It is preferable that the experimental points selected by the selection unit 16 are manufacturing conditions that are not included in the initial manufacturing condition data, that is, manufacturing conditions that have not been experimented before. The details of the process executed by the selection unit 16 will be described later.
- the selection unit 16 also executes a selection process described later.
- the acquisition unit 17 acquires the characteristic values of the material under the manufacturing conditions set as the experimental points. The details of the process executed by the acquisition unit 17 will be described later. The acquisition unit 17 also executes an acquisition step, which will be described later.
- the judgment unit 18 judges whether or not to select further manufacturing conditions for materials to be new experimental points by comparing the calculated values of the acquisition function before and after adding the manufacturing conditions set as experimental points and the acquired characteristic values of the material to the initial data group.
- the fact that there is no need to select further manufacturing conditions for materials to be new experimental points is sometimes referred to as "pass”.
- the judgment unit 18 judges "pass”, which does not require the selection of new experimental points, or "fail”, which requires the selection of new experimental points. Details of the process executed by the judgment unit 18 will be described later.
- the judgment unit 18 also executes a judgment process, which will be described later.
- the manufacturing condition selection device 10 is not limited to a specific device, but as an example, it can be realized by a computer.
- the computer can be, for example, a general-purpose computer that is commercially available.
- the computer includes, for example, a storage device such as a memory and a hard disk drive, a CPU, and an input/output device.
- the processing unit 13 may be realized by the CPU.
- the program loaded by the processing unit 13 may be stored in the storage device.
- the input unit 11 and the output unit 12 may be realized by an input/output device.
- the manufacturing condition selection method 2 is a flowchart showing the process of the manufacturing condition selection method executed by the manufacturing condition selection device 10 according to the present embodiment.
- the manufacturing condition selection method generally includes an input step, a search range setting step, and a calculation step.
- the manufacturing condition selection method may further include an obtaining step and a determining step.
- an initial data group including initial manufacturing condition data and material characteristic value data is input (step S11).
- the initial data group is a data group that includes existing initial manufacturing condition data and characteristic value data of the material obtained under those manufacturing conditions.
- the manufacturing condition data are control variables that are used to control the manufacturing of the material that is the target of production. For example, if the material being manufactured is DP steel plate, the manufacturing condition data would be the chemical composition, annealing temperature, annealing time, tempering temperature, etc.
- the material characteristic value data is the characteristic value of the material that is the target (the object to be improved). For example, if the material to be manufactured is a DP steel plate, the material characteristic value data is the yield strength, tensile strength, elongation value, etc.
- the initial data group should be one or more sets.
- a set is a combination of manufacturing conditions and the characteristic values of the material manufactured under those manufacturing conditions.
- the initial data group be two or more sets, and more preferably four or more sets. It is preferable that the number of sets of the initial data group be as large as possible.
- the initial data group When the number of sets in the initial data group is small, in order to efficiently predict (i.e., with fewer experimental steps) manufacturing conditions that will result in better characteristic values, it is preferable for the initial data group to include sets that correspond to the ends (near the boundaries) of the search range described below.
- search range setting process In the search range setting step, a search range for the manufacturing conditions of the material is set based on the initial data group (step S12).
- the upper and lower limits of the search range for searching the manufacturing conditions of the material to be used as the experimental point are set so that the material's characteristic values are improved over the characteristic values of the initial data group.
- the calculated value of the acquisition function used in the selection process described below has the property of increasing the further it deviates from the manufacturing conditions of the data points input as the initial data group. If a search range is not set, the nature of this acquisition function may result in the selection of experimental points that are significantly different from the manufacturing conditions of the data points input as the initial data group, which may result in the calculations diverging. For this reason, a search range is set.
- the upper and lower limits of the search range may be set based on the initial manufacturing condition data, and may also be set taking into account conventional knowledge (e.g., widely known theories or knowledge in materials manufacturing).
- the search range may be set so that a low annealing temperature at which carbon diffusion cannot occur and the material structure does not change at all is not selected.
- the upper and lower limit values of the search range of the component composition, annealing temperature, etc., which are manufacturing conditions are set.
- the A1 point may be selected as the lower limit of the annealing temperature
- the A4 point may be selected as the upper limit of the annealing temperature.
- the annealing temperature is less than the A1 point, the phase does not transform into austenite, so the structure does not change at all, and the improvement in the balance between strength and ductility due to annealing cannot be expected.
- the annealing temperature exceeds the A4 point, ⁇ -ferrite precipitates. Therefore, it is known that if the annealing temperature exceeds the A4 point, even if the structure is made full austenite by subsequent cooling, the structure becomes full martensite by quenching, so that the improvement in the balance between strength and ductility cannot be expected. In this way, by eliminating conditions that do not promise improvement in properties based on conventional knowledge of materials, it is possible to predict the manufacturing conditions for materials that efficiently realize excellent property values. Therefore, it is preferable to select experimental conditions within a reasonable range based on material knowledge. However, when searching for an area that differs from conventional knowledge, i.e., common sense in materials systems, it is acceptable to set the search range without being bound by conventional knowledge.
- the search range may be a continuous space, but in order to achieve an improvement in the material's characteristic values with a small amount of experimental man-hours, it is preferable that it be a discrete space.
- the search range is a discrete space, the number of manufacturing conditions (search points) of the material to be searched can be reduced compared to when the search range is a continuous space.
- a predicted characteristic value and a predicted error of the material in the search range are calculated using a model based on the initial data group (step S13).
- the manufacturing conditions of the material which are the control variables, are changed within the search range set in the search range setting process to calculate the predicted characteristic values and prediction errors of the material.
- predicted characteristic values of the material such as yield strength and tensile strength, are calculated for control variables such as the composition, annealing temperature, and annealing time.
- a model such as a machine learning model may be used to calculate the predicted characteristic values of the material.
- the machine learning model may be generated using a neural network model, a Gaussian process model, a random forest, or the like. For example, from actual manufacturing data collected in the process computer 30, multiple sets of manufacturing conditions and the characteristic values of the material manufactured under those manufacturing conditions may be extracted and used as learning data.
- the model used to calculate the predicted characteristic values of the material may be an interpolation function generated based on a group of initial data such as known linear approximation or spline interpolation. When multiple models are used in the calculation process, the average value of the predicted characteristic values calculated using the multiple models may be adopted as the final predicted characteristic value.
- the error (prediction error) of the calculated predicted property value of the material is calculated.
- the prediction error may be the standard deviation of the predicted property values calculated using multiple models.
- the prediction error may be the standard deviation of the predicted property values calculated by changing the combination of the initial data group input using one model.
- the prediction error is obtained from one model, such as calculation using a Gaussian process model, the obtained prediction error may be used as is.
- selection process manufacturing conditions for a material to be used as an experiment point are selected based on a calculated value of an acquisition function obtained using an initial data group, predicted property values of the material, and prediction errors (step S14).
- the selected experimental point is, for example, a manufacturing condition that is an optimal solution where the acquisition function shows a maximum or minimum value (maximum value in this embodiment).
- the selected experimental point may be a manufacturing condition for a sub-optimal solution (for example, the top 10% or more of the acquisition function).
- a sub-optimal solution for example, the top 10% or more of the acquisition function.
- the acquisition function generally used is UCB (Upper Confidence Bound) or PI (Probability of Improvement).
- UCB Upper Confidence Bound
- PI Probability of Improvement
- the acquisition function shown in formula (1) is used to improve the efficiency of the selection.
- A is the calculated value of the acquisition function.
- R is a random number. More specifically, R is a parameter for correcting measurement errors when measuring the property values of a material, and is a random number according to the magnitude of the measurement error.
- y av is a predicted value (predicted property value).
- y ⁇ is the error of the predicted value (predicted property value).
- Y is the actual measured value of the property value.
- Y ⁇ is the standard deviation of the actual measured values.
- max(Y) is the maximum value of the actual measured values.
- ⁇ 1 , ⁇ 2 and ⁇ 3 are parameters. More specifically, ⁇ 1 , ⁇ 2 and ⁇ 3 are parameters for correcting the predicted error.
- the measurement error can be corrected by generating a random number R in the range of 0.99 to 1.01. If the measurement error is small, R can be set to 1.0.
- ⁇ 1 , ⁇ 2 , and ⁇ 3 are preferably 0.01 or more, more preferably 0.1 or more, and even more preferably 0.5 or more. If ⁇ 1 , ⁇ 2 , and ⁇ 3 are less than 0.1, the influence of prediction error becomes excessively small, and the number of experimental steps required until the pass/fail judgment described later increases. Moreover, ⁇ 1 , ⁇ 2 , and ⁇ 3 are preferably 10.0 or less, and more preferably 5.0 or less. If ⁇ 1 , ⁇ 2 , and ⁇ 3 are greater than 10.0, the influence of prediction error becomes excessively large, and the number of experimental steps required until the pass/fail judgment described later increases.
- i is each parameter corresponding to the characteristic value i.
- the magnitude of the absolute value of the acquisition function A i corresponding to each characteristic value changes depending on the magnitude of the characteristic value. Therefore, if the acquisition function is calculated by multiplying the acquisition functions corresponding to each characteristic value, the influence of the characteristic value with a large absolute value will be large, and the characteristic value with a small absolute value may not be taken into account. Therefore, it is preferable to calculate the acquisition function A after standardizing it by the maximum value max(A i ) of the acquisition function A i corresponding to each characteristic value.
- R i is a random number corresponding to the characteristic value i. More specifically, R i is a parameter for correcting the measurement error when measuring the characteristic value i of the material, and is a random number according to the magnitude of the measurement error.
- y av,i is the predicted value (predicted characteristic value) of the characteristic value i.
- y ⁇ ,i is the error of the predicted value (predicted characteristic value) of the characteristic value i.
- Y i is the actual measured value of the characteristic value i.
- Y ⁇ ,i is the standard deviation of the actual measured value of the characteristic value i.
- max(Y i ) is the maximum value of the actual measured value of the characteristic value i.
- ⁇ 1,i , ⁇ 2,i and ⁇ 3,i are parameters corresponding to the characteristic value i, respectively. More specifically, ⁇ 1,i , ⁇ 2,i and ⁇ 3,i are parameters for correcting the prediction error.
- the measurement error can be corrected by generating a random number R i in the range of 0.99 to 1.01.
- R i may be set to 1.0.
- ⁇ 1 ,i , ⁇ 2 ,i, and ⁇ 3,i are preferably 0.01 or more, more preferably 0.1 or more, and even more preferably 0.5 or more. If ⁇ 1, i, ⁇ 2, i , and ⁇ 3 ,i are less than 0.1, the influence of the prediction error becomes excessively small, and the number of experimental steps required until the pass/fail judgment described later increases. Moreover, ⁇ 1,i , ⁇ 2 ,i, and ⁇ 3,i are preferably 10.0 or less, and more preferably 5.0 or less. If ⁇ 1,i , ⁇ 2, i , and ⁇ 3,i are greater than 10.0, the influence of the prediction error becomes excessively large, and the number of experimental steps required until the pass/fail judgment described later increases.
- the characteristic values of the material under the manufacturing conditions of the material to be the experiment point selected in the selection step are acquired (step S15).
- the data points obtained in the selection process i.e., the selected experimental points and the characteristic values (data sets) of the material corresponding to these experimental points, are added to the initial data group.
- a machine learning model may be generated (updated) using the initial data group to which the data sets have been added.
- the material is actually manufactured at the selected experimental points (manufacturing conditions) and the characteristic values of the manufactured material are actually measured.
- the characteristic values added to the initial data group are actual measured values.
- the characteristic values added to the initial data group may be predicted characteristic values calculated using a machine learning model, etc.
- Step S16 In the judgment process, based on the calculated values of the acquisition function obtained before and after adding the selected experimental point (manufacturing conditions) and the characteristic values acquired in the acquisition process to the initial data group, it is determined whether or not to select manufacturing conditions for a material that will become a new experimental point (step S16).
- the calculated value of the acquisition function obtained from the initial data group input in the input step using formula (1) is assumed to be ( A1 ).
- the calculated value of the acquisition function obtained from the initial data group after adding the data points representing the characteristic values and their manufacturing conditions obtained in the acquisition step using formula (1) is assumed to be ( A2 ).
- ( A1 ) and ( A2 ) are compared to determine whether or not to search for manufacturing conditions to be the next experimental point.
- the difference between (A 1 ) and (A 2 ) is calculated, and the difference is divided by the data points (the number of search points) to obtain a normalized difference.
- the threshold is 0.001 as an example, but is not limited to a specific value, and may be set according to, for example, the type of material to be targeted.
- the process is returned to the input process (step S11), and a series of processes is performed again.
- the initial data group input in the input process becomes the initial data group after the data set is added in the acquisition process.
- step S18 The output step may output the pass/fail result of the evaluation step, as well as the characteristic values obtained in the acquisition step and the manufacturing conditions thereof.
- the manufacturing condition selection method according to this embodiment may be realized by installing software for executing the processing of the manufacturing condition selection method in a computer. Also, the manufacturing condition selection method according to this embodiment may be realized by installing the software in a cloud computer on a network.
- the manufacturing condition selection method executed by the manufacturing condition selection device 10 can efficiently select manufacturing conditions for improving the characteristic values of the material.
- the manufacturing condition selection method may be executed as part of a manufacturing method for the material to be manufactured.
- the process computer 30 may acquire the manufacturing conditions selected by the manufacturing condition selection method executed by the manufacturing condition selection device 10, and control the manufacturing of the material using the acquired manufacturing conditions.
- Example 1 the material to be manufactured is mild steel, which is required to be soft and elongate.
- manufacturing conditions were selected for mild steel that has one characteristic of being softer and more elongate. The characteristic of being softer and more elongate is determined to be better when the ratio (El/YS), which is the ratio of the total elongation value (El) to the yield strength (YS), which is a characteristic value of the material, is larger.
- the tempering temperature and tempering time were changed. There were four combinations of tempering temperature and tempering time (first condition to fourth condition) as follows, and test materials 1 to 4 were manufactured under each of the conditions.
- the normalized tempering temperature is the normalized tempering temperature. Normalization was performed by determining the average value and standard deviation of the tempering temperatures for 30 experimental points in the mild steel database obtained up to now, subtracting the determined average value from the tempering temperature, and dividing by the standard deviation. Additionally, the normalized tempering time is the normalized tempering time. Normalization was performed by determining the average value and standard deviation of the tempering times for 30 experimental points in the mild steel database obtained up to now, subtracting the determined average value from the tempering time, and dividing by the standard deviation.
- test materials 1 to 4 JIS No. 5 test pieces 1 to 4 were manufactured and tensile tests were performed to measure the yield strength (YS) and total elongation (El) of test materials 1 to 4.
- the manufacturing conditions of the obtained material and the characteristic value (El/YS) of the material manufactured under those manufacturing conditions were used as the initial data group (corresponding to step S11).
- the characteristic value (El/YS) was also standardized.
- El/YS El is first calculated as the average value of 30 El experimental points in the mild steel database, and then divided by this average value to calculate the normalized El (norm.El).
- YS is divided by the average value of 30 YS experimental points to calculate the normalized YS (norm.YS).
- norm.El/norm.YS is calculated to normalize (El/YS). All characteristic values (El/YS) below are calculated as this normalized norm. El/norm. Indicates YS.
- the search range was set (corresponding to step S12).
- the ends of the normalized tempering temperature and normalized tempering time in the initial data group were set as the upper and lower limits of the search range for the normalized tempering temperature and normalized tempering time. That is, the upper limit of the search range for the normalized tempering temperature was set to 0.3, and the lower limit was set to -0.3. Also, the upper limit of the search range for the normalized tempering time was set to 0.3, and the lower limit was set to -0.3.
- the search range was set to be a discrete space with the normalized tempering temperature and normalized tempering time each divided in increments of 0.01.
- step S13 the predicted characteristic values and prediction errors were calculated (corresponding to step S13).
- the predicted characteristic values and prediction errors were calculated using the initial data set with a Gaussian process model.
- the initial data group and the obtained predicted characteristic values and prediction errors were used to calculate the acquisition function (A 1 ) of the above formula (1).
- the manufacturing conditions under which the calculated value (A 1 ) of the acquisition function was maximum were selected as the experimental points (corresponding to step S14).
- the selected manufacturing conditions may be referred to as "manufacturing conditions (1)”.
- characteristic value (1) (El/YS) under the manufacturing conditions of the selected experimental point was obtained (corresponding to step S15).
- characteristic value (1) the characteristic value (El/YS) under the manufacturing conditions of the selected experimental point was obtained (corresponding to step S15).
- characteristic value (1) was obtained from Figure 3 shown below.
- Figure 3 shows the distribution of characteristic values based on measured values.
- the distribution in Figure 3 was calculated by creating a spline interpolation function based on 30 characteristic values (El/YS) measured in an experiment.
- the characteristic maximum value which is the maximum value of the characteristic value (El/YS)
- the distribution of characteristic values is shown in a graph with the horizontal axis representing the normalized tempering temperature and the vertical axis representing the normalized tempering time.
- the coordinates (normalized tempering temperature, normalized tempering time) corresponding to the characteristic maximum value are (-0.11, 0.14).
- R of the acquisition function defined by formula (1) was set to 1.0.
- step S16 based on the calculated value (A 2 ) of the acquisition function obtained after adding the manufacturing condition (1) and the characteristic value (1) of the obtained material to the initial data group, and the calculated value (A 1 ) of the acquisition function, it was determined whether or not to search for manufacturing conditions to be the next experimental point (corresponding to step S16). Specifically, for the manufacturing conditions in the search range, the difference between (A 1 ) and (A 2 ) was calculated, and the difference was divided by the data point to calculate a normalized difference.
- the normalized difference was 0.001 or more (above the threshold), it was determined to be unsuccessful (corresponding to No in step S17), the characteristic value (1) and the manufacturing condition (1) were added to the initial data group, and the processing corresponding to the above steps S11 to S16 was performed. Thereafter, the processing corresponding to the above steps S11 to S16 was repeatedly performed until the normalized difference was less than 0.001 (less than the threshold).
- Example 1 for the acquisition function of formula (1) used in the selection process, ⁇ 1 was set to 1.0, and ⁇ 2 and ⁇ 3 were set to 2.0. In Example 2, for the acquisition function of formula (1) used in the selection process, ⁇ 1 was set to 1.0, and ⁇ 2 and ⁇ 3 were set to 0.1.
- UCB (Equation (2)) was used as the acquisition function, and the coefficient term ( ⁇ U ) of the prediction error value was set to 6.0.
- y av is the prediction value (predicted characteristic value)
- y ⁇ is the error of the prediction value (predicted characteristic value).
- Figure 4 shows the relationship between the number of steps and the maximum characteristic value when manufactured under the manufacturing conditions proposed by this model.
- the characteristic values here were obtained from a function interpolated with the spline function shown in Figure 3.
- the number of steps is the number of times the process from the input step to the judgment step was executed, and can also be called the number of trials.
- the maximum characteristic value obtained in steps 1 to 6 is shown.
- the number of steps required to reach the maximum characteristic was 12 times (12 steps) in Comparative Example 1, whereas in Invention Example 1, the characteristic approached the maximum characteristic in 4 times (4 steps) and reached the maximum characteristic in 8 times (8 steps).
- Invention Example 2 the characteristic reached the maximum characteristic in 9 times (9 steps), and it can be seen that the number of steps in the invention examples is fewer than that in the comparative examples.
- Example 1 The distribution of predicted characteristic values according to the number of steps is shown for Example 1 in FIG. 5, Example 2 in FIG. 6, and Comparative Example 1 in FIG. 7. Each figure shows the cases where the number of steps is 4 (4 steps) and 9 (9 steps). In addition, the experimental points are indicated by dots in each figure.
- Example 1 the maximum characteristic value was discovered quickly and there was little bias in the selection of experimental points. In addition, Example 1 was able to largely reproduce the distribution in Figure 3, which was given as the correct answer.
- the characteristic value was acquired from a spline interpolation function created based on the characteristic values (El/YS) of 30 points.
- the characteristics may be maximized by a similar procedure using the yield strength (YS) and total elongation value (El) obtained by actually creating a sample at the selected experimental point and performing a tensile test on the sample.
- Example 2 the material to be manufactured is a high tensile steel that requires high tensile strength and high ductility (high elongation value).
- manufacturing conditions for the high tensile steel that can achieve both of the two characteristics of high tensile strength and high elongation value were selected.
- the annealing temperature and tempering temperature were changed. There were two combinations of the annealing temperature and tempering temperature (fifth and sixth conditions) as follows, and test materials 5 and 6 were manufactured under each of the conditions.
- the normalized annealing temperature is the normalized annealing temperature. Normalization was performed by finding the average value of the annealing temperatures at 25 experimental points in the database of high-tensile steel obtained up to now, subtracting the average value found from the annealing temperature, and dividing by the standard deviation. Also, the normalized tempering temperature is the normalized tempering temperature. Normalization was performed by finding the average value of the tempering temperatures at 25 experimental points in the database of high-tensile steel obtained up to now, subtracting the average value found from the tempering temperature, and dividing by the standard deviation.
- test materials 5 and 6 JIS No. 5 test pieces 5 and 6 were manufactured and tensile tests were conducted to measure the tensile strength (TS) and total elongation (El) of test materials 5 and 6.
- the manufacturing conditions of the obtained materials and the characteristic values TS and El of the materials manufactured under those manufacturing conditions were used as the initial data group (corresponding to step S11).
- the characteristic values TS and El were also standardized in the same way as the annealing temperature and tempering temperature. Below, the characteristic values TS and El are shown as standardized numerical values.
- the search range was set (corresponding to step S12).
- the ends of the normalized annealing temperature and normalized tempering temperature in the initial data group were set as the upper and lower limits of the search range for the normalized annealing temperature and normalized tempering temperature. That is, the upper limit of the search range for the normalized annealing temperature was set to 1.41, and the lower limit was set to -2.36. Also, the upper limit of the search range for the normalized tempering temperature was set to 1.41, and the lower limit was set to -1.41.
- the search range was set to be a discrete space with the normalized annealing temperature and normalized tempering temperature divided into increments of 0.236 and 0.141, respectively.
- step S13 the predicted characteristic values and prediction errors were calculated for TS and El (corresponding to step S13).
- the predicted characteristic values and prediction errors were calculated using the Gaussian process model using the initial data set.
- the calculated value (A 1 ) of the acquisition function of the above formula (3) was obtained using the initial data group and the obtained predicted characteristic values and prediction errors of TS and El.
- the manufacturing conditions under which the calculated value (A 1 ) of the acquisition function was maximum were selected as the experimental point (corresponding to step S14).
- the selected manufacturing conditions may be referred to as "manufacturing conditions (1)" below.
- Characteristic value (1) was obtained from Figures 8A and 8B shown below.
- Figures 8A to 8C are diagrams showing the distribution of characteristic values based on the measured values in Example 2, where Fig. 8A shows normalized TS, Fig. 8B shows normalized El, and Fig. 8C shows normalized TS x El obtained by multiplying TS and El. Normalized TS x El is normalized by subtracting the average value of TS x El obtained after multiplying TS and El, and dividing by its standard deviation.
- Figs. 8A to 8C were calculated by creating a spline interpolation function based on the 25 characteristic values (TS and El) measured in the experiment.
- Figs. 8A to 8C and Figs. 10 to 13 described later the distribution of characteristic values is shown in a graph with the normalized annealing temperature on the horizontal axis and the normalized tempering temperature on the vertical axis.
- the maximum value of TS is calculated to be "1.83”
- the coordinates (normalized annealing temperature, normalized tempering temperature) corresponding to the characteristic maximum value at this time are (-0.94, 0.14).
- the maximum value of El is calculated to be "2.30", and the coordinates (normalized annealing temperature, normalized tempering temperature) corresponding to the characteristic maximum value at this time are (0.71, 0.57).
- the maximum value of TS x El is calculated to be "2.7”, and the coordinates (normalized annealing temperature, normalized tempering temperature) corresponding to the characteristic maximum value at this time are (0.71, 0.57).
- R i of the acquisition function defined by equation (4) is set to 1.0.
- step S16 based on the calculated value (A 2 ) of the acquisition function obtained after adding the manufacturing conditions (1) and characteristic value (1) of the obtained material to the initial data group, and the calculated value (A 1 ) of the acquisition function, it was determined whether or not to search for manufacturing conditions to be the next experimental point (corresponding to step S16). Specifically, for the manufacturing conditions in the search range, the difference between (A 1 ) and (A 2 ) was calculated, and the difference was divided by the data point to calculate a normalized difference.
- the normalized difference was 1.0 ⁇ 10 ⁇ 6 or more (above the threshold), it was determined to be unsuccessful (corresponding to No in step S17), and the characteristic value (1) and manufacturing conditions (1) were added to the initial data group, and the processing corresponding to steps S11 to S16 was performed. Thereafter, the processing corresponding to steps S11 to S16 was repeatedly performed until the normalized difference was less than 1.0 ⁇ 10 ⁇ 6 (less than the threshold).
- Example 3 for the acquisition functions of formulas (3) and (4) used in the selection process, ⁇ 1 ,i was set to 1.0, and ⁇ 2 ,i and ⁇ 3 ,i were set to 2.0.
- Example 4 for the acquisition functions of formulas (3) and (4) used in the selection process, ⁇ 1,i was set to 0.5, and ⁇ 2 ,i and ⁇ 3 ,i were set to 2.0.
- UCB (Equations (5) and (6)) was used as the acquisition function, and the coefficient term ( ⁇ U,i ) of the prediction error value was set to 0.0.
- UCB (Equation (5)) was used as the acquisition function, and the coefficient term ( ⁇ U,i ) of the prediction error value was set to 6.0.
- y av,i is the predicted value (predicted characteristic value) of characteristic value i
- y ⁇ ,i is the error of the predicted value (predicted characteristic value) of characteristic value i.
- max(UCBi) is the maximum value of the acquisition function UCBi corresponding to characteristic value i.
- Figure 9 shows the relationship between the number of steps and the maximum value of the characteristic value TS x El when manufactured under the manufacturing conditions proposed by this model.
- the characteristic value TS x El is calculated by multiplying TS and El calculated from the spline interpolation function shown in Figures 8A and 8B, respectively, and the performance can be evaluated based on whether the characteristic value TS x El reaches the maximum value.
- the number of steps is the number of times the process from the input step to the judgment step is executed, and can also be called the number of trials. In Figure 9, for example, if the number of steps is 6, the maximum value of the characteristic values obtained in steps 1 to 6 is shown.
- the number of steps to reach the characteristic maximum was 40 times (40 steps) in Comparative Example 2, and the characteristic maximum value was not found in Comparative Example 3, whereas in Invention Example 3, the characteristic maximum value was approached in 13 times (13 steps) and reached in 17 times (17 steps). In Example 4, the maximum characteristic value was reached after 21 steps, and it can be seen that the number of steps in the Example was fewer than in the Comparative Example.
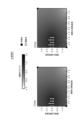
- FIG. 10 shows the distribution of predicted characteristic values according to the number of steps for Example 3 of the invention.
- FIG. 11 shows the distribution of predicted characteristic values according to the number of steps for Example 4 of the invention.
- FIG. 12 shows the distribution of predicted characteristic values according to the number of steps for Comparative Example 2.
- FIG. 13 shows the distribution of predicted characteristic values according to the number of steps for Comparative Example 3.
- Each figure shows the cases where the number of steps is 17 (17 steps), 21 (21 steps), and 41 (41 steps).
- Example 3 of the invention in FIG. 10 processing is completed before the 21st step, so figures for the 21st step and the 41st step are not shown.
- Example 4 of the invention in FIG. 11 processing is completed before the 41st step, so figures for the 41st step are not shown.
- Comparative Example 3 in FIG. 13 no improvement in the characteristic values was observed even after 41 repetitions (41 steps), so the graph for 41 repetitions (41 steps) is not shown.
- the experimental points are indicated by dots in each figure.
- the characteristic values were acquired from a spline interpolation function created based on 25 characteristic values.
- the characteristics may be maximized by a similar procedure using the tensile strength (TS) and total elongation (El) obtained by actually creating a sample at the selected experimental points and performing a tensile test on the sample.
Landscapes
- Engineering & Computer Science (AREA)
- Computing Systems (AREA)
- Theoretical Computer Science (AREA)
- Life Sciences & Earth Sciences (AREA)
- Bioinformatics & Cheminformatics (AREA)
- Bioinformatics & Computational Biology (AREA)
- Chemical & Material Sciences (AREA)
- Crystallography & Structural Chemistry (AREA)
- Health & Medical Sciences (AREA)
- Chemical Kinetics & Catalysis (AREA)
- Analytical Chemistry (AREA)
- Artificial Intelligence (AREA)
- Computer Vision & Pattern Recognition (AREA)
- Data Mining & Analysis (AREA)
- Databases & Information Systems (AREA)
- Evolutionary Computation (AREA)
- General Health & Medical Sciences (AREA)
- Medical Informatics (AREA)
- Software Systems (AREA)
- Management, Administration, Business Operations System, And Electronic Commerce (AREA)
- General Factory Administration (AREA)
Priority Applications (5)
| Application Number | Priority Date | Filing Date | Title |
|---|---|---|---|
| CN202480036953.5A CN121241398A (zh) | 2023-06-05 | 2024-05-28 | 制造条件选定方法、材料的制造方法、制造条件选定装置以及程序 |
| JP2024552777A JPWO2024252992A1 (https=) | 2023-06-05 | 2024-05-28 | |
| EP24819223.9A EP4682894A1 (en) | 2023-06-05 | 2024-05-28 | Manufacturing condition selection method, material manufacturing method, manufacturing condition selection device, and program |
| KR1020257032937A KR20250168269A (ko) | 2023-06-05 | 2024-05-28 | 제조 조건 선정 방법, 재료의 제조 방법, 제조 조건 선정 장치 및 프로그램 |
| MX2025014069A MX2025014069A (es) | 2023-06-05 | 2025-11-24 | Metodo de seleccion de condiciones de produccion, metodo de produccion de material, dispositivo de seleccion de condiciones de produccion y programa |
Applications Claiming Priority (2)
| Application Number | Priority Date | Filing Date | Title |
|---|---|---|---|
| JP2023092719 | 2023-06-05 | ||
| JP2023-092719 | 2023-06-05 |
Publications (1)
| Publication Number | Publication Date |
|---|---|
| WO2024252992A1 true WO2024252992A1 (ja) | 2024-12-12 |
Family
ID=93795899
Family Applications (1)
| Application Number | Title | Priority Date | Filing Date |
|---|---|---|---|
| PCT/JP2024/019602 Ceased WO2024252992A1 (ja) | 2023-06-05 | 2024-05-28 | 製造条件選定方法、材料の製造方法、製造条件選定装置及びプログラム |
Country Status (6)
| Country | Link |
|---|---|
| EP (1) | EP4682894A1 (https=) |
| JP (1) | JPWO2024252992A1 (https=) |
| KR (1) | KR20250168269A (https=) |
| CN (1) | CN121241398A (https=) |
| MX (1) | MX2025014069A (https=) |
| WO (1) | WO2024252992A1 (https=) |
Citations (6)
| Publication number | Priority date | Publication date | Assignee | Title |
|---|---|---|---|---|
| WO2020152750A1 (ja) * | 2019-01-21 | 2020-07-30 | Jfeスチール株式会社 | 金属材料の設計支援方法、予測モデルの生成方法、金属材料の製造方法、及び設計支援装置 |
| JP2021101465A (ja) | 2019-09-05 | 2021-07-08 | 国立大学法人東京工業大学 | 作製評価システム、作製評価方法及びプログラム |
| JP2022014878A (ja) * | 2020-07-07 | 2022-01-20 | Jfeスチール株式会社 | 製造仕様決定支援装置、製造仕様決定支援方法、コンピュータプログラムおよびコンピュータ読み取り可能な記録媒体 |
| JP2022128960A (ja) * | 2021-02-24 | 2022-09-05 | 富士通株式会社 | 情報処理方法、情報処理装置、及び情報処理プログラム |
| WO2023042612A1 (ja) * | 2021-09-15 | 2023-03-23 | 国立大学法人東京農工大学 | データ同化装置、データ同化方法、データ同化プログラム、及びデータ同化システム |
| JP2023044459A (ja) * | 2021-09-17 | 2023-03-30 | 株式会社神戸製鋼所 | 試作支援システム、及び、量産支援システム |
-
2024
- 2024-05-28 CN CN202480036953.5A patent/CN121241398A/zh active Pending
- 2024-05-28 WO PCT/JP2024/019602 patent/WO2024252992A1/ja not_active Ceased
- 2024-05-28 KR KR1020257032937A patent/KR20250168269A/ko active Pending
- 2024-05-28 EP EP24819223.9A patent/EP4682894A1/en active Pending
- 2024-05-28 JP JP2024552777A patent/JPWO2024252992A1/ja active Pending
-
2025
- 2025-11-24 MX MX2025014069A patent/MX2025014069A/es unknown
Patent Citations (6)
| Publication number | Priority date | Publication date | Assignee | Title |
|---|---|---|---|---|
| WO2020152750A1 (ja) * | 2019-01-21 | 2020-07-30 | Jfeスチール株式会社 | 金属材料の設計支援方法、予測モデルの生成方法、金属材料の製造方法、及び設計支援装置 |
| JP2021101465A (ja) | 2019-09-05 | 2021-07-08 | 国立大学法人東京工業大学 | 作製評価システム、作製評価方法及びプログラム |
| JP2022014878A (ja) * | 2020-07-07 | 2022-01-20 | Jfeスチール株式会社 | 製造仕様決定支援装置、製造仕様決定支援方法、コンピュータプログラムおよびコンピュータ読み取り可能な記録媒体 |
| JP2022128960A (ja) * | 2021-02-24 | 2022-09-05 | 富士通株式会社 | 情報処理方法、情報処理装置、及び情報処理プログラム |
| WO2023042612A1 (ja) * | 2021-09-15 | 2023-03-23 | 国立大学法人東京農工大学 | データ同化装置、データ同化方法、データ同化プログラム、及びデータ同化システム |
| JP2023044459A (ja) * | 2021-09-17 | 2023-03-30 | 株式会社神戸製鋼所 | 試作支援システム、及び、量産支援システム |
Non-Patent Citations (1)
| Title |
|---|
| "Frontline of Materials Informatics Development Case Studies. 1st edition", 31 January 2021, NTS INC., JP, ISBN: 978-4-86043-708-4, article ITO, SATOSHI: "2 Bayesian Optimization Package COMBO", pages: 12 - 14, XP009560697 * |
Also Published As
| Publication number | Publication date |
|---|---|
| KR20250168269A (ko) | 2025-12-02 |
| MX2025014069A (es) | 2026-01-07 |
| CN121241398A (zh) | 2025-12-30 |
| JPWO2024252992A1 (https=) | 2024-12-12 |
| EP4682894A1 (en) | 2026-01-21 |
Similar Documents
| Publication | Publication Date | Title |
|---|---|---|
| Collin et al. | Extending approximate Bayesian computation with supervised machine learning to infer demographic history from genetic polymorphisms using DIYABC Random Forest | |
| Igo Jr et al. | Genetic risk scores | |
| Zeng et al. | Revealing high-fidelity phase selection rules for high entropy alloys: A combined CALPHAD and machine learning study | |
| O’Connor | The distribution of common-variant effect sizes | |
| Tang et al. | Evaluation of methods for differential expression analysis on multi-group RNA-seq count data | |
| He et al. | Integrative testing of how environments from the past to the present shape genetic structure across landscapes | |
| Qiu et al. | Assessing stability of gene selection in microarray data analysis | |
| EP4310719A1 (en) | Material characteristics prediction method and model generation method | |
| WO2021004198A1 (zh) | 一种板材性能的预测方法及装置 | |
| CN114021481A (zh) | 一种基于融合物理神经网络的蠕变疲劳寿命预测方法 | |
| JP2022132895A (ja) | 合金材料の特性を予測する製造支援システム、予測モデルを生成する方法およびコンピュータプログラム | |
| CN113012766A (zh) | 一种基于在线选择性集成的自适应软测量建模方法 | |
| Seguritan et al. | FastGroup: a program to dereplicate libraries of 16S rDNA sequences | |
| Dias et al. | Leveraging probability concepts for cultivar recommendation in multi-environment trials | |
| CN116612814A (zh) | 基于回归模型的基因样本污染批量检测方法、装置、设备及介质 | |
| Klimczak et al. | Inverse problem in stochastic approach to modelling of microstructural parameters in metallic materials during processing | |
| CN114757660B (zh) | 一种基于应用分析的冷轧钢带制备方法及系统 | |
| Li et al. | Physical metallurgy guided industrial big data analysis system with data classification and property prediction | |
| CN112951324A (zh) | 一种基于欠采样的致病同义突变预测方法 | |
| Huang et al. | Time series clustering method with cluster validation to identify unknown local cell conditions in the aluminum reduction cell | |
| CN116258087B (zh) | 冰铜品位软测量方法、装置、电子设备及存储介质 | |
| CN110890127B (zh) | 酿酒酵母dna复制起始区域识别方法 | |
| Chen et al. | A BWM-TOPSIS based multi-criteria decision-making framework for design of cold patching asphalt binder | |
| WO2024252992A1 (ja) | 製造条件選定方法、材料の製造方法、製造条件選定装置及びプログラム | |
| KR102659915B1 (ko) | 환자의 의학적 정보를 예측하기 위한 유전자 선별 방법 및 이의 활용 |
Legal Events
| Date | Code | Title | Description |
|---|---|---|---|
| WWE | Wipo information: entry into national phase |
Ref document number: 2024552777 Country of ref document: JP |
|
| 121 | Ep: the epo has been informed by wipo that ep was designated in this application |
Ref document number: 24819223 Country of ref document: EP Kind code of ref document: A1 |
|
| ENP | Entry into the national phase |
Ref document number: 1020257032937 Country of ref document: KR Free format text: ST27 STATUS EVENT CODE: A-0-1-A10-A15-NAP-PA0105 (AS PROVIDED BY THE NATIONAL OFFICE) |
|
| WWE | Wipo information: entry into national phase |
Ref document number: KR1020257032937 Country of ref document: KR |
|
| WWE | Wipo information: entry into national phase |
Ref document number: 2024819223 Country of ref document: EP |
|
| WWE | Wipo information: entry into national phase |
Ref document number: 2501007585 Country of ref document: TH |
|
| ENP | Entry into the national phase |
Ref document number: 2024819223 Country of ref document: EP Effective date: 20251016 |
|
| ENP | Entry into the national phase |
Ref document number: 2024819223 Country of ref document: EP Effective date: 20251016 |
|
| WWE | Wipo information: entry into national phase |
Ref document number: 202517116311 Country of ref document: IN Ref document number: MX/A/2025/014069 Country of ref document: MX |
|
| ENP | Entry into the national phase |
Ref document number: 2024819223 Country of ref document: EP Effective date: 20251016 |
|
| ENP | Entry into the national phase |
Ref document number: 2024819223 Country of ref document: EP Effective date: 20251016 |
|
| WWP | Wipo information: published in national office |
Ref document number: 202517116311 Country of ref document: IN |
|
| ENP | Entry into the national phase |
Ref document number: 2024819223 Country of ref document: EP Effective date: 20251016 |
|
| NENP | Non-entry into the national phase |
Ref country code: DE |
|
| WWP | Wipo information: published in national office |
Ref document number: MX/A/2025/014069 Country of ref document: MX |
|
| WWP | Wipo information: published in national office |
Ref document number: 2024819223 Country of ref document: EP |