WO2024252892A1 - 情報処理方法、情報処理装置、及びプログラム - Google Patents
情報処理方法、情報処理装置、及びプログラム Download PDFInfo
- Publication number
- WO2024252892A1 WO2024252892A1 PCT/JP2024/018246 JP2024018246W WO2024252892A1 WO 2024252892 A1 WO2024252892 A1 WO 2024252892A1 JP 2024018246 W JP2024018246 W JP 2024018246W WO 2024252892 A1 WO2024252892 A1 WO 2024252892A1
- Authority
- WO
- WIPO (PCT)
- Prior art keywords
- measurement data
- servo motor
- estimation model
- abnormality
- data
- Prior art date
- Legal status (The legal status is an assumption and is not a legal conclusion. Google has not performed a legal analysis and makes no representation as to the accuracy of the status listed.)
- Ceased
Links
Images





Classifications
-
- G—PHYSICS
- G05—CONTROLLING; REGULATING
- G05B—CONTROL OR REGULATING SYSTEMS IN GENERAL; FUNCTIONAL ELEMENTS OF SUCH SYSTEMS; MONITORING OR TESTING ARRANGEMENTS FOR SUCH SYSTEMS OR ELEMENTS
- G05B23/00—Testing or monitoring of control systems or parts thereof
- G05B23/02—Electric testing or monitoring
- G05B23/0205—Electric testing or monitoring by means of a monitoring system capable of detecting and responding to faults
- G05B23/0218—Electric testing or monitoring by means of a monitoring system capable of detecting and responding to faults characterised by the fault detection method dealing with either existing or incipient faults
- G05B23/0243—Electric testing or monitoring by means of a monitoring system capable of detecting and responding to faults characterised by the fault detection method dealing with either existing or incipient faults model based detection method, e.g. first-principles knowledge model
-
- G—PHYSICS
- G05—CONTROLLING; REGULATING
- G05B—CONTROL OR REGULATING SYSTEMS IN GENERAL; FUNCTIONAL ELEMENTS OF SUCH SYSTEMS; MONITORING OR TESTING ARRANGEMENTS FOR SUCH SYSTEMS OR ELEMENTS
- G05B23/00—Testing or monitoring of control systems or parts thereof
- G05B23/02—Electric testing or monitoring
-
- G—PHYSICS
- G05—CONTROLLING; REGULATING
- G05B—CONTROL OR REGULATING SYSTEMS IN GENERAL; FUNCTIONAL ELEMENTS OF SUCH SYSTEMS; MONITORING OR TESTING ARRANGEMENTS FOR SUCH SYSTEMS OR ELEMENTS
- G05B23/00—Testing or monitoring of control systems or parts thereof
- G05B23/02—Electric testing or monitoring
- G05B23/0205—Electric testing or monitoring by means of a monitoring system capable of detecting and responding to faults
- G05B23/0218—Electric testing or monitoring by means of a monitoring system capable of detecting and responding to faults characterised by the fault detection method dealing with either existing or incipient faults
- G05B23/0224—Process history based detection method, e.g. whereby history implies the availability of large amounts of data
- G05B23/024—Quantitative history assessment, e.g. mathematical relationships between available data; Functions therefor; Principal component analysis [PCA]; Partial least square [PLS]; Statistical classifiers, e.g. Bayesian networks, linear regression or correlation analysis; Neural networks
-
- G—PHYSICS
- G06—COMPUTING OR CALCULATING; COUNTING
- G06N—COMPUTING ARRANGEMENTS BASED ON SPECIFIC COMPUTATIONAL MODELS
- G06N20/00—Machine learning
-
- H—ELECTRICITY
- H02—GENERATION; CONVERSION OR DISTRIBUTION OF ELECTRIC POWER
- H02P—CONTROL OR REGULATION OF ELECTRIC MOTORS, ELECTRIC GENERATORS OR DYNAMO-ELECTRIC CONVERTERS; CONTROLLING TRANSFORMERS, REACTORS OR CHOKE COILS
- H02P31/00—Arrangements for regulating or controlling electric motors not provided for in groups H02P1/00 - H02P5/00, H02P7/00 or H02P21/00 - H02P29/00
Definitions
- This disclosure relates to an information processing method, an information processing device, and a program.
- Patent Documents 1 and 2 do not consider updating the machine-learned estimation model using data obtained during actual operation to improve the estimation accuracy by specializing it to each environment, such as a manufacturing plant or production line.
- the present disclosure aims to provide an information processing method, an information processing device, and a program that can easily update a machine-learned estimation model through user operation, thereby improving the estimation accuracy of the estimation model.
- An information processing method for updating an estimation model for calculating an abnormality level of the operation of a servo motor that controls a controlled device, in which an information processing device acquires a command signal for driving the servo motor and measurement data measured on the servo motor or the controlled device when the servo motor operates based on the command signal, calculates an abnormality level of the operation of the servo motor based on the acquired command signal and the measurement data using a machine-learned estimation model that estimates and outputs an abnormality level based on the input command signal and measurement data, displays the acquired measurement data and the calculated abnormality level on a display device, acquires from an input device area setting information indicating the range of a partial area set by a user operation from the entire area of the displayed measurement data, acquires from the input device attribute setting information indicating a normal or abnormal attribute set by a user operation for partial data belonging to the partial area of the displayed measurement data, and updates the estimation model based on the partial data and the attribute setting information.
- FIG. 1 is a diagram illustrating a simplified configuration of a state determination device according to an embodiment of the present disclosure.
- 4 is a flowchart showing a process executed by an information processing unit.
- FIG. 4 is a diagram showing an example of a screen displayed on a display device.
- FIG. 13 is a diagram illustrating an example of setting an operation period.
- 4 is a flowchart showing a process executed by an information processing unit.
- FIG. 4 is a diagram showing an example of a screen displayed on a display device.
- 4 is a flowchart showing a process executed by an information processing unit.
- FIG. 4 is a diagram showing an example of a screen displayed on a display device.
- FIG. 4 is a diagram showing an example of a screen displayed on a display device.
- FIG. 4 is a flowchart showing a process executed by an information processing unit.
- FIG. 4 is a diagram showing an example of a screen displayed on a display device.
- FIG. 4 is a diagram showing an example of a screen displayed on a display device.
- FIG. 4 is a diagram showing an example of a screen displayed on a display device.
- FIG. 4 is a diagram showing an example of a screen displayed on a display device.
- Patent Documents 1 and 2 Methods for learning estimation models used to detect anomalies in industrial machinery are disclosed in, for example, Patent Documents 1 and 2.
- an estimation model expressing normal behavior of the industrial machinery is generated by performing unsupervised learning using only normal data.
- Patent Document 2 multiple time series data are created by sliding time series data included in acquired data acquired from the industrial machinery on a time axis, and a general-purpose estimation model applicable to various industrial machines is generated by performing machine learning using the multiple acquired data each including multiple time series data.
- the inventors discovered that by displaying on a display device the measurement data when the servo motor operates based on a command signal and the degree of abnormality in the operation of the servo motor calculated using an estimation model, and having the user input area setting information indicating the range of the partial area to be corrected and attribute information indicating normal or abnormal attributes for the displayed measurement data, the estimation model can be easily updated to reflect the circumstances of each environment, leading to the present disclosure.
- the information processing method is an information processing method for updating an estimation model for calculating the degree of abnormality in the operation of a servo motor that controls a controlled device, in which an information processing device acquires a command signal for driving the servo motor and measurement data measured on the servo motor or the controlled device when the servo motor operates based on the command signal, calculates the degree of abnormality in the operation of the servo motor based on the acquired command signal and the measurement data using a machine-learned estimation model that estimates and outputs the degree of abnormality based on the input command signal and measurement data, displays the acquired measurement data and the calculated degree of abnormality on a display device, acquires from an input device area setting information indicating the range of a partial area set by a user operation from the entire area of the displayed measurement data, acquires from the input device attribute setting information indicating a normal or abnormal attribute set by a user operation for partial data belonging to the partial area of the displayed measurement data, and updates the estimation model based on the partial data and the attribute
- the acquired measurement data and the calculated degree of anomaly are displayed on a display device, area setting information and attribute setting information set by user operation are acquired from an input device, and the estimation model is updated based on the partial data and attribute setting information.
- the partial data and the attribute setting information may be used as training data to additionally learn the estimation model.
- the estimation model can be appropriately updated by additionally learning the estimation model using the partial data and attribute setting information as training data.
- the estimation model in updating the estimation model in the second aspect, when an abnormal attribute is set by a user operation for the partial data whose calculated abnormality level is equal to or lower than a predetermined threshold, the estimation model is additionally trained so that the abnormality level for the partial data exceeds the threshold, and when a normal attribute is set by a user operation for the partial data whose calculated abnormality level is higher than the threshold, the estimation model is additionally trained so that the abnormality level for the partial data is equal to or lower than the threshold.
- the estimation model can be appropriately updated so that abnormal data that was erroneously determined to be normal is correctly determined to be abnormal, and normal data that was erroneously determined to be abnormal is correctly determined to be normal.
- the degree of anomaly calculated using the estimation model after additional learning may be further displayed on the display device in correspondence with the partial data.
- the degree of anomaly calculated using the estimation model after additional learning is displayed on the display device, allowing the user to confirm that the estimation model has been appropriately updated, improving convenience.
- the operating period of the servo motor may have a plurality of operating periods including an acceleration period, a deceleration period, and a constant speed period, and the setting of the partial area and the setting of the attributes by user operation may be performed individually for each of the plurality of operating periods.
- the estimation model can be updated in detail by individually setting the partial regions and attributes for each of the multiple operation periods.
- the information processing device is an information processing device that updates an estimation model for calculating the degree of abnormality of the operation of a servo motor that controls a controlled device, and includes: a data acquisition unit that acquires a command signal for driving the servo motor and measurement data measured for the servo motor or the controlled device when the servo motor operates based on the command signal; a calculation unit that calculates the degree of abnormality of the operation of the servo motor based on the acquired command signal and the measurement data using a machine-learned estimation model that estimates and outputs the degree of abnormality based on the input command signal and the measurement data; a display control unit that displays the acquired measurement data and the calculated degree of abnormality on a display device; an information acquisition unit that acquires from an input device area setting information indicating the range of a partial area set by a user operation from the entire area of the displayed measurement data, and attribute setting information indicating normal or abnormal attributes set by a user operation for partial data belonging to the partial area of the displayed measurement data; and
- the acquired measurement data and the calculated degree of anomaly are displayed on the display device, the area setting information and attribute setting information set by user operation are acquired from the input device, and the estimation model is updated based on the partial data and the attribute setting information.
- the program according to the seventh aspect of the present disclosure is a program for causing an information processing device to execute processing to update an estimation model for calculating the degree of abnormality in the operation of a servo motor that controls a controlled device.
- the information processing device acquires a command signal for driving the servo motor and measurement data measured for the servo motor or the controlled device when the servo motor operates based on the command signal, calculates the degree of abnormality in the operation of the servo motor based on the acquired command signal and the measurement data using a machine-learned estimation model that estimates and outputs the degree of abnormality based on the input command signal and measurement data, displays the acquired measurement data and the calculated degree of abnormality on a display device, acquires from an input device area setting information indicating the range of a partial area set by a user operation from the entire area of the displayed measurement data, and attribute setting information indicating a normal or abnormal attribute set by a user operation for partial data belonging to the partial area of the displayed measurement data, and updates the estimation model based on
- the acquired measurement data and the calculated degree of anomaly are displayed on the display device, the area setting information and attribute setting information set by user operation are acquired from the input device, and the estimation model is updated based on the partial data and the attribute setting information.
- the present disclosure can also be realized as a program that causes a computer to execute each of the characteristic configurations included in such a method or device, or as a system that operates by this program.
- a computer program can be distributed on a non-transitory computer-readable recording medium such as a CD-ROM, or via a communication network such as the Internet.
- the state determination device 20 determines whether the operation of the servo motor 13 that controls the controlled device 14 is normal or abnormal using a preset threshold value H.
- the controlled device 14 is, for example, a production device used to produce equipment.
- the production device includes a mounting device, a processing device, a machining device, or a transport device for mounting, processing, machining, or transporting the equipment.
- the production device is installed, for example, on a production line in a factory.
- the servo motor 13 may be a rotary motor or a linear motor.
- the state determination device 20 may be a dedicated terminal, a general-purpose PC, or a server device. The function of the state determination device 20 may also be implemented in the motion controller 11.
- Abnormalities in the servo motor 13 include abnormalities in the servo motor 13 itself as well as abnormalities in the controlled device 14.
- the motion controller 11 outputs a command signal D1.
- the command signal D1 includes a position command signal, a speed command signal, a torque command signal, etc. for specifying the movement position, movement speed, generated torque, etc. of the servo motor 13.
- the servo amplifier 12 drives the servo motor 13 based on the command signal D1 input from the motion controller 11.
- the command signal D1 is input to the state determination device 20.
- measurement data D3 is input to the state determination device 20.
- the measurement data D3 is data measured regarding the servo motor 13 or the controlled device 14 when the servo motor 13 operates based on the command signal D1.
- the measurement data D3 includes, for example, position data measured by a position sensor, torque data measured by a torque sensor, temperature data measured by a temperature sensor, or current data measured by a current sensor.
- the status determination device 20 includes an information processing unit 21, a communication unit 22, an input device 23, a display device 24, and a memory unit 25.
- the information processing unit 21 is configured using a processor such as a CPU.
- the information processing unit 21 has a data acquisition unit 31, a calculation unit 32, a display control unit 33, an information acquisition unit 34, a setting unit 35, a judgment unit 36, a period setting unit 37, and a learning unit 38 as functions realized by the processor executing a program read from a computer-readable non-volatile recording medium such as a ROM.
- the above program is a program for causing the information processing unit 21, which is an information processing device mounted on the state judgment device 20, to function as the data acquisition unit 31 (data acquisition means), the calculation unit 32 (calculation means), the display control unit 33 (display control means), the information acquisition unit 34 (information acquisition means), the setting unit 35 (setting means), the judgment unit 36 (judgment means), the period setting unit 37 (period setting means), and the learning unit 38 (learning means). Details of the processing contents executed by each processing unit will be described later.
- the communication unit 22 is configured with a communication module that supports any communication method, such as a dedicated line network or a public line network.
- the input device 23 is configured with a mouse, keyboard, touch panel, etc. that can be operated by the user.
- the display device 24 is configured with a liquid crystal display or an organic EL display that can be viewed by the user operating the input device 23.
- the memory unit 25 is configured to include a HDD, SSD, or semiconductor memory.
- the memory unit 25 holds an estimation model 41, a command signal 42, and measurement data 43.
- the estimation model 41 is a machine-learned estimation model in which the command signal D1 and the measurement data D3 are explanatory variables and the degree of abnormality in the operation of the servo motor 13 is an objective variable.
- the estimation model 41 is machine-learned, for example, by unsupervised learning using a large amount of normal data by the learning unit 38.
- the estimation model 41 estimates and outputs the degree of abnormality N using a predetermined algorithm based on the input command signal D1 and measurement data D3.
- the estimation model 41 estimates and outputs the degree of abnormality N using an algorithm such as Mahalanobis distance, k-NN, decision tree, SVM, or Naive Bayes, based on the speed command signal included in the command signal D1 and the torque data included in the measurement data D3.
- the degree of abnormality N is an index that represents the degree of deviation from normal data; the greater the deviation from normal data, the greater the value of the degree of abnormality N; and the smaller the deviation from normal data, the smaller the value of the degree of abnormality N.
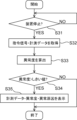
- FIG. 2 is a flowchart showing the process executed by the information processing unit 21 for setting the threshold value H.
- step S11 the data acquisition unit 31 acquires a command signal D1 that drives the servo motor 13, and measurement data D3 measured regarding the servo motor 13 or the controlled device 14 when the servo motor 13 performs an operation based on the command signal D1.
- the command signal D1 and measurement data D3 to be acquired may be a command signal D1 and measurement data D3 corresponding to a specific operation, or may be a statistical value (e.g., an average value) of the command signal D1 and measurement data D3 corresponding to multiple past operations.
- the command signal D1 and measurement data D3 corresponding to multiple past operations are organized into a database as command signal 42 and measurement data 43 and stored in the memory unit 25.
- step S12 the calculation unit 32 inputs the command signal D1 and the measurement data D3 acquired in step S11 to the estimation model 41, thereby calculating the degree of abnormality N of the operation of the servo motor 13 as an output from the estimation model 41.
- the method of calculating the degree of abnormality N by the calculation unit 32 is not limited to the method using the estimation model 41, and may be a rule-based calculation method, etc.
- step S13 the display control unit 33 generates image data D5 including the measurement data D3 acquired in step S11 and the degree of abnormality N calculated in step S12, and inputs the image data D5 to the display device 24, thereby causing the display device 24 to display the measurement data D3 and the degree of abnormality N.
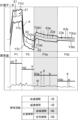
- FIG. 3 is a diagram showing an example of a screen displayed on the display device 24 regarding the setting of the threshold value H.
- a screen showing the time-series measurement data X indicated by the measurement data D3 and a screen showing the time-series degree of abnormality N corresponding to the measurement data X are displayed side by side.
- the horizontal axis of the screen showing the measurement data X is time
- the vertical axis is the measurement value of the torque data.
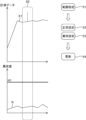
- the operating period of the servo motor 13 is divided into a plurality of operating periods P including an acceleration period P1, a deceleration period P2, and a constant speed period P3.
- the constant speed period P3 is further divided into a transient period P3a including the beginning of the constant speed period P3, and a steady period P3b including the end of the constant speed period P3.
- the transient period P3a is a period during which the value of the speed command data is zero but the measured value of the torque data or the speed data is greater than a predetermined value due to inertia.
- the steady period P3b is a period during which the measured value of the torque data or the speed data is equal to or less than a predetermined value.
- the operating period is set by the period setting unit 37.
- the measured data X includes measured data X1 belonging to the acceleration period P1, measured data X2 belonging to the deceleration period P2, measured data X3a belonging to the transient period P3a, and measured data X3b belonging to the steady period P3b.
- the period setting unit 37 acquires the position command signal included in the command signal D1 as shown in (A).
- the period setting unit 37 calculates the speed command data by differentiating the position command signal as shown in (B).
- the period setting unit 37 calculates the acceleration command data by differentiating the speed command data as shown in (C).
- the period setting unit 37 sets the period during which the absolute value of the acceleration is equal to or greater than a certain value and has a positive sign as the acceleration period P1.
- the period setting unit 37 also sets the period during which the absolute value of the acceleration is equal to or greater than a certain value and has a negative sign as the deceleration period P2.
- the period setting unit 37 also sets the period during which the absolute value of the acceleration is less than a certain value as the constant speed period P3.
- the period setting unit 37 also sets the period before a predetermined time has elapsed from the start of the constant speed period P3 as the transient period P3a, and sets the period after a predetermined time has elapsed from the start of the constant speed period P3 as the steady period P3b.
- the period setting unit 37 may set the period during the constant speed period P3 during which the measured value of the torque data is equal to or greater than a predetermined value as the transient period P3a, and may set the period during the constant speed period P3 during which the measured value of the torque data is less than the predetermined value as the steady period P3b.
- the period setting unit 37 may set the period during the constant speed period P3 during which the measured value of the speed data is equal to or greater than a predetermined value as the transient period P3a, and may set the period during the constant speed period P3 during which the measured value of the speed data is less than the predetermined value as the steady period P3b.
- step S14 the information acquisition unit 34 acquires setting information D4 of the tolerance range Z, which is variably set by user operation based on the measurement data X displayed on the display device 24, from the input device 23.
- the user can set the allowable range Z1 defined by the upper limit Y1U and the lower limit Y1L for the acceleration period P1 by, for example, dragging the measurement data X1 up and down.
- the user can set the allowable range Z2 defined by the upper limit Y2U and the lower limit Y2L for the deceleration period P2 by, for example, dragging the measurement data X2 up and down.
- the user can set the allowable range Z3a defined by the upper limit Y3aU and the lower limit Y3aL for the transient period P3a by, for example, dragging the measurement data X3a up and down.
- the user can set the allowable range Z3b defined by the upper limit Y3bU and the lower limit Y3bL for the steady period P3b by, for example, dragging the measurement data X3b up and down.
- the information acquisition unit 34 acquires the setting information D4 for the allowable ranges Z1, Z2, Z3a, and Z3b from the input device 23.
- the allowable range Z may be set not only by dragging with a mouse, but also by moving a slider bar or inputting a numerical value.
- the allowable range Z is set to the same width for the excess direction (upward) and deficiency direction (downward) of the measurement data X, but the allowable range Z may be set to have separate widths for the excess direction and deficiency direction.
- an upper limit Y1U is set by dragging the measurement data X1 upward
- a lower limit Y1L is set separately from the upper limit Y1U by dragging the measurement data X1 downward
- the allowable range Z1 defined by the upper limit Y1U and lower limit Y1L is set.
- step S15 the setting unit 35 sets a threshold value H for each operating period P based on the setting information D4 acquired in step S14.
- the setting unit 35 sets the threshold value H according to the setting width of the tolerance range Z.
- the setting unit 35 sets the largest threshold value H1 for the acceleration period P1, which has the largest setting width of the tolerance range Z, and sets the next largest threshold value H2 for the deceleration period P2, which has the next largest setting width of the tolerance range Z.
- the setting unit 35 also sets the smallest threshold value H3b for the steady period P3b, which has the smallest setting width of the tolerance range Z, and sets the next smallest threshold value H3a for the transition period P3a, which has the next smallest setting width of the tolerance range Z.
- the calculation unit 32 calculates the degree of abnormality N using the estimation model 41 based on the command signal D1 and the measurement data D3.
- the determination unit 36 determines that the operation of the servo motor 13 is abnormal if the calculated degree of abnormality N exceeds the threshold value H, and determines that the operation of the servo motor 13 is normal if the calculated degree of abnormality N is equal to or less than the threshold value H.
- the setting unit 35 sets the threshold value H separately for the excess direction and the deficiency direction.
- step S16 the display control unit 33 further displays the threshold value H set in step S15 on the display device 24 in correspondence with the degree of abnormality acquired in step S11.
- the threshold values H1, H2, H3a, and H3b are displayed in correspondence with the degree of abnormality N.
- the display control unit 33 may increase or decrease the threshold value H in conjunction with the setting of the tolerance range Z by a user operation, and display the threshold value H on the display device 24. For example, if the user expands the set width of the tolerance range Z1 by dragging the mouse, the display control unit 33 increases the threshold value H1 in real time in response to the expansion of the set width of the tolerance range Z1, and displays the changed threshold value H1 on the display device 24. Also, for example, if the user reduces the set width of the tolerance range Z2 by dragging the mouse, the display control unit 33 decreases the threshold value H2 in real time in response to the reduction in the set width of the tolerance range Z2, and displays the changed threshold value H2 on the display device 24.
- the configuration may be such that the user can directly adjust the threshold value H by dragging the mouse, etc., based on the threshold value H displayed on the display device 24.
- the information acquisition unit 34 acquires adjustment information including the movement direction and amount of movement of the threshold value H1 from the input device 23, and the setting unit 35 increases the set value of the threshold value H1 according to the amount of movement based on the adjustment information.
- the information acquisition unit 34 acquires adjustment information including the movement direction and amount of movement of the threshold value H2 from the input device 23, and the setting unit 35 decreases the set value of the threshold value H2 according to the amount of movement based on the adjustment information.
- the display control unit 33 may expand or reduce the tolerance range Z in conjunction with an increase or decrease in the threshold value H due to a user operation, and display it on the display device 24. For example, if the user moves the threshold value H1 upward by dragging the mouse, the display control unit 33 expands the set width of the tolerance range Z1 in real time according to the increased threshold value H1, and displays the expanded tolerance range Z1 on the display device 24. Also, for example, if the user moves the threshold value H2 downward by dragging the mouse, the display control unit 33 reduces the set width of the tolerance range Z2 in real time according to the decreased threshold value H2, and displays the reduced tolerance range Z2 on the display device 24.
- the display control unit 33 causes the display device 24 to display the measurement data D3 and the degree of abnormality N, and the information acquisition unit 34 acquires, from the input device 23, setting information D4 of the tolerance range Z, which is variably set by user operation based on the displayed measurement data D3.
- This makes it possible to variably set the threshold value H, which is used by the determination unit 36 to determine whether the operation of the servo motor 13 is normal or abnormal, by user operation.
- the threshold value H is increased or decreased in conjunction with the setting of the tolerance range Z by the user operation and displayed on the display device 24, thereby improving user convenience.
- the tolerance range Z can be set, but the threshold value H can also be adjusted directly by user operation, improving user convenience.
- the allowable range Z is increased or decreased in conjunction with the adjustment of the threshold value H by the user operation and displayed on the display device 24, thereby further improving user convenience.
- the calculation unit 32 can calculate the degree of anomaly N with high accuracy by using the estimation model 41 that has undergone machine learning.
- FIG. 5 is a flowchart showing the processing executed by the information processing unit 21 regarding a modified example of the setting of the threshold value H.
- step S21 the data acquisition unit 31 acquires the command signal D1 for driving the servo motor 13, and the measurement data D3 measured regarding the servo motor 13 or the controlled device 14 when the servo motor 13 operates based on the command signal D1, in the same manner as in step S11.
- step S22 the calculation unit 32 inputs the command signal D1 and measurement data D3 acquired in step S21 to the estimation model 41, as in step S12, and calculates the degree of abnormality N of the operation of the servo motor 13 as an output from the estimation model 41.
- step S23 the setting unit 35 sets a reference threshold value H0 based on the command signal S1 and the measurement data D3 acquired in step S21.
- the setting unit 35 calculates multiple time-series abnormality degrees N based on the command signal D1 and the measurement data D3, and sets the value obtained by adding k times the standard deviation ⁇ of the abnormality degrees N to the maximum value of the abnormality degrees N as the reference threshold value H0.
- step S24 the display control unit 33 inputs the generated image data D5 to the display device 24, thereby causing the display device 24 to display the measurement data D3, the degree of abnormality N, and the reference threshold value H0 corresponding to the degree of abnormality N.
- FIG. 6 is a diagram showing an example of a screen displayed on the display device 24.
- a screen showing the time-series measurement data X represented by the measurement data D3 and a screen showing the time-series abnormality degree N corresponding to the measurement data X are displayed side by side.
- a reference threshold value H0 is displayed corresponding to the abnormality degree N.
- step S25 the information acquisition unit 34 acquires setting information D4 for the threshold value H, which is variably set by user operation based on the reference threshold value H0 displayed on the display device 24, from the input device 23.
- the information acquisition unit 34 acquires setting information D4 including the movement direction and amount of movement of the reference threshold H0 from the input device 23.
- the setting unit 35 sets a threshold H1 larger than the reference threshold H0 according to the amount of movement based on the setting information D4.
- the information acquisition unit 34 acquires setting information D4 including the movement direction and amount of movement of the reference threshold H0 from the input device 23.
- the setting unit 35 sets a threshold H3a smaller than the reference threshold H0 according to the amount of movement based on the setting information D4.
- step S26 the setting unit 35 sets the allowable range Z of the measurement data X based on the threshold value H set for each operation period P.
- step S27 the display control unit 33 causes the display device 27 to further display the allowable range Z set in step S26 in correspondence with the measurement data X.
- the display control unit 33 may expand or contract the tolerance range Z in conjunction with the movement of the reference threshold value H0 by the user operation and display it on the display device 24. For example, if the user moves the reference threshold value H0 in the acceleration period P1 upward by dragging the mouse, the display control unit 33 expands the set width of the tolerance range Z1 in real time according to the increased threshold value H1, and displays the expanded tolerance range Z1 on the display device 24. Also, for example, if the user moves the reference threshold value H0 in the transition period P3a downward by dragging the mouse, the display control unit 33 narrows the set width of the tolerance range Z3a in real time according to the decreased threshold value H3a, and displays the narrowed tolerance range Z3a on the display device 24.
- the display control unit 33 causes the display device 24 to display the measurement data X, the degree of abnormality N, and the reference threshold value H0, and the information acquisition unit 34 acquires, from the input device 23, setting information D4 for the threshold value H, which is variably set by user operation based on the reference threshold value H0 displayed on the display device 24.
- the allowable range Z is increased or decreased in conjunction with the setting of the threshold value H by the user operation and displayed on the display device 24, thereby improving user convenience.
- FIG. 7 is a flowchart showing the process executed by the information processing unit 21 in relation to the detection of an abnormality in the operation of the servo motor 13 during actual operation.
- step S31 the determination unit 36 determines whether the operation of the controlled device 14 has been forcibly stopped due to the occurrence of a problem or the like.
- step S31 NO
- the process of step S31 is repeated.
- step S31 the data acquisition unit 31 next acquires in step S32 the command signal D1 for driving the servo motor 13 and the measurement data D3 measured for the servo motor 13 or the controlled device 14 when the servo motor 13 operates based on the command signal D1.
- the command signal D1 and measurement data D3 to be acquired may be the command signal D1 and measurement data D3 corresponding to one operation that was forcibly stopped, or may be a statistical value (e.g., average value) of the command signal D1 and measurement data D3 corresponding to multiple operations immediately before the forced stop.
- the command signal D1 and measurement data D3 corresponding to multiple operations are stored in the memory unit 25 as a database of command signals 42 and measurement data 43.
- the process of step S32 may be executed not only when the controlled device 14 is forcibly stopped, but also when the abnormality analysis mode is started by a user operation or the like.
- step S33 the calculation unit 32 inputs the command signal D1 and the measurement data D3 acquired in step S32 into the estimation model 41, thereby calculating the degree of abnormality N of the operation of the servo motor 13 as an output from the estimation model 41.
- the method of calculating the degree of abnormality N by the calculation unit 32 is not limited to the method using the estimation model 41, and may be a rule-based calculation method, etc.
- step S34 the judgment unit 36 judges whether the degree of abnormality N calculated in step S32 exceeds a preset threshold value H. If the degree of abnormality N exceeds the threshold value H in any of the multiple operating periods P, the judgment unit 36 judges that the operation of the servo motor 13 is abnormal, whereas if the degree of abnormality N is equal to or less than the threshold value H in all of the multiple operating periods P, the judgment unit 36 judges that the operation of the servo motor 13 is normal.
- step S34 NO
- the information processing unit 21 ends the process.
- the display control unit 33 may cause the display device 24 to display a message encouraging maintenance of the control target device 14.
- step S35 the display control unit 33 generates image data D5 including the measurement data D3 acquired in step S32, the degree of abnormality N calculated in step S33, and the cause of the abnormality in the operation of the servo motor 13.
- the cause of the abnormality includes the number of abnormalities or the maximum degree of abnormality, etc.
- the display control unit 33 inputs the image data D5 to the display device 24, thereby causing the display device 24 to display this information regarding the operation determined to be abnormal.
- FIG. 8 shows an example of a screen displayed on the display device 24 in relation to abnormality detection during the operation of the servo motor 13 during actual operation.
- a screen showing the time-series measurement data X indicated by the measurement data D3 a screen showing the time-series degree of abnormality N corresponding to the measurement data X, and a screen showing the number of abnormalities in each operation period P as the cause of the abnormality are displayed side by side.
- the number of abnormalities indicates the total number of times the degree of abnormality N exceeded the threshold value H for each operation period P.
- the number of abnormalities is 1 for the acceleration period P1, 1 for the deceleration period P2, 3 for the transient period P3a, and 2 for the steady period P3b. Therefore, the number of abnormalities for the transient period P3a is the highest.
- the display control unit 33 may highlight by coloring the data portion of each time series data of the measurement data X and the abnormality degree N that corresponds to the operation period P with the greatest number of abnormalities (transient period P3a in this example).
- the display control unit 33 may also highlight by coloring the screen portion of the screen showing the number of abnormalities that corresponds to the operation period P with the greatest number of abnormalities (transient period P3a in this example).
- the display control unit 33 may highlight by enlarging or surrounding with a frame.
- FIG. 9 shows another example of a screen displayed on the display device 24 in relation to abnormality detection during actual operation of the servo motor 13.
- the display device 24 displays, side by side, a screen showing the time-series measurement data X indicated by the measurement data D3, a screen showing the time-series abnormality degree N corresponding to the measurement data X, and a screen showing the maximum abnormality degree in each operation period P as the cause of the abnormality.
- the maximum abnormality degree indicates the maximum value of the abnormality degree N for each operation period P.
- the maximum abnormality degree is 0.2 for the acceleration period P1, 0.3 for the deceleration period P2, 0.3 for the transient period P3a, and 0.5 for the steady period P3b. Therefore, the maximum abnormality degree in the steady period P3b is the highest.
- the display control unit 33 may highlight by coloring the data portion of the time series data of the measurement data X and the abnormality level N that corresponds to the operating period P with the highest maximum abnormality level (in this example, the steady period P3b).
- the display control unit 33 may also highlight by coloring the screen portion of the screen showing the maximum abnormality level that corresponds to the operating period P with the highest maximum abnormality level (in this example, the steady period P3b).
- the display control unit 33 may highlight by enlarging or surrounding with a frame.
- the measurement data X and the degree of abnormality N relating to the operation determined to be abnormal are displayed on the display device 24, so that the cause of the abnormality in the operation of the servo motor 13 can be appropriately presented to the user.
- the number of abnormalities for each operation period P is further displayed on the display device 24, so that the cause of the abnormality can be presented to the user in more detail.
- the maximum abnormality level for each operating period P is further displayed on the display device 24, so that the cause of the abnormality can be presented to the user in more detail.
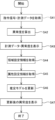
- FIG. 10 is a flowchart showing a process executed by the information processing unit 21 for updating the estimation model 41.
- step S41 the data acquisition unit 31 acquires the command signal D1 that drives the servo motor 13 and the measurement data D3 measured regarding the servo motor 13 or the controlled device 14 when the servo motor 13 operates based on the command signal D1.
- the command signal D1 and measurement data D3 to be acquired may be the command signal D1 and measurement data D3 corresponding to one operation selected by user operation or the like, or may be a statistical value (e.g., average value) of the command signal D1 and measurement data D3 corresponding to multiple operations.
- the command signal D1 and measurement data D3 corresponding to multiple operations are organized into a database as the command signal 42 and measurement data 43 and stored in the memory unit 25.
- step S42 the calculation unit 32 inputs the command signal D1 and measurement data D3 acquired in step S41 into the estimation model 41, and calculates the degree of abnormality N of the operation of the servo motor 13 as an output from the estimation model 41.
- step S43 the display control unit 33 generates image data D5 including the measurement data D3 acquired in step S41 and the degree of abnormality N calculated in step S42, and inputs the image data D5 to the display device 24, thereby causing the display device 24 to display the measurement data D3 and the degree of abnormality N.
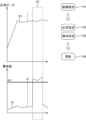
- FIG. 11 is a diagram showing an example of a screen displayed on the display device 24 regarding the update of the estimation model 41.
- a screen showing the time-series measurement data X shown in the measurement data D3 and a screen showing the time-series abnormality degree N corresponding to the measurement data X are displayed side by side.
- the horizontal axis of the screen showing the measurement data X is time
- the vertical axis is the measurement value of the torque data.
- the user can individually select the operation period including the part to be updated of the estimation model 41 from among the acceleration period P1, the deceleration period P2, the transient period P3a, and the steady period P3b related to the measurement data X by operating the mouse, etc.
- the display device 24 displays a screen showing the measurement data X1 belonging to the acceleration period P1 and a screen showing the time-series abnormality degree N of the part corresponding to the measurement data X1 side by side.
- the screen showing the abnormality degree N also displays the threshold value H1 set for the acceleration period P1.
- the display device 24 also displays an icon 51 labeled "range specification,” an icon 52 labeled "normal settings,” an icon 53 labeled "abnormal settings,” and an icon 54 labeled "update.”
- step S44 the information acquisition unit 34 acquires setting information D4 (area setting information) from the input device 23, which indicates the range of a partial area 61 that is set by a user operation from within the entire area of the measurement data X1 displayed on the display device 24.
- setting information D4 area setting information
- the user can arbitrarily set a partial area 61 including the partial data of the portion of the measurement data X1 to be updated, for example by dragging the mouse cursor up, down, left or right.
- the user can confirm the setting of the partial area 61, for example by clicking the icon 51 by operating the mouse.
- the information acquisition unit 34 acquires the setting information D4 of the confirmed partial area 61 from the input device 23.
- step S45 the information acquisition unit 34 acquires, from the input device 23, setting information D4 (attribute setting information) indicating the normal or abnormal attribute set by a user operation for the partial data belonging to the partial area 61 of the measurement data X1 displayed on the display device 24.
- setting information D4 attribute setting information
- the user can set the partial data belonging to partial area 61 as normal data, for example by clicking icon 52 with the mouse. In this case, the learning unit 38 assigns a label indicating "normal" to the partial data belonging to partial area 61.
- the user can set the partial data belonging to partial area 61 as abnormal data, for example by clicking icon 53 with the mouse. In this case, the learning unit 38 assigns a label indicating "abnormal" to the partial data belonging to partial area 61.
- the learning unit 38 When the user clicks on the icon 54, for example, by operating the mouse, the information acquisition unit 34 acquires information to that effect from the input device 23.
- the learning unit 38 additionally learns the estimation model 41 by supervised learning using the partial data belonging to the partial region 61 of the measurement data X1 and the label information indicating "normal” or "abnormal” as teacher data based on the region setting information acquired in step S44 and the attribute setting information acquired in step S45.
- the learning unit 38 additionally learns the estimation model 41 so that an abnormality degree N exceeding the threshold value H1 is calculated for the partial data.
- the learning unit 38 additionally learns the estimation model 41 so that an abnormality degree N equal to or less than the threshold value H1 is calculated for the partial data.
- algorithms such as Mahalanobis distance, k-NN, decision tree, SVM, or Naive Bayes can be used, as described above. This updates the estimation model 41 stored in the memory unit 25.
- step S47 the calculation unit 32 inputs the command signal D1 and measurement data D3 acquired in step S41 to the updated estimation model 41, thereby calculating the degree of abnormality N of the operation of the servo motor 13 as an output from the updated estimation model 41.
- the display control unit 33 generates image data D5 including the degree of abnormality N calculated using the updated estimation model 41, and inputs the image data D5 to the display device 24, thereby causing the display device 24 to display the measurement data X1 and the updated degree of abnormality N.
- FIG. 12 is a diagram showing an example of a screen displayed on the display device 24 after updating the estimation model 41.
- FIG. 12 shows an example in which partial data that was determined to be normal data in the estimation model 41 before the update has been set as abnormal data by the user.
- the degree of abnormality N corresponding to the partial data included in the partial area 61 is equal to or less than the threshold value H1 before updating the estimation model 41 (FIG. 11), but exceeds the threshold value H1 after updating the estimation model 41 (FIG. 12).
- FIG. 13 is a diagram showing an example of a screen displayed on the display device 24 before updating the estimation model 41
- FIG. 14 is a diagram showing an example of a screen displayed on the display device 24 after updating the estimation model 41.
- FIGS. 13 and 14 show an example of a case where partial data determined to be abnormal data in the estimation model 41 before the update is set as normal data by the user.
- the degree of abnormality N corresponding to the partial data included in the partial area 62 exceeds the threshold value H1 before updating the estimation model 41 (FIG. 13), but is equal to or less than the threshold value H1 after updating the estimation model 41 (FIG. 14).
- the display control unit 33 displays the acquired measurement data D3 and the calculated degree of abnormality N on the display device 24, the information acquisition unit 34 acquires the area setting information and attribute setting information set by user operation from the input device 23, and the learning unit 38 updates the estimation model 41 based on the partial data and attribute setting information.
- This allows the machine-learned estimation model 41 to be easily updated by user operation, thereby making it possible to improve the estimation accuracy of the estimation model 41.
- the learning unit 38 can appropriately update the estimation model 41 by additionally learning the estimation model 41 using the partial data and attribute setting information as training data.
- the learning unit 38 can appropriately update the estimation model 41 so that abnormal data that has been erroneously determined to be normal is correctly determined to be abnormal, and normal data that has been erroneously determined to be abnormal is correctly determined to be normal.
- the degree of anomaly N calculated using the estimation model 41 after additional learning is displayed on the display device 24, allowing the user to confirm that the estimation model 41 has been appropriately updated, thereby improving convenience.
- the partial regions 61, 62 and attributes are individually set for each of the multiple operation periods P, so that the estimation model 41 can be updated in detail.
- the present disclosure is widely applicable to servo motor abnormality detection systems.
Landscapes
- Engineering & Computer Science (AREA)
- Physics & Mathematics (AREA)
- General Physics & Mathematics (AREA)
- Automation & Control Theory (AREA)
- Mathematical Physics (AREA)
- Evolutionary Computation (AREA)
- Artificial Intelligence (AREA)
- Software Systems (AREA)
- Theoretical Computer Science (AREA)
- Computer Vision & Pattern Recognition (AREA)
- Data Mining & Analysis (AREA)
- Medical Informatics (AREA)
- Computing Systems (AREA)
- General Engineering & Computer Science (AREA)
- Power Engineering (AREA)
- Testing And Monitoring For Control Systems (AREA)
Priority Applications (3)
| Application Number | Priority Date | Filing Date | Title |
|---|---|---|---|
| CN202480036981.7A CN121241510A (zh) | 2023-06-07 | 2024-05-16 | 信息处理方法、信息处理装置以及程序 |
| JP2025526030A JPWO2024252892A1 (https=) | 2023-06-07 | 2024-05-16 | |
| US19/405,866 US20260099139A1 (en) | 2023-06-07 | 2025-12-02 | Information processing method, information processing device, and program |
Applications Claiming Priority (2)
| Application Number | Priority Date | Filing Date | Title |
|---|---|---|---|
| JP2023-093803 | 2023-06-07 | ||
| JP2023093803 | 2023-06-07 |
Related Child Applications (1)
| Application Number | Title | Priority Date | Filing Date |
|---|---|---|---|
| US19/405,866 Continuation US20260099139A1 (en) | 2023-06-07 | 2025-12-02 | Information processing method, information processing device, and program |
Publications (1)
| Publication Number | Publication Date |
|---|---|
| WO2024252892A1 true WO2024252892A1 (ja) | 2024-12-12 |
Family
ID=93795350
Family Applications (1)
| Application Number | Title | Priority Date | Filing Date |
|---|---|---|---|
| PCT/JP2024/018246 Ceased WO2024252892A1 (ja) | 2023-06-07 | 2024-05-16 | 情報処理方法、情報処理装置、及びプログラム |
Country Status (4)
| Country | Link |
|---|---|
| US (1) | US20260099139A1 (https=) |
| JP (1) | JPWO2024252892A1 (https=) |
| CN (1) | CN121241510A (https=) |
| WO (1) | WO2024252892A1 (https=) |
Citations (2)
| Publication number | Priority date | Publication date | Assignee | Title |
|---|---|---|---|---|
| JP2021018627A (ja) * | 2019-07-22 | 2021-02-15 | 株式会社安川電機 | 拡張モジュール、産業用機器、産業用機器のパラメータ又は前記産業用機器により制御される機器の内部状態の推定方法及び推定システム |
| JP2022035686A (ja) * | 2020-08-21 | 2022-03-04 | 株式会社日立製作所 | 診断装置及びパラメータ調整方法 |
-
2024
- 2024-05-16 JP JP2025526030A patent/JPWO2024252892A1/ja active Pending
- 2024-05-16 CN CN202480036981.7A patent/CN121241510A/zh active Pending
- 2024-05-16 WO PCT/JP2024/018246 patent/WO2024252892A1/ja not_active Ceased
-
2025
- 2025-12-02 US US19/405,866 patent/US20260099139A1/en active Pending
Patent Citations (2)
| Publication number | Priority date | Publication date | Assignee | Title |
|---|---|---|---|---|
| JP2021018627A (ja) * | 2019-07-22 | 2021-02-15 | 株式会社安川電機 | 拡張モジュール、産業用機器、産業用機器のパラメータ又は前記産業用機器により制御される機器の内部状態の推定方法及び推定システム |
| JP2022035686A (ja) * | 2020-08-21 | 2022-03-04 | 株式会社日立製作所 | 診断装置及びパラメータ調整方法 |
Also Published As
| Publication number | Publication date |
|---|---|
| JPWO2024252892A1 (https=) | 2024-12-12 |
| CN121241510A (zh) | 2025-12-30 |
| US20260099139A1 (en) | 2026-04-09 |
Similar Documents
| Publication | Publication Date | Title |
|---|---|---|
| JP7504163B2 (ja) | 異常予知装置、異常予知システム、異常予知方法及び異常予知プログラム | |
| US12066797B2 (en) | Fault prediction method and fault prediction system for predecting a fault of a machine | |
| JP6647473B1 (ja) | 異常検知装置および異常検知方法 | |
| CN110832422B (zh) | 机器学习装置、校正参数调整装置及机器学习方法 | |
| US12103169B2 (en) | Abnormality diagnosis device and abnormality diagnosis method | |
| BR112014000727B1 (pt) | método, sistema e memória legível por computador para monitoramento de um processo industrial | |
| JP7413742B2 (ja) | 予測システム、情報処理装置および情報処理プログラム | |
| CN116193819B (zh) | 一种数据中心机房节能控制方法、系统、装置及电子设备 | |
| EP4113237A1 (en) | System and method for conveyor system configuration, testing and diagnostics | |
| CN115329796A (zh) | 异常检测装置、计算机可读存储介质以及异常检测方法 | |
| WO2024252892A1 (ja) | 情報処理方法、情報処理装置、及びプログラム | |
| WO2020059736A1 (ja) | 制御装置および制御システム | |
| WO2024247716A1 (ja) | 情報処理方法、情報処理装置、及びプログラム | |
| US20260072426A1 (en) | Information processing method, information processing device, and program | |
| JP7556306B2 (ja) | 予測システム、情報処理装置および情報処理プログラム | |
| JP7710965B2 (ja) | 情報処理装置、情報処理方法およびプログラム | |
| JP7590461B2 (ja) | 異常分類装置 | |
| TW202301049A (zh) | 預測系統、資訊處理裝置以及資訊處理程式 | |
| KR20250078484A (ko) | 산업 기계의 비정상적인 동작의 원인 예상 | |
| JP2020098538A (ja) | 制御装置、制御方法及び制御プログラム | |
| JP7111761B2 (ja) | プラント運転最適化支援装置、プラント運転最適化制御装置並びに方法 | |
| CN118605121B (zh) | 一种泄洪洞补气洞面积控制系统模型的构建方法 | |
| JP7708150B2 (ja) | 異常監視方法及び異常監視装置 | |
| JP2023165464A (ja) | 機械学習モデル更新装置、機械学習モデル更新方法及び機械学習モデル更新プログラム | |
| Cheng et al. | Two-phase data science framework for compensation of the friction force in CNC machines |
Legal Events
| Date | Code | Title | Description |
|---|---|---|---|
| 121 | Ep: the epo has been informed by wipo that ep was designated in this application |
Ref document number: 24819125 Country of ref document: EP Kind code of ref document: A1 |
|
| ENP | Entry into the national phase |
Ref document number: 2025526030 Country of ref document: JP Kind code of ref document: A |
|
| NENP | Non-entry into the national phase |
Ref country code: DE |