WO2024247883A1 - 検査用データ運用システム、並びに、データの整型、保存および解析の方法 - Google Patents
検査用データ運用システム、並びに、データの整型、保存および解析の方法 Download PDFInfo
- Publication number
- WO2024247883A1 WO2024247883A1 PCT/JP2024/019029 JP2024019029W WO2024247883A1 WO 2024247883 A1 WO2024247883 A1 WO 2024247883A1 JP 2024019029 W JP2024019029 W JP 2024019029W WO 2024247883 A1 WO2024247883 A1 WO 2024247883A1
- Authority
- WO
- WIPO (PCT)
- Prior art keywords
- data
- analysis
- metadata
- unit
- inspection
- Prior art date
- Legal status (The legal status is an assumption and is not a legal conclusion. Google has not performed a legal analysis and makes no representation as to the accuracy of the status listed.)
- Ceased
Links
Images


Classifications
-
- G—PHYSICS
- G16—INFORMATION AND COMMUNICATION TECHNOLOGY [ICT] SPECIALLY ADAPTED FOR SPECIFIC APPLICATION FIELDS
- G16H—HEALTHCARE INFORMATICS, i.e. INFORMATION AND COMMUNICATION TECHNOLOGY [ICT] SPECIALLY ADAPTED FOR THE HANDLING OR PROCESSING OF MEDICAL OR HEALTHCARE DATA
- G16H10/00—ICT specially adapted for the handling or processing of patient-related medical or healthcare data
- G16H10/40—ICT specially adapted for the handling or processing of patient-related medical or healthcare data for data related to laboratory analysis, e.g. patient specimen analysis
-
- G—PHYSICS
- G16—INFORMATION AND COMMUNICATION TECHNOLOGY [ICT] SPECIALLY ADAPTED FOR SPECIFIC APPLICATION FIELDS
- G16H—HEALTHCARE INFORMATICS, i.e. INFORMATION AND COMMUNICATION TECHNOLOGY [ICT] SPECIALLY ADAPTED FOR THE HANDLING OR PROCESSING OF MEDICAL OR HEALTHCARE DATA
- G16H30/00—ICT specially adapted for the handling or processing of medical images
-
- G—PHYSICS
- G16—INFORMATION AND COMMUNICATION TECHNOLOGY [ICT] SPECIALLY ADAPTED FOR SPECIFIC APPLICATION FIELDS
- G16H—HEALTHCARE INFORMATICS, i.e. INFORMATION AND COMMUNICATION TECHNOLOGY [ICT] SPECIALLY ADAPTED FOR THE HANDLING OR PROCESSING OF MEDICAL OR HEALTHCARE DATA
- G16H40/00—ICT specially adapted for the management or administration of healthcare resources or facilities; ICT specially adapted for the management or operation of medical equipment or devices
Definitions
- the present invention relates to a test data management system and a method for formatting, storing and analyzing data.
- This application claims priority based on Japanese Patent Application No. 2023-088702, filed on May 30, 2023, the contents of which are incorporated herein by reference.
- testing data management system that organizes, formats, and stores large amounts of data obtained from in vitro diagnostic tests and other methods, and through analysis, visualizes and supplies data organized at the individual, group, case, and typological levels, such as those with the same partial DNA sequence.
- this testing data management system for example, at the individual level, it will be possible to provide medical care that is more suited to a person's constitution and condition based on their past medical history and test data.
- medical care and insurance that is more capital-efficient, and at the case and typological level, it will be possible to provide medical care that is more suited to the condition, such as choosing medication.
- the inspection data management system includes biomolecule fluorescence image data.
- the inspection data is biomolecule fluorescence image data, A function of automatically selecting an analysis region according to a predetermined criterion based on the maximum value of the fluorescence intensity of the biomolecule fluorescence image data; a function of performing a smoothing process on the fluorescence image data within the analysis region; A function of determining a background intensity distribution within the analysis region; a function of calculating a difference between the fluorescence intensity spatial distribution of the fluorescence image data that has been subjected to the smoothing process and the intensity distribution of the background, to obtain a net fluorescence intensity spatial distribution of the fluorescence image data;
- the inspection data management system according to configuration 9, wherein at least one of the filtering unit and the data analysis and metadata generation unit has a function of calculating an average intensity and a full width at half maximum of the net fluorescence intensity spatial distribution.
- the metadata includes one or more of the group consisting of the average intensity, full width at half maximum, difference amount, the biomolecule that was the subject of the measurement, and the attribution information of the biomolecule, according to the test data management system of configuration 10.
- a method for automatically formatting, storing, and analyzing test data using a computer comprising the steps of: Performs data entry, filtering, data analysis, metadata generation, metadata analysis, metadata storage and display, The data input includes inputting test data into the computer; In the filtering step, data that is determined to be valid according to a predetermined criterion is selected from the data obtained by the data input step and input into the computer, and abnormal data is identified; In the data analysis and metadata generation, the imported data is analyzed and metadata is generated; The metadata analysis includes analyzing the generated metadata to generate analysis metadata; In the metadata storage, the metadata generated by the data analysis/metadata generation and the analysis metadata obtained by the analysis by the metadata analysis means are stored in the computer; In the display, the metadata stored data is extracted, organized, visualized
- FIG. 13 is a bird's-eye view showing an overview of an inspection device used in the examples.
- 13 is image data showing fluorescence inspection acquisition example 1.
- 13 is image data showing fluorescence inspection acquisition example 2.
- 1 is a characteristic distribution map created based on image data, showing signal intensity distribution. This is a characteristic distribution map created based on image data, showing the distribution of pixels whose signal intensity exceeds a reference value. This is a characteristic distribution map created based on image data, showing the distribution map of pixels whose signal deviation exceeds a reference value.
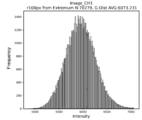
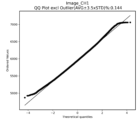
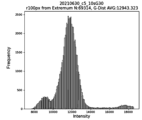
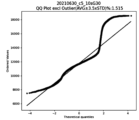
- FIG. 13 is a histogram showing characteristics of the fluorescence intensity measured when determined to be normal. This is a characteristic diagram of the fluorescence intensity measured when it was determined to be normal, and shows a QQ plot (Quantile-Quantile plot).
- FIG. 13 is image data showing an example of an abnormal fluorescence inspection acquisition.
- 15 is a characteristic distribution diagram created based on the image data shown in FIG. 14, showing the signal intensity distribution.
- 15 is a characteristic distribution diagram created based on the image data shown in FIG. 14, showing a distribution diagram of pixels whose signal intensity exceeds a reference value.
- 15 is a characteristic distribution diagram created based on the image data shown in FIG. 14, showing a distribution diagram of pixels whose signal deviation exceeds a reference value.
- 10 is a characteristic diagram showing an example of a distribution map of pixels whose measured signal strength is determined to be abnormal and exceeds a reference value.
- FIG. FIG. 13 is a histogram showing characteristics of the fluorescence intensity measured when it is determined to be abnormal.
- FIG. 13 is a characteristic diagram relating to the fluorescence intensity measured when it is determined to be abnormal, showing a QQ plot.
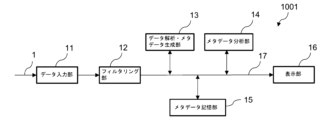
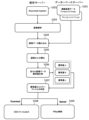
- the inspection operation data system 1001 described in embodiment 1 is a system that uses a computer (server) to format, store, and analyze data, and as shown in FIG. 1, includes a data input unit 11, a filtering unit 12, a data analysis and metadata generation unit 13, a metadata analysis unit 14, a metadata storage unit 15, a display unit 16, and an information path 17.
- the metadata storage unit 15 is composed of a storage device such as a temporary storage device such as DRAM or SRAM, or a long-term storage device such as a FLASH memory, FRAM (registered trademark), EPROM, hard disk, floppy disk, magnetic tape, etc.
- the data input section 11 (data input circuit 11 ) is configured to take in the test data 1 .
- the filtering section 12 (filtering circuit 12) is configured to select and input data that is determined to be valid according to a predetermined criterion from the data inputted by the data input section 11, and to identify abnormal data.
- the test data is not particularly limited, but may include attribute data such as personal attribute data and group attribute data, biomolecular fluorescence image data, image data such as X-ray, ultrasound, MRI and CT, blood test data, urine test data, and genetic information data such as DNA.
- attribute data such as personal attribute data and group attribute data
- biomolecular fluorescence image data image data such as X-ray, ultrasound, MRI and CT
- image data such as X-ray, ultrasound, MRI and CT
- blood test data such as X-ray, ultrasound, MRI and CT
- blood test data such as X-ray, ultrasound, MRI and CT
- genetic information data such as DNA.
- the data analysis and metadata generation unit 13 (data analysis and metadata generation circuit 13) is configured to analyze the imported data and then generate metadata
- the metadata analysis unit 14 (metadata analysis circuit 14) is configured to analyze the generated metadata to obtain analyzed metadata.
- the metadata storage unit 15 (metadata storage circuit 15) is configured to store the metadata generated by the data analysis and metadata generation unit 13 and the analyzed metadata obtained by the analysis by the metadata analysis unit 14.
- the metadata analysis means executed by the metadata analysis unit 14 may include statistical analysis, and the analysis may include one or more selected from the group consisting of time series analysis, regression analysis, principal component analysis, correlation analysis, factor analysis, cluster analysis, canonical analysis, t-analysis, analysis of variance, and random forest.
- the display unit 16 (display circuit 16) is configured to have the function of extracting, organizing, visualizing, and displaying data stored in the metadata storage unit 15 for items selected by the user.
- HDF5 Hierarchical Data Format 5
- HDF5 Hierarchical Data Format 5
- possible filing formats for the display unit 16 include CSV files, text files, DAT files, and binary files, with the CSV files being particularly preferred as they are widely used and easy to handle.
- the inspection operation data system 1001 by using the right filing format for the right place, it is possible to provide a large amount of data including images in a high-speed system with easy-to-use display, etc.
- abnormal data can include, for example, image data in which the signal in one or a few pixels is significantly different from the signals in the surrounding pixels, the smoothness of the signal intensity distribution exceeds the allowable range, a kink is present, or the signal intensity exceeds the saturation level.
- the measured and input data 1 may contain measurement errors or abnormalities in the measurement sample, and there is a concern that the reliability of the results of data analysis may decrease if abnormal data is imported.
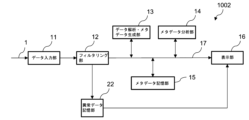
- the inspection operation data system 1001 is a system that manages abnormal data and is capable of analyzing data without importing abnormal data.
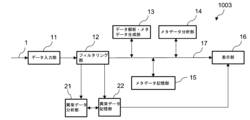
- the test data operation system 1003 is based on the test data operation system 1002 and further includes an abnormal data analysis unit 21 (abnormal data analysis circuit 21).
- the abnormal data analysis unit 21 is arranged so as to be able to exchange information with the abnormal data storage unit 22.
- the abnormal data analysis unit 21 is configured to have a function of analyzing whether the data is abnormal data to be eliminated or data that should be treated as data representing a new event, and in the case of a new event, to have a function of displaying the content of the new event on the display unit.
- the analysis items of the abnormal data analysis unit 21 include discontinuity, deviation, and non-uniformity
- the analysis methods include standard deviation analysis, singular value analysis, and correlation analysis.
- a test data management system and a data shaping, storage, and analysis method are provided that organizes, formats, stores, analyzes, and visualizes large amounts of data obtained through a biomolecule measuring device and an in vitro diagnostic test while being a lightweight system that operates at high speed.
- the data is converted into metadata and output, making it convenient and highly statistically applicable.
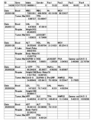
- An example of metadata created by the present invention is shown in FIG. 9. "Bood" in the figure indicates that blood has been tested.
- the test data management system of the present invention can drastically improve convenience and efficiency of medical care by comprehensively analyzing health information from in vitro diagnostic tests and providing it directly to subjects in a short time after making a judgment.
- the test data management system of the present invention can comprehensively manage information on diseases caused by genetic characteristics and diseases caused by acquired lifestyle habits, making it possible to provide health information optimized for individuals that is not available in existing health checkups.
- a biomolecule fluorescence image is obtained using a biomolecule fluorescence inspection device.
- a biomolecule fluorescence inspection device There are no particular limitations on the biomolecule fluorescence inspection device, but it is preferable to use an inspection device equipped with an inspection chip having a metasurface as disclosed in Patent Document 4, which is highly sensitive and capable of inspection with a small amount of sample.
- the acquired biomolecule fluorescence image is input into the inspection operation data system 1001 by the data input unit 11 and sent to the data analysis and metadata generation unit 13 via the filtering unit 12 .
- the data analysis and metadata generation unit 13 automatically selects an analysis region for the sent image data according to predetermined criteria based on the maximum value of the fluorescence intensity of the fluorescence image data, and performs a smoothing process on the fluorescence image data within the analysis region to reduce mechanical and thermal noise originating from the measuring instrument, and determines the background intensity distribution within the analysis region.
- the difference between the fluorescent intensity spatial distribution of the smoothed fluorescent image data and the intensity distribution of the background is calculated to obtain the fluorescent intensity spatial distribution of the net fluorescent image data.
- the mean intensity and full width at half maximum of the net fluorescence intensity spatial distribution are then calculated.
- a data set can be obtained from the biomolecule fluorescence image, which is a package of one or more characteristic data selected from the average intensity, full width at half maximum, and difference amount of the fluorescence intensity spatial distribution, linked to the biomolecule being measured and the biomolecule's attribution information.
- image processing is performed by the data analysis and metadata generation unit 13.
- this does not necessarily have to be performed by the data analysis and metadata generation unit 13. It may be performed by the filtering unit 12, or the division of labor may be determined in advance and the processing may be performed by both the filtering unit 12 and the data analysis and metadata generation unit 13.
- the hardware used was a notebook PC (manufactured by HP Japan) as an analysis server that handles the data input unit 11, filtering unit 12, data analysis and metadata generation unit 13, metadata analysis unit 14, abnormal data analysis unit 21, abnormal data storage unit 22 and display unit 16, and a storage device as a database server for the metadata storage unit 15.
- a notebook PC manufactured by HP Japan
- the hardware used was a notebook PC (manufactured by HP Japan) as an analysis server that handles the data input unit 11, filtering unit 12, data analysis and metadata generation unit 13, metadata analysis unit 14, abnormal data analysis unit 21, abnormal data storage unit 22 and display unit 16, and a storage device as a database server for the metadata storage unit 15.
- Data/H5py Reading.ipynb (111) has a function of creating CSV of factor names, attribute data, test sample data, etc. in a predetermined format and importing it into H5py.
- H5py (112) is a directory that holds the aggregated data in a defined H5py format.
- Image/CH Image Reading.ipynb (113) is a directory for image analysis, and consists of two functions, one for detecting abnormalities contained in the image, and the other for analyzing fluorescence intensity. The analysis results are sent to Holder 2 (102).
- Make CSV/Make Files.ipynb (114) is a function that collects data obtained by Data/H5py (111) and Image (113) and outputs the data in CSV format.
- Visual/Visual.ipynb (115) has the function of reading H5py (112) files, performing statistical analysis, and visualizing the results.
- step S105 the CSV personal attribute data, the CSV time series data, and the automatically created calendar data were sequentially imported into the data set in the H5py file (steps S105 to S107), and a program was started to aggregate the data stored in the H5py file in steps S104 to S107, and the aggregated data was managed (step S108). Finally, the collected data was output in CSV format in a predetermined format (step S109).
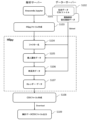
- Filtering image analysis was performed according to the following procedure (see FIG. 6). A series of analysis operations were performed on a PC within the institution, and were executed using the PC's Python development environment (Anaconda) (step S201). First, image data in Tiff format from the inspection device was stored in a database server (step S202). Next, the image analysis program was started (step S203). Here, the directory in which the program is stored is Image/CH Image Reading.ipynb (113) in Folder 1 (101).
- abnormal value a was the number of inflection points excluding the maximum extreme value of the intensity distribution
- abnormal value b was the number of pixels in each cell (100 x 100 pixels) whose intensity exceeds 60,000
- abnormal value c was the number of pixels in each cell (100 x 100 pixels) whose intensity exceeds the average value + 3.5 x ⁇ (standard deviation).
- the average value and standard deviation were calculated using pixels in the image whose intensity exceeds 500 (intensity > 500).
- Image analysis of normal images was performed according to the following procedure (see FIG. 7).
- a series of analysis operations were performed on a PC within the institution, and were executed using the PC's Python development environment (Anaconda) (step S301).
- image data in Tiff format from the inspection device was stored in a database server (step S302).
- the image analysis program was started (step S303).
- the directory in which the program is stored is Image/CH Image Reading.ipynb (113) in Folder 1 (101).
- step S404 data was read from the database server (step S404), and histograms (step S405), correlation matrices (step S406), two-dimensional factor plots (step S407), three-dimensional factor plots (step S408), and fluorescence intensity factor analysis (step S409) were performed in sequence.
- histogram creation in step S405 a cross-sectional histogram was created for each factor
- correlation matrix creation in step S406 a matrix of event sequence correlation coefficients between each factor was created.
- step S407 a two-dimensional plot between factors with high correlation in time series was created
- step S408 a three-dimensional plot between factors with high correlation in time series was created.
- fluorescence intensity factor analysis in step S409 a factor analysis of fluorescence intensity was performed by machine learning.
- a JPEG file is output to complete the visualization (step S410).
- the biomolecule testing device 2001 is a biomolecule detection device that detects and measures biomolecules by applying light to a test chip having a microchannel and measuring the fluorescence emitted from a test sample captured on the test surface of the test chip, and its main configuration is shown in Fig. 10.
- the test surface of the test chip is a metasurface, and the device can obtain extremely high test sensitivity by utilizing the resonance phenomenon caused by the metasurface.
- the measured detection image (fluorescence image) is shown in FIG. 11A, and a background image acquired by the same sensor is shown in FIG. 11B.
- the bright vertical band area near the center is the sensor area.
- FIG. 11B was acquired first, and then the target biomolecule was fixed to the sensor and FIG. 11A was acquired.
- the two images have the same brightness and contrast, and FIG. 11A is relatively brighter since it contains a fluorescent signal. Quantifying the data requires analysis of the two images, and quantification was performed using the inspection operation data system 1003 of this application.
- Fig. 12 shows the image judgment result of the fluorescent image measurement of Fig. 11A, visualizing that the data is normal and free of abnormalities.
- Fig. 12A shows the intensity distribution
- Fig. 12B shows that there are no values outside the 16-bit signal range
- Fig. 12C shows that there are no unnatural jumps in the intensity distribution (the judgment condition is that the standard deviation is not exceeded by 3.5 times).
- Fig. 13A shows the distribution of the intensity in Fig. 11A near the maximum value, which is a nearly Gaussian distribution. By approximating this distribution with a Gaussian distribution, the average value and distribution width (standard deviation) can be quantified.
- Fig. 13B shows the deviation from the Gaussian distribution approximation in a QQ plot.
- Figure 14 shows an example of fluorescence measurement in which the fluorescent image on the sensor has a non-uniform distribution (unevenness) due to an experimental problem. In such cases, the detection was not performed properly, and the data should be rejected.
- Figure 15 shows the results of image evaluation performed on the measurement image of Figure 14. The spatial distribution anomaly corresponding to the abnormal value a is shown in Figure 15A, and the occurrence of intensity jumps in the image is visualized in Figure 15C corresponding to the abnormal value c. In Figure 15B corresponding to the abnormal value b, no anomalies are detected for the 16-bit signal range.
- FIG. 16 shows an example corresponding to the abnormal value b, in which an abnormality is detected in a 16-bit signal range.
- abnormalities in fluorescence images are determined based on multiple criteria, ensuring reliability in data analysis.
- a characteristic diagram corresponding to the abnormal value b is shown in FIG. 15, and a distribution diagram near the maximum value of the intensity of an actual measurement example deviating from the Gaussian distribution and its QQ plot are shown in FIGS. 17A and 17B, respectively.
- testing data management system In order to widely provide high-quality, advanced medical care, a testing data management system is required that can quickly read and write data while also organizing, formatting, storing, analyzing, and visualizing large amounts of data obtained through biomolecular measuring devices and in vitro diagnostic testing.
- the testing data management system of the present invention has these characteristics. For this reason, we believe that the system of the present invention will make a great contribution to society, particularly in the field of medical care.
- Input data 11 Data input section 12 Filtering section 13 Data analysis/metadata generation section 14 Metadata analysis section 15 Metadata storage section 16 Display section 17 Information path 21 Abnormal data analysis unit 22 Abnormal data storage unit 101 First folder 102 Second folder 111 Data directory (H5py) 112 Data directory H5py (for aggregated data) 113 Image directory (directory for image analysis) 114 Directory for creating CSV data 115 Visual directory (Directory for statistical analysis and visualization) 116 Analysis directory 117 First input image data directory (for background) 118 Second input image data directory (foreground) 119 Input reference file 201 Liquid sampling pin 202 Mounting jig 203 First motorized stage 205 Pump 212 Sample holder 214 Detection mechanism 215 Sample holder transfer mechanism 220 Third motorized stage 250 Test chip holder 260 Second motorized stage 1001 Test operation data system 1002 Test operation data system 1003 Test operation data system 2001 Biomolecule testing device
Landscapes
- Health & Medical Sciences (AREA)
- Engineering & Computer Science (AREA)
- Epidemiology (AREA)
- General Health & Medical Sciences (AREA)
- Medical Informatics (AREA)
- Primary Health Care (AREA)
- Public Health (AREA)
- Business, Economics & Management (AREA)
- Biomedical Technology (AREA)
- General Business, Economics & Management (AREA)
- Nuclear Medicine, Radiotherapy & Molecular Imaging (AREA)
- Radiology & Medical Imaging (AREA)
- Investigating, Analyzing Materials By Fluorescence Or Luminescence (AREA)
Abstract
Description
本願は、2023年5月30日に、日本に出願された特願2023-088702号に基づき優先権を主張し、その内容をここに援用する。
なお、生体試料を用いた画像と医療情報をパッケージングして提供するシステムとしては、特許文献1から3に開示があり、生体試料を高感度に検出する検査チップは特許文献4に開示がある。
(構成1)
検査用データの運用を行う、コンピュータを用いたデータ整型、保存、解析システムであって、
前記システムは、データ入力部とフィルタリング部とデータ解析・メタデータ生成部とメタデータ分析部とメタデータ記憶部と表示部とを備え、
前記データ入力部は、検査データを取り込むように構成されており、
前記フィルタリング部は、予め定めた基準にしたがって有効と判断されるデータを前記データ入力部で取り込んだデータから選別して取り込み、異常データを識別するように構成されており、
前記データ解析・メタデータ生成部は、前記取り込まれたデータを解析した上でメタデータを生成するように構成されており、
前記メタデータ分析部は、生成された前記メタデータを分析して分析メタデータを得るように構成されており、
前記メタデータ記憶部は、前記データ解析・メタデータ生成部で生成されたメタデータと前記メタデータ分析部で分析して得られた分析メタデータを記憶するように構成されており、
前記表示部は、ユーザーによって選択された項目について、前記メタデータ記憶部に保存されたデータを抽出、整理し、可視化して表示する機能を有するように構成され、
前記フィルタリング部、前記データ解析・メタデータ生成部、前記メタデータ分析部、および前記メタデータ記憶部は、HDF5形式でファイルを保存する、検査用データ運用システム。
(構成2)
前記システムは、さらに、前記異常データを記憶する異常データ記憶部を備え、前記異常データ部に記憶された異常データが前記表示部により表示される機能を有するように構成された、構成1記載の検査用データ運用システム。
(構成3)
前記異常データが排除すべき異常データか新規事象を表すデータとして取り扱うデータかを分析する異常データ分析部を備え、新規事象の場合、前記新規事象の内容を前記表示部で表示する機能を備えるように構成された、構成2記載の検査用データ運用システム。
(構成4)
前記メタデータ分析の手段は、統計分析である、構成1から3の何れか一項に記載の検査用データ運用システム。
(構成5)
前記メタデータ分析は、時系列分析、回帰分析、主成分分析、相関分析、因子分析、クラスター分析、正準分析、t分析、分散分析およびランダムフォレストよりなる群から選ばれる1以上である、構成1から4の何れか一項に記載の検査用データ運用システム。
(構成6)
前記表示部のファイル形式は、CSVファイルである、構成1から5の何れか一項に記載の検査用データ運用システム。
(構成7)
前記検査データは、個人属性データを含む、構成1から6の何れか一項に記載の検査用データ運用システム。
(構成8)
前記検査データは、画像データを含む、構成1から7の何れか一項に記載の検査用データ運用システム。
(構成9)
前記画像データは、生体分子蛍光画像データを含む、構成8記載の検査用データ運用システム。
(構成10)
前記検査データは、生体分子蛍光画像データであって、
前記生体分子蛍光画像データの蛍光強度の極大値を基準に、予め定めた基準にしたがって解析領域を自動的に選定する機能と、
前記解析領域内の前記蛍光画像データに対してスムージング処理を施す機能と、
前記解析領域の内のバックグラウンドの強度分布を求める機能と、
前記スムージング処理を施した前記蛍光画像データの蛍光強度空間分布と前記バックグラウンドの強度分布の差分を計算して、正味の前記蛍光画像データの蛍光強度空間分布を求める機能と、
前記正味の蛍光強度空間分布の平均強度および半値全幅を計算する機能を、前記フィルタリング部および前記データ解析・メタデータ生成部の少なくとも何れかに備えている、構成9記載の検査用データ運用システム。
(構成11)
前記メタデータは、蛍光強度空間分布の平均強度、半値全幅、差分量、測定の対象になった生体分子、および前記生体分子の帰属情報より選ばれる群からなる1つ以上を含む、構成10記載の検査用データ運用システム。
(構成12)
コンピュータを用いて全自動で検査用のデータを整型、保存および解析する方法であって、
データ入力とフィルタリングとデータ解析・メタデータ生成とメタデータ分析とメタデータ記憶と表示を行い、
前記データ入力では、前記コンピュータに検査データを取り込み、
前記フィルタリングでは、予め定めた基準にしたがって有効と判断されるデータを前記データ入力で入手したデータから選別して前記コンピュータに取り込み、異常データは識別し、
前記データ解析・メタデータ生成では、前記取り込まれたデータを解析した上でメタデータを生成し、
前記メタデータ分析では、生成された前記メタデータを分析して分析メタデータを生成し、
前記メタデータ記憶では、前記データ解析・メタデータ生成で生成された前記メタデータと前記メタデータ分析手段で分析して得られた前記分析メタデータを前記コンピュータに記憶し、
前記表示では、ユーザーによって選択された項目について、前記メタデータ記憶されたデータを抽出、整理し、可視化して表示し、
前記フィルタリング、前記データ解析・メタデータ生成、前記メタデータ分析、および前記メタデータ記憶にはファイル形式としてHDF5形式を用いた、検査用のデータの整型、保存および解析の方法。
実施の形態1で説明する検査用運用データシステム1001は、コンピュータ(サーバー)を用いたデータ整型、保存および解析を行うシステムであって、図1に示すように、データ入力部11、フィルタリング部12、データ解析・メタデータ生成部13、メタデータ分析部14、メタデータ記憶部15、表示部16および情報路(情報パス)17を備える。
ここで、メタデータ記憶部15はDRAM、SRAMなどの一時記憶装置、FLASHメモリ、FRAM(登録商標)、EPROM、ハードディスク、フロッピーディスク、磁気テープなどの長期記憶装置(ストレッジ)などからなる記憶装置からなる。情報路(情報パス)17は、データ入力部11、フィルタリング部12、データ解析・メタデータ生成部13、メタデータ分析部14、メタデータ記憶部15および表示部16間を結んでデータ、情報を伝える設備で、一般には配線からなる(光インターコネクトでもよい)。
フィルタリング部12(フィルタリング回路12)は、予め定めた基準にしたがって有効と判断されるデータをデータ入力部11で取り込んだデータから選別して取り込み、異常データを識別するように構成されている。
検査用運用データシステム1001の特徴の1つは、データ容量が多い画像データを、後述のように、さらに画像分析を伴って扱えることである。
メタデータ記憶部15(メタデータ記憶回路15)は、データ解析・メタデータ生成部13で生成されたメタデータとメタデータ分析部14で分析して得られた分析メタデータを記憶するように構成されている。
メタデータ分析部14で実行されるメタデータ分析の手段としては統計分析を、その分析としては、時系列分析、回帰分析、主成分分析、相関分析、因子分析、クラスター分析、正準分析、t分析、分散分析およびランダムフォレストよりなる群から選ばれる1以上を挙げることができる。
ファイリング形式をHDF5形式とすることにより、PC等の軽装備ハードウェアで、データ情報量の多い画像データをしかも100万人レベルで、早い処理速度で取り扱うことが可能になっている。また、HDF5形式により、既存のデータは、追加されたデータにより上書き消去されることなく記憶されて活用することが可能であり、同じ所属のデータを帰属毎に集積することが可能という特徴を有する。
一方、表示部16のファイリングの形式としては、CSVファイル、テキストファイル、DATファイルおよびバイナリファイルを挙げることができ、汎用に使用されていて取り扱いの容易なCSVファイルを特に好んで用いることができる。
検査用運用データシステム1001では、ファイリング形式を適材適所で使い分けていることにより、画像を含む大量データを動作が高速なシステムで、かつ表示等の使い勝手よく提供することが可能になっている。
測定されて入力されるデータ1には測定エラー、または、測定試料の異常が含まれることがあり、異常データを取り込むとデータを解析した結果の信頼性も下がる懸念がある。検査用運用データシステム1001は、異常データを管理して、異常データを取り込まないようにしてデータ解析することが可能なシステムになっている。
異常データ記憶部22は、DRAM、SRAMなどの一時記憶装置、FLASHメモリ、FRAM(登録商標)、EPROM、ハードディスク、フロッピーディスク、磁気テープなどの長期記憶装置(ストレッジ)などからなる記憶装置からなり、フィルタリング部12で異常と判定されたデータを記憶し、その記憶情報は表示部16で表示、閲覧できるようになっている。異常データは測定エラーで発生するものとは限らない。新規な現象の発見に繋がることもありうる。検査データ運用システム1002は、新規現象の発見に寄与しうるシステムになっている。
異常データ分析部21は、排除すべき異常データか新規事象を表すデータとして取り扱うべきデータかを分析する機能を備え、新規事象の場合、前記新規事象の内容を前記表示部で表示する機能を備えるように構成される。ここで、異常データ分析部21の分析項目としては、不連続性、偏差および不均一性を、分析手法としては、標準偏差解析、特異値解析および相関解析を挙げることができる。
本発明の検査データ運用システムにより、体外診断検査などの健康情報を総合的に解析した上で判定を行い、短時間で直接被験者に提供することで利便性や医療提供効率を格段に向上させることができる。また、本発明の検査データ運用システムでは、遺伝的特性による疾患および後天的な生活習慣に起因する疾患などの情報を総合的に運用できることから、既存の健康診断にはない個人に最適化された健康情報の提供も可能になる。
実施の形態2では、実施の形態1で説明した検査データ運用システム1001を用い、生体分子蛍光画像を入力データとして生体分子に関するメタデータを得る方法を説明する。
送られた画像データは、データ解析・メタデータ生成部13にて、蛍光画像データの蛍光強度の極大値を基準に予め定めた基準にしたがって解析領域を自動的に選定し、解析領域内の前記蛍光画像データに対して測定機器由来の機械的、熱的ノイズ低減のためのスムージング処理を施すとともに、その解析領域の内のバックグラウンドの強度分布を求める。
しかる後、正味の蛍光強度空間分布の平均強度および半値全幅を計算する。
なお、上記では、画像処理をデータ解析・メタデータ生成部13にて実行する例を示したが、必ずしもデータ解析・メタデータ生成部13で実行する必要はなく、フィルタリング部12で実行してもよいし、作業分担を予め定めてフィルタリング部12とデータ解析・メタデータ生成部13の両部で実行してもよい。
実施例1では、実施の形態1で説明した検査データ運用システム1003を試作し、生体分子試料を用いて蛍光検査した結果について述べる。
最初に、試作した検査用運用データシステム1003について、その構成の詳細を以下に示す。
ホルダー1(101)は、H5py作成を担うData/H5py(111)、データファイル格納場所であるH5py(112)、画像解析を行うImage(113)、CSVファイルを作成するMake_CSV(114)および可視化を行うVisual(115)の5つの機能で構成される。
H5py(112)は、集計されたデータを決められたH5pyフォーマットで保有するディレクトリーである。
Image/CH Image Reading.ipynb(113)は、画像解析を行うディレクトリーで、2つからなる機能で構成され、1つは画像の含まれる異常検知であり、もう1つは蛍光強度解析である。解析結果はホルダー2(102)に送られる。
Make CSV/Make Files.ipynb(114)は、Data/H5py(111)およびImage(113)で得られたデータを集計し、CSVフォーマットで出力する機能である。
Visual/Visual.ipynb(115)は、H5py(112)ファイルを読み込み、統計分析を行って結果を可視化する機能を担う。
Analysis(116)は、JPEG、CSV形式の解析結果が、対象画像が保管されているディレクトリーのデータとともに並列して出力されるようになっている。
一連の解析作業は、機関内のPCで行い、PC内のPython開発環境(Anaconda)により実行した(ステップS101)。
H5pyファイルにアップロードするデータは、決められたフォーマットで作成され、個人ID、ファクター名および検査日付をKeyとした(ステップS102)。
次に、H5pyファイルを生成し(ステップS103)、H5pyファイル内のデータセットにCSVファクター一覧データをインポートした(ステップS104)。
その後、H5pyファイル内のデータセットにCSV個人属性データ、CSV時系列データおよび自動作成のカレンダーデータを順次インポートし(ステップS105~S107)、H5pyファイルに、ステップS104~S107により格納されたデータを集計するプログラムを起動させて集計データを管理した(ステップS108)。
最後に、集計されたデータは、予め定められたフォーマットでCSV出力を行った(ステップS109)。
一連の解析作業は、機関内のPCで行い、PC内のPython開発環境(Anaconda)により実行した(ステップS201)。
最初に、検査装置からのTiff形式の画像データをデーターベースサーバーに格納した(ステップS202)。
次に、画像解析プログラムを起動させた(ステップS203)。ここで、そのプログラムが格納されているディレクトリーはホルダー1(101)のImage/CH Image Reading.ipynb(113)である。
詳細には、ステップS204の画像データ読み込みは16ビット画像に対応したPython組み込み関数を用いて行い、ステップS205の画像セル分割化では1040×1392Pixel画像を100×100Pixelの正方形セルに分割した。
ステップS206の各セルの画像データ異常値計算では、異常値a、bおよびcの3種類の計算を行った。ここで、異常値aは、強度分布の最大極値を除いた変曲点の数、異常値bは、各セル(100×100Pixel)内での強度が60000を超えるPixel数、そして異常値cは、各セル(100×100Pixel)内での強度が平均値+3.5×σ(標準偏差)を超えるPixel数とした。ここでの平均値及び標準偏差は、画像内で強度が500を超える (強度>500) Pixelを用いて計算されたものである。
具体的には、異常値aについては異常値が2個以上の場合、異常値bについては全セル計算値における最大値が100を超える場合、そして異常値cについては全セル計算値における最大値が100を超える場合の何れか1つ以上に当てはまる場合を異常とした。
その後、統計解析結果を解析結果CSVとしてデータ用ディレクトリーに保存し(ステップS208)、正常と判断された画像データはH5pyファイルに格納された(ステップS209)。
一連の解析作業は、機関内のPCで行い、PC内のPython開発環境(Anaconda)により実行した(ステップS301)。
最初に、検査装置からのTiff形式の画像データをデーターベースサーバーに格納した(ステップS302)。
次に、画像解析プログラムを起動させた(ステップS303)。ここで、そのプログラムが格納されているディレクトリーはホルダー1(101)のImage/CH Image Reading.ipynb(113)である。
しかる後、ガウシアン平準化を行った結果に対して平準化蛍光強度の最大値(極値)を計算してその画像における座標位置(X,Y)を特定し(ステップS306)、引き続き、可視化用に分布の尖度を高めた平準化を行った(ステップS307)。ここで、組み込み関数は、ndi.uniform.filterでsize=5(セル5×5Pixel内の単純平均)に設定した。
その後、ステップS307で計算された極値周辺における蛍光強度に関して、radius=150Pixel、sigma=50Pixelでのガウシアン平均値を求めた(ステップS308)。
最後に、蛍光強度のヒストグラムおよび統計値をCVSファイルで出力するとともに(ステップS311)、蛍光強度および検査値(濃度)をH5pyに格納(ステップS312)して、一連の正常画像解析を終えた。
一連の解析作業は、機関内のPCで行い、PC内のPython開発環境(Anaconda)により実行した(ステップS401)。
画像データは、すでにデーターベースサーバー取り込まれているTiff形式の画像データを使用した(ステップS402)。
次に、可視化プログラムを起動する(ステップS403)。この可視化プログラムでは、検査メタデータにアクセスして各ファクターの関係性を総計的に可視化する。具体的には、各データ系列の相関性を回帰分析で探しだし、回帰分析による時系列およびクロスセクションでのファクター効果を可視化する。
その後、データーベースサーバーからデータを読み込み(ステップS404)、ヒストグラム(ステップS405)、相関マトリックス(ステップS406)、2次元ファクタープロット(ステップS407)、3次元ファクタープロット(ステップS408)および蛍光強度要因分析(ステップS409)を順次行う。ここで、ステップS405のヒストグラム作成では各ファクターに関してクロスセクションでのヒストグラムを作成し、ステップS406の相関マトリックス作成では各ファクター間の事件列相関係数マトリックスを作成した。ステップS407の2次元ファクタープロットでは時系列で相関の高いファクター間の2次元プロットを作成し、ステップS408の3次元ファクタープロットでは時系列で相関の高いファクター間の3次元プロットを作成した。ステップS409の蛍光強度要因分析では機械学習による蛍光強度の要因分析を行った。
最後に、JPEG形式のファイルを出力して可視化を終了した(ステップS410)。
次に、生体分子を図10に示す生体分子検査装置2001で蛍光測定し、その測定結果を検査用運用データシステム1003に入力して解析を行った。
生体分子検査装置2001は、主要な構成として、検査チップ(図示なし)が収められた検査チップホルダー250、試料の入ったマイクロチューブを収める試料ホルダー212、試料を採液する採液ピン201をアレー状に配置して保持する取り付け治具202、試料を検査チップに送るポンプ205、試料ホルダー移送機構215、高精度に蛍光検査面を位置決めして蛍光像を得るための第1の電動ステージ203、第2の電動ステージ260および第3の電動ステージ220、共焦点光学系を用いて蛍光像を得る検知機構214からなる。ここで、検査チップは特許文献4に開示があるものに準拠して作製されている。
図13Aは、図11Aの強度の極大値付近での分布を示しており、略ガウス分布となっている。この分布をガウス分布で近似することにより平均値と分布幅(標準偏差)を定量化できる。
図13Bは、ガウス分布の近似からのずれをQQプロットで示している。ここで、特性曲線が直線上にあるときはガウス分布と一致していることを示す。中心付近から±3の範囲で一致を示し、略ガウス分布であることが確認できる。
以上を通じて、図11AおよびBの画像から強度の平均値の差が定量化でき、その値は945であることが得られた。これが正味の蛍光信号強度であることから、あらかじめ測定した検出曲線を用いて、検出した生体分子を定量化できた。
図15は、図14の測定画像に対して画像判定を行った結果を示している。前記異常値aに対応する空間的な分布の異常を図15Aに示しており、画像内の強度に跳びが生じていることを前記異常値cに対応している図15Cで可視化している。前記異常値bに対応の図15Bでは、16ビットの信号範囲に関して異常は検出されていない。
図16は、前記異常値bに対応した例で、16ビットの信号範囲に関して異常が検出された例である。
このように、蛍光画像の異常が複数の基準から判定されるため、データの解析に信頼性を担保することができた。
参考までに、前記異常値bに対応の特性図を図15に、ガウス分布からずれている実測例の強度の極大値付近での分布図とそのQQプロットを各々図17Aおよび図17Bに示す。
一方、検査用運用データシステム1003を用いた本発明では、同等の解析結果を得るまで約10秒で終わり、さらに約5秒でデータの整型まで完了した。処理能力の向上により大量のデータ処理が可能となり、手動で処理しきれない量の解析を可能にするという著しい技術的な効果が認められた。また、本発明は、画像データの異常判定も同時に行われ、有用である。処理の高速化・短時間化に伴う人件費の削減などによる経済的効果も大きい。
11 データ入力部
12 フィルタリング部
13 データ解析・メタデータ生成部
14 メタデータ分析部
15 メタデータ記憶部
16 表示部
17 情報路(情報パス)
21 異常データ分析部
22 異常データ記憶部
101 第1のホルダー
102 第2のホルダー
111 データディレクトリー(H5py)
112 データディレクトリーH5py(集計データ用)
113 イメージディレクトリー(画像解析用ディレクトリー)
114 CSVデータ作成用ディレクトリー
115 ビジュアルディレクトリー(統計分析、可視化用ディレクトリー)
116 解析ディレクトリー
117 第1の入力画像データディレクトリー(バックグラウンド用)
118 第2の入力画像データディレクトリー(フォアグラウンド用)
119 入力参照ファイル
201 採液ピン
202 取付治具
203 第1の電動ステージ
205 ポンプ
212 試料ホルダー
214 検知機構
215 試料ホルダー移送機構
220 第3の電動ステージ
250 検査チップホルダー
260 第2の電動ステージ
1001 検査運用データシステム
1002 検査運用データシステム
1003 検査運用データシステム
2001 生体分子検査装置
Claims (12)
- 検査用データの運用を行う、コンピュータを用いたデータ整型、保存、解析システムであって、
前記システムは、データ入力部とフィルタリング部とデータ解析・メタデータ生成部とメタデータ分析部とメタデータ記憶部と表示部とを備え、
前記データ入力部は、検査データを取り込むように構成されており、
前記フィルタリング部は、予め定めた基準にしたがって有効と判断されるデータを前記データ入力部で取り込んだデータから選別して取り込み、異常データを識別するように構成されており、
前記データ解析・メタデータ生成部は、前記取り込まれたデータを解析した上でメタデータを生成するように構成されており、
前記メタデータ分析部は、生成された前記メタデータを分析して分析メタデータを得るように構成されており、
前記メタデータ記憶部は、前記データ解析・メタデータ生成部で生成されたメタデータと前記メタデータ分析部で分析して得られた分析メタデータを記憶するように構成されており、
前記表示部は、ユーザーによって選択された項目について、前記メタデータ記憶部に保存されたデータを抽出、整理し、可視化して表示する機能を有するように構成され、
前記フィルタリング部、前記データ解析・メタデータ生成部、前記メタデータ分析部、および前記メタデータ記憶部は、HDF5形式でファイルを保存する、検査用データ運用システム。 - 前記システムは、さらに、前記異常データを記憶する異常データ記憶部を備え、前記異常データ部に記憶された異常データが前記表示部により表示される機能を有するように構成された、請求項1記載の検査用データ運用システム。
- 前記異常データが排除すべき異常データか新規事象を表すデータとして取り扱うデータかを分析する異常データ分析部を備え、新規事象の場合、前記新規事象の内容を前記表示部で表示する機能を備えるように構成された、請求項2記載の検査用データ運用システム。
- 前記メタデータ分析の手段は、統計分析である、請求項1から3の何れか一項に記載の検査用データ運用システム。
- 前記メタデータ分析は、時系列分析、回帰分析、主成分分析、相関分析、因子分析、クラスター分析、正準分析、t分析、分散分析およびランダムフォレストよりなる群から選ばれる1以上である、請求項1から4の何れか一項に記載の検査用データ運用システム。
- 前記表示部のファイル形式は、CSVファイルである、請求項1から5の何れか一項に記載の検査用データ運用システム。
- 前記検査データは、個人属性データを含む、請求項1から6の何れか一項に記載の検査用データ運用システム。
- 前記検査データは、画像データを含む、請求項1から7の何れか一項に記載の検査用データ運用システム。
- 前記画像データは、生体分子蛍光画像データを含む、請求項8記載の検査用データ運用システム。
- 前記検査データは、生体分子蛍光画像データであって、
前記生体分子蛍光画像データの蛍光強度の極大値を基準に、予め定めた基準にしたがって解析領域を自動的に選定する機能と、
前記解析領域内の前記蛍光画像データに対してスムージング処理を施す機能と、
前記解析領域の内のバックグラウンドの強度分布を求める機能と、
前記スムージング処理を施した前記蛍光画像データの蛍光強度空間分布と前記バックグラウンドの強度分布の差分を計算して、正味の前記蛍光画像データの蛍光強度空間分布を求める機能と、
前記正味の蛍光強度空間分布の平均強度および半値全幅を計算する機能を、前記フィルタリング部および前記データ解析・メタデータ生成部の少なくとも何れかに備えている、請求項9記載の検査用データ運用システム。 - 前記メタデータは、蛍光強度空間分布の平均強度、半値全幅、差分量、測定の対象になった生体分子、および前記生体分子の帰属情報より選ばれる群からなる1つ以上を含む、請求項10記載の検査用データ運用システム。
- コンピュータを用いて全自動で検査用のデータを整型、保存および解析する方法であって、
データ入力とフィルタリングとデータ解析・メタデータ生成とメタデータ分析とメタデータ記憶と表示を行い、
前記データ入力では、前記コンピュータに検査データを取り込み、
前記フィルタリングでは、予め定めた基準にしたがって有効と判断されるデータを前記データ入力で入手したデータから選別して前記コンピュータに取り込み、異常データは識別し、
前記データ解析・メタデータ生成では、前記取り込まれたデータを解析した上でメタデータを生成し、
前記メタデータ分析では、生成された前記メタデータを分析して分析メタデータを生成し、
前記メタデータ記憶では、前記データ解析・メタデータ生成で生成された前記メタデータと前記メタデータ分析手段で分析して得られた前記分析メタデータを前記コンピュータに記憶し、
前記表示では、ユーザーによって選択された項目について、前記メタデータ記憶されたデータを抽出、整理し、可視化して表示し、
前記フィルタリング、前記データ解析・メタデータ生成、前記メタデータ分析、および前記メタデータ記憶にはファイル形式としてHDF5形式を用いた、検査用のデータの整型、保存および解析の方法。
Priority Applications (1)
| Application Number | Priority Date | Filing Date | Title |
|---|---|---|---|
| JP2025524042A JPWO2024247883A1 (ja) | 2023-05-30 | 2024-05-23 |
Applications Claiming Priority (2)
| Application Number | Priority Date | Filing Date | Title |
|---|---|---|---|
| JP2023088702 | 2023-05-30 | ||
| JP2023-088702 | 2023-05-30 |
Publications (1)
| Publication Number | Publication Date |
|---|---|
| WO2024247883A1 true WO2024247883A1 (ja) | 2024-12-05 |
Family
ID=93657952
Family Applications (1)
| Application Number | Title | Priority Date | Filing Date |
|---|---|---|---|
| PCT/JP2024/019029 Ceased WO2024247883A1 (ja) | 2023-05-30 | 2024-05-23 | 検査用データ運用システム、並びに、データの整型、保存および解析の方法 |
Country Status (2)
| Country | Link |
|---|---|
| JP (1) | JPWO2024247883A1 (ja) |
| WO (1) | WO2024247883A1 (ja) |
Citations (6)
| Publication number | Priority date | Publication date | Assignee | Title |
|---|---|---|---|---|
| US20140164444A1 (en) * | 2012-12-01 | 2014-06-12 | The Regents Of The University Of California | System and method of managing large data files |
| JP2014117222A (ja) * | 2012-12-17 | 2014-06-30 | Hitachi High-Technologies Corp | 遺伝子型解析装置及び遺伝子型解析方法 |
| WO2015015585A1 (ja) * | 2013-07-31 | 2015-02-05 | 株式会社日立製作所 | 遺伝子変異分析装置、遺伝子変異分析システム及び遺伝子変異分析方法 |
| WO2016093090A1 (ja) * | 2014-12-09 | 2016-06-16 | コニカミノルタ株式会社 | 画像処理装置及び画像処理プログラム |
| JP2021174456A (ja) * | 2020-04-30 | 2021-11-01 | ボッシュ株式会社 | 異常判定方法及び異常判定装置 |
| WO2022170145A1 (en) * | 2021-02-05 | 2022-08-11 | Viqi, Inc. | Machine learning for early detection of cellular morphological changes |
-
2024
- 2024-05-23 JP JP2025524042A patent/JPWO2024247883A1/ja active Pending
- 2024-05-23 WO PCT/JP2024/019029 patent/WO2024247883A1/ja not_active Ceased
Patent Citations (6)
| Publication number | Priority date | Publication date | Assignee | Title |
|---|---|---|---|---|
| US20140164444A1 (en) * | 2012-12-01 | 2014-06-12 | The Regents Of The University Of California | System and method of managing large data files |
| JP2014117222A (ja) * | 2012-12-17 | 2014-06-30 | Hitachi High-Technologies Corp | 遺伝子型解析装置及び遺伝子型解析方法 |
| WO2015015585A1 (ja) * | 2013-07-31 | 2015-02-05 | 株式会社日立製作所 | 遺伝子変異分析装置、遺伝子変異分析システム及び遺伝子変異分析方法 |
| WO2016093090A1 (ja) * | 2014-12-09 | 2016-06-16 | コニカミノルタ株式会社 | 画像処理装置及び画像処理プログラム |
| JP2021174456A (ja) * | 2020-04-30 | 2021-11-01 | ボッシュ株式会社 | 異常判定方法及び異常判定装置 |
| WO2022170145A1 (en) * | 2021-02-05 | 2022-08-11 | Viqi, Inc. | Machine learning for early detection of cellular morphological changes |
Also Published As
| Publication number | Publication date |
|---|---|
| JPWO2024247883A1 (ja) | 2024-12-05 |
Similar Documents
| Publication | Publication Date | Title |
|---|---|---|
| Rangan et al. | Quantification of renal pathology by image analysis (Methods in Renal Research) | |
| US11626200B2 (en) | Histology recognition to automatically score and quantify cancer grades and individual user digital whole histological imaging device | |
| JP6366556B2 (ja) | 生物学的試片をスペクトル画像により分析する方法 | |
| US20130089248A1 (en) | Method and system for analyzing biological specimens by spectral imaging | |
| Hamilton et al. | Digital pathology and image analysis in tissue biomarker research | |
| CN115210817A (zh) | 用于分析电子图像以进行质量控制的系统和方法 | |
| CN114616590A (zh) | 用于为数字病理学处理载玻片图像的系统和方法 | |
| US20120327211A1 (en) | Diagnostic information distribution device and pathology diagnosis system | |
| US20170213067A1 (en) | Automated cell segmentation quality control | |
| US20120257811A1 (en) | Computerized methods for tissue analysis using n-gene profiling | |
| JPWO2008108059A1 (ja) | 乳癌病理画像診断支援システム、乳癌病理画像診断支援方法、乳癌病理画像診断支援プログラム、及び、乳癌病理画像診断支援プログラムを記録した記録媒体 | |
| EP0628186A1 (en) | Method for identifying normal biomedical specimens | |
| CN115461821A (zh) | 处理电子图像以确定数字病理学中的凸显信息的系统和方法 | |
| Aydin et al. | Is there any relationship between adc values of diffusion-weighted imaging and the histopathological prognostic factors of invasive ductal carcinoma? | |
| Bhandari et al. | Detection of colon cancer stages via fractal dimension analysis of optical transmission imaging of tissue microarrays (TMA) | |
| US12597133B2 (en) | Training end-to-end weakly supervised networks at the specimen (supra-image) level | |
| JP2024500100A (ja) | デジタル病理学ワークフロー用のスライドの電子画像を処理するためのシステム及び方法 | |
| JP2025522349A (ja) | 推論ベースの仮想染色画像注釈を発生させる方法 | |
| Holzhüter et al. | Visualizing uncertainty in biological expression data | |
| CN119604944A (zh) | 用于数字病理学图像的审查的诊断工具 | |
| CN113056792B (zh) | 系统、程序及方法 | |
| US20210209756A1 (en) | Apparatuses and methods for digital pathology | |
| Rohde et al. | Carnegie Mellon University bioimaging day 2014: Challenges and opportunities in digital pathology | |
| US20040225531A1 (en) | Computerized system and method for automated correlation of mammography report with pathology specimen result | |
| EP4115387A1 (en) | Medical image analysis system and method for managing medical images |
Legal Events
| Date | Code | Title | Description |
|---|---|---|---|
| 121 | Ep: the epo has been informed by wipo that ep was designated in this application |
Ref document number: 24815367 Country of ref document: EP Kind code of ref document: A1 |
|
| ENP | Entry into the national phase |
Ref document number: 2025524042 Country of ref document: JP Kind code of ref document: A |
|
| WWE | Wipo information: entry into national phase |
Ref document number: 2025524042 Country of ref document: JP |
|
| NENP | Non-entry into the national phase |
Ref country code: DE |
|
| 122 | Ep: pct application non-entry in european phase |
Ref document number: 24815367 Country of ref document: EP Kind code of ref document: A1 |