WO2024247764A1 - シグナルベース法による分子の修飾分析 - Google Patents
シグナルベース法による分子の修飾分析 Download PDFInfo
- Publication number
- WO2024247764A1 WO2024247764A1 PCT/JP2024/018330 JP2024018330W WO2024247764A1 WO 2024247764 A1 WO2024247764 A1 WO 2024247764A1 JP 2024018330 W JP2024018330 W JP 2024018330W WO 2024247764 A1 WO2024247764 A1 WO 2024247764A1
- Authority
- WO
- WIPO (PCT)
- Prior art keywords
- molecule
- data
- modification
- modification state
- series data
- Prior art date
- Legal status (The legal status is an assumption and is not a legal conclusion. Google has not performed a legal analysis and makes no representation as to the accuracy of the status listed.)
- Ceased
Links
Images






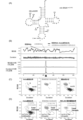


Classifications
-
- C—CHEMISTRY; METALLURGY
- C12—BIOCHEMISTRY; BEER; SPIRITS; WINE; VINEGAR; MICROBIOLOGY; ENZYMOLOGY; MUTATION OR GENETIC ENGINEERING
- C12Q—MEASURING OR TESTING PROCESSES INVOLVING ENZYMES, NUCLEIC ACIDS OR MICROORGANISMS; COMPOSITIONS OR TEST PAPERS THEREFOR; PROCESSES OF PREPARING SUCH COMPOSITIONS; CONDITION-RESPONSIVE CONTROL IN MICROBIOLOGICAL OR ENZYMOLOGICAL PROCESSES
- C12Q1/00—Measuring or testing processes involving enzymes, nucleic acids or microorganisms; Compositions therefor; Processes of preparing such compositions
- C12Q1/68—Measuring or testing processes involving enzymes, nucleic acids or microorganisms; Compositions therefor; Processes of preparing such compositions involving nucleic acids
-
- G—PHYSICS
- G01—MEASURING; TESTING
- G01N—INVESTIGATING OR ANALYSING MATERIALS BY DETERMINING THEIR CHEMICAL OR PHYSICAL PROPERTIES
- G01N27/00—Investigating or analysing materials by the use of electric, electrochemical, or magnetic means
Definitions
- the present invention relates to a method for analyzing the modification state of a molecule using a signal-based method, and an analysis system, an analysis device, a program, and a diagnostic support method related thereto.
- Proteins are synthesized by translation from template mRNA.
- tRNA functions as an adapter molecule that decodes the 61 types of genetic code (codons) encoded in mRNA and converts them into 20 types of amino acids.
- codons genetic code
- tRNA undergoes various chemical modifications (tRNA modifications) to mature and function normally.
- RNA modifications not only complement the functions of RNA, but also play a role in regulating gene expression by adding completely new functions. It is known that various modifications are formed in the anticodon of tRNA and its surroundings, and these tRNA modifications play an important role in accurate codon decoding and maintaining the reading frame during translation. There are also many modifications in the center (body) of tRNA, which are known to be mainly involved in tRNA folding and intracellular stability.
- Nanopore sequencers are single-molecule sequencers that can directly analyze sequences by measuring the current value (ion current signal) of single-stranded DNA or RNA passing through a nanopore made of membrane proteins. Modified bases in an RNA strand exhibit a characteristic current value when passing through a nanopore, unlike unmodified bases, and therefore it may be possible to simultaneously detect all modifications.
- Non-Patent Documents 1-4 RNA modifications in mRNA and rRNA are not frequent, making it possible to analyze RNA modifications using existing base callers. Analysis of tRNA using methods similar to those for mRNA and rRNA has also been reported (Non-Patent Documents 5-6).
- the object of the present invention is therefore to provide a novel method for analyzing the modification state of structural units in a molecule in which one or more types of structural units are bonded together.
- the analytical method is a method for analyzing the modification state of structural units in a molecule in which one or more types of structural units are bonded together, and includes the steps of: acquiring, for each of a plurality of target molecules to be analyzed, series data of signal values that vary depending on the type and modification state of each structural unit obtained by scanning the molecule; aligning each of the series data acquired from the plurality of target molecules to reference data, thereby aligning the plurality of series data with each other; and analyzing the modification state of at least some of the plurality of target molecules to be analyzed based on the aligned series data.
- the multiple analyte molecules may include one or more types of molecules.
- the multiple analyte molecules may include multiple molecules of one type, or may include multiple molecules of each type, two or more types.
- the reference data used when aligning a plurality of series data is obtained by actually measuring the reference data and mixing a plurality of series data, so that it is possible to create reference data that has higher alignment accuracy for a plurality of series data.
- the multiple series data to be mixed include two or more types of series data obtained or estimated from two or more types of molecules having the same sequence of constituent units as at least one of the target molecules, and the modification states of the constituent units being different from each other.
- the reference data is obtained by mixing series data based on two or more types of molecules with different modification states, so that it is possible to create reference data with higher alignment accuracy for the multiple series data.
- analyzing the modification states of the plurality of analyte molecules may include calculating a distance between a distribution of signal values at a predetermined point of the plurality of series data related to the first molecule and a distribution of signal values at a point of the plurality of series data related to the second molecule corresponding to the predetermined point, using the plurality of series data obtained or estimated from a first molecule whose constitutional unit has a first modification state and aligned, and the plurality of series data obtained or estimated from a second molecule whose constitutional unit has a second modification state and aligned, and estimating a portion where the modification state differs between the first molecule and the second molecule based on the calculated distance.
- This aspect makes it possible to find portions where the modification state differs in two types of series data.
- analyzing the modification states of the plurality of analyte molecules may include estimating the modification state of a first building block in a third molecule in which the modification state of the first building block is unknown, using a machine learning model trained with teacher data including the sequence data obtained from a first molecule in which the modification state of a first building block present at a first position in the sequence of building blocks of the analyte molecule is a first modification state, and the sequence data obtained from a second molecule in which the modification state of the first building block is a second modification state.
- This aspect makes it possible to estimate the modification state of a building block present at a specific position for a molecule in which the modification state of the building block is unknown.
- analyzing the modification states of the plurality of analyte molecules may include classifying the aligned plurality of series data into two or more clusters using an unsupervised machine learning model. This embodiment makes it possible to classify molecules whose modification states are unknown into two or more clusters.
- the classifying into clusters may include calculating a similarity between each of the aligned multiple sequence data and classifying the aligned multiple sequence data into two or more clusters based on the similarity. This aspect allows clustering to be performed with a smaller amount of calculation than when the sequence data is used directly for clustering.
- the molecule may be a nucleic acid. It is also preferable that the plurality of analyte molecules includes at least two of the following: a nucleic acid derived from a wild strain, a nucleic acid having no modification, and a nucleic acid derived from a modified strain in which the modification state of a specific base has changed from that of the wild strain. It is also preferable that the plurality of analyte molecules includes all of the following: a nucleic acid derived from a wild strain, a nucleic acid having no modification, and a nucleic acid derived from a modified strain in which the modification state of a specific base has changed from that of the wild strain. This aspect makes it possible to identify modified portions in nucleic acids derived from a wild strain on the lineage data.
- the plurality of analyte molecules at least include nucleic acid derived from the wild strain, and that the ratio of the number of modified bases to the total number of bases constituting the nucleic acid in the nucleic acid derived from the wild strain is 4% or more.
- This embodiment can effectively achieve the effect of the above method, that is, high analytical accuracy when various modifications are present at high density.
- the method when aligning each of the plurality of series data with the reference data, may further include calculating redundancy of the series data with respect to the reference data, and analyzing the modification state based on the calculated redundancy.
- the speed at which the molecule is scanned is expressed by the redundancy of the series data. Therefore, this aspect makes it possible to analyze the modification state of the constituent units of the molecule based on changes in the speed at which the molecule is scanned.
- the diagnostic support method is a method for supporting the diagnosis of a disease that causes a disorder in the modification state of a structural unit in a molecule in which one or more types of structural units are bonded together, and includes analyzing a patient-derived specimen containing the molecule and a healthy subject-derived specimen containing the molecule by the above-mentioned analytical method, and analyzing the difference in the modification state of the structural units in the molecule between the patient-derived specimen and the healthy subject-derived specimen.
- This diagnostic support method can simplify the diagnosis of the above-mentioned disease.
- system refers to a system that is made up of multiple devices and is used to provide specific functions to users.
- system may be made up of, but is not limited to, a server device, a cloud computing system, an ASP (Application Service Provider), a client-server model, etc.
- ASP Application Service Provider
- part is not limited to a physical configuration, but also includes cases where the functions of the configuration are realized by software.
- functions of one configuration may be realized by two or more physical configurations, and the functions of two or more configurations may be realized by one physical configuration.
- the present invention provides a novel method for analyzing the modification state of structural units in a molecule in which one or more types of structural units are bonded together.
- FIG. 1 is a schematic diagram of an analysis system according to an embodiment of the present invention.
- FIG. 2 is a functional block diagram of the analysis device according to the present embodiment.
- FIG. 1 is a diagram showing a physical configuration of an analysis device according to an embodiment of the present invention.
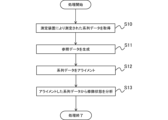
- 4 is a flowchart of a process in the analysis device according to the present embodiment.
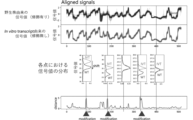
- 1 is an example of an analysis result in the analysis method according to the present embodiment.
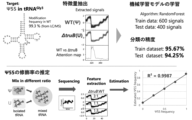
- 1 is an example of an analysis method according to the present embodiment.
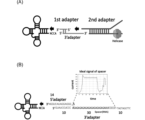
- the design of the adapter when measuring tRNA by a nanopore sequencer in the embodiment is shown.
- A The outline of the adapter design is shown.
- (B) The design of the 1st adapter is shown.
- 1 shows an example of detection of Escherichia coli tRNA Asn modifications by the analysis method according to the present embodiment.
- A Shows Escherichia coli tRNA Asn modifications and deletion strains corresponding to each modification.
- B Shows the distance of the distribution of signal values for tRNA Asn derived from a wild-type strain, tRNA Asn derived from in vitro transcription, and tRNA Asn derived from each deletion strain.
- 1 is an example of creating a machine learning model regarding modification of Escherichia coli tRNA Gly3 by the analysis method according to the present embodiment.
- 13 is an example of clustering performed by unsupervised machine learning on the modification of Escherichia coli tRNA Pro3 using the analysis method according to the present embodiment.
- FIG. 13 is a diagram illustrating an example of a method for calculating redundancy of sequence data with respect to reference data in the analysis method according to the present embodiment.
- 1 shows an example of detection of human mt-tRNA Leu (UUR) modification by the analysis method according to the embodiment.
- UUR human mt-tRNA Leu
- A Shows human mt-tRNA Leu (UUR) modification.
- B Shows the current value and duration of tRNA derived from Hela cells and tRNA derived from a modification enzyme-deficient strain, as well as the Kullback-Leibler (KL) distance of their distribution.
- C Shows the distribution of current value and duration at the point indicated by the triangle in (B).
- (D) Shows the distribution and estimated abundance ratio of U and ⁇ m 5 U in series data derived from Hela cells, series data derived from a modification enzyme-deficient strain, and series data derived from myoblasts of a MELAS patient. This is an example of detection of modification of yeast tRNA Gln1a by the analysis method according to the embodiment.
- (A) The biosynthetic pathway of mcm5s2U is shown.
- B The current value and duration of tRNA derived from a wild-type strain and tRNA derived from a modification enzyme-deficient strain ( ⁇ elp3 ⁇ ncs6), as well as the Kullback-Leibler (KL) distance of their distribution are shown.
- 1 shows an example of detection of modification of yeast tRNA Gln1a by the analysis method according to the embodiment. The distribution of each modification state and the estimated abundance ratio are shown for a wild-type strain and modification enzyme-deficient strains ( ⁇ elp3 ⁇ ncs6 and ⁇ ncs6).
- [Analysis system] 1 is a diagram showing an outline of the configuration of an analysis system 1 according to the present embodiment.
- the analysis system 1 includes a measurement device 20 and an analysis device 10 that analyzes the results of measurement by the measurement device 20.
- the measurement device 20 measures an analyte molecule
- the analysis device 10 analyzes the measurement results, thereby analyzing the modification state of the analyte molecule.
- the analysis device 10 is connected to the measurement device 20 via a communication network N.
- the communication network N may be a wired or wireless communication network.
- the analysis device 10 does not necessarily have to be an independent device from the measurement device 20, and may be configured integrally with the measurement device 20. In this case, the measurement device may also function as the analysis device 10 by executing an analysis program installed in the measurement device.
- the analysis system 1 analyzes the modification state of structural units in molecules (hereinafter simply referred to as "molecules") in which one or more types of structural units are bonded together.
- the molecules analyzed by the analysis system 1 are preferably biopolymers.
- biopolymers include peptides, proteins, nucleic acids, polysaccharides, and combinations thereof (e.g., lipoproteins, glycoproteins, nucleoproteins, sugar chains, etc.).
- the structural units of peptides and proteins are amino acids
- the structural units of nucleic acids are nucleotides
- the structural units of polysaccharides are monosaccharides. It is preferable that the biomolecule is capable of being formed into a single chain.
- modification of a molecule or its constituent units means that the molecule or its constituent units are altered from their normal state, e.g., natural or wild type, including, for example, the addition of an additional group that is not normally present, the deletion of a group that is normally present, and the replacement of an atom or atomic group that is normally present with another atom or atomic group.
- a modification of an amino acid may be a modification of the side chain of the amino acid. Examples of such modifications of an amino acid include post-translational modifications such as phosphorylation, methylation, acetylation, and glycosylation.
- a modification of a nucleotide may be a modification of the sugar portion of a nucleoside and/or a modification of the base portion of a nucleoside.
- a modification of a monosaccharide may be a modification of the hydrocarbon chain.
- Modifications of nucleotides and the like include post-transcriptional modifications of RNA molecules, epigenetic modifications of DNA molecules or histone proteins that cover DNA molecules, and the like. Examples of modifications of sugar chains include phosphorylation, methylation, acetylation, glycosylation, and sulfonation.
- the molecule for which the analysis system 1 analyzes the modification state may be any biomolecule that can be made into a single strand, but is preferably a nucleic acid, and particularly preferably tRNA. tRNA often has a variety of modifications present at high density, and analysis by the analysis system 1 according to the present embodiment is particularly effective.
- the molecule for which the analysis system 1 analyzes the modification state is preferably a molecule derived from a wild strain, in which the ratio of the number of structural units having modifications to the total number of structural units constituting the molecule is 4% or more, 5% or more, 6% or more, 7% or more, 8% or more, 9% or more, or 10% or more.
- modifications in nucleic acids see Boccaletto, P. et al. MODOMICS: a database of RNA modification pathways. 2021 update. Nucleic Acids Res 50, D231-D235, doi:10.1093/nar/gkab1083 (2022), etc.
- the analysis device 10 analyzes the measurement results by a method that is completely different from that of conventional analysis devices, and analyzes the modification state of the analysis target molecule.
- a base sequence is estimated by base calling from an actual measured current signal, and the estimated base sequence is aligned based on similarity with a reference sequence to obtain a feature value of each base. Since modified bases show a different current value from unmodified bases, the accuracy of mapping to a reference sequence based on similarity is low in the modified base portion.
- RNA modification When analyzing the modification state of mRNA and rRNA, the frequency of RNA modification is low and most bases are unmodified, so that the accuracy of mapping of modified bases is ultimately ensured by correctly mapping the parts other than the modified bases.
- tRNA where there are many types and numbers of RNA modifications and multiple modified bases are concentrated in a short region, such existing strategies cannot be applied.
- the analysis device 10 does not estimate constituent units from signal values as in conventional analysis devices, but aligns multiple measured series data and performs signal-based analysis, so that alignment can be performed with high accuracy even when a variety of modifications are present at high density, resulting in highly accurate analysis.
- the measuring device 20 is a device that measures molecules each composed of multiple bonds of one or more types of structural units, and obtains sequence data. To obtain the sequence data, the measuring device 20 scans the molecule and obtains signal values that vary depending on the type and modification state of each structural unit.
- the sequence data obtained by the measuring device 20 is typically, but not necessarily, time-series data.
- the measuring device 20 measures a plurality of molecules to be analyzed. Therefore, when the measuring device 20 measures the molecules to be analyzed, a plurality of series of data is obtained.
- the measuring device 20 may measure a plurality of molecules of one type, or may measure a plurality of molecules of two or more types.
- An example of the measuring device 20 is a nanopore sequencer.
- a nanopore sequencer measures the current value when a measurement molecule passes through a nanopore made of a membrane protein or the like and which is large enough for one measurement molecule to pass through, thereby obtaining a signal value that reflects the type and modification state of each constituent unit of the measurement molecule.
- the series data obtained by a nanopore sequencer is time-series data. For example, when a molecule passes through a nanopore from one end to the other, a signal value corresponding to the molecular part passing through the nanopore (i.e., a part made up of one or more constituent units) is obtained, and time-series data is output as the molecular part moves from one end to the other.
- a commercially available measuring device 20 can be used.
- a nanopore sequencer from ONT Olford nanopore technologies
- ONT Olford nanopore technologies
- the analysis device 10 analyzes the series data measured by the measurement device 20 and analyzes the modification state of the measured molecule.
- Fig. 2 is a functional block diagram of the analysis device 10.
- the analysis device 10 includes an acquisition unit 11, a reference data generation unit 12, an alignment unit 13, and an analysis unit 14. Note that the analysis device 10 does not need to include, for example, the reference data generation unit 12, and may have another functional configuration not shown in Fig. 2.
- the acquisition unit 11 acquires the sequence data measured by the measurement device 20.
- the acquisition unit 11 may be realized by the communication unit 10d described below.
- the acquisition unit 11 may acquire the sequence data measured by the measurement device 20 for each measurement, or may acquire multiple sequence data obtained by multiple measurements all at once.
- the reference data generating unit 12 generates reference data to be used for alignment in the alignment unit 13.
- the reference data generating unit 12 generates reference data that can be aligned with each of the multiple series data measured by the measuring device 20.
- the reference data may include, for example, any of the multiple series data measured by the measuring device 20, or may include series data estimated from the sequence information of the molecule measured by the measuring device 20.
- the reference data may be, for example, any of the multiple series data measured by the measuring device 20, or may be series data estimated from the sequence information of the molecule measured by the measuring device 20, or may be series data obtained by mixing two or more of the multiple series data measured by the measuring device 20 and, optionally, series data estimated from the sequence information of the molecule measured by the measuring device 20.
- the reference data generating unit 12 may be realized by a program stored in the RAM 10b or ROM 10c described below and executed by the CPU 10a.
- the alignment unit 13 aligns the multiple series data acquired by the acquisition unit 11 based on the reference data generated by the reference data generation unit 12.
- "aligning" series data means aligning the overall length of series data in which the order of each data point corresponds to each other but the overall length of the data differs due to differences in the length and number of corresponding data points, making direct comparison between the data difficult, by associating each data point between the data while maintaining the order of each data point.
- this means identifying corresponding data points for two series data and adjusting the time of each data point so that the time of the corresponding data points is the same, thereby aligning the overall length of the data.
- the alignment unit 13 may be realized by the input unit 10e described below, and a program stored in the RAM 10b or ROM 10c described below and executed by the CPU 10a.
- the alignment unit 13 may perform alignment by dynamic programming, for example, or may perform alignment using a dynamic time warping (DTW) method or the like. Although there are no particular limitations on the DTW, soft DTW is preferable.
- the sequence data obtained by the measurement device 20 may be interpreted as data that undergoes state transitions according to a hidden Markov model, and alignment may be performed by the Viterbi algorithm.
- the alignment unit 13 may calculate the redundancy of the series data with respect to the reference data.
- the redundancy of the series data with respect to the reference data means the length of the portion of the series data that corresponds to a specific portion of the reference data (the number of data points). For example, when comparing a case in which two or more points of series data correspond to one point of reference data with a case in which one point of series data corresponds to two or more points of reference data, it can be said that the former has higher redundancy of the series data than the latter.
- the redundancy of the sequence data with respect to the reference data is calculated locally for each part of the reference data and the sequence data, since the sequence data is associated with a specific part of the reference data.
- a specific example of a method for calculating the redundancy of the sequence data will be described later.
- the analysis unit 14 analyzes the modification state of molecules corresponding to at least a portion of the acquired sequence data based on the multiple sequence data aligned by the alignment unit 13. Because the multiple sequence data acquired by the acquisition unit 11 are aligned by the alignment unit 13, the analysis unit 14 can analyze the modification state with high accuracy. Specifically, the analysis unit 14 detects modifications based on changes in signal values and/or changes in redundancy using the multiple aligned sequence data. Details of the analysis method in the analysis unit 14 will be described later.
- the analysis unit 14 may be realized by the input unit 10e described later, and a program stored in the RAM 10b or ROM 10c described later and executed by the CPU 10a.
- the analysis device 10 may output the analysis results from the analysis unit 14 in an appropriate format.
- the analysis device 10 may display the analysis results on a display unit 10f described below, or may transmit the analysis results to another terminal via the communication unit 10d.
- the analysis results may be a three-dimensional or two-dimensional graph, may be numerical data, or may be the modification state of the structural units in the molecule.
- FIG. 3 is a diagram showing the physical configuration of the analysis device 10.
- the analysis device 10 has a CPU (Central Processing Unit) 10a equivalent to a processor, a RAM (Random Access Memory) 10b equivalent to a storage unit, a ROM (Read only Memory) 10c, a communication unit 10d, an input unit 10e, and a display unit 10f. These components are connected to each other via a bus so that they can send and receive data.
- the analysis device 10 is configured by a single computer, but the analysis device 10 may be realized by combining multiple computers.
- the configuration shown in Figure 3 is an example, and the analysis device 10 may have other configurations than these, or may not have some of these configurations.
- the CPU 10a is a control unit that controls the execution of programs stored in the RAM 10b or ROM 10c and calculates and processes data.
- the CPU 10a is a calculation unit that executes a program (analysis program) that analyzes the series data acquired by the measuring device 20.
- the CPU 10a receives various data from the input unit 10e and the communication unit 10d, and displays the results of calculations on the data on the display unit 10f or stores them in the RAM 10b or ROM 10c.
- RAM 10b is a storage unit in which data can be rewritten, and may be configured, for example, with a semiconductor memory element.
- RAM 10b may store an analysis program executed by CPU 10a. Note that these are merely examples, and data other than these may also be stored in RAM 10b.
- ROM 10c is a memory section from which data can be read, and may be configured, for example, with a semiconductor memory element. ROM 10c may store, for example, data that is not rewritten.
- the communication unit 10d is an interface that connects the analysis device 10 to other devices.
- the communication unit 10d may be connected to a communication network N such as the Internet.
- the input unit 10e accepts data input from a user and may include, for example, a keyboard and a touch panel.
- the display unit 10f visually displays the results of the calculations performed by the CPU 10a, and may be configured, for example, with an LCD (Liquid Crystal Display).
- the display unit 10f may display the results of the analysis performed by the analysis unit 14.
- the analysis program may be provided by being stored in a computer-readable storage medium such as RAM 10b or ROM 10c, or may be provided via a communication network connected by communication unit 10d.
- CPU 10a executes the analysis program to realize the operations of acquisition unit 11, reference data generation unit 12, alignment unit 13, and analysis unit 14 described using FIG. 2.
- analysis device 10 may include an LSI (Large-Scale Integration) in which CPU 10a is integrated with RAM 10b and/or ROM 10c.
- LSI Large-Scale Integration
- the acquisition unit 11 acquires a plurality of series data from the measurement device 20 (S10).
- the measurement device 20 measures one or more types of analyte molecules and measures the series data.
- the two or more types of analyte molecules have the same sequence of constituent units, but the modification states of the constituent units are different from each other.
- the measurement device 20 measures two or more types of nucleic acids that have the same base sequence but different modification states.
- the two or more types of analyte molecules may be measured one by one to obtain multiple series data labeled by type, or the two or more types of analyte molecules may be measured all at once to obtain multiple series data that are not labeled.
- the reference data generating unit 12 generates reference data for aligning the sequence data acquired in step S10 (S11). There are no particular limitations on the reference data to be generated as long as it can be aligned with each of the acquired sequence data.
- the reference data generating unit 12 may generate the reference data by any one of the following methods.
- (1) Method of selecting one of the sequence data acquired in step S10 as reference data the reference data may be selected randomly from the sequence data acquired in step S10, or may be selected based on the length of the sequence data. For example, the sequence data in the middle when the acquired sequence data are sorted in order of length may be selected as the reference data.
- a method for generating reference data based on a sequence of a constituent unit of an analyte molecule when the sequence is known This method generates virtual sequence data predicted from the sequence of the constituent unit of an analyte molecule, and uses the virtual sequence data as reference data.
- the analyte molecule is a nucleic acid
- software can be used that virtually predicts the current value of a nanopore sequencer based on the base sequence.
- reference data can be generated by this method only when the correspondence between sequence data and the measured signal value is known.
- sequence data when the nucleic acid is unmodified can be predicted by a known method.
- a plurality of sequence data obtained from one type of analyte molecule may be mixed, or a plurality of sequence data obtained from two or more types of analyte molecules may be mixed.
- an algorithm for averaging a plurality of sequence data may be used. Examples of such algorithms include DTW barycenter averaging (DBA).
- DBA DTW barycenter averaging
- the parameters of the hidden Markov model may be estimated by the Baum-Welch algorithm.
- the reference data obtained in this manner has the average characteristics of the two or more target molecules, and therefore tends to be able to be aligned with a high degree of accuracy with respect to multiple sequence data.
- step S10 When the sequence of the constituent units of the molecule to be analyzed is known, virtual sequence data is generated based on the sequence in a manner similar to that of (2) above, and the virtual sequence data is mixed with at least a part of the sequence data obtained in step S10 in a manner similar to that of (3) above to generate reference data.
- the molecule from which the virtual sequence data is generated may be an unmodified molecule.
- the sequence data mixed with the virtual sequence data may be one or more types of sequence data obtained in step S10.
- the above methods (3) and (4) are preferred, the above method (3) is more preferred, and in the above method (3), the method of mixing two or more types of series data obtained from two or more types of molecules having the same sequence of constituent units but different modification states of the constituent units is particularly preferred.
- the alignment unit 13 aligns the multiple series data acquired in step S10 based on the reference data generated in step S11 (S12).
- the multiple series data are aligned using the reference data as a reference. More specifically, by aligning each of the multiple series data with the reference data, the length of the multiple series data corresponds to the length of the reference data, making it easier to compare the series data.
- the alignment can be performed as described above.
- step 12 in addition to the multiple series data acquired in step S10, the virtual series data generated in step S11 and the series data stored in RAM 10b or ROM 10c may be aligned with the reference data.
- step 12 when aligning multiple series data based on the reference data, the redundancy of the series data with respect to the reference data may be calculated.
- the calculation of the redundancy will be described with reference to FIG. 11.
- FIG. 11(A) is a conceptual diagram when aligning reference data and sequence data.
- each point of the reference data is associated with each point of the sequence data, and such association is represented by a line segment connecting each point.
- the data shown in FIG. 11(A) conceptually shows, for example, a portion where four points of sequence data are associated with one point of reference data, and a portion where one point of sequence data is associated with three points of reference data.
- the value of how many points in the sequence data are associated with one point of reference data is shown as "Insertion number”
- the value of how many points in the reference data are associated with one point of sequence data is shown as "Deletion number.”
- Insertion number and Deletion number it is possible to calculate the redundancy of the sequence data with respect to the reference data.
- the correspondence matrix can be calculated, for example, by a soft DTW algorithm using the reference data and sequence data.
- FIG. 11B shows a correspondence matrix in which the strength of the correspondence between each point of the reference data and each point of the sequence data to be aligned is probabilistically expressed as a value between 0 and 1.
- the first row of the matrix P has elements in the first and second columns that are 1, and the other elements are 0.
- the deletion number at the i-th point of the sequence data can be expressed by the following formula (I)
- the insertion number at the j-th point of the reference data can be expressed by the following formula (II).
- Duration is an index that indicates how locally redundant a point of reference data associated with the jth point of reference data is with respect to the reference data.
- Duration it means that the sequence data and the reference data are associated one-to-one
- Duration is less than 0
- Duration means that the reference data is more redundant than the sequence data
- Duration is greater than 0, it means that the sequence data is more redundant than the reference data.
- step S12 the analysis unit 14 analyzes the modification state of at least a portion of the target molecule based on the multiple series data aligned in step S12 (S13). Since the series data is aligned in step S12, in this step S13, it becomes possible to easily statistically detect changes in signal values due to the type of target molecule and/or changes in redundancy of the series data relative to the reference data. An example of this step S13 is described below.
- analyzing the modification state of at least a part of the target molecule based on the aligned multiple series data includes analyzing the modification state by comparing the magnitude and distribution of the signal values of the multiple series data, analyzing the modification state by comparing the amount of redundancy of the multiple series data relative to the reference data and the distribution of the redundancy, and analyzing the modification state using a machine learning model that uses the aligned multiple series data as input values, as described in detail below.
- Step S13 may include, for example, calculating a distance between a distribution of signal values at a predetermined point of the plurality of series data related to the first molecule and a distribution of signal values at a point of the plurality of series data related to the second molecule associated with the predetermined point, using a plurality of series data obtained and aligned from a first molecule whose modification state is a first modification state and a plurality of the series data obtained and aligned from a second molecule whose modification state is a second modification state, and estimating a portion where the modification state differs between the first molecule and the second molecule based on the calculated distance.
- the series data of the first molecule and/or the series data of the second molecule may be virtual series data generated by a method similar to that of (2) of step S11 above, but preferably at least one of them is the series data obtained in step S10, and more preferably both are the series data obtained in step S10.
- FIG. 5 shows an example of an analysis in this embodiment in which the first molecule is a wild-type (natural) molecule and the second molecule is an in vitro transcript-derived (synthesized in a test tube) molecule.
- the top row shows multiple series data obtained and aligned from wild-type molecules and multiple series data obtained and aligned from in vitro transcript-derived molecules.
- the middle row shows the signal value distribution of the series data of wild-type molecules (WT) and the signal value distribution of the series data of in vitro transcript-derived molecules (IVT) at several points in the series data.
- WT wild-type molecules
- IVT in vitro transcript-derived molecules
- the difference in signal value distribution between WT and IVT means that the modification state is different between wild-type molecules and in vitro transcript-derived molecules at that part.
- the lower section shows the distance between the distribution of signal values of the sequence data of molecules derived from the wild-type strain and the distribution of signal values of the sequence data of molecules derived from the in vitro transcript for all points in the sequence data. As highlighted by the triangles at the bottom of this distance graph, the parts where the calculated distance exceeds a certain threshold can be estimated as the modification positions of molecules derived from the wild-type strain.
- the distribution distance of the signal values of the series data between various molecules is calculated.
- the distribution distance of the signal values of multiple series data relating to two or more types of molecules may be calculated at all points of the series data (all horizontal axis values in the upper part of Figure 5).
- the distance between distributions of signal values is a value that quantitatively represents the difference between two or more types of distributions, and can be calculated by a known method. Examples of such methods include methods that quantify the difference between two probability distributions. Specific examples include the Kullback-Leibler (KL) distance and the Jensen-Shannon (JS) distance.
- KL Kullback-Leibler
- JS Jensen-Shannon
- Step S13 may include, for example, estimating the modification state of a first building block in a third molecule in which the modification state of the first building block is unknown, using a machine learning model trained with teacher data including sequence data obtained from a first molecule in which the modification state of a first building block present at a first position in the sequence of building blocks is a first modification state, and sequence data obtained from a second molecule in which the modification state of the first building block is a second modification state.
- the first molecule may be a molecule derived from a wild-type strain
- the second molecule may be a molecule derived from an in vitro transcript, or a molecule derived from a deletion strain in which an enzyme involved in the modification at the first position in the wild-type strain has been deleted.
- the training data for the machine learning model in this embodiment is sequence data labeled as the first or second molecule.
- the machine learning model may be weighted using an attention map created from molecules derived from a wild strain and molecules derived from an in vitro transcript or from a modified strain in which the modification state of a structural unit at a specific position has been changed from that of the wild strain. In this case, the more distant the portion in the attention map, the more strongly it may be weighted.
- Step S13 may include classifying the aligned sequence data into two or more types of clusters using, for example, an unsupervised machine learning model.
- the aligned sequence data may be clustered as is, or the aligned sequence data may be clustered based on the similarity between the aligned sequence data after calculating the similarity between the aligned sequence data.
- the similarity between two series data may be calculated by a known method, but for example, the distance (absolute value of the difference in signal values) at each point of the aligned series data may be calculated, and the sum of the distances for all points may be used as an index of similarity.
- clustering based on similarity for example, taking the case of clustering N series data as an example, the similarity between each molecule and N series data including itself is quantified (for example, the distance is calculated as described above), N vectors with N components each having the similarity as a component are generated, and the vectors are clustered. Note that N is not particularly limited as long as it is 2 or more.
- the method for clustering vectors whose components are sequence data or similarity is not particularly limited, and may be, for example, hierarchical clustering, kmeans, DBSCAN (Density-based spatial clustering of applications with noise), or other methods.
- the machine learning model may be weighted by an attention map created from a molecule derived from a first strain and a molecule derived from a second strain, in the same manner as in the first embodiment described above.
- the first molecule may be a molecule derived from a wild-type strain
- the second molecule may be a molecule derived from an in vitro transcript, or a molecule derived from a deletion strain in which an enzyme involved in the modification at the first position in the wild-type strain has been deleted.
- Step S13 may perform an analysis of the modification state based on, for example, the redundancy of the sequence data calculated in step S12.
- the speed at which the RNA passes through the nanopore changes depending on the presence or absence of modification of the RNA.
- One of the factors is, for example, that when RNA passes through the nanopore, the speed at which the RNA double strand is unwound by the helicase to become a single strand changes depending on the presence or absence of modification of the RNA.
- RNA having a 2'O-methyl modification passes through the helicase, the passage time of the base being read in the nanopore (9-11 bases downstream) increases (Stephenson W, Razaghi R, Busan S, Weeks KM, Timp W, Smibert P (2022) Direct detection of RNA modifications and structure using single-molecule nanopore sequencing. Cell Genom 2).
- the series data acquired by scanning the target molecule contains information on the modification state of the target molecule not only in terms of the magnitude of the signal value but also in terms of the length of the series data, in other words, the redundancy with respect to the reference data. Therefore, in this embodiment, the modification state is analyzed based on the redundancy of the series data calculated in step S12.
- the analysis may be performed in the same manner as in the analysis in the first embodiment described above, except that the distance of the redundancy of the sequence data is calculated. That is, in this embodiment, for a plurality of sequence data obtained and aligned from a first molecule whose modification state of the constituent unit is a first modification state, and a plurality of sequence data obtained and aligned from a second molecule whose modification state of the constituent unit is a second modification state, the redundancy of the sequence data with respect to the reference data may be calculated as in step S12, and the distance between the distribution of the redundancy at a predetermined point of the plurality of sequence data related to the first molecule and the distribution of the redundancy at a point of the plurality of sequence data related to the second molecule associated with the predetermined point may be calculated, and based on the calculated distance, a portion where the modification state differs between the first molecule and the second molecule may
- sequence data of the first molecule and/or the sequence data of the second molecule may be virtual sequence data generated in a manner similar to step S11 (2) above, but preferably at least one of them is sequence data obtained in step S10, and more preferably both are sequence data obtained in step S10.
- the analysis of the modification state may be performed by combining the analysis in the first aspect and an analysis based on redundancy of sequence data.
- the method may include estimating a difference in modification state between the first molecule and the second molecule based on a distribution of signal values at a first point of a plurality of sequence data related to the first molecule and a distribution of redundancy at a second point, and a distribution of signal values at a plurality of sequence data points related to the second molecule associated with the first point and a distribution of redundancy at a plurality of sequence data points related to the second molecule associated with the second point.
- the first point and the second point may be the same or different.
- the first point may be the point where the distance in the distribution of signal values between the first molecule and the second molecule is the largest (the peak part of the graph of the distance in the distribution of signal values)
- the second point may be the point where the distance in the distribution of redundancy between the first molecule and the second molecule is the largest (the peak part of the graph of the distance in the distribution of redundancy).
- the signal value may be plotted on the first axis (e.g., the vertical axis) and the redundancy on the second axis (e.g., the horizontal axis), and a scatter plot reflecting the signal value and local redundancy may be created, and the difference in the modification state between the first molecule and the second molecule may be estimated based on the scatter plot.
- the abundance ratio of the first molecule and the second molecule in the sample may be estimated from each plot in the scatter plot.
- One such method is to cluster each plot in the scatter plot. Specifically, for example, it is possible to assume that the current value and the Duration value are distributed according to one bivariate normal distribution for each modification state, and to label the modification state of each plot in the scatter plot using a bivariate mixture Gaussian model.
- the method may include calculating the distance between the distribution and redundancy of signal values at a predetermined point in a plurality of series data related to the first molecule and the distribution and redundancy of signal values at a point in a plurality of series data related to the second molecule associated with the predetermined point, and estimating the portion in which the modification state differs between the first molecule and the second molecule based on the two calculated distances.
- Fig. 6 An example of analysis in the analysis system 1 according to this embodiment is shown in Fig. 6.
- sequence data is acquired by the measurement device 20 for molecules derived from wild-type strains (IVT) derived from in vitro transcripts, molecules derived from deletion strains (deletion strains A to C) in which an enzyme involved in modification at a specific position in the wild-type strain has been deleted, and a sample to be analyzed.
- IVT wild-type strains
- deletion strains A to C deletion strains in which an enzyme involved in modification at a specific position in the wild-type strain has been deleted
- a sample to be analyzed a sample to be analyzed.
- the modification state of the sample to be analyzed is unknown, and the sequences of the building blocks of all molecules are identical.
- reference data is created by mixing molecules derived from wild-type strains and molecules derived from in vitro transcripts (IVT), and all of the above-mentioned series data are aligned based on the reference data.
- IVT in vitro transcripts
- a corresponding attention map and machine learning model are created.
- the modification state of the sample to be analyzed can be analyzed for each molecule.
- the number of molecules derived from deletion strains to be compared with molecules derived from the wild strain may be two or less, or may be four or more.
- the reference data does not have to be a mixture of molecules derived from the wild strain and molecules derived from the in vitro transcript, but may be, for example, a mixture of multiple series data of molecules derived from the wild strain.
- molecules derived from modified strains to which an enzyme involved in a modification at a specific position not present in the wild strain has been added may be used in the analysis.
- the analysis system 1 can be used in a method for assisting in the diagnosis of a disease that causes a disorder in the modification state of a structural unit in a molecule in which one or more types of structural units are bonded together.
- the diagnostic support method according to this embodiment includes analyzing a patient-derived specimen containing a molecule formed by multiple bonds of one or more types of structural units, and a healthy subject-derived specimen containing the molecule, using the analysis system 1 according to this embodiment, and analyzing the difference in the modification state of the structural units in the molecule between the patient-derived specimen and the healthy subject-derived specimen.
- an attention map may be created based on, for example, sequence data obtained from a specimen derived from a patient and sequence data obtained from a specimen derived from a healthy individual. This aspect can assist in easily determining whether or not a patient has a disorder in the modification state of the constituent units of the molecule.
- a patient-derived sample and a healthy subject-derived sample may be analyzed, for example, by a method similar to the analytical example described with reference to FIG. 6, to estimate how the modification state of molecules contained in the patient-derived sample differs from that of the healthy subject-derived sample.
- a method for analyzing the modification state of a structural unit in a molecule having one or more types of structural units bonded together comprising the steps of: Obtaining series data of signal values that vary depending on the type and modification state of each of the structural units obtained by scanning each of a plurality of analyte molecules; aligning each of the plurality of series data obtained from the plurality of analyte molecules with reference data, thereby aligning the plurality of series data with each other; Analyzing modification states of at least a portion of the plurality of analyte molecules based on the aligned plurality of sequence data; , an analytical method.
- a method for analyzing the modification state of a base in a nucleic acid comprising the steps of: Obtaining series data of signal values that change depending on the type and modification state of each base obtained by scanning the nucleic acid for each of the plurality of nucleic acids; aligning each of the plurality of sequence data obtained from the plurality of nucleic acids with reference data, thereby aligning the plurality of sequence data with each other; analyzing modification states of at least a portion of the plurality of nucleic acids based on the aligned plurality of sequence data; , an analytical method.
- [1] and [1-1] will be collectively referred to as [1].
- [2] generating the reference data by mixing a plurality of sequence data including the acquired sequence data.
- [3] The plurality of series data to be mixed includes two or more types of series data obtained or estimated from two or more types of molecules having the same sequence of structural units as at least one of the analyte molecules, and each of which has a different modification state of the structural units.
- [4] Analyzing the modification state of the plurality of analyte molecules calculating a distance between a distribution of signal values at a predetermined point in the plurality of sequence data related to the first molecule and a distribution of signal values at a point in the plurality of sequence data related to the second molecule corresponding to the predetermined point, using a plurality of sequence data obtained or estimated from a first molecule, the modification state of which is a first modification state, and a plurality of sequence data obtained or estimated from a second molecule, the modification state of which is a second modification state, and estimating a portion having a different modification state between the first molecule and the second molecule based on the calculated distance; Including, The analysis method according to any one of [1] to [3].
- [6] Analyzing the modification state of the plurality of analyte molecules classifying the aligned sequence data into two or more clusters using an unsupervised machine learning model; The analysis method according to any one of [1] to [5]. [7] Classifying into the clusters calculating a similarity between each of the aligned sequence data; classifying the aligned plurality of sequence data into two or more clusters based on the similarity. The analysis method according to [6]. [8] the molecule is a nucleic acid; The analysis method according to any one of [1] to [7].
- the plurality of analyte molecules include at least two of a nucleic acid derived from a wild-type strain, a nucleic acid having no modification, and a nucleic acid derived from a mutant strain in which a modification state of a specific base has been changed from that of the wild-type strain;
- the plurality of analyte molecules include at least two of a wild-type molecule, a non-modified molecule, and a mutant molecule in which a modification state of a specific base has been changed from that of the wild-type molecule;
- the analysis method according to any one of [1] to [7].
- the plurality of analyte molecules includes at least a nucleic acid derived from the wild-type strain; the ratio of the number of modified bases to the total number of bases constituting the nucleic acid in the wild-type nucleic acid is 4% or more; The analysis method according to [9].
- the plurality of analyte molecules includes at least a molecule derived from the wild-type strain; In the molecule derived from the wild-type strain, the ratio of the number of structural units having the modification to the total number of structural units constituting the molecule is 4% or more. The analysis method described in [9-1].
- the method further includes calculating redundancy of the sequence data with respect to the reference data when aligning each of the plurality of sequence data with the reference data; performing an analysis of the modification state based on the calculated redundancy; The analysis method according to any one of [1] to [10].
- a system for analyzing a modification state of a structural unit in a molecule having one or more types of structural units bonded together comprising: a measuring device that acquires, for each of a plurality of analyte molecules, series data of signal values that vary depending on the type and modification state of each structural unit obtained by scanning the molecule; an acquisition unit that acquires the sequence data acquired by the measurement device; an alignment unit that aligns each of the plurality of series data obtained from the plurality of analyte molecules with reference data, thereby aligning the plurality of series data with each other; and an analysis unit that analyzes modification states of at least some of the plurality of analyte molecules based on the aligned plurality of series data; Including, the system.
- An analytical device for analyzing a modification state of a structural unit in a molecule in which one or more types of structural units are bonded together comprising: an acquisition unit that acquires series data from a measurement device that acquires series data of signal values that vary depending on the type and modification state of each structural unit obtained by scanning the molecules for each of a plurality of analyte molecules; an alignment unit that aligns each of the plurality of series data acquired from the plurality of analyte molecules with reference data, thereby aligning the plurality of series data with each other; an analysis unit that analyzes modification states of at least a part of the plurality of analyte molecules based on the aligned plurality of sequence data;
- An analysis device comprising: [14] A program that causes a computer to function as an analyzer for analyzing modification states of structural units in a molecule in which one or more types of structural units are bonded together, comprising: Computer, an acquisition unit that acquires, for each of a plurality of analyte molecules, sequence data of
- a method for aiding in the diagnosis of a disease resulting from a disorder in the modification state of one or more types of structural units in a molecule having multiple linked structural units comprising: Analyzing a patient-derived specimen containing the molecule and a healthy subject-derived specimen containing the molecule by the analytical method according to any one of [1] to [11]; Analyzing the difference in modification state of building blocks of the molecule between the patient sample and the healthy subject sample;
- a method comprising:
- the present invention will be described in more detail below using examples.
- the present invention is not limited to the following examples.
- the modification state of tRNA is analyzed, but the molecule to be analyzed is not limited to tRNA.
- Nanopore sequencing of tRNA (overview)
- an adapter (2nd adapter) provided by ONT (Oxford nanopore technologies) was ligated (FIG. 7(A)).
- the 2nd adapter is bound to a motor protein necessary for the RNA strand to pass through the nanopore. Due to the difference in the protruding sequence, the 2nd adapter was not directly ligated to the tRNA, but an adapter (1st adapter) that mediates between the tRNA and the 2nd adapter was ligated first. After that, the tRNA ligated to the 1st adapter was purified by electrophoresis and gel excision, and the 2nd adapter was further ligated. The subsequent operations were in accordance with the Direct RNA sequencing manual published by ONT.
- a 1st adapter design was designed that is composed of a 3' adapter that is ligated to the 3' side of the tRNA and a 5' adapter that is ligated to the 5' side ( Figure 7 (B)).
- the last 10 bases of the 3' adapter were DNA, and the rest were RNA.
- it was designed to form a complementary strand to the protruding 3' end sequence of the mature tRNA molecule. Since there are five possible patterns for the protruding sequence at the 3' end of the mature tRNA depending on the tRNA species (ACCA, UCCA, GCCA, CCCA, CCA), the corresponding 5' adapters were designed as shown in the table below.
- the DNA sequence was set to TAGTAGGTTC (SEQ ID NO: 1) so that the DNA sequence at the end of the 3' adapter would form a complementary strand with the 2nd adapter.
- TAGTAGGTTC SEQ ID NO: 1
- a spacer was incorporated into the center of the 3' adapter, which is not involved in ligation but is used to generate a characteristic current value during nanopore sequencing. The spacer was used for adapter trimming of the current signal during data analysis, etc.
- the gel was removed, stained with toluidine blue, washed with pure water, and the 100 nt to 200 nt portion containing the luggage spaced tRNA was excised from the gel.
- the excised fragment was ground in a 1.5 mL tube.
- 250 ⁇ L Elution Buffer was added, stirred at 1100 rpm for 1 hour, centrifuged, and the supernatant was collected. Addition of Elution Buffer, stirring, centrifugation, and collection of the supernatant were repeated twice.
- the solution together with the gel was placed in a spin column and centrifuged at 12000 g for 2 minutes at 4 ° C. The filtrate was collected and precipitated with ethanol.
- the ligated tRNA was purified by removing small molecules by Drop Dialysis using a membrane filter and dissolving in pure water.
- RNA Clean XP was added and gently mixed for 5 minutes using a rotator.
- the beads were adsorbed with a magnet, the liquid was removed, 75 ⁇ L of WSB was added, and tapping was performed. After repeating this, 21 ⁇ L of ELB was added instead of 75 ⁇ L of WSB, and pipetting was performed. After leaving it at room temperature for 10 minutes, the beads were adsorbed with a magnet and the liquid was collected.
- Nanopore sequencing was performed according to the Direct RNA sequencing manual published by ONT.
- the reagents used above are shown below.
- T4 RNA Ligase2 (10 units/ ⁇ L) (NEB M0239L) DynaMarker RNA Low2 (BioDynamics Institute DM152) NEBNext Quick Ligation Reaction Buffer (NEB B6058)
- T4 DNA Ligase (2,000 units/ ⁇ L) (NEB M0202M)
- RNA CleanXP (Beckman-coulter A63987) Direct RNA sequencing kit (Oxford nanopore technologies SQK-RNA002)
- E. coli tRNA Asn has seven types of RNA modifications at nine positions.
- E. coli wild-type strains hereinafter also referred to as "WT strains”
- various tRNA modification enzyme-deficient strains hereinafter referred to as "KO strains”
- IVT tRNA Asn derived from in vitro transcripts
- the time series data from the WT strain and the time series data from the IVT strain were mixed in a 1:1 ratio, and reference data was created by DTW barycenter averaging. All measured time series data was aligned using this reference data. DTW was used for alignment.
- the time series data from the WT strain and the time series data from the IVT strain were compared, and the Kullback-Leibler (KL) distance was calculated for each point of the time series data. When the data were plotted, multiple peaks were confirmed (WT vs. IVT graph in Figure 8(B)).
- WT strain, KO strain ⁇ truB strain, and IVT-derived tRNA Gly3 were obtained or prepared, and current signals were measured by nanopore sequencing to obtain time series data.
- the time series data from the WT strain and the time series data from the ⁇ truB strain were compared, and the Kullback-Leibler (KL) distance was calculated for each point of the time series data to create an attention map.
- the peak positions of the attention map were extracted as features, and the time series data from the WT strain was labeled as ⁇ 55, and the time series data from the ⁇ truB strain was labeled as unmodified uridine (U55).
- a machine learning model (RandomForestClassifier (Breiman, L. Random Forests. Machine Learning 45, 5-32, doi:10.1023/a:1010933404324 (2001)) was trained to classify these using teacher data. As a result, an accuracy of 94.25% was achieved on the test data (top of Figure 9).
- CmoM is an enzyme that methylates cmo 5 U34 to form mcmo 5 U34, and in ⁇ cmoM strain derived tRNA Pro3 , mcmo 5 U34 has disappeared, and only cmo 5 U34 and U34 are present. On the other hand, only U34 is present in IVT tRNA Pro3 .
- the time series data from the WT strain, ⁇ cmoM strain, and IVT were aligned using a method similar to that described in "2. Detection of E. coli tRNA modifications.”
- 3,000 pieces of time series data from the WT strain, ⁇ cmoM strain, and IVT 3,000 pieces of data in total
- the sum of the distances between each point in the two time series data was calculated, and a 3,000 x 3,000 distance matrix was created.
- the calculated sum of the distances corresponds to the similarity between the two time series data, with a smaller sum of the distances indicating a higher similarity.
- the distance matrix obtained was subjected to hierarchical clustering by the Ward method.
- the time series data derived from IVT was all classified into cluster 3
- the time series data derived from the ⁇ cmoM strain into clusters 1 and 3
- the time series data derived from the WT strain into clusters 1, 2, and 3.
- cluster 3 was U34
- cluster 2 was cmo 5 U34
- cluster 1 was mcmo 5 U34.
- mt-tRNA human mitochondrial tRNA
- Mitochondrial myopathy, encephalopathy, lactic acidosis, and stroke-like episodes (MELAS) a representative disease type, is caused by a point mutation in the mt-tRNA Leu (UUR) gene (Goto Y, Nonaka I, Horai S (1990) A mutation in the tRNA(Leu)(UUR) gene associated with the MELAS subgroup of mitochondrial encephalomyopathies. Nature 348: 651-653).
- MELAS mutations (A3243G, T3271C, etc.) destabilize the three-dimensional structure of mt-tRNA Leu (UUR) and prevent recognition by tRNA modification enzymes, thereby causing a decrease in the modification rate of ⁇ m 5 U34.
- ⁇ m 5 U34 is essential for decoding UUG codons, and a defect in this modification is thought to be one of the causes of mitochondrial dysfunction (Suzuki T, et al.
- a model for classifying the modification state of ⁇ m 5 U34 of mt-tRNA Leu was created, and it was demonstrated that the modification rate can be measured from the data obtained by nanopore sequencing of total tRNA extracted from myoblasts derived from MELAS patients.
- mt-tRNA Leu (UUR) derived from wild-type HeLa cells and mt-tRNA Leu (UUR) derived from a ⁇ m 5 U modification enzyme (GTPBP3)-deficient strain were used, and current signals were measured by nanopore sequencing according to the method described above to obtain time-series data.
- reference data was created based on the time series data from HeLa cells and the time series data from the modification enzyme-deficient strain, and all the measured time series data was aligned using this reference data ( Figure 12 (B)). During alignment, the Duration was calculated for each point of the time series data based on the above-mentioned formulas (I) to (IV) ( Figure 12 (B)).
- the Kullback-Leibler (KL) distance was calculated for each point of the time series data of the current value based on the entire time series data from the aligned HeLa cells and the entire time series data from the aligned modification enzyme-deficient strain ( Figure 12 (B)).
- the Kullback-Leibler (KL) distance was calculated for each point of the time series data of Duration calculated above ( Figure 12 (B)).
- the parameters of the Gaussian distribution for the distribution of U (uridine) and the distribution of ⁇ m 5 U on the scatter plot of Duration ⁇ current value were obtained by the EM (expectation-maximization) algorithm. Specifically, it was assumed that the current value and the Duration value were distributed according to one bivariate normal distribution for each modification state, and a bivariate mixed Gaussian model was used. As a result, the modification rate of U derived from HeLa cells was estimated to be 91.2% (228 of 250 reads were estimated to be ⁇ m 5 U), and the modification rate of U derived from the modification enzyme-deficient strain was estimated to be 1.7% (9 of 541 reads were estimated to be ⁇ m 5 U) (FIG. 12(D)). In FIG. 12(D), " ⁇ " represents the center of the normal distribution, and the circle represents a range twice the standard deviation.
- tRNAs corresponding to amino acids such as glutamic acid (Glu), lysine (Lys), and glutamine (Gln) have a modification of 5-methoxycarbonylmethyl-2-thiourdine (mcm 5 s 2 U) at the first letter (position 34) of the anticodon.
- mcm 5 s 2 U is a multi-step modification formed by a complex biosynthetic pathway as shown in Figure 13 (A).
- mcm5s2U is difficult to detect using conventional methods (e.g., conventional RNA sequencing or primer extension methods), and in order to detect such modifications, tRNA is usually isolated and purified, followed by LC/MS analysis (Yoshida M, Kataoka N, Miyauchi K, Ohe K, Iida K, Yoshida S, Nojima T, Okuno Y, Onogi H, Usui T et al (2015) Rectifier of aberrant mRNA splicing recovers tRNA modification in familial dysautonomia. Proc Natl Acad Sci U S A 112: 2764-2769).
- a model was created for classifying yeast tRNA Gln1a into three types: mcm 5 s 2 U, one of its intermediates, 5-methoxycarbonylmethylurdine (mcm 5 U), and unmodified U.
- tRNA Gln1a derived from a wild type (WT) strain and tRNA Gln1a derived from a modification enzyme-deficient strain were prepared.
- As the deficient strains an ncs6-deficient strain ( ⁇ ncs6) and an elp3 and ncs6 double-deficient strain ( ⁇ elp3 ⁇ ncs6) were used.
- current signals were measured by nanopore sequencing according to the method described above to obtain time-series data.
- the Kullback-Leibler (KL) distance was calculated for each point of the time series data of the aligned current values derived from ⁇ elp3 ⁇ ncs6, based on the time series data of the aligned current values derived from the WT strain ( Figure 13(B)).
- the Kullback-Leibler (KL) distance was calculated for each point of the time series data of Duration calculated above ( Figure 13(B)).
- the Kullback-Leibler (KL) distance was calculated for the time series data of the aligned current values derived from ⁇ ncs6 and the time series data of Duration, based on the time series data of the aligned current values derived from the WT strain.
- the parameters of the Gaussian distribution were calculated by the expectation-maximization (EM) algorithm for the distribution of U (uridine), the distribution of mcm 5 U, and the distribution of mcm 5 s 2 U on the scatter diagram of Duration ⁇ current value. Specifically, it was assumed that the current value and Duration value were distributed according to one bivariate normal distribution for each modification state, and a bivariate mixed Gaussian model was used. As a result, it was shown that the abundance ratio of each modification state was roughly consistent with the result measured by LC/MS (FIG. 14).
- mcm 5 s 2 U was detected with high accuracy in the wild type, U in ⁇ elp3 ⁇ ncs6, and mcm 5 U in ⁇ ncs6.
- " ⁇ " represents the center of the normal distribution, and the circle represents a range twice the standard deviation.
- the analysis method of the present embodiment can detect mcm 5 s 2 U, which is difficult to detect by conventional RNA sequencing, and can also detect mcm 5 U and U, which are contained in trace amounts in the WT strain.
Landscapes
- Chemical & Material Sciences (AREA)
- Life Sciences & Earth Sciences (AREA)
- Organic Chemistry (AREA)
- Health & Medical Sciences (AREA)
- Immunology (AREA)
- General Health & Medical Sciences (AREA)
- Proteomics, Peptides & Aminoacids (AREA)
- Engineering & Computer Science (AREA)
- Physics & Mathematics (AREA)
- Zoology (AREA)
- Wood Science & Technology (AREA)
- Biochemistry (AREA)
- Analytical Chemistry (AREA)
- Biotechnology (AREA)
- Microbiology (AREA)
- Molecular Biology (AREA)
- Bioinformatics & Cheminformatics (AREA)
- General Engineering & Computer Science (AREA)
- Biophysics (AREA)
- Genetics & Genomics (AREA)
- Chemical Kinetics & Catalysis (AREA)
- Electrochemistry (AREA)
- General Physics & Mathematics (AREA)
- Pathology (AREA)
- Measuring Or Testing Involving Enzymes Or Micro-Organisms (AREA)
Priority Applications (2)
| Application Number | Priority Date | Filing Date | Title |
|---|---|---|---|
| JP2025523468A JPWO2024247764A1 (https=) | 2023-05-30 | 2024-05-17 | |
| EP24815248.0A EP4722702A1 (en) | 2023-05-30 | 2024-05-17 | Modification analysis for molecule by signal-based method |
Applications Claiming Priority (2)
| Application Number | Priority Date | Filing Date | Title |
|---|---|---|---|
| JP2023-089095 | 2023-05-30 | ||
| JP2023089095 | 2023-05-30 |
Publications (1)
| Publication Number | Publication Date |
|---|---|
| WO2024247764A1 true WO2024247764A1 (ja) | 2024-12-05 |
Family
ID=93657378
Family Applications (1)
| Application Number | Title | Priority Date | Filing Date |
|---|---|---|---|
| PCT/JP2024/018330 Ceased WO2024247764A1 (ja) | 2023-05-30 | 2024-05-17 | シグナルベース法による分子の修飾分析 |
Country Status (3)
| Country | Link |
|---|---|
| EP (1) | EP4722702A1 (https=) |
| JP (1) | JPWO2024247764A1 (https=) |
| WO (1) | WO2024247764A1 (https=) |
Citations (3)
| Publication number | Priority date | Publication date | Assignee | Title |
|---|---|---|---|---|
| JPH08237436A (ja) * | 1994-10-19 | 1996-09-13 | Fuji Xerox Co Ltd | カラー画像読み取り装置 |
| WO2020218489A1 (ja) * | 2019-04-26 | 2020-10-29 | 国立大学法人大阪大学 | トンネル電流を使用したマイクロrna解析 |
| US20220328135A1 (en) * | 2021-04-12 | 2022-10-13 | The Chinese University Of Hong Kong | Base modification analysis using electrical signals |
-
2024
- 2024-05-17 JP JP2025523468A patent/JPWO2024247764A1/ja active Pending
- 2024-05-17 EP EP24815248.0A patent/EP4722702A1/en active Pending
- 2024-05-17 WO PCT/JP2024/018330 patent/WO2024247764A1/ja not_active Ceased
Patent Citations (3)
| Publication number | Priority date | Publication date | Assignee | Title |
|---|---|---|---|---|
| JPH08237436A (ja) * | 1994-10-19 | 1996-09-13 | Fuji Xerox Co Ltd | カラー画像読み取り装置 |
| WO2020218489A1 (ja) * | 2019-04-26 | 2020-10-29 | 国立大学法人大阪大学 | トンネル電流を使用したマイクロrna解析 |
| US20220328135A1 (en) * | 2021-04-12 | 2022-10-13 | The Chinese University Of Hong Kong | Base modification analysis using electrical signals |
Non-Patent Citations (15)
Also Published As
| Publication number | Publication date |
|---|---|
| JPWO2024247764A1 (https=) | 2024-12-05 |
| EP4722702A1 (en) | 2026-04-08 |
Similar Documents
| Publication | Publication Date | Title |
|---|---|---|
| Aguet et al. | Molecular quantitative trait loci | |
| Xiong et al. | Genetic drivers of m6A methylation in human brain, lung, heart and muscle | |
| Nova et al. | Detection of phosphorylation post-translational modifications along single peptides with nanopores | |
| Xiao et al. | Toward best practice in cancer mutation detection with whole-genome and whole-exome sequencing | |
| Nguyen et al. | Direct identification of A-to-I editing sites with nanopore native RNA sequencing | |
| Thomas et al. | Direct nanopore sequencing of individual full length tRNA strands | |
| Chen et al. | Live-seq enables temporal transcriptomic recording of single cells | |
| Hwang et al. | Single-cell RNA sequencing technologies and bioinformatics pipelines | |
| DK2209893T3 (en) | The use of aptamers in proteomics | |
| IL271235B2 (en) | Validation methods and systems for detecting sequence variants | |
| KR20250005515A (ko) | 임신 중 긴 세포유리 단편을 사용한 분자 분석 | |
| CN107229841B (zh) | 一种基因变异评估方法及系统 | |
| CN106480222B (zh) | 基于悬浮微珠阵列系统检测遗传性耳聋的探针、引物、检测试剂盒及检测方法 | |
| Acera Mateos et al. | Concepts and methods for transcriptome-wide prediction of chemical messenger RNA modifications with machine learning | |
| CN118016159A (zh) | 基于drs的生物遗传样本转录组测序分析方法 | |
| CN118262789A (zh) | RNA m6A修饰检测方法及系统 | |
| EP4481746A1 (en) | Genetic variation analysis method based on nucleic acid sequencing | |
| Cheng et al. | Raw signal segmentation for estimating RNA modification from Nanopore direct RNA sequencing data | |
| CN116246703A (zh) | 一种核酸测序数据的质量评估方法 | |
| WO2024247764A1 (ja) | シグナルベース法による分子の修飾分析 | |
| Chang et al. | Using synthetic RNA to benchmark poly (A) length inference from direct RNA sequencing | |
| CN112599189B (zh) | 一种全基因组测序的数据质量评估方法及其应用 | |
| EP4153777B1 (en) | Nucleic acid sample enrichment and screening methods | |
| Diensthuber et al. | Enhanced detection of RNA modifications and mappability with high-accuracy nanopore RNA basecalling models | |
| Kielpinski et al. | Reproducible analysis of sequencing-based RNA structure probing data with user-friendly tools |
Legal Events
| Date | Code | Title | Description |
|---|---|---|---|
| 121 | Ep: the epo has been informed by wipo that ep was designated in this application |
Ref document number: 24815248 Country of ref document: EP Kind code of ref document: A1 |
|
| ENP | Entry into the national phase |
Ref document number: 2025523468 Country of ref document: JP Kind code of ref document: A |
|
| NENP | Non-entry into the national phase |
Ref country code: DE |
|
| WWE | Wipo information: entry into national phase |
Ref document number: 2024815248 Country of ref document: EP |
|
| ENP | Entry into the national phase |
Ref document number: 2024815248 Country of ref document: EP Effective date: 20260102 |
|
| ENP | Entry into the national phase |
Ref document number: 2024815248 Country of ref document: EP Effective date: 20260102 |
|
| ENP | Entry into the national phase |
Ref document number: 2024815248 Country of ref document: EP Effective date: 20260102 |
|
| ENP | Entry into the national phase |
Ref document number: 2024815248 Country of ref document: EP Effective date: 20260102 |
|
| ENP | Entry into the national phase |
Ref document number: 2024815248 Country of ref document: EP Effective date: 20260102 |
|
| ENP | Entry into the national phase |
Ref document number: 2024815248 Country of ref document: EP Effective date: 20260102 |
|
| WWP | Wipo information: published in national office |
Ref document number: 2024815248 Country of ref document: EP |