WO2024190841A1 - 推定装置、推定方法およびプログラム - Google Patents
推定装置、推定方法およびプログラム Download PDFInfo
- Publication number
- WO2024190841A1 WO2024190841A1 PCT/JP2024/009869 JP2024009869W WO2024190841A1 WO 2024190841 A1 WO2024190841 A1 WO 2024190841A1 JP 2024009869 W JP2024009869 W JP 2024009869W WO 2024190841 A1 WO2024190841 A1 WO 2024190841A1
- Authority
- WO
- WIPO (PCT)
- Prior art keywords
- subject
- dietary
- history
- trained model
- dietary history
- Prior art date
- Legal status (The legal status is an assumption and is not a legal conclusion. Google has not performed a legal analysis and makes no representation as to the accuracy of the status listed.)
- Ceased
Links
Images













Classifications
-
- G—PHYSICS
- G16—INFORMATION AND COMMUNICATION TECHNOLOGY [ICT] SPECIALLY ADAPTED FOR SPECIFIC APPLICATION FIELDS
- G16H—HEALTHCARE INFORMATICS, i.e. INFORMATION AND COMMUNICATION TECHNOLOGY [ICT] SPECIALLY ADAPTED FOR THE HANDLING OR PROCESSING OF MEDICAL OR HEALTHCARE DATA
- G16H20/00—ICT specially adapted for therapies or health-improving plans, e.g. for handling prescriptions, for steering therapy or for monitoring patient compliance
- G16H20/60—ICT specially adapted for therapies or health-improving plans, e.g. for handling prescriptions, for steering therapy or for monitoring patient compliance relating to nutrition control, e.g. diets
-
- G—PHYSICS
- G16—INFORMATION AND COMMUNICATION TECHNOLOGY [ICT] SPECIALLY ADAPTED FOR SPECIFIC APPLICATION FIELDS
- G16H—HEALTHCARE INFORMATICS, i.e. INFORMATION AND COMMUNICATION TECHNOLOGY [ICT] SPECIALLY ADAPTED FOR THE HANDLING OR PROCESSING OF MEDICAL OR HEALTHCARE DATA
- G16H50/00—ICT specially adapted for medical diagnosis, medical simulation or medical data mining; ICT specially adapted for detecting, monitoring or modelling epidemics or pandemics
- G16H50/30—ICT specially adapted for medical diagnosis, medical simulation or medical data mining; ICT specially adapted for detecting, monitoring or modelling epidemics or pandemics for calculating health indices; for individual health risk assessment
Definitions
- the present invention relates to an estimation device, an estimation method, and a program.
- the inventors found that when subjects were classified into specific groups based on their eating habits, there were significant differences in the cognitive function of the subjects in each group.
- the present disclosure aims to provide an estimation device, estimation method, and program that can provide information regarding a subject's cognitive function.
- the estimation device is characterized by having a memory unit that stores a trained model that has been trained to output information regarding which of a plurality of pre-set dietary tendency groups, including a high-grain diet group and a high-protein balanced diet group, the subject belongs to when the subject's dietary history is input, an acquisition unit that acquires the subject's dietary history, and an estimation unit that inputs the acquired dietary history into the trained model to estimate which of the plurality of dietary tendency groups the subject belongs to.
- the subject's dietary history should preferably include the intake of grains, legumes, green and yellow vegetables, other vegetables, seafood, meat, and eggs.
- the subject's dietary history is preferably obtained using the Brief-type Self-administered Diet History Questionnaire (BDHQ).
- BDHQ Brief-type Self-administered Diet History Questionnaire
- the multiple dietary tendency groups preferably consist of two dietary tendency groups: a high-grain diet group and a high-protein balanced diet group.
- the trained model preferably outputs the Mahalanobis distance between the input dietary history and each dietary tendency group based on training data that associates the dietary history of multiple individuals with information indicating which of multiple dietary tendency groups each individual belongs to.
- the training data is preferably generated by applying the k-means method to the dietary histories of multiple individuals and classifying each individual into multiple dietary tendency groups.
- the estimation device further includes an estimation unit that estimates the subject's cognitive function based on the estimation result.
- the estimation device further includes an identification unit that identifies foods recommended for the subject based on the estimation results.
- the estimation method is characterized in that it includes storing a trained model that has been trained to output information regarding which of a plurality of pre-set dietary tendency groups, including a high-grain diet group and a high-protein balanced diet group, the subject belongs to when the subject's dietary history is input, acquiring the subject's dietary history, and inputting the acquired dietary history into the trained model to estimate which of the plurality of dietary tendency groups the subject belongs to.
- the program according to an embodiment of the present disclosure is a computer program that stores a trained model that has been trained to output information regarding which of a plurality of pre-set dietary tendency groups, including a high-grain diet group and a high-protein balanced diet group, the subject belongs to when the subject's dietary history is input, and is characterized in that the program causes the computer to acquire the subject's dietary history and input the acquired dietary history into the trained model, thereby estimating which of the plurality of dietary tendency groups the subject belongs to.
- the estimation device is characterized by having a memory unit that stores a trained model trained to output the cognitive function of a subject when the subject's dietary history is input, an acquisition unit that acquires the subject's dietary history, and an estimation unit that estimates the subject's cognitive function by inputting the acquired dietary history into the trained model.
- the estimation method is characterized in that it includes storing a trained model that has been trained to output the cognitive function of a subject when the subject's dietary history is input, acquiring the subject's dietary history, and inputting the acquired dietary history into the trained model, thereby estimating the subject's cognitive function.
- the program according to an embodiment of the present disclosure is a computer program having a memory unit that stores a trained model that has been trained to output the subject's cognitive function when the subject's dietary history is input, and is characterized in that the program causes the computer to acquire the subject's dietary history and input the acquired dietary history into the trained model, thereby estimating the subject's cognitive function.
- the estimation device is characterized by having a memory unit that stores a trained model trained to output the subject's frailty score when the subject's dietary history is input, an acquisition unit that acquires the subject's dietary history, and an estimation unit that estimates the subject's frailty score by inputting the acquired dietary history into the trained model.
- the estimation method is characterized in that it includes storing a trained model that has been trained to output the subject's frailty score when the subject's dietary history is input, acquiring the subject's dietary history, and inputting the acquired dietary history into the trained model, thereby estimating the subject's frailty score.
- the program according to an embodiment of the present disclosure is a computer program having a memory unit that stores a trained model that has been trained to output a frailty score of a subject when the subject's dietary history is input, and is characterized in that the program causes the computer to acquire the subject's dietary history and input the acquired dietary history into the trained model, thereby estimating the subject's frailty score.
- the estimation device is characterized by having a memory unit that stores a trained model that has been trained to output the muscle mass of a subject when the subject's dietary history is input, an acquisition unit that acquires the subject's dietary history, and an estimation unit that estimates the subject's muscle mass by inputting the acquired dietary history into the trained model.
- the estimation method is characterized in that it includes storing a trained model that has been trained to output the muscle mass of a subject when the subject's dietary history is input, acquiring the subject's dietary history, and inputting the acquired dietary history into the trained model, thereby estimating the muscle mass of the subject.
- the program according to an embodiment of the present disclosure is a computer program having a memory unit that stores a trained model that has been trained to output the muscle mass of a subject when the subject's dietary history is input, and is characterized in that the program causes the computer to acquire the subject's dietary history and input the acquired dietary history into the trained model, thereby estimating the subject's muscle mass.
- the estimation device, estimation method, and program disclosed herein make it possible to provide information regarding the cognitive function of a subject.
- FIG. 2 is a functional block diagram of the estimation device 1.
- 11 is a diagram illustrating an example of the data structure of a diet history table T1.
- FIG. 1 is a schematic diagram for explaining a trained model.
- FIG. 13 is a diagram showing an example of a question screen G1.
- FIG. 13 is a diagram showing an example of a dietary tendency display screen G2.
- FIG. 11 is a flow diagram showing an example of the flow of a generation process.
- FIG. 11 is a sequence diagram showing an example of the flow of an estimation process.
- FIG. 2 is a functional block diagram of the estimation device 2.
- FIG. 13 is a diagram illustrating an example of the data structure of a diet history table T2.
- FIG. 11 is a flow diagram showing an example of the flow of a learning process.
- FIG. 11 is a flow diagram showing an example of the flow of an estimation process.
- 13 is a table showing the relationship between the number of clusters and the sum of squares of distances.
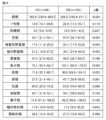
- FIG. 13 shows the median and interquartile range of age, years of education, BMI, and cognitive function measured by the MoCA method for elderly people included in the HC and PB groups in the classification results adopted.
- FIG. 1 shows the median and interquartile range of the intake of each food group for elderly people in the HC and PB groups.
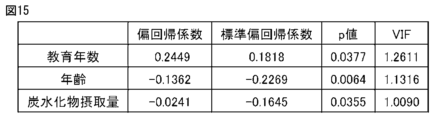
- FIG. 1 shows partial regression coefficients, standard partial regression coefficients, p-values, and VIFs of explanatory variables.
- FIG. 1 shows partial regression coefficients, standard partial regression coefficients, p-values, and VIFs of explanatory variables.
- FIG. 1 shows partial regression coefficients, standard partial regression coefficients, p-values, and VIFs of explanatory variables.
- FIG. 13 is a diagram showing the correlation between frailty score and the HC and PB groups.
- FIG. 13 shows the correlation between muscle mass and the HC and PB groups.
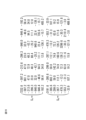
- FIG. 13 is a diagram showing an example of unbiased variance-covariance matrices SA and SB calculated from each data in diet history table T1.
- FIG. 1 shows the median and interquartile range of age, years of education, BMI, and MPI for 267 elderly subjects classified into HC and PB groups.
- FIG. 1 shows the median and interquartile range of age, years of education, BMI, NCI and MPI for 80 elderly subjects classified into HC and PB groups.
- FIG. 13 is a diagram showing the results of performance evaluation of the “trained model” generated as Example 2.
- FIG. 13 is a diagram showing the results of performance evaluation of the “trained model” generated as Example 3.
- FIG. 13 is a diagram showing a configuration of a fourth embodiment.
- FIG. 13 is a diagram showing the results of performance evaluation of the “trained
- First Embodiment 1 is a functional block diagram of an estimation device 1 according to a first embodiment of the present invention.
- the estimation device 1 is an information processing device such as a PC (Personal Computer), a server, a mobile phone, a smartphone, a tablet terminal, a portable game machine, etc.
- the estimation device 1 estimates to which of a plurality of dietary tendency groups a subject belongs based on the subject's dietary history.
- the estimation device 1 has a storage unit 11, a communication unit 12, a display unit 13, an operation unit 14, and a processing unit 15.
- the memory unit 11 is configured to store data and programs, and includes, for example, a semiconductor memory.
- the memory unit 11 stores operating system programs, driver programs, application programs, data, etc., used for processing by the processing unit 15.
- Programs are installed into the memory unit 11 from computer-readable, non-transient portable storage media such as CD-ROM (Compact Disc Read Only Memory) and DVD-ROM (Digital Versatile Disc Read Only Memory).
- the communication unit 12 is configured to enable the estimation device 1 to communicate with other devices, and includes a communication interface circuit.
- the communication interface circuit is a communication interface circuit for a wired LAN (Local Area Network), a wireless LAN, a mobile communication method, or the like.
- the communication unit 12 receives data from other devices and supplies the data to the processing unit 15, and also transmits data supplied from the processing unit 15 to other devices.
- the display unit 13 is configured to display an image, and includes, for example, a liquid crystal display or an organic EL (Electro-Luminescence) display.
- the display unit 13 displays an image based on the display data supplied from the processing unit 15.
- the operation unit 14 is configured to accept operations for the estimation device 1, and includes a keyboard, a keypad, a mouse, etc.
- the operation unit 14 may include a touch panel integrated with the display unit 13.
- the operation unit 14 generates an operation signal according to the accepted operation and supplies it to the processing unit 15.
- the processing unit 15 is a device that controls the overall operation of the estimation device 1, and includes one or more processors and their peripheral circuits.
- the processing unit 15 includes, for example, a CPU (Central Processing Unit).
- the processing unit 15 may also include a GPU (Graphics Processing Unit), a DSP (Digital Signal Processor), an LSI (Large Scale Integration), an ASIC (Application Specific Integrated Circuit), an FPGA (Field Programmable Gate Array), etc.
- the processing unit 15 executes various processes based on the programs stored in the memory unit 11 and inputs from the communication unit 12 and the operation unit 14.
- the processing unit 15 includes, as functional blocks, a first acquisition unit 151, a classification unit 152, a generation unit 153, a second acquisition unit 154, a dietary group estimation unit 155, a cognitive function estimation unit 156, an identification unit 157, and an output unit 158.
- Each of these units is a functional module realized by a program executed by the processing unit 15.
- Each of these units may be implemented in the estimation device 1 as a dedicated processing circuit.
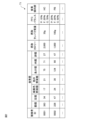
- FIG. 2 is a diagram showing an example of the data structure of the dietary history table T1 stored in the memory unit 11.
- the dietary history table T1 stores the subject IDs, dietary history, calorie intake, protein intake, PFC (Protein-Fat-Carbohydrate) balance, and dietary tendency groups of multiple subjects in association with each other.
- the subject ID is identification information for each of the multiple subjects.
- the dietary history is information indicating the meals the subject ate during a specified period.
- the dietary history indicates the intake of multiple food groups during a specified period.
- the multiple food groups are seven food groups: grains, beans, green and yellow vegetables, other vegetables, seafood, meat, and eggs.
- the intake is shown, for example, as the amount of calorie intake attributable to each food group relative to a specified amount of calorie intake.
- the intake is the amount of calorie intake attributable to each food group per 1,000 kcal of the subject's calorie intake.
- the calorie intake, protein intake, and PFC balance are the average values of the subject's calorie intake, protein intake, and PFC balance per day.
- the dietary tendency group is information indicating which of multiple pre-set dietary tendency groups the subject belongs to.
- information is stored indicating whether the subject belongs to the high cereal diet group (HC (High Cereal) group) or the high protein balanced diet group (PB (Protein Balance) group) as a dietary tendency group.
- HC High Cereal
- PB Protein Balance
- the HC group is a group that, among the intakes of grains, beans, green and yellow vegetables, other vegetables, seafood, meat, and eggs, only the intake of grains is high.
- the PB group is a group that, among the intakes of grains, beans, green and yellow vegetables, other vegetables, seafood, meat, and eggs, the intake of beans, green and yellow vegetables, other vegetables, seafood, meat, and eggs is high.
- the PB group is a group that consumes a variety of foods, and subjects belonging to the PB group have a relatively low intake of grains and a relatively high intake of beans, meat, seafood, and eggs, resulting in a high intake of protein.
- Each data in the dietary history table T1 is generated by a generation process executed by the estimation device 1 and stored in the memory unit 11 of the estimation device 1.
- FIG. 3 is a schematic diagram for explaining an overview of the trained model stored in the memory unit 11.
- the trained model is a program that, when the subject's dietary history is input, outputs information regarding which of multiple eating tendency groups the subject belongs to based on training data.
- the training data is information that associates the dietary histories of multiple individuals with information indicating which of multiple eating tendency groups each individual belongs to, such as the above-mentioned dietary history table T1.
- the trained model calculates and outputs the Mahalanobis distance between the subject's dietary history and each eating tendency group as information regarding which of multiple eating tendency groups the subject belongs to.
- the dietary history included in the teacher data is plotted with black circles.
- the x1 axis indicates the intake of grains
- the x2 axis indicates the intake of beans.
- the dietary history in the dietary history data shown in FIG. 2 is seven-dimensional data indicating the intake of seven food groups, namely grains, beans, green and yellow vegetables, other vegetables, seafood, meat, and eggs, during a specified period.
- FIG. 3 only the intake of grains and beans is shown, and the intake of other food groups is omitted.
- each dietary history is associated with information indicating whether it belongs to the HC group or the PB group.
- FIG. 3 the dietary history included in the teacher data is plotted with black circles.
- the x1 axis indicates the intake of grains
- the x2 axis indicates the intake of beans.
- the dietary history in the dietary history data shown in FIG. 2 is seven-dimensional data indicating the intake of seven food groups, namely grains, beans, green and yellow vegetables, other vegetables, seafood, meat
- the dietary history of a person belonging to the HC group is surrounded by a dashed circle HC
- the dietary history of a person belonging to the PB group is surrounded by a dashed circle PB.
- the dashed circles HC and PB show the distribution of dietary histories belonging to the HC group and the PB group.
- the average value m of the dietary history belonging to the HC group and the average value n of the dietary history belonging to the PB group are calculated in advance.
- the unbiased variance-covariance matrix SA of the dietary history belonging to the HC group and the unbiased variance-covariance matrix SB of the dietary history belonging to the PB group are calculated in advance using the average values m and n.
- the "trained model" can be defined as "D1-D2".
- the Mahalanobis distance D1 between the subject's dietary history x and the HC group and the Mahalanobis distance D2 between the dietary history x and the PB group can be expressed as follows using the calculated m and n and the unbiased variance-covariance matrices SA and SB. Note that T indicates a transposed matrix.
- the Mahalanobis distance can be considered to be a value obtained by normalizing the Euclidean distance between unknown data and known data based on the spread of the distribution of the known data.
- the Euclidean distance in the x1-x2 space between the subject's dietary history x and the average value m of the dietary history belonging to the HC group is smaller than the Euclidean distance between the subject's dietary history x and the average value n of the dietary history belonging to the PB group.
- the direction from the average value m of the HC group to the subject's dietary history x is approximately the minor axis direction of the dashed circle HC, which is the direction in which the spread of the distribution of the HC group is small.
- the direction from the average value n of the PB group to the subject's dietary history x is approximately the major axis direction of the dashed circle PB, which is the direction in which the spread of the distribution of the PB group is large. Therefore, the Mahalanobis distance D1 between the subject's dietary history x and the HC group is calculated to be smaller than the Mahalanobis distance D2 between the dietary history x and the PB group.
- the density of the wavy lines indicates that the Mahalanobis distance D1 is greater than the Mahalanobis distance D2 (D1-D2>0).
- FIG. 4 shows an example of a question screen G1 displayed on the display unit 13 to obtain a dietary history.
- the question screen G1 is a screen for accepting input of the intake amounts of multiple foods over a specified period of time as information about the subject's dietary history. In the example shown in FIG. 4, the question screen G1 accepts input of the number of times multiple foods are consumed in a week.
- the subject's dietary history is calculated by inputting the intake amount of each food entered on question screen G1 into a specified dietary history calculation program.
- the dietary history calculation program is a program that outputs a dietary history corresponding to the intake amount of each food entered by applying a specified formula to the number of times each food was consumed entered on question screen G1.
- FIG. 5 is a diagram showing an example of the dietary tendency output screen G2 displayed on the display unit 13.
- the dietary tendency output screen G2 is a screen for outputting the result of estimation of which dietary tendency group the subject belongs to.
- the dietary tendency output screen G2 includes an estimation result display area G21, a cognitive function estimation area G22, and a food presentation area G23.
- the estimated result display area G21 is an area that displays the result of the estimation of which of a plurality of dietary tendency groups the subject belongs to. In the example shown in FIG. 5, it is shown that the subject belongs to the HC group out of the HC group and the PB group.
- the cognitive function estimation area G22 is an area that displays the cognitive function of the subject estimated based on the estimation result. In the example shown in FIG. 5, it is shown that the cognitive function of the subject may be deteriorated. Not limited to such an example, the cognitive function estimation area G22 may output an estimated value of an index indicating the cognitive function of the subject.
- the index indicating the cognitive function may be a numerical value obtained by various cognitive function tests, for example, the NCI (Neurocognition Index) obtained by Cognitrax.
- the cognitive function estimation area G22 displays the protein intake of the subject and the protein deficit of the subject.
- the protein intake of the subject is a value stored in the dietary history table T1
- the protein deficit of the subject is a value obtained by subtracting the protein intake from the protein requirement of the subject.
- the protein requirement is, for example, a value based on the "Dietary Reference Intakes for Japanese" established by the Ministry of Health, Labor and Welfare.
- the food presentation area G23 is an area that presents foods recommended to the subject based on the results of the estimation. For example, if the subject belongs to the HC group, foods that are high in protein that is thought to be lacking in the subject are presented.
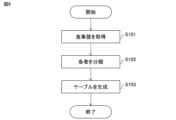
- FIG. 6 is a flow diagram showing an example of the flow of the generation process executed by the estimation device 1.
- the generation process is a process for generating the meal history table T1.
- the estimation process is realized by the processing unit 15 cooperating with other components of the estimation device 1 based on a program.
- the first acquisition unit 151 acquires the dietary histories of multiple individuals (step S101). For example, the first acquisition unit 151 acquires the dietary histories of multiple individuals that are stored in advance in the storage unit 11 in order to generate the dietary history table T1.
- the classification unit 152 classifies each of the multiple individuals into one of multiple dietary tendency groups based on the dietary histories of the multiple individuals (step S102). For example, the classification unit 152 applies the k-means algorithm to the dietary histories of the multiple individuals to classify each of the individuals into two clusters. Of the two clusters, the classification unit 152 classifies the cluster that consumes a lot of grains as the HC group, and the other cluster as the PB group.
- the generation unit 153 generates a dietary history table T1 by associating the dietary histories of multiple individuals with the dietary tendency groups into which each individual has been classified (step S103).
- the generation unit 153 stores the generated dietary history table T1 in the storage unit 11. This completes the generation process.
- FIG. 7 is a flow diagram showing an example of the flow of the estimation process executed by the estimation device 1.
- the estimation process is a process for estimating to which of a plurality of eating tendency groups the subject belongs based on the subject's dietary history.
- the estimation process is executed in a state where the dietary history table T1 is stored in the memory unit 11 of the estimation device 1.
- the estimation process is realized by the processing unit 15 working in cooperation with other components of the estimation device 1 based on a program.
- the second acquisition unit 154 of the estimation device 1 acquires the subject's dietary history, calorie intake, protein intake, and PFC balance (step S201). For example, the second acquisition unit 154 displays a question screen G1 on the display unit 13 and accepts input of the intake amounts of multiple foods over a specified period of time. The second acquisition unit 154 inputs the intake amounts of each food input into the question screen G1 into a specified dietary history calculation program, and acquires the subject's dietary history, calorie intake, protein intake, and PFC balance output from the dietary history calculation program.
- the dietary group estimation unit 155 then inputs the acquired dietary history into the previously described "trained model” to estimate which of multiple dietary tendency groups the subject belongs to (step S202).
- the dietary group estimation unit 155 inputs the acquired dietary history into the previously described "trained model” to obtain "D1-D2", and estimates that if D1-D2 ⁇ 0, the subject belongs to the HC group, and if D1-D2 ⁇ 0, the subject belongs to the PB group.
- the cognitive function estimation unit 156 estimates the cognitive function of the subject based on the estimation result (step S203). For example, if the subject belongs to the HC group, the cognitive function estimation unit 156 estimates that the subject's cognitive function may be impaired, and if the subject belongs to the PB group, the cognitive function estimation unit 156 estimates that the subject's cognitive function is normal. The cognitive function estimation unit 156 may estimate the subject's cognitive function based on the Mahalanobis distance between the subject's dietary history.
- the identification unit 157 identifies foods recommended for the subject based on the results of the estimation by the dietary group estimation unit 155 (step S204). For example, if the subject belongs to the HC group, the identification unit 157 obtains the subject's protein intake from the dietary history table T1. The identification unit 157 calculates the subject's protein deficiency by subtracting the subject's protein intake from the subject's predetermined protein requirement. The identification unit 157 identifies foods based on multiple foods and the amount of protein contained in each food that are stored in advance in the storage unit 11. For example, the identification unit 157 identifies one or more foods such that the total value of protein contained in the identified foods exceeds the subject's protein deficiency.
- the identification unit 157 may identify foods recommended to the subject if the subject belongs to the PB group.
- the identification unit 157 may also identify foods recommended to the subject based on the subject's dietary history.
- the output unit 158 outputs the results of the estimation by the dietary group estimation unit 155 and/or the cognitive function estimation unit 156 (step S205).
- the output unit 158 outputs the results of the estimation by displaying, on the display unit 13, a dietary tendency output screen G2 including the estimated dietary group, the estimated cognitive function, and the identified foods. This completes the estimation process.
- the estimation device 1 estimates whether the subject belongs to the HC group or the PB group by inputting the subject's dietary history into a trained model. In this way, the estimation device 1 can provide information on the subject's cognitive function, i.e., to which of multiple eating tendency groups the subject belongs. As will be described later, since there are significant differences in cognitive function between multiple eating tendency groups, the estimation device 1 can estimate the subject's cognitive function based on the dietary history.
- the trained model also calculates the Mahalanobis distance between the subject's dietary history and each of the multiple dietary tendency groups based on training data that associates the dietary histories of multiple individuals with information indicating which of the multiple dietary tendency groups each individual belongs to. This enables the estimation device 1 to appropriately estimate the subject's dietary tendency group based on the dietary histories and dietary tendency groups of multiple individuals.
- the classification unit 152 classifies multiple individuals into the HC group and the PB group, but this is not limited to an example.
- the classification unit 152 may classify multiple individuals into three or more eating tendency groups.
- the classification unit 152 may classify multiple individuals into three clusters: the HC group, the PB group, and an intermediate group indicating individuals with an intermediate eating history between the two groups.
- the dietary group estimation unit 155 estimates which of the three or more eating tendency groups the subject belongs to.
- the second acquisition unit 154 displays the question screen G1 to accept input of the food intake amount, but this is not limited to an example.
- the second acquisition unit 154 may acquire the food intake amount based on a questionnaire filled out by the subject.
- the second acquisition unit 154 acquires the food intake amount by acquiring information filled out on the questionnaire from a scanner having an OCR (Optical Character Recognition) function via the communication unit 12.
- OCR Optical Character Recognition
- the second acquisition unit 154 may acquire data on the food intake amount based on the questionnaire filled out by the subject via an operator's operation of the operation unit 14.
- the second acquisition unit 154 may also acquire the dietary contents of each meal as the subject's dietary history.
- the dietary contents may be, for example, the name of the dish, the names of the ingredients or foods used in the dish, the calories of the dish, etc.
- the dietary contents may be photographed images of the dish.
- the second acquisition unit 154 acquires the dietary contents of each meal by displaying an input screen on the display unit 13 for the subject to input the dietary contents.
- the second acquisition unit 154 may acquire data indicating the dietary contents of each meal from the subject's communication terminal via the communication unit 12.
- the second acquisition unit 154 converts the acquired dietary contents into the subject's dietary history by inputting them into a conversion program stored in advance. This reduces the burden on the subject of inputting food intake, etc., when the subject has stored the dietary contents of each meal in the communication terminal.
- the "trained model” used in step S202 of the estimation process is a program that calculates "D1-D2", but this is not limited to this example.
- the trained model may be a decision tree.
- the decision tree is generated by a learning algorithm such as CART (Classification and Regression Trees) or C4.5 using training data in which the dietary history of multiple people is associated with information indicating which of multiple dietary tendency groups each person belongs to.
- CART Classification and Regression Trees
- C4.5 C4.5
- the BDHQ is used to obtain the dietary history of a subject, it takes about 15 minutes to answer the BDHQ questionnaire, which can increase the burden on the subject.
- the subject can answer only the questions necessary for classification by the decision tree, reducing the burden on the subject.
- the estimation process using a trained model that is a decision tree is easier to understand than the calculation process of the Mahalanobis distance, making it easier for caregivers to give dietary advice to the subject.
- the cognitive function estimation unit 156 estimates the cognitive function of the subject, but this is not limited to the example.
- the cognitive function estimation unit 156 may estimate the state or possibility of onset of frailty, locomotor syndrome, sarcopenia, circulatory or respiratory disease, metabolic syndrome due to hyperglycemia or dyslipidemia, depression, sleep disorder, etc. In this way, a lot of information for maintaining the health of the subject is estimated based on the dietary history.
- the output unit 158 displays the dietary tendency output screen G2 including the estimated information.
- the cognitive function estimation unit 156 estimates the cognitive function of the subject based on the estimation result, but this is not limited to the example.
- the cognitive function estimation unit 156 may estimate the cognitive function of the subject based on the dietary history of the subject. For example, the cognitive function estimation unit 156 estimates the cognitive function of the subject using a trained model that has been trained to output an index indicating cognitive function when a dietary history is input.
- the trained model is, for example, a regression model, a decision tree, etc., and is trained using teacher data in which the dietary history of multiple people is associated with an index indicating each person's cognitive function. In this way, the cognitive function of the subject can be estimated with higher accuracy.
- the cognitive function estimation unit 156 may also estimate the cognitive function of the subject based on attribute information of the subject.
- the attribute information is, for example, age, sex, years of education, BMI (Body Mass Index), etc.
- the cognitive function estimation unit 156 may also estimate the subject's cognitive function based only on the amount of grain intake from the subject's dietary history. Because grains contain a lot of carbohydrates, it is believed that the amount of grain intake has a significant effect on cognitive function. Therefore, by estimating the subject's cognitive function based on the amount of grain intake, it is possible to estimate the subject's cognitive function simply and with high accuracy. Note that instead of the amount of grain intake, the amount of carbohydrate intake calculated from the dietary history may be used.
- the identification unit 157 identifies foods recommended to the subject based on the results of the estimation in step S204 of the estimation process, but this is not limited to an example.
- the identification unit 157 may identify foods recommended to the subject based on the subject's dietary history.
- the identification unit 157 estimates the subject's cognitive function using a trained model that has been trained to output foods when a dietary history is input.
- the trained model is trained using training data that associates the dietary histories of multiple people with foods recommended to each person. In this way, it is possible to more appropriately identify foods recommended to the subject.
- the dietary tendency output screen G2 output by the output unit 158 in step S205 of the estimation process displays the subject's protein intake and protein deficiency, but this is not limited to an example.
- the dietary tendency output screen G2 may also display the subject's calorie intake stored in the dietary history table T1. In this case, the dietary tendency output screen G2 may further display whether the subject's calorie intake is more than the standard amount, appropriate, or less than the standard amount.
- the standard amount is, for example, a value based on the "Dietary Reference Intakes for Japanese" established by the Ministry of Health, Labor and Welfare.
- steps S203 and S204 may be omitted.
- the dietary tendency output screen G2 output by the output unit 158 may not include one or both of the cognitive function estimation area G22 and the food presentation area G23.
- the functions of the estimation device 1 described above may be realized by multiple devices.
- the functions of the estimation device 1 may be realized by a server and a communication terminal of the subject that communicate with each other.
- the server instead of displaying a screen on the display unit, the server transmits display data for displaying the screen to the communication terminal, and causes the communication terminal to display the screen.
- the display data is, for example, HTML (Hyper Text Markup Language) data.
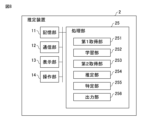
- Second Embodiment 8 is a functional block diagram of an estimation device 2 according to a second embodiment of the present invention. While the estimation device 1 estimates which eating tendency group the subject belongs to and estimates the subject's cognitive function based on the estimation result, the estimation device 2 estimates the subject's cognitive function based on the subject's dietary history without estimating which eating tendency group the subject belongs to.
- the estimation device 2 differs from the estimation device 1 in that it has a processing device 25 instead of the processing device 15.
- Other configurations of the estimation device 2 are similar to the corresponding configurations of the estimation device 1, so the same reference numerals are used and the description is omitted.
- the processing unit 25 is a device that controls the overall operation of the estimation device 2, and includes one or more processors and their peripheral circuits.
- the processing unit 25 includes, for example, a CPU.
- the processing unit 25 may also include a GPU, DSP, LSI, ASIC, FPGA, etc.
- the processing unit 25 executes various processes based on the programs stored in the memory unit 11 and inputs from the communication unit 12 and the operation unit 14.
- the processing unit 25 has a first acquisition unit 251, a learning unit 252, a second acquisition unit 253, an estimation unit 254, an identification unit 255, and an output unit 256 as functional blocks. Each of these units is a functional module realized by a program executed by the processing unit 25. Each of these units may be implemented in the estimation device 2 as a dedicated processing circuit.
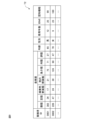
- the dietary history table T2 stores the subject ID, dietary history, age, sex, years of education, BMI (Body Mass Index), cognitive function, etc. in association with each other.
- the dietary history is the intake of multiple food groups.
- the food groups for which the intake is stored are, for example, seven food groups: grains, beans, green and yellow vegetables, other vegetables, seafood, meat, and eggs.
- the age, sex, years of education, and BMI are examples of attribute information of the subject.
- the cognitive function is an index that indicates the cognitive function of each person, and may be a numerical value obtained by various cognitive function tests.
- the cognitive function may be the MPI (Memory Performance Index) from Atama no Kenkou Check (registered trademark) or the NCI (Neurocognition Index) from Cognitrax.
- the MPI is an index for measuring memory function, which is one of the cognitive functions.
- FIG. 10 is a flow diagram showing an example of the flow of the learning process executed by the estimation device 2.
- the learning process is a process for generating a trained model used to estimate the cognitive function of the subject.
- the learning process is executed in a state where the dietary history table T2 is stored in the storage unit 11.
- the learning process is realized by the processing unit 25 cooperating with other components of the estimation device 2 based on a program.
- the first acquisition unit 251 of the estimation device 2 acquires the dietary history, age, sex, years of education, BMI, and cognitive function of multiple individuals as teacher data from the dietary history table T2 (step S301).
- the learning unit 252 uses the acquired teacher data to train the learning model to output the cognitive function of the subject when the subject's dietary history, age, sex, years of education, and BMI are input, thereby generating a trained model (step S302).
- the learning model is, for example, a neural network.
- the learning unit 252 trains the learning model by updating the parameters of the learning model so that the error between the output of the trained model and the cognitive function of each person when the dietary history, age, sex, years of education, and BMI of multiple people are input to the trained model is reduced.
- the error is, for example, a mean square error.
- the error may be the square root of the mean square error, the mean square logarithmic error, a percentage error, etc.
- the parameters are updated by a gradient descent method, such as the steepest descent method or the stochastic gradient descent method.
- the learning unit 252 stores the generated trained model in the storage unit 11. This completes the learning process.
- the “trained model” in the second embodiment may be generated in advance and stored in the storage unit 11.
- the estimation device 2 does not necessarily have to have the learning unit 253.
- the “trained model” in the second embodiment may be stored in an external device (e.g., a server) other than the estimation device 2, and may be configured to be available by accessing the external device from the estimation device 2.
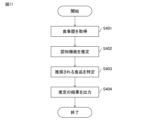
- FIG. 11 is a flow diagram showing an example of the flow of the estimation process executed by the estimation device 2.
- the estimation process is a process for estimating the cognitive function of a subject.
- the estimation process is executed in a state where a trained model that has been trained to output the cognitive function of a subject when the subject's dietary history, age, sex, years of education, and BMI are input is stored in the memory unit 11.
- the learning process is realized by the processing unit 25 working in cooperation with other components of the estimation device 2 based on a program.
- the second acquisition unit 253 of the estimation device 2 acquires the subject's dietary history, age, sex, years of education, and BMI (step S401). For example, the second acquisition unit 253 acquires the subject's dietary history in the same manner as step S201 of the estimation process. In addition, the second acquisition unit 253 displays a screen (not shown) on the display unit 13 for the subject to input their age, sex, years of education, and BMI, and acquires the subject's age, sex, years of education, and BMI by accepting the input of the age, sex, years of education, and BMI.
- the estimation unit 254 estimates the subject's cognitive function by inputting the subject's dietary history, age, sex, years of education, and BMI into the trained model (step S402).
- the estimation unit 254 estimates the subject's cognitive function by inputting the subject's dietary history, age, sex, years of education, and BMI into the trained model.
- the identification unit 255 identifies foods recommended for the subject (step S403).
- the identification unit 255 identifies foods recommended for the subject in the same manner as when the subject belongs to the HC group in step S204 of the estimation process.
- the output unit 256 outputs the result of the estimation (step S404).
- the output unit 256 outputs the result of the estimation by displaying a screen including the estimated cognitive function of the subject and foods recommended for the identified subject on the display unit 13. This completes the estimation process.
- the estimation device 2 estimates the cognitive function of a subject using a trained model that has been trained to output the cognitive function of the subject when the subject's dietary history, age, sex, years of education, and BMI are input.
- a trained model that has been trained to output the cognitive function of the subject when the subject's dietary history, age, sex, years of education, and BMI are input.
- there is a certain correlation between the subject's dietary history and cognitive function because there are significant differences in cognitive function between multiple dietary tendency groups.
- the estimation device 2 makes it possible to estimate the subject's cognitive function with high accuracy and provide information on the subject's cognitive function.
- the trained model is trained to output the subject's cognitive function when the subject's dietary history, age, sex, years of education, and BMI are input, but this is not limited to an example.
- the trained model may input only some of the subject's dietary history, age, sex, years of education, and BMI.
- the trained model may be trained to output the subject's cognitive function when the subject's dietary history is input. Since there is a certain correlation between the subject's dietary history and cognitive function, in this case as well, it is possible to estimate the subject's cognitive function.
- the subject's dietary history input to the trained model is the intake of seven food groups, but this is not limited to this example, and the subject's dietary history may be the intake of more than seven food groups, or may be the intake of fewer food groups.
- the subject's dietary history may be the intake of fifteen food groups, including grains, potatoes, sugars, beans, green and yellow vegetables, other vegetables, fruits, seafood, meat, eggs, dairy products, oils and fats, confectioneries, favorite beverages, and seasonings. In this way, the subject's cognitive function can be estimated.
- the subject's dietary history may also be the intake of some of the seven food groups.
- the classification of food groups is not limited to the above-mentioned examples, and may be more detailed or larger. For example, instead of a classification of meats, classifications such as chicken, pork, beef, and other meats may be used.
- the food group intake is the amount of calories ingested from each food group relative to a given amount of calories ingested, but this is not limited to this example.
- the food group intake may also be the weight of food belonging to each food group ingested by the subject during a given period of time. This eliminates the need to use a complex intake calculation program to calculate the food group intake, making it possible to easily estimate the subject's cognitive function.
- the surveyed dietary history was classified into multiple clusters using the k-means method.
- the sum of squares of the distances between the centroids of multiple clusters and each point contained in each cluster was calculated.
- Figure 12 shows the relationship between the number of clusters and the sum of squares of the distances. According to Figure 12, the decrease in the sum of squares of the distances was the largest when the number of clusters was increased from 1 to 2, so the number of clusters was determined to be 2.
- the cluster with the highest grain intake was designated the HC group, and the other cluster was designated the PB group.
- Classification using the k-means method was performed multiple times with different initial values, and the classification result that showed the largest difference in cognitive function between the elderly people in the HC group and the PB group was adopted.
- Figure 13 shows the median and interquartile range of age, years of education, BMI, and cognitive function measured by the MoCA method for the elderly people in the HC group and the PB group in the adopted classification result.
- the p-value showing the difference in cognitive function between the elderly people in the HC group and the elderly people in the PB group was 0.031, and there was a significant difference in cognitive function between the elderly people in both groups.
- Figure 14 shows the median and interquartile range of the intake of each food group for elderly people in the HC and PB groups.
- the p-value showing the difference in intake of grains, beans, green and yellow vegetables, other vegetables, seafood, meat, and eggs between the elderly people in the HC group and the elderly people in the PB group was less than 0.001, indicating a significant difference in the intake of these food groups. Therefore, it was confirmed that there is a correlation between the intake of these seven food groups and whether the subject belongs to the HC group or the PB group. It was also confirmed that there is a correlation between the intake of these seven food groups and the cognitive function of the subjects.
- Fig. 15 is a diagram showing the partial regression coefficient, standard partial regression coefficient, p-value, and VIF (Variance Inflation Factor) of each explanatory variable obtained by multiple regression analysis for 150 elderly people.
- the data on 150 elderly people was used in Example 1, and was subjected to multiple regression analysis using the stepwise method with the elderly people's MPI as the objective variable, and the intake of the four major nutrients of carbohydrates, proteins, lipids, and ash, sex, age, years of education, and BMI as the explanatory variables.
- Fig. 15 shows only explanatory variables that are significant with respect to the objective variable among the explanatory variables.
- Figure 16 shows the partial regression coefficients, standard partial regression coefficients, p-values, and VIFs for each explanatory variable obtained by multiple regression analysis of 267 elderly people.
- the data on the 267 elderly people was used in Evaluation 1 of Example 1, and was subjected to multiple regression analysis using the stepwise method, with the elderly people's MPI as the objective variable and the intake of the four major nutrients (carbohydrates, protein, lipids, and ash), gender, age, years of education, and BMI as explanatory variables.
- Figure 16 shows only the explanatory variables that showed significance with respect to the objective variable.
- Fig. 17 is a diagram showing the partial regression coefficient, standard partial regression coefficient, p-value, and VIF of each explanatory variable obtained by multiple regression analysis for 385 elderly people.
- the frailty score of the elderly person was used as the objective variable, and the dietary pattern (HC group or PB group), sex, and age were used as the explanatory variables, and multiple regression analysis was performed using the stepwise method.
- Fig. 17 shows only explanatory variables that showed significance with respect to the objective variable among the explanatory variables.
- FIG. 18 is a diagram showing partial regression coefficients, standard partial regression coefficients, p-values, and VIFs of each explanatory variable obtained by multiple regression analysis of 385 elderly people.
- the stepwise multiple regression analysis was performed with the muscle mass of the elderly people as the objective variable, and dietary patterns (HC group or PB group), sex, and age as the explanatory variables.
- FIG. 18 shows only explanatory variables that show significance with respect to the objective variable among the explanatory variables.
- muscle mass (SMI: skeletal muscle index) is the value obtained by dividing the sum of the limb muscle mass by the square of height (m).
- the second embodiment it is possible to configure a trained model that is configured with a neural network or the like and that has been trained to output the muscle mass of a subject when the dietary history of the subject is input.
- a trained model that is configured with a neural network or the like and that has been trained to output the muscle mass of a subject when the dietary history of the subject is input.
- Example 1 the dietary history input to the "trained model" according to the first embodiment was seven types of food: grains, beans, green and yellow vegetables, other vegetables, seafood, meat, and eggs.
- the values of the average energy intake per 1000 kcal of grains, beans, green and yellow vegetables, other vegetables, seafood, meat, and eggs in the sample X to be estimated were x1, x2, x3, x4, x5, x6, and x7, respectively.
- the intake of seven food groups: grains, beans, green and yellow vegetables, other vegetables, seafood, meat, and eggs, of 150 elderly people was investigated using the BDHQ method.
- whether the 150 elderly people belonged to the HC group or the PB group was estimated using the k-means method.
- a dietary history table T1 was created based on the dietary history of the 150 elderly people and data indicating whether each elderly person belonged to the HC group or the PB group.
- the meal history table T1 serves as training data for the "trained model" according to the first embodiment.
- n1 224.3
- n2 53.2
- n3 26.1
- n4 32.0
- n5 132.0
- D1 2 (x1-m1, x2-m2, x3-m3, x4-m4, x5-m5, x6-m6, x7-m7) ⁇ SA -1 ⁇ (x1-m1, x2-m2, x3-m3, x4-m4, x5-m5, x6-m6, x7-m7) T ... (1)
- FIG. 19 is a diagram showing an example of the unbiased variance-covariance matrices SA and SB calculated from each data in the above dietary history table T1.
- a "trained model” was generated, which is a program that calculates "D1-D2" from the values (x1, x2, x3, x4, x5, x6, x7) of the average energy intake per 1000 kcal of grains, beans, green and yellow vegetables, other vegetables, seafood, meat, and eggs in the sample X to be estimated.
- Figure 20 shows the age, years of education, BMI, and median and interquartile range of MPI for 267 elderly people classified into the HC group and the PB group.
- the p-value showing the difference in MPI between the general elderly people in the HC group and the elderly people in the PB group was 0.026, and there was a significant difference in memory function between the elderly people in both groups.
- Example 1 it was confirmed that it is possible to use the "trained model" generated in Example 1 to estimate which of multiple dietary tendency groups with significant differences in memory function a subject belongs to based on the subject's dietary history.
- Figure 21 shows the median and interquartile range of age, years of education, BMI, NCI, and MPI for 80 elderly people classified into the HC group and the PB group.
- the p-value showing the difference in NCI between the elderly people in the HC group and the elderly people in the PB group was 0.016, and there was a significant difference in cognitive function between the elderly people in both groups.
- the p-value showing the difference in MPI between the elderly people in the HC group and the elderly people in the PB group was 0.016, and there was a significant difference in memory function between the elderly people in both groups.
- Example 1 it was confirmed that it is possible to use the "trained model" generated in Example 1 to estimate which of multiple dietary tendency groups with significant differences in cognitive and memory function a subject belongs to based on the subject's dietary history.
- Example 2 a "trained model" according to the second embodiment was constructed using a neural network.
- the neural network had an input layer, a batch normalization layer, a hidden layer, and an output layer, and the hidden layer included seven fully connected layers, each having 300 nodes.
- the activation function of each node was the ReLU function.
- batch normalization was performed in each of the fully connected layers included in the hidden layer.
- the neural network was trained 100 times using 70% of the data of the 267 elderly people used in Evaluation 1 of Example 1 as training data. The training was performed so that the squared error between the neural network output and cognitive function was small, and a trained model was generated using the neural network. That is, the inputs of the "trained model" are the average energy intake per 1000 kcal of grains, beans, green and yellow vegetables, other vegetables, seafood, meat, and eggs in sample X to be estimated, as well as age, sex, years of education, and BMI (x1, x2, x3, x4, x5, x6, x7, x8, x9, x10, x11), and the output is the MPI value (0 to 100) indicating the cognitive function corresponding to sample X.
- the inputs of the "trained model” are the average energy intake per 1000 kcal of grains, beans, green and yellow vegetables, other vegetables, seafood, meat, and eggs in sample X to be estimated, as well as age, sex, years of education, and BMI
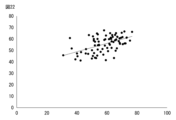
- Figure 22 shows the results of performance evaluation of the "trained model” generated as Example 2.
- the horizontal axis of the graph in Figure 22 is MPI, which indicates pre-measured cognitive function, and the vertical axis is the output of the "trained model".
- the Spearman's rank correlation coefficient between the MPI and the output of the "trained model” is 0.50, and the p-value is less than 0.001. Therefore, it was confirmed that when the "trained model” generated as Example 2 is used, it is possible to estimate the cognitive function of a subject using the intake values of seven food groups, as well as age, sex, years of education, and BMI as input.
- Example 3 the "trained model" according to the second embodiment was constructed using a neural network.
- the neural network was configured to have the same configuration as in Example 3.
- the neural network was trained 100 times using 70% of the data of the 267 elderly people used in Evaluation 1 of Example 1 as training data.
- the training was performed so as to minimize the squared error between the neural network output and cognitive function, and a trained model was generated using the neural network. That is, the inputs of the "trained model" are the average energy intake per 1000 kcal of chicken, beef, pork, fish, rice, and bread in sample X to be estimated, as well as age, sex, years of education, and BMI (x1, x2, x3, x4, x5, x6, x7, x8, x9), and the output is the MPI value (0 to 100) indicating the cognitive function corresponding to sample X.
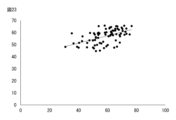
- Figure 23 shows the results of performance evaluation of the "trained model” generated as Example 3.
- the horizontal axis of the graph in Figure 23 is MPI, which indicates cognitive function measured in advance, and the vertical axis is the output of the "trained model”.
- the Spearman's rank correlation coefficient between the MPI and the output of the "trained model” is 0.52, and the p-value is less than 0.001. Therefore, when using the "trained model” generated as Example 3, it was confirmed that it is possible to estimate the cognitive function of the subject even when a trained model trained using the intake of fewer than seven food groups is used. It was also confirmed that it is possible to estimate the cognitive function of the subject even when the weight of food belonging to each food group ingested by the subject during a specified period is used as the intake of the food group.
- Example 4 the "trained model" according to the second embodiment was constructed using a neural network.
- FIG. 24 shows the constructed neural network 30.
- the neural network 30 had an input layer 31, a batch normalization layer 32, an intermediate layer 33, and an output layer 34, and the intermediate layer 33 included 10 fully connected layers, each having 300 nodes.
- the activation function of each node was the ReLU function.
- batch normalization was performed in each of the fully connected layers included in the intermediate layer 33.
- the above neural network was trained 100 times using 218 of the 385 elderly people's data used in the evaluation of (correlation between frailty and the HC and PB groups) and (correlation between muscle mass and the HC and PB groups) in Example 1 as training data.
- the training was performed so as to minimize the squared error between the neural network output and cognitive function, and a trained model was generated using the above neural network.
- the inputs to the "trained model” are the average intake values per 1000 kcal of animal protein, plant protein, carbohydrates, sodium, potassium, calcium, magnesium, retinol equivalent, vitamin D, vitamin K, vitamin C, saturated fatty acids, monounsaturated fatty acids, polyunsaturated fatty acids, cholesterol, soluble dietary fiber, insoluble dietary fiber, and sucrose for the sample X to be estimated, as well as age, sex, years of education, and BMI (x1, x2, x3, x4, x5, x6, x7, x8, x9, x10, x11, x12, x13, x14, x15, x16, x17, x18, x19, x20, x21, x22), and the output is the MPI value (0 to 100) indicating the cognitive function corresponding to the sample X.
- Example 4 The performance of the "trained model” generated in Example 4 was evaluated using 74 of the 385 elderly people's data as evaluation data.
- Figure 25 shows the results of performance evaluation of the "trained model” generated as Example 4.
- the horizontal axis of the graph in Figure 25 is MPI, which indicates pre-measured cognitive function, and the vertical axis is the output of the "trained model".
- the Spearman's rank correlation coefficient between the MPI and the output of the "trained model” is 0.503, and the p-value is less than 0.001. Therefore, it was confirmed that when the "trained model” generated as Example 4 is used, it is possible to estimate the cognitive function of a subject using the intake values of 18 types of nutrients as well as age, sex, years of education, and BMI as input.
Landscapes
- Health & Medical Sciences (AREA)
- Medical Informatics (AREA)
- Public Health (AREA)
- Engineering & Computer Science (AREA)
- Primary Health Care (AREA)
- General Health & Medical Sciences (AREA)
- Epidemiology (AREA)
- Nutrition Science (AREA)
- Biomedical Technology (AREA)
- Data Mining & Analysis (AREA)
- Databases & Information Systems (AREA)
- Pathology (AREA)
- Medical Treatment And Welfare Office Work (AREA)
Abstract
Description
図1は、本発明の第1の実施形態に係る推定装置1の機能ブロック図である。推定装置1は、PC(Personal Computer)、サーバ、携帯電話機、スマートフォン、タブレット端末、携帯ゲーム機等の情報処理装置である。推定装置1は、被検者の食事歴に基づいて、被検者が複数の食事傾向群のいずれに属するかを推定する。推定装置1は、記憶部11、通信部12、表示部13、操作部14および処理部15を有する。
図8は、本発明の第2の実施形態に係る推定装置2の機能ブロック図である。推定装置1が被検者がいずれの食事傾向群に属するかを推定し、推定の結果に基づいて被検者の認知機能を推定するのに対し、推定装置2は被検者がいずれの食事傾向群に属するかを推定することなく、被検者の食事歴に基づいて被検者の認知機能を推定する。推定装置2は、処理部15に代えて処理部25を有する点で推定装置1と相違する。推定装置2の他の構成は推定装置1の対応する構成と同様であるため、同一の符号を付して説明を省略する。
BDHQ法を用いて、150人の高齢者の穀類、イモ類、砂糖類、豆類、緑黄色野菜類、他の野菜類、果実類、魚介類、肉類、卵類、乳類、油脂類、菓子類、嗜好飲料類および調味料類の十五種類の食品群の摂取量を調査した。また、MoCA法を用いてこの150人の高齢者の認知機能を測定した。
図15は、150名の高齢者に対する重回帰分析によって得られた各説明変数の偏回帰計数、標準偏回帰計数、p値、VIF(Variance Inflation Factor)を示す図である。150名の高齢者に関するデータは、実施例1で用いたものであって、高齢者のMPIを目的変数とし、炭水化物、タンパク質、脂質および灰分の四大栄養素の摂取量、性別、年齢、教育年数並びにBMIを説明変数として、ステップワイズ法による重回帰分析したものである。図15では、説明変数のうち、目的変数に対する有意性が示された説明変数のみを示している。
図17は、385名の高齢者に対する重回帰分析によって得られた各説明変数の偏回帰計数、標準偏回帰計数、p値、VIFを示す図である。高齢者のフレイルスコアを目的変数とし、食事パターン(HC群又はPB群)、性別、年齢を説明変数として、ステップワイズ法による重回帰分析したものである。図17では、説明変数のうち、目的変数に対する有意性が示された説明変数のみを示している。
図18は、385名の高齢者に対する重回帰分析によって得られた各説明変数の偏回帰計数、標準偏回帰計数、p値、VIFを示す図である。高齢者の筋肉量を目的変数とし、食事パターン(HC群又はPB群)、性別、年齢を説明変数として、ステップワイズ法による重回帰分析したものである。図18では、説明変数のうち、目的変数に対する有意性が示された説明変数のみを示している。ここで、筋肉量(SMI:骨格筋肉指数)は、四肢筋肉量の合計を身長(m)の2乗で割った値とする。
D12=(x1-m1、x2-m2、x3―m3、x4-m4、x5―m5、x6―m6、x7―m7)・SA-1・(x1-m1、x2-m2、x3―m3、x4-m4、x5―m5、x6―m6、x7―m7)T・・・(1)
D22=(x1-n1、x2-n2、x3―n3、x4-n4、x5―n5、x6―n6、x7―n7)・SB-1・(x1-n1、x2-n2、x3―n3、x4-n4、x5―n5、x6―n6、x7―n7)T・・・(2)
最初に、BDHQ法を用いて新たに267人の一般高齢者(認知機能および記憶機能の低下が見られない高齢者をいう。)の穀類、豆類、緑黄色野菜類、他の野菜類、魚介類、肉類および卵類の七種の食品群の摂取量を調査した。次に、これらを入力データとして、上記の「学習済モデル」を用いて、上記の267人の高齢者をHC群およびPB群に分類した。次に、分類された各グループ属する高齢者の年齢、教育年齢、BMI、MPIの取得及び測定を行った。
最初に、BDHQ法を用いて80人の記憶機能低下傾向高齢者の食品群の摂取量を調査した。次に、これらを入力データとして、上記の「学習済モデル」を用いて、上記の80人の高齢者をHC群およびPB群に分類した。次に、分類された各グループ属する高齢者の年齢、教育年齢、BMI、MPI(Memory Performance Index)の取得及び測定を行った。
Claims (19)
- 被検者の食事歴が入力された場合に、当該被検者があらかじめ設定された高穀物食群および高たんぱく質バランス食群を含む複数の食事傾向群のうちのいずれに属するかに関する情報を出力するように学習された学習済みモデルを記憶する記憶部と、
被検者の食事歴を取得する取得部と、
前記取得された食事歴を前記学習済みモデルに入力することにより、被検者が前記複数の食事傾向群のうちのいずれに属するかを推定する推定部と、
を有することを特徴とする推定装置。 - 前記被検者の食事歴は、穀類、豆類、緑黄色野菜類、他の野菜類、魚介類、肉類、卵類の摂取量を含む、
請求項1に記載の推定装置。 - 前記被検者の食事歴は、BDHQ(Brief-type Self-administered Diet History Questionnaire)により取得される、
請求項1に記載の推定装置。 - 前記複数の食事傾向群は、高穀物食群および高たんぱく質バランス食群の二つの食事傾向群からなる、
請求項1に記載の推定装置。 - 前記学習済みモデルは、複数の者の食事歴と各者が前記複数の食事傾向群のうちのいずれに属するかを示す情報とを関連付けた教師データに基づいて、入力された食事歴と各食事傾向群との間のマハラノビス距離を出力する、
請求項1に記載の推定装置。 - 前記教師データは、前記複数の者の食事歴に対してk-平均法を適用し、各者を前記複数の食事傾向群に分類することにより生成される、
請求項5に記載の推定装置。 - 前記推定の結果に基づいて、被検者の認知機能を推定する推定部をさらに有する、
請求項1に記載の推定装置。 - 前記推定の結果に基づいて、被検者に推奨される食品を特定する特定部をさらに有する、
請求項1に記載の推定装置。 - 被検者の食事歴が入力された場合に、当該被検者があらかじめ設定された、高穀物食群および高たんぱく質バランス食群を含む複数の食事傾向群のうちのいずれに属するかに関する情報を出力するように学習された学習済みモデルを記憶し、
被検者の食事歴を取得し、
前記取得された食事歴を前記学習済みモデルに入力することにより、被検者が前記複数の食事傾向群のうちのいずれに属するかを推定する、
ことを含むことを特徴とする推定方法。 - 被検者の食事歴が入力された場合に、当該被検者があらかじめ設定された、高穀物食群および高たんぱく質バランス食群を含む複数の食事傾向群のうちのいずれに属するかに関する情報を出力するように学習された学習済みモデルを記憶するコンピュータのプログラムであって、
被検者の食事歴を取得し、
前記取得された食事歴を前記学習済みモデルに入力することにより、被検者が前記複数の食事傾向群のうちのいずれに属するかを推定する、
ことを前記コンピュータに実行させることを特徴とするプログラム。 - 被検者の食事歴が入力された場合に、当該被検者の認知機能を出力するように学習された学習済みモデルを記憶する記憶部と、
被検者の食事歴を取得する取得部と、
前記取得された食事歴を前記学習済みモデルに入力することにより、被検者の認知機能を推定する推定部と、
を有することを特徴とする推定装置。 - 被検者の食事歴が入力された場合に、当該被検者の認知機能を出力するように学習された学習済みモデルを記憶し、
被検者の食事歴を取得し、
前記取得された食事歴を前記学習済みモデルに入力することにより、被検者の認知機能を推定する、
ことを含むことを特徴とする推定方法。 - 被検者の食事歴が入力された場合に、当該被検者の認知機能を出力するように学習された学習済みモデルを記憶する記憶部を有するコンピュータのプログラムであって、
被検者の食事歴を取得し、
前記取得された食事歴を前記学習済みモデルに入力することにより、被検者の認知機能を推定する、
ことを前記コンピュータに実行させることを特徴とするプログラム。 - 被検者の食事歴が入力された場合に、当該被検者のフレイルスコアを出力するように学習された学習済みモデルを記憶する記憶部と、
被検者の食事歴を取得する取得部と、
前記取得された食事歴を前記学習済みモデルに入力することにより、被検者のフレイルスコアを推定する推定部と、
を有することを特徴とする推定装置。 - 被検者の食事歴が入力された場合に、当該被検者のフレイルスコアを出力するように学習された学習済みモデルを記憶し、
被検者の食事歴を取得し、
前記取得された食事歴を前記学習済みモデルに入力することにより、被検者のフレイルスコアを推定する、
ことを含むことを特徴とする推定方法。 - 被検者の食事歴が入力された場合に、当該被検者のフレイルスコアを出力するように学習された学習済みモデルを記憶する記憶部を有するコンピュータのプログラムであって、
被検者の食事歴を取得し、
前記取得された食事歴を前記学習済みモデルに入力することにより、被検者のフレイルスコアを推定する、
ことを前記コンピュータに実行させることを特徴とするプログラム。 - 被検者の食事歴が入力された場合に、当該被検者の筋肉量を出力するように学習された学習済みモデルを記憶する記憶部と、
被検者の食事歴を取得する取得部と、
前記取得された食事歴を前記学習済みモデルに入力することにより、被検者の筋肉量を推定する推定部と、
を有することを特徴とする推定装置。 - 被検者の食事歴が入力された場合に、当該被検者の筋肉量を出力するように学習された学習済みモデルを記憶し、
被検者の食事歴を取得し、
前記取得された食事歴を前記学習済みモデルに入力することにより、被検者の筋肉量を推定する、
ことを含むことを特徴とする推定方法。 - 被検者の食事歴が入力された場合に、当該被検者の筋肉量を出力するように学習された学習済みモデルを記憶する記憶部を有するコンピュータのプログラムであって、
被検者の食事歴を取得し、
前記取得された食事歴を前記学習済みモデルに入力することにより、被検者の筋肉量を推定する、
ことを前記コンピュータに実行させることを特徴とするプログラム。
Priority Applications (1)
| Application Number | Priority Date | Filing Date | Title |
|---|---|---|---|
| JP2025506912A JPWO2024190841A1 (ja) | 2023-03-14 | 2024-03-13 |
Applications Claiming Priority (2)
| Application Number | Priority Date | Filing Date | Title |
|---|---|---|---|
| JP2023-039694 | 2023-03-14 | ||
| JP2023039694 | 2023-03-14 |
Publications (1)
| Publication Number | Publication Date |
|---|---|
| WO2024190841A1 true WO2024190841A1 (ja) | 2024-09-19 |
Family
ID=92755313
Family Applications (1)
| Application Number | Title | Priority Date | Filing Date |
|---|---|---|---|
| PCT/JP2024/009869 Ceased WO2024190841A1 (ja) | 2023-03-14 | 2024-03-13 | 推定装置、推定方法およびプログラム |
Country Status (2)
| Country | Link |
|---|---|
| JP (1) | JPWO2024190841A1 (ja) |
| WO (1) | WO2024190841A1 (ja) |
Cited By (1)
| Publication number | Priority date | Publication date | Assignee | Title |
|---|---|---|---|---|
| CN119446424A (zh) * | 2024-11-15 | 2025-02-14 | 广东省疾病预防控制中心(广东省预防医学科学院) | 模型的训练方法、成品菜肴营养成分分析方法及装置 |
Citations (6)
| Publication number | Priority date | Publication date | Assignee | Title |
|---|---|---|---|---|
| JP2008257293A (ja) * | 2007-03-30 | 2008-10-23 | Koichiro Yuji | 健康状態予測システム |
| JP2012165716A (ja) * | 2011-02-16 | 2012-09-06 | Infocom Corp | 腸内常在菌解析情報を基にした食事支援システム |
| JP2013541108A (ja) * | 2010-10-14 | 2013-11-07 | アーシャ ニュートリション サイエンシーズ, インコーポレイテッド | 最適化された栄養処方物、それらから目的に合わせた食事を選択するための方法、およびその使用法 |
| JP2017084142A (ja) * | 2015-10-28 | 2017-05-18 | 真理 船木 | 演算装置、プログラム、疾患のリスクの判定方法、および疾患の予防又は改善のための食物の決定方法 |
| JP2018120394A (ja) * | 2017-01-25 | 2018-08-02 | 株式会社リコー | 診断装置、プログラム及び診断システム |
| WO2022092057A1 (ja) * | 2020-10-26 | 2022-05-05 | 味の素株式会社 | 認知機能の観点から健康の要素の状態を評価する方法、情報処理装置およびプログラム |
Family Cites Families (3)
| Publication number | Priority date | Publication date | Assignee | Title |
|---|---|---|---|---|
| JP5853348B2 (ja) * | 2011-10-27 | 2016-02-09 | 株式会社リピックス・ラボラトリーズ | 生活習慣解析システム及び生活習慣解析方法 |
| WO2018081175A1 (en) * | 2016-10-24 | 2018-05-03 | Habit, Llc | System and method for implementing meal selection based on vitals, genotype, and phenotype |
| JP7443235B2 (ja) * | 2018-02-09 | 2024-03-05 | デックスコム・インコーポレーテッド | 意思決定支援のシステムおよび方法 |
-
2024
- 2024-03-13 WO PCT/JP2024/009869 patent/WO2024190841A1/ja not_active Ceased
- 2024-03-13 JP JP2025506912A patent/JPWO2024190841A1/ja active Pending
Patent Citations (6)
| Publication number | Priority date | Publication date | Assignee | Title |
|---|---|---|---|---|
| JP2008257293A (ja) * | 2007-03-30 | 2008-10-23 | Koichiro Yuji | 健康状態予測システム |
| JP2013541108A (ja) * | 2010-10-14 | 2013-11-07 | アーシャ ニュートリション サイエンシーズ, インコーポレイテッド | 最適化された栄養処方物、それらから目的に合わせた食事を選択するための方法、およびその使用法 |
| JP2012165716A (ja) * | 2011-02-16 | 2012-09-06 | Infocom Corp | 腸内常在菌解析情報を基にした食事支援システム |
| JP2017084142A (ja) * | 2015-10-28 | 2017-05-18 | 真理 船木 | 演算装置、プログラム、疾患のリスクの判定方法、および疾患の予防又は改善のための食物の決定方法 |
| JP2018120394A (ja) * | 2017-01-25 | 2018-08-02 | 株式会社リコー | 診断装置、プログラム及び診断システム |
| WO2022092057A1 (ja) * | 2020-10-26 | 2022-05-05 | 味の素株式会社 | 認知機能の観点から健康の要素の状態を評価する方法、情報処理装置およびプログラム |
Non-Patent Citations (2)
| Title |
|---|
| MOTOKAWA KEIKO: "Food and nutrition for older adults to prevent frailty sarcopenia", NIHON RONEN IGAKKAI ZASSHI - JAPANESE JOURNAL OF GERIATRICS, NIHON RONEN IGAKKAI, TOKYO, JP, vol. 58, no. 4, 25 October 2021 (2021-10-25), JP , pages 550 - 555, XP093209084, ISSN: 0300-9173, DOI: 10.3143/geriatrics.58.550 * |
| TOMOYUKI OHARA, TOSHIHARU NINOMIYA: "Prevention of dementia: the HISAYAMA Study", JAPANESE JOURNAL OF CLINICAL MEDICINE, NIPPON-RINSHO CO., OSAKA., JP, vol. 76, no. Special issue 1, 20 January 2018 (2018-01-20), JP , pages 182 - 187, XP009557312, ISSN: 0047-1852 * |
Cited By (1)
| Publication number | Priority date | Publication date | Assignee | Title |
|---|---|---|---|---|
| CN119446424A (zh) * | 2024-11-15 | 2025-02-14 | 广东省疾病预防控制中心(广东省预防医学科学院) | 模型的训练方法、成品菜肴营养成分分析方法及装置 |
Also Published As
| Publication number | Publication date |
|---|---|
| JPWO2024190841A1 (ja) | 2024-09-19 |
Similar Documents
| Publication | Publication Date | Title |
|---|---|---|
| Wang et al. | Trends in consumption of ultraprocessed foods among US youths aged 2-19 years, 1999-2018 | |
| JP7203473B1 (ja) | プログラム、情報処理方法及び情報処理装置 | |
| KR102024373B1 (ko) | 대사이상 질환의 질병 위험도를 예측하는 장치 및 방법 | |
| Martinez-Perez et al. | Integrative development of a short screening questionnaire of highly processed food consumption (sQ-HPF) | |
| JP2018124702A (ja) | 病因分析装置および疾病予測装置 | |
| US20140316220A1 (en) | Personal Health Monitoring System | |
| JP6705089B2 (ja) | ヘルスチューニング支援システム | |
| JP7828079B2 (ja) | 被験者の健康度を計測するための方法、装置、プログラム、およびシステム | |
| JP2019021146A (ja) | 高齢者の低栄養又はフレイルの予測方法 | |
| KR102827716B1 (ko) | 여성 독거노인의 우울증 위험도 예측 장치, 여성 독거노인의 우울증 위험도 예측 방법 및 기록 매체에 저장된 프로그램 | |
| CN105279362A (zh) | 个人健康监视系统 | |
| JP2022091963A (ja) | 健康管理システム | |
| JP7692907B2 (ja) | 生活習慣スコアリングシステム及び方法 | |
| KR20190063954A (ko) | 인공지능 클라우드 영양소 변화 예측 방법과 인공지능 클라우드 영양소 대사량 측정 방법 및 그를 사용하는 질병관리 방법 | |
| CN111816280A (zh) | 一种基于饮食行为的疾病预测的模型构建方法及系统 | |
| KR20240059526A (ko) | 건강 음식 추천 방법 및 시스템 | |
| Wei et al. | Perceptual and attitudinal body image, disordered eating, and muscle-building behavior in college men. | |
| US20240177826A1 (en) | Generating personalized food guidance using predicted hunger | |
| JP2024539883A (ja) | 間欠絶食のための個別化された栄養推奨を提供するためのシステム及び方法 | |
| JP2024531667A (ja) | 前糖尿病のためのデジタルかつパーソナライズされたリスク監視及び栄養計画システム | |
| Martín Payo et al. | Adherence to healthy diet and physical activity in clinical patients | |
| US10832172B1 (en) | Systems and methods for arranging transport of adapted nutrimental artifacts with user-defined restriction requirements using artificial intelligence | |
| US20240087719A1 (en) | Methods and systems for calculating an edible score in a display interface | |
| Sitparoopan et al. | Home bridge-smart elderly care system | |
| Chen et al. | A machine learning-based fall-risk score for severity of fall-related adverse outcomes in community older adults |
Legal Events
| Date | Code | Title | Description |
|---|---|---|---|
| 121 | Ep: the epo has been informed by wipo that ep was designated in this application |
Ref document number: 24770945 Country of ref document: EP Kind code of ref document: A1 |
|
| ENP | Entry into the national phase |
Ref document number: 2025506912 Country of ref document: JP Kind code of ref document: A |
|
| WWE | Wipo information: entry into national phase |
Ref document number: 2025506912 Country of ref document: JP |
|
| NENP | Non-entry into the national phase |
Ref country code: DE |
|
| 122 | Ep: pct application non-entry in european phase |
Ref document number: 24770945 Country of ref document: EP Kind code of ref document: A1 |