WO2024177086A1 - 認知症リスク評価方法及び認知症リスク評価システム - Google Patents
認知症リスク評価方法及び認知症リスク評価システム Download PDFInfo
- Publication number
- WO2024177086A1 WO2024177086A1 PCT/JP2024/006138 JP2024006138W WO2024177086A1 WO 2024177086 A1 WO2024177086 A1 WO 2024177086A1 JP 2024006138 W JP2024006138 W JP 2024006138W WO 2024177086 A1 WO2024177086 A1 WO 2024177086A1
- Authority
- WO
- WIPO (PCT)
- Prior art keywords
- dementia
- group
- elements
- discriminant
- subject
- Prior art date
- Legal status (The legal status is an assumption and is not a legal conclusion. Google has not performed a legal analysis and makes no representation as to the accuracy of the status listed.)
- Ceased
Links
Images

















Classifications
-
- G—PHYSICS
- G01—MEASURING; TESTING
- G01N—INVESTIGATING OR ANALYSING MATERIALS BY DETERMINING THEIR CHEMICAL OR PHYSICAL PROPERTIES
- G01N33/00—Investigating or analysing materials by specific methods not covered by groups G01N1/00 - G01N31/00
- G01N33/48—Biological material, e.g. blood, urine; Haemocytometers
- G01N33/483—Physical analysis of biological material
- G01N33/487—Physical analysis of biological material of liquid biological material
- G01N33/49—Blood
-
- G—PHYSICS
- G01—MEASURING; TESTING
- G01N—INVESTIGATING OR ANALYSING MATERIALS BY DETERMINING THEIR CHEMICAL OR PHYSICAL PROPERTIES
- G01N33/00—Investigating or analysing materials by specific methods not covered by groups G01N1/00 - G01N31/00
- G01N33/48—Biological material, e.g. blood, urine; Haemocytometers
- G01N33/50—Chemical analysis of biological material, e.g. blood, urine; Testing involving biospecific ligand binding methods; Immunological testing
- G01N33/84—Chemical analysis of biological material, e.g. blood, urine; Testing involving biospecific ligand binding methods; Immunological testing involving inorganic compounds or pH
Definitions
- the present invention relates to a method and system for assessing the risk of dementia, and more specifically to a method and system for assessing the risk of dementia using an index obtained by utilizing the balance of concentrations of element groups (correlation between the concentrations of the element groups to be evaluated) contained in human blood (plasma or serum).
- ementia includes not only Alzheimer's Disease (hereinafter also referred to as AD) but also Mild Cognitive Impairment (hereinafter also referred to as MCI).
- DSM-5 Diagnostic and Statistical Manual of Mental Disorders-5
- ICD-10 International Statistical Classification of Diseases, 10th edition
- NIA-AA National Institute on Aging and the Alzheimer's Association
- the diagnostic criteria used are the concept of "decreased cognitive function" provided by the individual or an informant who knows the individual, assessments using neuropsychological tests such as the Mini-Mental State Examination (MMSE), Hasegawa's Dementia Scale-Revised (HDS-R), and General Practitioner Assessment of Cognition (GPCOG), and a judgment as to whether cognitive deficits in daily activities impede independence.
- MMSE Mini-Mental State Examination
- HDS-R Hasegawa's Dementia Scale-Revised
- GPSCOG General Practitioner Assessment of Cognition
- imaging tests such as CT (Computer Tomography), MRI (Magnetic Resonance Imaging), and PET (Positron Emission Tomography) are often used in conjunction as auxiliary diagnostics.
- metabolic encephalopathy e.g., hypothyroidism, hepatic encephalopathy, hyponatremia.
- metabolic encephalopathy e.g., hypothyroidism, hepatic encephalopathy, hyponatremia.
- 8-Oxo-GSn a specific nucleic acid oxidation metabolite contained in urine is an indicator for diagnosing MCI, that is, a biomarker specialized for diagnosing MCI.
- no blood test biomarker specialized for diagnosing dementia has yet been discovered.
- signal transmission in nerve cells is performed by utilizing action potentials generated by changes in the balance (distribution) of sodium ions (Na + ) and potassium ions (K + ).
- Signals that reach the synapse at the end of nerve cells using action potentials are converted into neurotransmitters (e.g., serotonin, dopamine, noradrenaline, acetylcholine) and transmitted to the synapse of the next nerve cell.
- neurotransmitters e.g., serotonin, dopamine, noradrenaline, acetylcholine
- the neurotransmitters used for signal transmission between nerve cells are affected by metal elements present in the brain, such as iron (Fe), zinc (Zn), copper (Cu), and manganese (Mn). It is also known that these metal element groups regulate many functions of the nervous system as simple metals or as components of enzymes and functional proteins.
- AD and MCI have traditionally been considered to be aging phenomena, but AD is considered to be a neurological disease because its pathological characteristics are synaptic loss and neuronal death caused by abnormal accumulation of amyloid beta protein (observed as "senile plaques") or phosphorylated tau protein.
- neurotransmitters used for signal transmission between nerve cells are affected by metal elements in the brain, such as iron (Fe), zinc (Zn), copper (Cu), and manganese (Mn). Therefore, it is speculated that it may be possible to diagnose AD, which is a neurological disease, by detecting metal elements contained in blood. If this is possible, biomarkers that indicate the presence or absence of AD can be obtained by blood tests, which would be extremely useful as it would enable simple evaluation of dementia, which has been rapidly increasing in the elderly in recent years.
- MMSE Mini-Mental State Examination
- Patent Documents 1 and 2 The inventors have previously developed a cancer risk assessment method that utilizes the correlation between the concentrations of metal elements contained in human serum and the onset of cancer as a method for pre-evaluating the risk of developing cancer, and have filed an international patent application (see Patent Documents 1 and 2). These methods make it possible to easily obtain an index for evaluating the risk of developing cancer through a blood test, and to easily evaluate the risk of developing cancer using this index, and furthermore, to estimate the risk of developing cancer in general examinees with high accuracy. They can also be easily applied to mass screening.
- the method of Patent Document 1 includes a correlation calculation step in which concentration data of the evaluation element group in the serum collected from the subject is applied to a discriminant function for discriminating whether the subject belongs to a control group or a case group, to calculate the correlation between the concentrations of the evaluation element group in the serum, and an index acquisition step in which an index is obtained as to whether the subject has developed some kind of cancer based on the correlation calculated in the correlation calculation step.
- the evaluation element group a combination of seven elements, S, P, Mg, Zn, Cu, Ti, and Rb, or a combination of 16 elements, Na, Mg, Al, P, K, Ca, Ti, Mn, Fe, Zn, Cu, Se, Rb, Ag, Sn, and S, is selected.
- the method of Patent Document 2 has the same correlation calculation step and index acquisition step as the method of Patent Document 1, but differs in that the subject's age data is used in addition to the concentration data in each of the correlation calculation step and the index acquisition step.
- the evaluation element group used in the correlation calculation step is a combination of 17 elements, Na, Mg, P, S, K, Ca, Fe, Cu, Zn, Se, Rb, Sr, As, Mo, Cs, Co, and Ag, which is different from the evaluation element group in the method of Patent Document 1.
- the index includes a prediction that the type of cancer related to the subject is pancreatic cancer in men, prostate cancer in men, colon cancer in men, uterine cancer in women, breast cancer in women, or colon cancer in women, depending on the difference between the age data and the group of elements (which are selected from the group of evaluation elements) for which the concentration data is significant for discrimination.
- the method of Patent Document 2 can be said to be superior to the method of Patent Document 1, since it can predict not only the risk of cancer but also the site of the cancer with a single blood test.
- the brain is essential for human life, and metal elements play a major role in the brain's information activity.
- calcium (Ca) increases the concentration in brain cells, thereby increasing the activity of enzymes such as protein kinase, CaM kinase II, and tyrosine phosphorylation enzymes, and contributing to information transmission.
- Zinc (Zn) acts as a neuroregulator involved in the information transmission of the brain nervous system, such as memory formation and sensory transmission.
- Copper (Cu) acts as a component of catecholamine-producing enzymes involved in the production of noradrenaline, and depending on the amount of copper, it can induce central nervous system disorders such as ataxia.
- trace elements in the body can cause deficiency if they are deficient, and excess intake can cause excess or poisoning, so it is necessary to constantly take in appropriate amounts.
- Major elements are important as components of the body, but trace elements are used in enzyme active centers in the body's metabolism, and only very small amounts are needed. When a trace element becomes deficient or excessive, the balance of the body's metabolism is disrupted, and symptoms specific to each element appear. Conversely, it is said that the composition of trace elements changes and homeostasis collapses when illnesses occur due to poor physical condition or immune system disorders. It is speculated that this effect exerts the same influence on activity in the brain as it does on carcinogenesis in various organs of the body.
- Non-Patent Document 1 states that (a) neuronal activity is closely related to dynamic iron metabolism, (b) during the process of pathological analysis of neurodegenerative diseases such as Alzheimer's disease, physiologically expressed proteins polymerize in the presence of trace metals such as iron, copper, and zinc to form soluble oligomers or protofibrils, which cause synaptic dysfunction and neuronal cell death, and (c) the event in (b) above is related to the manifestation of symptoms of neurodegenerative diseases.
- Non-Patent Document 2 states that factors that affect the multimerization and conformational changes of amyloid ⁇ protein may play an important role in the onset of Alzheimer's disease, and that factors that cause the conformational changes include metals such as Al, Zn, Cu, and Fe.
- Non-Patent Document 3 states that there is a clear difference between the Mini-Mental State Examination (MMSE) results of patients with dementia and those of patients with MCI.
- MMSE Mini-Mental State Examination
- Hiroaki Miyajima Role of trace metals in neurodegeneration, with a focus on iron and zinc nutritional therapy: Vol. 3, No. 1: 22-29, 2012 Masahiro Kawahara and Dai Mizuno, "Trace elements and neurological diseases: interactions between disease-related proteins and metals in the synaptic cleft," Biomedical Research on Trace Elements, Vol. 26, No. 1: 10-22, 2015 Zhang S et al.: Determining Appropriate Screening Tools and Cutoffs for Cognitive Impairment in the Chinese Elderly: Volume 12, Article 773281, 2021.
- Ca calcium
- CaM CaM kinase II
- tyrosine kinase enzymes such as protein kinase, CaM kinase II, and tyrosine kinase.
- Zinc (Zn) acts as a neuroregulator involved in information transmission in the nervous system, such as memory formation and sensory transmission.
- Copper (Cu) acts as a component of catecholamine-producing enzymes involved in the production of noradrenaline, and depending on the amount, it can induce central nervous system disorders such as ataxia.
- the object of the present invention is therefore to provide a dementia risk assessment method and dementia risk assessment system that can directly grasp the physical condition of a subject through measurement and analysis of the subject's biological samples, rather than through diagnosis using a medical questionnaire or the like, and can objectively and highly accurately assess the subject's risk of developing dementia.
- Another object of the present invention is to provide a dementia risk assessment method and dementia risk assessment system that can be effectively used as an auxiliary diagnosis of dementia for patients who visit a medical institution with suspected neurological or psychiatric disorders, or as an objective means of dementia risk assessment for the general public other than the patients.
- Another object of the present invention is to provide a dementia risk assessment method and dementia risk assessment system that can be easily applied to mass screening.
- a method for assessing a risk of dementia Obtaining concentration data of an evaluation element group contained in blood (plasma or serum) collected from a subject; applying the concentration data of the evaluation element group to a discriminant function for discriminating whether the subject belongs to a control group or a case group, thereby calculating a correlation between the concentrations of the evaluation element group; generating an indicator for identifying whether the subject suffers from dementia based on the correlation; and evaluating the subject's dementia risk based on the index to generate an evaluation result;
- the evaluation element group uses a combination of 17 elements, namely Na, Mg, P, S, K, Ca, Fe, Co, Cu, Zn, As, Se, Rb, Sr, Mo, Ag, and Cs, and is characterized in that the 17 elements were selected as the combination of elements that provides the highest discriminatory ability when distinguishing between a case group and a control group.
- the concentration data of the evaluation element group in the blood (plasma or serum) collected from the subject is applied to the discriminant function to calculate the correlation between the concentrations of the evaluation element group in the blood (plasma or serum).
- the evaluation element group uses a combination of 17 elements, Na, Mg, P, S, K, Ca, Fe, Co, Cu, Zn, As, Se, Rb, Sr, Mo, Ag, and Cs, which were selected because they have the highest discriminatory ability when using a combination of these 17 elements. Therefore, it is possible to estimate the dementia risk of the subject with high accuracy.
- an index for identifying whether or not the subject suffers from dementia is generated based on the correlation, and the subject's risk of dementia is evaluated based on the index to generate an evaluation result.
- the index for example, a discriminant score calculated by applying the concentration data to the discriminant generated based on the correlation is used.
- the subject's risk of developing dementia can be objectively and accurately assessed.
- the evaluation results are obtained through the measurement and analysis of the subjects' biological samples, they provide an objective assessment, unlike diagnoses based on questionnaires, etc. For this reason, when a hospital control group is used as the control group, the evaluation results can be effectively used as an auxiliary diagnosis of dementia for patients who visit a medical institution with suspected neurological or psychiatric disorders by referring to the results by the medical institution. On the other hand, when a resident control group is used as the control group, the results can be effectively used as an objective means of assessing dementia risk for the general population who are not patients.
- the concentration data of the evaluation element group in the blood (plasma or serum) collected from the subject it is possible to determine whether the subject belongs to the control group or the case group, in other words, whether the subject is suffering from dementia or not, so that it is possible to easily and quickly determine whether the subject is suffering from dementia even if there are a large number of subjects. Therefore, it can be easily applied to mass medical examinations.
- a discriminant score calculated by applying the concentration data to a discriminant generated based on the correlation is used as the index, By comparing the discriminant score with a predetermined reference value, it is determined whether the subject belongs to the control group or the case group; Based on the result of the discrimination, an inference as to whether or not the subject suffers from dementia is included in the evaluation result.
- the discriminant score of the subject is compared with a relationship between the discriminant score and a probability that the subject has dementia, thereby estimating a dementia probability of the subject, The estimated probability of the subject suffering from dementia is included in the evaluation results.
- a discriminant generated for mild cognitive impairment is used as the discriminant,
- the evaluation results include a determination result of whether or not the subject suffers from mild cognitive impairment (MCI).
- a discriminant generated for Alzheimer's disease is used as the discriminant,
- the evaluation result includes a determination result of whether or not the subject is affected by Alzheimer's disease (AD).
- both a discriminant generated for mild cognitive impairment (MCI) and a discriminant generated for Alzheimer's disease (AD) are used as the discriminant,
- the evaluation results include a determination result as to whether the type of dementia of the subject suspected of having dementia is mild cognitive impairment (MCI) or Alzheimer's dementia (AD).
- the assessment result includes a prediction that the type of dementia of the subject suspected of having dementia is mild cognitive impairment (MCI).
- MCI mild cognitive impairment
- the assessment result includes a presumption that the type of dementia of the subject determined to be suffering from dementia is Alzheimer's disease (AD).
- AD Alzheimer's disease
- a hospital control group is used as the control group,
- the subjects are selected from patients who visit a specific medical institution with a suspected neurological or psychiatric disorder,
- the evaluation results are used as an aid in dementia diagnosis at the medical institution.
- a resident control group is used as the control group,
- the subjects were selected from the general population, who were not patients visiting medical institutions for suspected neurological or psychiatric disorders.
- the evaluation results are used as a means of assessing the dementia risk of the general population.
- the assessment result includes a prediction that the type of dementia of the subject suspected of having dementia is mild cognitive impairment (MCI).
- MCI mild cognitive impairment
- the assessment result includes a presumption that the type of dementia of the subject determined to be suffering from dementia is Alzheimer's disease (AD).
- AD Alzheimer's disease
- a dementia risk assessment system a data storage unit that stores concentration data of the evaluation elements contained in blood (plasma or serum) collected from the subject; a calculation unit that calculates a correlation between concentrations of the evaluation elements by applying the concentration data of the subject stored in the data storage unit to a discriminant function for discriminating whether the subject belongs to a control group or a case group; and an index generating unit that generates an index for identifying whether or not the subject is suffering from dementia based on the correlation calculated by the calculation unit, and evaluates a dementia risk of the subject based on the index and outputs an evaluation result;
- the evaluation element group uses a combination of 17 elements, namely Na, Mg, P, S, K, Ca, Fe, Co, Cu, Zn, As, Se, Rb, Sr, Mo, Ag, and Cs, and is characterized in that the 17 elements were selected as the combination of elements that provides the highest discriminatory ability when distinguishing between a case group and a control group.
- the calculation unit applies the concentration data of the subject stored in the data storage unit to the discriminant function for determining whether the subject belongs to the control group or the case group, and calculates the correlation between the concentrations of the evaluation element group contained in the blood (plasma or serum).
- the evaluation element group uses a combination of 17 elements, Na, Mg, P, S, K, Ca, Fe, Co, Cu, Zn, As, Se, Rb, Sr, Mo, Ag, and Cs, which were selected because they have the highest discriminatory ability when used in combination with these elements. Therefore, it is possible to estimate the dementia risk of the subject with high accuracy.
- the index generating unit generates the index for identifying whether or not the subject is suffering from dementia based on the correlation calculated by the calculating unit, and then evaluates the subject's dementia risk based on the index to create an evaluation result.
- the index for example, a discriminant score calculated by applying the concentration data to a discriminant generated based on the correlation is used.
- the subject's risk of developing dementia can be objectively and with high accuracy evaluated.
- the evaluation results are obtained through the measurement and analysis of the subjects' biological samples, they provide an objective assessment, unlike diagnoses based on questionnaires, etc. For this reason, when a hospital control group is used as the control group, the evaluation results can be effectively used as an auxiliary diagnosis of dementia for patients who visit a medical institution with suspected neurological or psychiatric disorders by referring to the results by the medical institution. On the other hand, when a resident control group is used as the control group, the results can be effectively used as an objective means of assessing dementia risk for the general population who are not patients.
- the concentration data of the evaluation element group in the blood (plasma or serum) collected from the subject it is possible to determine whether the subject belongs to the control group or the case group, in other words, whether the subject is suffering from dementia or not, so that it is possible to easily and quickly determine whether the subject is suffering from dementia even if there are a large number of subjects. Therefore, it can be easily applied to mass medical examinations.
- the calculation unit determines which of the 17 elements used as the group of evaluation elements has concentration data that is significant for discrimination. Moreover, since the elements that are significant for discrimination vary depending on the type of dementia (MCI or AD), if it is suspected that the subject suffers from dementia, it is also possible to estimate whether the type of dementia is MCI or AD. In addition, since it is sufficient to obtain concentration data of the group of evaluation elements contained in the blood (whole blood) collected from the subject, either serum or plasma, which have similar elemental components, may be used.
- a discriminant score calculated by applying the concentration data to a discriminant generated based on the correlation is used as the index, By comparing the discriminant score with a predetermined reference value, it is determined whether the subject belongs to the control group or the case group; Based on the result of the discrimination, an inference as to whether or not the subject suffers from dementia is included in the evaluation result.
- the discriminant score of the subject is compared with a relationship between the discriminant score and a probability that the subject has dementia, thereby estimating a dementia probability of the subject, The estimated probability of the subject suffering from dementia is included in the evaluation results.
- a discriminant generated for mild cognitive impairment is used as the discriminant,
- the evaluation result includes the determination result of whether or not the subject suffers from mild cognitive impairment (MCI).
- a discriminant generated for Alzheimer's disease is used as the discriminant,
- the evaluation result includes a determination result of whether or not the subject is affected by Alzheimer's disease (AD).
- the discriminant both a discriminant generated for mild cognitive impairment (MCI) and a discriminant generated for Alzheimer's disease (AD) are used.
- the evaluation results include a determination result as to whether the type of dementia of the subject suspected of having dementia is mild cognitive impairment (MCI) or Alzheimer's dementia (AD).
- the assessment result includes a prediction that the type of dementia of the subject suspected of having dementia is mild cognitive impairment (MCI).
- MCI mild cognitive impairment
- the assessment result includes a prediction that the type of dementia of the subject suspected of having dementia is Alzheimer's disease (AD).
- AD Alzheimer's disease
- a hospital control group is used as the control group,
- the subjects are selected from patients who visit a specific medical institution with a suspected neurological or psychiatric disorder,
- the evaluation results are used as an auxiliary means for diagnosing dementia at the medical institution.
- a resident control group is used as the control group,
- the subjects were selected from the general population, who were not patients visiting medical institutions for suspected neurological or psychiatric disorders.
- the evaluation results are used as a means of assessing the dementia risk of the general population.
- the assessment result includes a prediction that the type of dementia of the subject suspected of having dementia is mild cognitive impairment (MCI).
- MCI mild cognitive impairment
- the assessment result includes a presumption that the type of dementia of the subject determined to be suffering from dementia is Alzheimer's disease (AD).
- AD Alzheimer's disease
- the dementia risk assessment method according to the first aspect of the present invention and the dementia risk assessment system according to the second aspect of the present invention have the following advantages: (a) the physical condition of a subject can be directly grasped through measurement and analysis of the subject's biological samples, rather than through diagnosis using a questionnaire or the like, and the risk of dementia in the subject can be objectively assessed; (b) the method can be effectively used as an auxiliary diagnosis of dementia in patients who visit a medical institution with suspected neurological or psychiatric disorders, or as an objective means of dementia risk assessment for the general population other than the patients; and (c) the method can be easily applied to mass screening.
- FIG. 1 is a flowchart showing the basic principle of the dementia assessment method of the present invention.
- FIG. 1 is a functional block diagram showing the basic configuration of the dementia risk assessment system of the present invention.
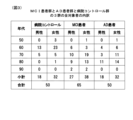
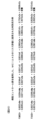
- 1 is a table showing the breakdown of all subjects (hospital control group, MCI patient group, and AD patient group) who provided serum used in an example of the dementia risk assessment method of the present invention, and the name of the disease (type of dementia).
- 1 is a table for comparing the average values and standard deviations of the concentrations of 17 types of evaluation elements used in the examples of the dementia risk assessment method of the present invention among three groups: a hospital control group, an MCI patient group, and an AD patient group.
- FIG. 1 is a flowchart showing the basic principle of the dementia assessment method of the present invention.
- FIG. 1 is a functional block diagram showing the basic configuration of the dementia risk assessment system of the present invention.
- 1 is a table showing the breakdown of all subjects (hospital control group, MCI patient group, and AD patient group) who provided serum used in an
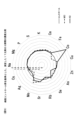
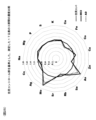
- FIG. 1 is a radar chart for comparing the concentrations of 17 types of evaluation elements used in an embodiment of the dementia risk assessment method of the present invention among three groups, namely, a hospital control group, an MCI patient group, and an AD patient group, with the concentration values of the evaluation elements in the hospital control group set as the standard (1).
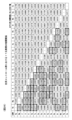
- FIG. 1 is a table showing the correlation in a hospital control group between the concentrations of 17 types of evaluation elements used in an embodiment of the dementia risk assessment method of the present invention, in which the values in the lower left triangular region indicate correlation coefficients, and the values in the upper right triangular region indicate P values.
- 1 is a table showing the correlation between the concentrations of 17 types of evaluation elements used in an embodiment of the dementia risk assessment method of the present invention in an MCI patient group, in which the value in the lower left triangular region indicates the correlation coefficient, and the value in the upper right triangular region indicates the P value.
- 1 is a table showing the correlation in an AD patient group between the concentrations of 17 types of evaluation elements used in an embodiment of the dementia risk assessment method of the present invention, in which the values in the lower left triangular region indicate correlation coefficients, and the values in the upper right triangular region indicate P values.
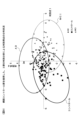
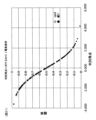
- 1 is a graph showing the distribution of discriminant scores obtained by discriminant analysis of three groups, a hospital control group, an MCI patient group, and an AD patient group, in an example of the dementia risk assessment method of the present invention.
- 1 is a cross-tabulation table showing the results obtained by discriminant analysis of three groups, a hospital control group, an MCI patient group, and an AD patient group, in an example of the dementia risk assessment method of the present invention.
- 1 is a table showing the discrimination coefficients and their significance of two discriminant functions obtained in discriminant analysis of three groups, a hospital control group, an MCI patient group, and an AD patient group, in an example of the dementia risk assessment method of the present invention.
- 1 is a histogram showing the distribution of discriminant scores obtained by discriminant analysis of two groups, a hospital control group and an MCI patient group, in an example of the dementia risk assessment method of the present invention.
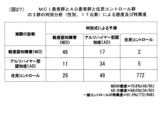
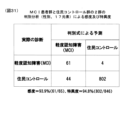
- 1 is a table showing the sensitivity and specificity obtained by discriminant analysis of two groups, a hospital control group and an MCI patient group, in an example of the dementia risk assessment method of the present invention.
- 1 is a table showing the discrimination coefficients and their significance obtained in a discriminant analysis of two groups, a hospital control group and an MCI patient group, in an example of the dementia risk assessment method of the present invention.
- 1 is a histogram showing the distribution of discriminant scores obtained by discriminant analysis of two groups, a hospital control group and an AD patient group, in an example of the dementia risk assessment method of the present invention.
- 1 is a table showing the sensitivity and specificity obtained by discriminant analysis of two groups, a hospital control group and an AD patient group, in an example of the dementia risk assessment method of the present invention.
- 1 is a table showing the discrimination coefficients and their significance obtained in a discriminant analysis of two groups, a hospital control group and an AD patient group, in an example of the dementia risk assessment method of the present invention.
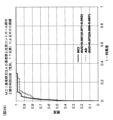
- 1 is a graph showing an ROC curve obtained by discriminant analysis of two groups, a hospital control group and an MCI patient group, in an example of the dementia risk assessment method of the present invention.
- FIG. 1 is a graph showing an ROC curve obtained by discriminant analysis of two groups, a hospital control group and an AD patient group, in an example of the dementia risk assessment method of the present invention.
- FIG. 13 shows discriminant functions obtained in a discriminant analysis of two groups, a hospital control group and an MCI patient group, and a discriminant analysis of two groups, a hospital control group and an AD patient group, in an example of the dementia risk assessment method of the present invention.
- FIG. 21 is a graph showing the relationship between the discriminant score and the probability of developing MCI, obtained by discriminant analysis of two groups, a hospital control group and an MCI patient group (using the discriminant formula: F(MCI) shown in FIG. 20 ), in an example of the dementia risk assessment method of the present invention.
- FIG. 13 shows discriminant functions obtained in a discriminant analysis of two groups, a hospital control group and an MCI patient group, and a discriminant analysis of two groups, a hospital control group and an AD patient group, in an example of the dementia risk assessment method of
- FIG. 21 is a graph showing the relationship between the discriminant score and the probability of developing AD, obtained by discriminant analysis (using the discriminant formula: F(AD) shown in FIG. 20) of two groups, a hospital control group and an AD patient group, in an example of the dementia risk assessment method of the present invention.
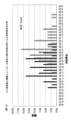
- 1 is a table showing the results (scores) of the Mini-Mental State Examination (MMSE) for all subjects belonging to the resident control group in an embodiment of the dementia risk assessment method of the present invention.
- MMSE Mini-Mental State Examination
- This is a table for comparing the average values, standard deviations, and significance of the concentrations of 17 types of evaluation elements used in the examples of the dementia risk assessment method of the present invention among four groups: a resident control group, a hospital control group, an MCI patient group, and an AD patient group.
- FIG. 1 is a radar chart for comparing the concentrations of 17 types of evaluation elements used in an embodiment of the dementia risk assessment method of the present invention among three groups: a resident control group, an MCI patient group, and an AD patient group, with the concentration values of the evaluation elements in the resident control group set as the standard (1).
- FIG. 1 is a table showing the correlation in a resident control group between the concentrations of 17 types of evaluation elements used in an embodiment of the dementia risk assessment method of the present invention, in which the values in the lower left triangular region indicate correlation coefficients, and the values in the upper right triangular region indicate P values.
- FIG. 1 is a radar chart for comparing the concentrations of 17 types of evaluation elements used in an embodiment of the dementia risk assessment method of the present invention among three groups: a resident control group, an MCI patient group, and an AD patient group, with the concentration values of the evaluation elements in the resident control group set as the standard (1).
- FIG. 1 is a table showing the correlation in a resident control group between the concentrations of 17 types of evaluation
- FIG. 1 is a cross-tabulation table showing the results obtained by discriminant analysis (using gender data and concentration data of 17 elements) of three groups: a resident control group, an MCI patient group, and an AD patient group, in an example of the dementia risk assessment method of the present invention.
- FIG. 1 is a table showing the standardized discrimination coefficients and their significance of two discriminant functions obtained in a discriminant analysis (using gender data and concentration data of 17 elements) of three groups, namely, a resident control group, an MCI patient group, and an AD patient group, in an example of the dementia risk assessment method of the present invention.
- 1 is a cross-tabulation table showing the results obtained by discriminant analysis (using only concentration data of 17 elements) of two groups, a resident control group and an MCI patient group, in an example of the dementia risk assessment method of the present invention.
- 1 is a cross-tabulation table showing the results obtained by discriminant analysis (using only concentration data of 17 elements) of two groups, a resident control group and an AD patient group, in an example of the dementia risk assessment method of the present invention.
- 1 is a cross-tabulation table showing the results obtained by discriminant analysis (using gender data and concentration data of 17 elements) of two groups, a resident control group and an MCI patient group, in an example of the dementia risk assessment method of the present invention.
- 1 is a cross-tabulation table showing the results obtained by discriminant analysis (using gender data and concentration data of 17 elements) of two groups, a resident control group and an AD patient group, in an example of the dementia risk assessment method of the present invention.
- 1 is a cross-tabulation table showing the results obtained by discriminant analysis (using gender data, age data, and concentration data of 17 elements) of two groups, a resident control group and an MCI patient group, in an example of the dementia risk assessment method of the present invention.
- 1 is a cross-tabulation table showing the results obtained by discriminant analysis (using gender data, age data, and concentration data of 17 elements) of two groups, a resident control group and an AD patient group, in an example of the dementia risk assessment method of the present invention.
- 1 is a table showing the standardized discrimination coefficients and their significance of the discriminant functions obtained in the discriminant analysis of two groups, a resident control group and an MCI patient group (using gender data and concentration data of 17 elements), in an example of the dementia risk assessment method of the present invention, and the standardized discrimination coefficients and their significance of the discriminant functions obtained in the discriminant analysis of two groups, a resident control group and an AD patient group (using gender data and concentration data of 17 elements), in an example of the dementia risk assessment method of the present invention.
- 1 is a histogram showing the distribution of discriminant scores obtained by discriminant analysis (using gender data and concentration data of 17 elements) of two groups, a resident control group and an MCI patient group, in an example of the dementia risk assessment method of the present invention.
- FIG. 1 is a histogram showing the sensitivity and specificity obtained by discriminant analysis (using gender data and concentration data of 17 elements) of two groups, a resident control group and an AD patient group, in an example of the dementia risk assessment method of the present invention.
- FIG. 13 is a graph showing ROC curves obtained by discriminant analysis of two groups, a resident control group and an MCI patient group (using gender data and concentration data of 17 elements), and by discriminant analysis of two groups, a resident control group and an AD patient group (using gender data and concentration data of 17 elements), in an example of the dementia risk assessment method of the present invention.
- FIG. 13 is a diagram showing an example of a discriminant used in risk assessment of MCI and AD using a resident control group in an embodiment of the dementia risk assessment method of the present invention.
- FIG. 4 is a graph showing the relationship between the discriminant score and the probability of developing MCI, obtained by discriminant analysis of two groups, a resident control group and an MCI patient group (using the discriminant formula for case (ii) shown in FIG. 39 : F(MCI)), in an example of the dementia risk assessment method of the present invention.
- FIG. 4 is a graph showing the relationship between the discriminant score and the probability of developing AD, obtained by discriminant analysis of two groups, a resident control group and an AD patient group (using the discriminant formula F(AD) for case (ii) shown in FIG. 39 ), in an example of the dementia risk assessment method of the present invention.
- the dementia risk assessment method of the present invention is outlined below.
- blood (plasma or serum) belonging to a case group (dementia patient group) and blood (plasma or serum) belonging to a control group are obtained, and the concentrations of specific element groups contained in each of these bloods (plasma or serum) are measured.
- statistical analysis is performed on the obtained concentration data of the element groups to calculate the correlation between the concentration data.
- a discriminant is obtained based on the correlation thus calculated.
- the concentration data of each of the bloods (plasma or serum) is applied to the discriminant thus obtained to obtain an "indicator" for identifying whether or not a person (subject) who provided each of the blood (plasma or serum) groups belonging to the case group or the control group is suffering from dementia.
- an evaluation result regarding dementia risk is obtained.
- the evaluation result preferably includes an estimate of whether the type of dementia suffered from is MCI or AD, and an estimate of the probability (incidence) of suffering from dementia.
- the inventors first performed the preliminary treatment described below, determined the optimal measurement conditions for measuring the concentrations of the element groups contained in blood (plasma or serum), and selected the evaluation element groups to be used in dementia risk assessment.
- the optimal conditions for measuring the concentrations of elements contained in blood are unknown, or if one wishes to find new optimal conditions, they can be found, for example, as follows. That is, with an MCI patient group and an AD patient group in mind as dementia patient groups, blood (plasma or serum) belonging to the MCI patient group, blood (plasma or serum) belonging to the AD patient group, and blood (plasma or serum) belonging to a hospital control group or a resident control group are obtained.
- the blood (plasma or serum) is randomly divided into two groups based on gender, age, and disease, with one group designated as the "test blood (plasma or serum) group” and the other group designated as the "evaluation blood (plasma or serum) group.”
- each of the test blood (plasma or serum) groups (including blood (plasma or serum) belonging to the MCI patient group, blood (plasma or serum) belonging to the AD patient group, and blood (plasma or serum) belonging to the hospital control group or the resident control group) is mixed with nitric acid and heated to 60°C to 80°C in a sealed container with little metal contamination to decompose proteins and amino acids.
- test blood (plasma or serum) groups are pretreated so as not to interfere with the measurement of element concentrations, and then diluted to a predetermined concentration using ultrapure water without metal contamination to obtain a treated solution.
- concentrations of 75 types of elements contained in each of the treated solutions thus obtained are then measured using ICP mass spectrometry (Inductively-Coupled Plasma Mass Spectroscopy, ICP-MS).
- ICP mass spectrometry Inductively-Coupled Plasma Mass Spectroscopy, ICP-MS.
- the obtained measurement results are then used to find the optimal measurement conditions for measuring the concentrations of the 75 types of elements contained in the test blood (plasma or serum) groups. It goes without saying that instead of this method, the method disclosed in the above-mentioned Patent Document 2 can be used to find optimal conditions.
- ICP mass spectrometry In order to measure the concentration of many different elements as in the present invention, ICP mass spectrometry is preferred. This is because ICP mass spectrometry is the simplest method and is recognized as the method that provides rigorous quantitative measurement results. However, it goes without saying that the method is not limited to ICP mass spectrometry. For example, ICP optical emission spectrometry (Inductively-Coupled Plasma Optical Emission Spectroscopy, ICP-OES), atomic absorption spectrometry (AAS), X-ray fluorescence analysis (XRF), etc. can also be used. Furthermore, it goes without saying that if an analytical method (method for measuring elemental concentration) more suitable than ICP mass spectrometry is developed in the future, an analytical method other than ICP mass spectrometry may be used.
- ICP optical emission spectrometry Inductively-Coupled Plasma Optical Emission Spectroscopy, ICP-OES), atomic absorption spectrometry (AAS), X-ray flu
- the inventors have determined that the highest discriminatory ability can be obtained in the discrimination between the three groups, the MCI patient group, the AD patient group, and the hospital control group or the resident control group, the discrimination between the two groups, the MCI patient group, the hospital control group or the resident control group, and the discrimination between the two groups, the AD patient group, and the hospital control group or the resident control group.
- the evaluation element group to be used in dementia risk assessment is unknown, or when it is desired to select a new evaluation element group, for example, it can be selected as follows. That is, first, under the optimal measurement conditions determined as described above, the same test blood (plasma or serum) group used in "1. Determination of optimal element concentration measurement conditions" is used, and the concentration (content) of the 75 types of element group contained in each of the test blood (plasma or serum) groups is measured by ICP mass spectrometry. Then, for the obtained concentration data, the difference in element concentration between the three groups of MCI patient group (case group), AD patient group (case group), and hospital control group or resident control group (control group) is statistically analyzed. In this analysis, discriminant analysis and binomial logistic regression analysis are performed to clarify the elements involved in the difference in element concentration between these three groups and to determine the risk of developing MCI or AD.
- the combination of elements is taken into consideration, and a combination that produces the greatest difference between the combined elements, i.e., a combination of elements that can best distinguish between the two groups of MCI patient group (case group) and the hospital control group or the resident control group (control group), and a combination of elements that can best distinguish between the two groups of AD patient group (case group) and the hospital control group or the resident control group (control group), can be searched for by changing the combinations again and again using a computer.
- the optimal measurement conditions for measuring the concentration of the element group contained in blood (plasma or serum) were determined, and the evaluation element group used for dementia risk assessment was selected. Therefore, the concentrations of the evaluation element group (17 elements, Na, Mg, P, S, K, Ca, Fe, Co, Cu, Zn, As, Se, Rb, Sr, Mo, Ag, and Cs) contained in the blood (plasma or serum) belonging to the MCI patient group, the blood (plasma or serum) belonging to the AD patient group, and the blood (plasma or serum) belonging to the hospital control group or the resident control group were measured under the optimal concentration measurement conditions, and concentration data (concentration values) of these 17 elements were obtained. Then, a discriminant analysis was performed on the obtained concentration data, and a discriminant equation used for dementia risk assessment was obtained.
- the concentration data of the evaluation element group of the blood (plasma or serum) belonging to the MCI patient group, AD patient group, and hospital control group or resident control group was applied to the discriminant formula to calculate the discriminant score.
- the discriminant score obtained in this way can be used as an "index" for predicting the risk of dementia of the person (subject). For example, if the discriminant score is above or below a predetermined reference value (e.g., 0), it can be determined that all of the people (subjects) who provided the evaluation blood (plasma or serum) group corresponding to the discriminant score belong to the case group, and if the discriminant score is above or below the reference value, it can be determined that they belong to the control group.
- a predetermined reference value e.g. 0
- an assessment result of the person's (subject's) risk of developing dementia is obtained, and it is preferable that the assessment result includes information indicating whether the dementia is AD or MCI. It is also preferable that the assessment result includes the probability of developing dementia (AD or MCI).
- the test blood (plasma or serum) group is used from the determination of the optimal measurement conditions to the generation of the discriminant equation.
- the concentration of the evaluation element group is measured for the evaluation blood (plasma or serum) group to obtain concentration data.
- the concentration data of the evaluation blood (plasma or serum) group thus obtained is then applied to the discriminant. In this way, the discriminant score can be calculated.
- the process is the same as when the obtained blood (plasma or serum) belonging to the MCI patient group, AD patient group, hospital control group, or resident control group is not divided into the test blood (plasma or serum) group and the evaluation blood (plasma or serum) group.
- test was conducted to examine the difference in the population means between the two groups, the hospital control group and the MCI patient group. This was to examine the extent to which the evaluation element group, consisting of the 17 elements mentioned above, affects the discrimination between these two groups.
- the test results showed differences between the two groups for each element alone, but this analysis ignored the relationship between elements, and it was found that there were many problems with using this for risk assessment of cases. For this reason, it was found that it was necessary to solve the above problems by performing an analysis using "discriminant analysis," a type of multivariate analysis that can take into account the relationship between elements.
- a discriminant was obtained as follows. This is to analyze the concentration balance (correlation) between the evaluation element group. Since the concentration of each element in the evaluation element group varies from person to person and is difficult to use as an index, the correlation between the concentrations of the evaluation element group was obtained.
- the discriminant function can generally be expressed as the following formula (1).
- Discriminant score (D) function (F) (explanatory variables 1 to n, discriminant coefficients 1 to n) (1) (where n is an integer of 2 or more)
- the discriminant function of formula (1) can be written as the following formula (2) taking into consideration the weights (degrees of influence on discrimination) of the explanatory variables 1 to n.
- Discrimination score (D) (discrimination coefficient 1) ⁇ (explanatory variable 1) + (Discrimination coefficient 2) ⁇ (Explanatory variable 2) + ...
- This discriminant equation is for MCI patients, but it could be easily obtained by loading the concentration values (concentration data) of these 17 elements into a known discriminant analysis program (e.g., SAS, SPSS) on a known computer.
- the discriminant score (D) is obtained by applying the concentration values (concentration data) of the blood (plasma or serum) group for evaluation to the discriminant on the computer. If the discriminant score (D) is equal to or less than (or equal to) a reference value (e.g., 0), the subject is determined to belong to the MCI patient group (case group), and if the discriminant score (D) is equal to or more than (or less than) the reference value, the subject is determined to belong to the hospital control group (control group).
- a reference value e.g. 0
- the hospital control group and the AD patient group by loading the concentration values (concentration data) of the 17 element groups into the discriminant analysis program on the computer, a discriminant equation for AD patients can be easily obtained.
- the discriminant score (D) is obtained by applying the concentration values (concentration data) of the evaluation blood (plasma or serum) group to the discriminant on the computer. If the discriminant score (D) is equal to or less than (or equal to) a reference value (e.g., 0), the subject is determined to belong to the AD patient group (case group), and if the discriminant score (D) is equal to or more than (or less than) the reference value, the subject is determined to belong to the hospital control group (control group).
- a reference value e.g. 0
- the concentration data (concentration values) of the evaluation blood (plasma or serum) group was applied to the discriminant for MCI patients obtained by the above-mentioned discriminant analysis (using the hospital control group), a discriminant score was obtained, and a judgment was made as to whether the subject belonged to the MCI patient group or the hospital control group, with good prediction results.
- concentration data of the evaluation blood (plasma or serum) group was applied to the discriminant for AD patients obtained by the above-mentioned discriminant analysis (using the hospital control group), a discriminant score was obtained, and a judgment was made as to whether the subject belonged to the AD patient group or the hospital control group, with good prediction results.
- a discriminant for MCI patients can be easily obtained for the two groups, the resident control group and the MCI patient group, in the same way as described above for the two groups, the hospital control group and the MCI patient group.
- the discriminant score (D) is obtained by applying the concentration values (concentration data) of the blood (plasma or serum) group for evaluation to the discriminant on the computer. If the discriminant score (D) is equal to or less than (or equal to) a reference value (e.g., 0), the subject is determined to belong to the MCI patient group (case group), and if the discriminant score (D) is equal to or more than (or less than) the reference value, the subject is determined to belong to the resident control group (control group).
- a reference value e.g. 0
- a discriminant equation for AD patients can be easily obtained in the same manner as described above for the two groups, the hospital control group and the AD patient group.
- the discriminant score (D) is obtained by applying the concentration values (concentration data) of the evaluation blood (plasma or serum) group to the discriminant on the computer. If the discriminant score (D) is equal to or less than (or equal to) a reference value (e.g., 0), the subject is determined to belong to the AD patient group (case group), and if the discriminant score (D) is equal to or more than (or less than) the reference value, the subject is determined to belong to the resident control group (control group).
- a reference value e.g. 0
- the concentration data (concentration values) of the evaluation blood (plasma or serum) group was applied to the discriminant for MCI patients obtained by the above-mentioned discriminant analysis (using the resident control group), a discriminant score was obtained, and a judgment was made as to whether the subject belonged to the MCI patient group or the resident control group, with good prediction results.
- concentration data of the evaluation blood (plasma or serum) group was applied to the discriminant for AD patients obtained by the above-mentioned discriminant analysis (using the resident control group), a discriminant score was obtained, and a judgment was made as to whether the subject belonged to the AD patient group or the resident control group, with good prediction results.
- the incidence rate is generally given by the following formula (3) using the discriminant score (D) obtained by the above-mentioned discriminant analysis.
- Incidence rate 1/[1 + exp(-discrimination score)] (3) Since the incidence rate can be obtained using the discriminant score (D) according to formula (3), it is possible to obtain the probability (incidence rate of MCI or AD) that the subject falls into the case group (MCI patient group or AD patient group). In other words, the subject can know his/her current dementia risk in terms of probability.
- the discriminant score (D) obtained by discriminant analysis of two groups the hospital control group (or resident control group) (control group) and the MCI patient group (case group), to the above formula (3), the probability that the subject falls into the MCI patient group (MCI incidence rate) is given.
- the discriminant score (D) obtained by discriminant analysis of two groups the hospital control group (or resident control group) (control group) and the AD patient group (case group), to the above formula (3), the probability that the subject falls into the AD patient group (AD incidence rate) is given.
- the discriminant score (D) obtained by applying the concentration data of the evaluation blood (plasma or serum) group to the discriminant formula for MCI patients or the discriminant formula for AD patients was applied to the formula (3) obtained by the binomial logistic regression analysis to obtain the probability of developing MCI or AD, and good prediction results were obtained.
- the dementia risk assessment method of the present invention uses the 17 elements (Na, Mg, P, S, K, Ca, Fe, Cu, Zn, Se, Rb, Sr, As, Mo, Cs, Co, Ag) selected in the above-mentioned preliminary processing as an "assessment element group", measures the concentrations of these 17 elements contained in the blood (plasma or serum) of an unknown subject under the optimal measurement conditions determined in the above-mentioned preliminary processing, and applies the obtained concentration data (concentration values) of the 17 elements to a discriminant function to calculate the correlation between the concentrations of the evaluation element group.
- 17 elements Na, Mg, P, S, K, Ca, Fe, Cu, Zn, Se, Rb, Sr, As, Mo, Cs, Co, Ag
- an index is generated for identifying whether or not the subject is suffering from dementia, and the dementia risk of the subject is evaluated based on the index to create an assessment result.
- a discriminant equation is generated, and by applying the concentration data of the evaluation element group present in the blood (plasma or serum) of an unknown subject to the discriminant equation, an evaluation result of whether or not the unknown subject suffers from dementia (MCI or AD) can be obtained.
- the control group used in the discriminant analysis is selectively either subjects belonging to a "hospital control group", i.e., outpatients (patients) who visited a neurology department, neuropsychiatry department, psychotherapy department, or general internal medicine department at a specific hospital group, or subjects belonging to a "resident control group", i.e., general residents who are not patients.
- a "hospital control group” i.e., outpatients (patients) who visited a neurology department, neuropsychiatry department, psychotherapy department, or general internal medicine department at a specific hospital group
- a "resident control group” i.e., general residents who are not patients.
- MMSE Mini-Mental State Examination
- a "hospital control group” when used as a case group in the dementia risk assessment method of the present invention, the method is presumed to be suitable for use as an "auxiliary diagnosis in dementia diagnosis" in medical institutions for patients who visit the outpatient departments of neurology, neuropsychiatry, psychotherapy, or general internal medicine of a medical institution such as a hospital and have some subjective symptoms or anxiety that suggests dementia.
- a "resident control group” when used as a case group in the dementia risk assessment method of the present invention, the method is presumed to be suitable for use as a "dementia risk screening method" for the general population other than the patients, or as an objective means of dementia risk assessment for the general population.
- blood (plasma or serum) collected from an unknown subject is placed in a container such as a test tube 1 to obtain a blood (plasma or serum) sample 2.
- the blood (plasma or serum) sample 2 is then placed in an appropriate analytical device (preferably, but not limited to, an ICP mass spectrometer) and analyzed to measure the concentrations of the 17 elements that constitute the group of elements for evaluation present in the blood (plasma or serum) sample 2.
- concentration data (concentration values) of the group of elements for evaluation contained in the blood (plasma or serum) sample 2 is obtained (step S1).
- the group of evaluation elements whose concentrations are to be measured is a combination of the 17 elements mentioned above (Na, Mg, P, S, K, Ca, Fe, Co, Cu, Zn, As, Se, Rb, Sr, Mo, Ag, Cs), and these 17 elements were selected as the combination of elements that can best distinguish between the two groups, the case group (dementia patient group, specifically, MCI patient group or AD patient group) and the control group (hospital control group or resident control group) (i.e., the combination has the highest discriminatory ability).
- the concentration data of the evaluation element group (17 types: Na, Mg, P, S, K, Ca, Fe, Co, Cu, Zn, As, Se, Rb, Sr, Mo, Ag, Cs) obtained in step S1 is applied to a discriminant function to determine whether the subject belongs to a case group (dementia patient group, specifically, MCI patient group or AD patient group) or a control group (hospital control group or resident control group), and the correlation between the 17 concentration data of the evaluation element group is calculated (step S2).
- a discriminant function to determine whether the subject belongs to a case group (dementia patient group, specifically, MCI patient group or AD patient group) or a control group (hospital control group or resident control group)
- the correlation between the 17 concentration data of the evaluation element group is calculated (step S2).
- the concentration data of the 17 elements for evaluation obtained in step S1 is read into the discriminant analysis program.
- the 17 concentration data (concentration values) of the elements for evaluation obtained in step S1 are applied to explanatory variables 1 to 17 of the discriminant function, respectively, and the 17 discriminant coefficient values obtained in the discriminant analysis described above are applied to discriminant coefficients 1 to 17 of the discriminant function, respectively.
- the risk of developing MCI can be evaluated.
- the risk of developing AD can be evaluated.
- the discriminant function used here is a discriminant function prepared for the case where a "resident control group” is used as the control group, and is different from the discriminant function prepared for the case where a "hospital control group” is used as the control group.
- the concentration data of the 17 elements for evaluation obtained in step S1 and the gender data of the unknown subject are read into the discriminant analysis program.
- the 17 concentration data (concentration values) of the elements for evaluation obtained in step S1 and the gender data of the unknown subject are applied to explanatory variables 1 to 18 of the discriminant function, respectively, and the 18 discriminant coefficient values obtained in the discriminant analysis described above are applied to discriminant coefficients 1 to 18 of the discriminant function, respectively.
- an index is generated for identifying whether or not the subject suffers from dementia based on the correlations calculated in step S2 between the 17 concentration data of the evaluation element group, or between the 17 concentration data of the evaluation element group and one piece of gender data, totaling 18 pieces of data (step S3).
- step S2 when a "hospital control group” is used as the control group, for example, in step S2, the discriminant analysis program to which the 17 concentration data (concentration values) of the evaluation element group obtained in step S1 and the 17 discrimination coefficient values obtained in the above-mentioned discriminant analysis are applied obtains a discriminant score (D).
- step S2 the discriminant analysis program to which the 18 data, 17 concentration data (concentration values) of the evaluation element group obtained in step S1 and one gender data, and the 18 discrimination coefficient values obtained in the above-mentioned discriminant analysis are applied obtains a discriminant score (D).
- the discriminant score (D) thus obtained can be used as an "index" for identifying whether or not the unknown subject (the person requesting the cognitive risk assessment) suffers from dementia (MCI or AD). Based on the discriminant score (D) as the index, the subject's risk of suffering from dementia (MCI or AD) can be estimated.
- the risk of dementia is predicted by comparing the discriminant score (D) with a predetermined reference value (e.g., 0). In other words, if the discriminant score (D) is equal to or greater than (or less than) the reference value, the subject is determined to belong to the case group (MCI patient group or AD patient group). This means that the subject (the requester) is predicted to be suffering from dementia (MCI or AD). On the other hand, if the discriminant score (D) is equal to or less than (or greater than) the reference value, the subject is determined to belong to the control group (hospital control group or resident control group). This means that the subject (the requester) is predicted to be free of dementia (MCI or AD).
- a predetermined reference value e.g., 0
- the estimation in step S3 provides the subject's (the requester's) risk of developing dementia (MCI or AD) as an assessment result.
- the discriminant used in step S2 differs depending on the type of dementia (MCI or AD), and therefore, the type of dementia (MCI or AD) that the subject (the requester) is suspected to suffer from is also determined depending on whether the discriminant used in the dementia risk assessment is for MCI or AD.
- the type of dementia that the subject (the requester) is suspected to suffer from thus determined is preferably included in the assessment result.
- the specific element (selected from the 17 elements in the group of elements for evaluation) that is significant for distinguishing between the case group and the control group differs depending on the type of dementia (MCI or AD), and therefore, depending on whether the element that is significant for distinguishing corresponds to MCI or AD, the type of dementia (MCI or AD) that the subject (the requester) is suspected to be suffering from is also determined.
- the type of dementia that the subject (the requester) is suspected to be suffering from thus determined is preferably included in the assessment result.
- a discriminant score-incidence rate relationship can be prepared in advance based on the results of the binomial logistic regression analysis described above (see Figures 21 and 22).
- the discriminant score (D) obtained in step S3 with the discriminant score-incidence rate relationship, it is possible to assess the dementia risk of the subject (the requester) suspected of having dementia based on its incidence rate (incidence probability).
- the incidence rate of dementia that is suspected to be suffered by the subject (the requester) thus determined is preferably included in the assessment result.
- the discriminant score (D) as an index can be obtained simply by loading the 17 concentration data of the evaluation element group obtained from the subject (the requester) obtained in step S1, or the 17 concentration data and the gender data of one of the subjects (the requester), a total of 18 data, into the discriminant analysis program, and the evaluation result of dementia risk can be obtained immediately based on the discriminant score (D).
- a discriminant analysis program e.g., SAS, SPSS
- the evaluation result regarding whether the requester is suffering from dementia is provided to the requester.
- the evaluation results will be provided to the subject (the requester) along with a statement of that fact, along with the probability (incidence rate) of dementia.
- FIG. 2 The basic configuration of the dementia risk assessment system 10 of the present invention is shown in Figure 2. This system 10 is for implementing the dementia risk assessment method of the present invention described above.
- the dementia risk assessment system 10 of the present invention comprises a data storage unit 11, a calculation unit 12, and an index generation unit 13.
- An element group concentration measurement unit 5 is provided outside the dementia risk assessment system 10, and a blood (plasma or serum) sample 2 taken from a subject (requester) is placed in a test tube 1 to measure the concentration of an evaluation element group (17 elements: Na, Mg, P, S, K, Ca, Fe, Co, Cu, Zn, As, Se, Rb, Sr, Mo, Ag, and Cs) in the blood (plasma or serum) sample 2.
- the concentration data of the evaluation element group in the blood (plasma or serum) obtained by the element group concentration measurement unit 5 in this way is supplied to and stored in the data storage unit 11 of the dementia risk assessment system 10.
- a known ICP mass spectrometer is used as the element group concentration measurement unit 5, but this is not limited to this. It goes without saying that an ICP emission spectrometer, an atomic absorption spectrometer, an X-ray fluorescence spectrometer, etc. can also be used.
- the data storage unit 11 is a part that stores (preserves) a total of 18 pieces of data, namely, concentration data of the 17 elements in the element group for evaluation of the subject (the requester) obtained by the element group concentration measurement unit 5, or the concentration data of the 17 elements in the element group for evaluation and the gender data of the subject (the requester), and is typically composed of a known storage device (e.g., semiconductor memory or magnetic memory). Any storage device with any configuration that can store concentration data can be used as the data storage unit 11.
- the calculation unit 12 is a part that performs the calculations required to derive correlations between the 17 concentration data of the evaluation element group stored in the data storage unit 11, or the calculations required to derive correlations between the concentration data and the gender data using a total of 18 data, the 17 concentration data of the evaluation element group and the gender data, stored in the data storage unit 11.
- the calculation unit 12 is usually configured using a known discriminant analysis program, but is not limited to this. It may be configured with a program created to include the functions of the discriminant analysis program. In short, it is sufficient if it can execute the necessary calculations described above, and the configuration is not important.
- the calculation unit 12 reads out the concentration data of 17 elements for evaluation (17 elements: Na, Mg, P, S, K, Ca, Fe, Co, Cu, Zn, As, Se, Rb, Sr, Mo, Ag, Cs) stored in the data storage unit 11, applies the data to a discriminant function for determining whether the subject belongs to a case group (dementia patient group, specifically, MCI patient group or AD patient group) or a control group (hospital control group), and calculates the correlation between the concentration data of the 17 elements for evaluation.
- 17 elements for evaluation 17 elements: Na, Mg, P, S, K, Ca, Fe, Co, Cu, Zn, As, Se, Rb, Sr, Mo, Ag, Cs
- the calculation unit 12 reads out the concentration data of the 17 evaluation element groups and the gender data (i.e., a total of 18 data) stored in the data storage unit 11, applies them to a discriminant function to determine whether the subject belongs to a case group (dementia patient group, specifically, MCI patient group or AD patient group) or a control group (resident control group), and calculates the correlation between the 18 data.
- the concentration data of the 17 elements for evaluation stored in the data storage unit 11 is read into the discriminant analysis program of the calculation unit 12.
- the 17 concentration data (concentration values) of the elements for evaluation read from the data storage unit 11 are applied to explanatory variables 1 to 17 of the discriminant function, respectively, and the 17 discriminant coefficient values obtained in the discriminant analysis described above are applied to discriminant coefficients 1 to 17 of the discriminant function, respectively.
- the 17 concentration data of the evaluation element group and the gender data i.e., a total of 18 pieces of data stored in the data storage unit 11 are read into the discriminant analysis program of the calculation unit 12.
- the 17 concentration data (concentration values) of the evaluation element group read from the data storage unit 11 are applied to explanatory variables 1 to 17 of the discriminant function, respectively, and the 17 discrimination coefficient values obtained in the above-mentioned discriminant analysis are applied to discrimination coefficients 1 to 17 of the discriminant function, respectively.
- the gender data is applied to explanatory variable 18 of the discriminant function, and the remaining one discrimination coefficient value obtained in the above-mentioned discriminant analysis is applied to discrimination coefficient 18 of the discriminant function.
- the risk of developing MCI can be assessed by applying the 17 discrimination coefficient values of the discriminant equation for MCI patients obtained by the discriminant analysis described above to the discriminant function.
- the risk of developing AD can be assessed by applying the 17 discrimination coefficient values of the discriminant equation for AD patients obtained by the discriminant analysis described above to the discriminant function.
- the risk of developing MCI can be assessed by applying the 18 discrimination coefficient values of the discriminant equation for MCI patients obtained by the discriminant analysis described above to the discriminant function.
- the risk of developing AD can be assessed by applying the 18 discrimination coefficient values of the discriminant equation for AD patients obtained by the discriminant analysis described above to the discriminant function.
- the index generating unit 13 is a part that generates an index for identifying whether or not the subject suffers from dementia based on the calculation result output from the calculation unit 12, i.e., the correlation between the 17 concentration data of the evaluation element group, or the correlation between the 17 concentration data of the evaluation element group and the gender data (a total of 18 data), and outputs the index to the outside of the dementia risk assessment system 10.
- the index generating unit 13 is usually configured with a program created to realize its function, but is not limited to this. Since the function of the index generating unit 13 is closely related to the function of the calculation unit 12, the index generating unit 13 may be configured with a program created to utilize the function of the discriminant analysis program that constitutes the calculation unit 12.
- the functions of the calculation unit 12 and the index generating unit 13 are realized by a single program, in other words, the calculation unit 12 and the index generating unit 13 are configured integrally. In short, it is sufficient that the above-mentioned function of the index generating unit 13 can be realized, and the configuration is not important.
- the index generating unit 13 applies the 17 concentration data of the evaluation element group read from the data storage unit 11 to the discriminant (MCI discriminant and/or AD discriminant) derived by the calculation unit 12, and calculates the discriminant score (D).
- the index generating unit 13 applies a total of 18 data, including the 17 concentration data of the evaluation element group read from the data storage unit 11 and the gender data, to the discriminant (MCI discriminant and/or AD discriminant) derived by the calculation unit 12, and calculates the discriminant score (D).
- the discriminant score (D) thus obtained is an "index” for identifying whether the subject suffers from dementia (MCI or AD). Based on the discriminant score (D) as the index, the subject's risk of suffering from dementia (MCI or AD) can be estimated.
- the index generating unit 13 infers the risk of dementia by comparing the discriminant score (D) with a predetermined reference value (e.g., 0). That is, if the discriminant score (D) is equal to or greater than (or less than) the reference value, the index generating unit 13 judges that the subject (the client) belongs to the case group (MCI patient group or AD patient group). This means that it is inferred that "the subject (the client) is suffering from dementia (MCI or AD)". On the other hand, if the discriminant score (D) is equal to or less than (or greater than) the reference value, it is judged that the subject (the client) belongs to the control group (hospital control group or resident control group). This means that it is inferred that "the subject (the client) is not suffering from dementia (MCI or AD)".
- a predetermined reference value e.g., 0
- the discriminant used in the calculation unit 12 differs depending on the type of dementia (MCI or AD), and therefore, depending on whether the discriminant used in the dementia risk assessment is for MCI or AD, the type of dementia (MCI or AD) that the subject (the requester) is suspected to be suffering from is also determined.
- the type of dementia that the subject (the requester) is suspected to be suffering from thus determined is preferably included in the assessment result.
- the specific element (selected from the 17 elements in the group of elements for evaluation) that is significant for distinguishing between the case group and the control group differs depending on the type of dementia (MCI or AD), so there is an advantage in that the type of dementia (MCI or AD) that the subject (the client) is suspected to be suffering from can also be determined depending on whether the element that is significant for discrimination corresponds to MCI or AD.
- the type of dementia that the subject (the client) is suspected to be suffering from thus determined is preferably included in the assessment result.
- a discriminant score-incidence rate relationship can be prepared in advance based on the results of the binomial logistic regression analysis described above and stored in the calculation unit 12 or the index generation unit 13 or other storage part (not shown) (see Figures 21, 22, 40, and 41).
- the discriminant score (D) obtained by the index generation unit 13 with the discriminant score-incidence rate relationship read from the calculation unit 12 or the index generation unit 13 or other storage part, it is possible to evaluate the dementia risk of the subject (the requester) suspected to be suffering from dementia based on its incidence rate (probability of dementia).
- the incidence rate of dementia suspected to be suffered by the subject (the requester) thus determined is preferably included in the evaluation result.
- the dementia risk assessment system 10 of the present invention having the above configuration and functions can be realized, for example, by using a known personal computer, but is not limited to this. Needless to say, any other computer may be used.
- a computer with a known discriminant analysis program e.g., SAS, SPSS
- the 17 or 18 discriminant coefficient values of the above-mentioned discriminant formula for MCI patients or discriminant formula for AD patients are applied in advance to the discriminant coefficients 1 to 17 or the discriminant coefficients 1 to 18 of the discriminant function, then a discriminant score (D) as an index can be obtained simply by loading the 17 concentration data of the evaluation element group of the subject (the requester), or the 17 concentration data and the gender data, a total of 18 data. Based on the discriminant score (D), an evaluation result of dementia risk can be immediately obtained.
- a discriminant analysis program e.g., SAS, SPSS
- the risk of developing dementia is calculated by analyzing the pattern of the concentrations of the evaluation elements (17 elements: Na, Mg, P, S, K, Ca, Fe, Co, Cu, Zn, As, Se, Rb, Sr, Mo, Ag, Cs) in blood (plasma or serum) collected from a subject, and a result that probabilistically expresses the possibility of dementia based on the risk is submitted.
- the evaluation elements 17 elements: Na, Mg, P, S, K, Ca, Fe, Co, Cu, Zn, As, Se, Rb, Sr, Mo, Ag, Cs
- a predetermined amount e.g., 0.5 cc
- blood plasma or serum
- concentration of the evaluation elements is measured at a testing institution.
- an institution such as a risk assessment center (tentative name) calculates the dementia risk.
- the calculation result of the dementia risk is sent to the blood collection institution, which then gives it to the subject (examinee). If dementia is suspected, for example, the blood collection institution recommends that the subject undergo a "current dementia screening.”
- personal information is encrypted or numbered sequentially at the blood collection institution, and the system does not allow personal information to reach the testing institution or risk assessment center.
- the number of subjects for which dementia risk was evaluated was 27 men and 38 women in the case group (MCI patient group), totaling 65 MCI patients, as shown in FIG. 3.
- the other case group (AD patient group) had 18 men and 32 women, totaling 50 AD patients. Many of the MCI and AD patients were elderly.
- the control group hospital control group
- the total number of subjects in these three groups was 165, but the gender was 38.2% men and 61.8% women, with no difference between the three groups.
- the subjects in these three groups were divided into five age groups: 50s, 60s, 70s, 80s, and 90s.
- the serum samples used in the following Examples 1 and 2 were provided by each of the 165 subjects mentioned above, all of which were provided as "NCGM Biobank samples collected at the National Center for Global Health and Medicine."
- the subjects in the above-mentioned control group hospital control group
- serum was used in the following Examples 1 and 2, it is also possible to use plasma instead of serum, since the elemental components of serum and plasma are similar.
- Examples 3 and 4 therefore, from among the general population who underwent health checkups at specific medical institutions within a specified period, residents who were determined to be at no risk of dementia based on the Mini-Mental State Examination (MMSE) were selected to form a "resident control group.” Then, instead of subjects belonging to the "hospital control group” used in Examples 1 and 2, subjects belonging to this "resident control group” were used to carry out discriminant analysis and binomial logistic regression analysis in a manner similar to that of Examples 1 and 2.
- MMSE Mini-Mental State Examination
- 846 candidates (251 men and 595 women) excluding these 64 suspected candidates were selected as subjects to belong to the "resident control group".
- the total number of subjects belonging to the "resident control group” selected in this way was 846 (251 men, 595 women), of which 29.7% were men and 70.3% were women. They were also divided into four age groups: 50s, 60s, 70s, and 80s.
- serum samples were used from each of the 165 subjects (three groups: MCI patient group, AD patient group, and hospital control group) used in Examples 1 and 2, as well as serum samples from each of the 846 subjects in the "resident control group" mentioned above.
- serum is used in the following Examples 3 and 4, but as in Examples 1 and 2, it is also possible to use plasma instead of serum.
- the concentration of the evaluation element group contained in the 165 serum samples provided by each of the 165 subjects was measured.
- the concentration measurements were performed under the measurement conditions described in "1. Determination of optimal measurement conditions” above.
- the 17 elements used in the “cancer risk evaluation method” of Patent Document 2 above namely Na, Mg, P, S, K, Ca, Fe, Co, Cu, Zn, As, Se, Rb, Sr, Mo, Ag, and Cs, were used as the evaluation element group.
- the 17 elements used in the “cancer risk evaluation method” of Patent Document 2 above namely Na, Mg, P, S, K, Ca, Fe, Co, Cu, Zn, As, Se, Rb, Sr, Mo, Ag, and Cs, were used as the evaluation element group.
- the 17 elements used in the “cancer risk evaluation method” of Patent Document 2 above namely Na, Mg, P, S, K, Ca, Fe, Co, Cu, Zn, As, Se, Rb, Sr, Mo, Ag, and Cs, were used
- these 17 elements selected as the evaluation element group were obtained by searching by computer for a combination of elements that can best distinguish between the two groups, the MCI patient group and the hospital control group (having the highest discrimination ability), and a combination of elements that can best distinguish between the two groups, the AD patient group and the hospital control group (having the highest discrimination ability).
- concentrations of the above-mentioned evaluation element group contained in serum samples from two groups, the MCI patient group and the hospital control group, were measured by ICP mass spectrometry.
- concentrations of the "evaluation element group" contained in serum samples from two groups, the AD patient group and the hospital control group were measured in the same manner. The results are shown in Figure 4.
- the concentration comparison table in Figure 4 shows the average concentrations of the 17 elements in the evaluation element group in serum samples belonging to the three groups: the hospital control group, the MCI patient group, and the AD patient group.
- the 17 elements in the evaluation element group six elements, Na, S, Ca, Cu, Mo, and Rb, showed large differences in average concentrations (average concentration differences) between the two groups, the hospital control group and the MCI group.
- Na (P ⁇ 0.05), S (P ⁇ 0.01), Ca (P ⁇ 0.01), Cu (P ⁇ 0.05), and Mo (0.05) showed high discrimination significance
- Rb (0.01) showed low significance.
- Figure 5 is a radar chart showing the ratio of the average concentration of the 17 elements in the evaluation element group for each element in the MCI patient group and the AD patient group.
- Figure 5 shows the concentration ratio when the hospital control group is used as the standard, that is, when the concentration data value of the hospital control group is set to 1.
- Figure 9 shows the distribution of the discriminant scores obtained for the three groups.
- the distributions of the discriminant scores for these three groups overlap in the center, which suggests that discrimination may not have been sufficient. Therefore, the results obtained by discriminant analysis of these three groups were collated and compiled in the cross-tabulation table shown in Figure 10.
- the results of the discriminant analysis of the three groups showed that the specificity of the hospital control group was 76.0% (38/50), the sensitivity of the MCI patient group was 69.2% (45/65), and the sensitivity of the AD patient group was 60.0% (30/50).
- the accuracy rate of the three groups overall was 68.5% (113/165).
- Figure 11 shows the discrimination coefficients of the two discriminant functions (discriminant functions 1 and 2) used in the discriminant analysis of the three groups and their significance. From this figure, it was found that the three elements that were significant in discriminating between the three groups were Ca (P ⁇ 0.01), Rb (P ⁇ 0.01), and Mo (P ⁇ 0.05).
- the hospital control group and the MCI patient group In the discriminant analysis of the two groups, the hospital control group and the MCI patient group, the subjects for which the risk of developing MCI was estimated were, as shown in FIG. 3, a case group (MCI patient group) of 27 men and 38 women, a total of 65 people, and a control group (hospital control group) of 18 men and 32 women, a total of 50 people, and the serum samples of these subjects were used as the evaluation subjects.
- the data used for the evaluation were concentration data of 17 elements (Na, Mg, P, S, K, Ca, Fe, Co, Cu, Zn, As, Se, Rb, Sr, Mo, Ag, Cs) selected as the evaluation element group.
- the hospital control group and the MCI patient group were used as the objective variables, as in the discriminant analysis between the three groups, and the concentration data of the 17 elements of the evaluation element group obtained from the serum samples of the subjects were used as 17 explanatory variables.
- FIG 14 shows the discrimination coefficients of the discriminant equation obtained by discriminant analysis and their significance. From this figure, it was found that the four elements Ca (P ⁇ 0.01), Zn (P ⁇ 0.05), Rb (P ⁇ 0.01), and Mo (P ⁇ 0.05) were significant for discrimination.
- the discrimination coefficients of the discriminant equation used here are as shown in Figure 14, and the overall structure of the discriminant equation is shown in Figure 20 as the formula "F(MCI)."
- Figure 12 is a histogram showing the frequency distribution of the discriminant scores calculated by discriminant analysis. It can be seen from this figure that the majority of the discriminant scores of the hospital control group are distributed in the left region of the figure, while the majority of the discriminant scores of the MCI patient group are distributed in the right region of the figure; in other words, they are separated left and right near the point (position) where the discriminant score value is 0.0. It was also found that in the region close to the point (position) where the discriminant score value is 0.0, the discriminant scores of the case group (MCI patient group) and the control group (hospital control group) are mixed.
- Figure 13 shows the sensitivity and specificity obtained by the discriminant analysis.
- Figure 18 shows an ROC (Receiver Operating Characteristic) curve.
- This ROC curve was obtained by sequentially varying the discriminant score obtained in the two-group discriminant analysis in Example 1 from the lowest value to the highest value, and calculating the sensitivity and specificity at any time from the number of samples classified into the control group (hospital control group) and the number of samples classified into the case group (MCI patient group), and the area below the curve allows the suitability of the discrimination (prediction) to be evaluated.
- ROC Receiveiver Operating Characteristic
- Example 1 When the Area Under the Curve (AUC) was calculated using the ROC curve in Figure 18, a high value of 0.9462 was obtained, as shown in the figure. The closer the AUC value, which indicates the goodness of discrimination, is to 1, the more accurate the judgment is, so the value of 0.9462 obtained in Example 1 indicated that the discrimination (prediction) between the two groups in Example 1 was performed very accurately. Therefore, it was found that the method of Example 1 is sufficiently effective as a tool for diagnosing the risk of MCI.
- AUC Area Under the Curve
- FIG. 21 is a graph showing the relationship between the discriminant score obtained in the two-group discriminant analysis in Example 1 and the probability that the subject suffers from MCI (discriminant score-MCI incidence relationship).
- This graph was obtained by performing a binomial logistic regression analysis using the discriminant score obtained in the discriminant analysis. According to this graph, the larger the negative value of the discriminant score, the higher the probability (risk) of MCI. For example, if the discriminant score is approximately -2.1 or less, it can be evaluated that "the subject is suspected to have MCI with a probability of 90% or more.” Conversely, for example, if the discriminant score is approximately +2.1 or more, the incidence probability is 10% or less, and it can be evaluated that "the subject is suspected not to have MCI.”
- the discriminant equation (F(MCI)) for assessing the risk of developing MCI calculated by the two-group discriminant analysis in Example 1 is shown in Figure 20.
- the method for assessing the risk of developing MCI using this discriminant equation can be used as an auxiliary when diagnosing dementia in outpatients at the neurology, neuropsychiatry, psychotherapy, or general internal medicine departments of medical institutions such as hospitals. If this is realized, it is expected that early detection of MCI in the subject will make it easier to select a treatment method to suppress the progression of MCI.
- Example 1 it was determined that the discriminant functions 1 and 2 (discriminant functions 1 and 2 shown in FIG. 11) used in the discriminant analysis of the three groups, the hospital control group, the MCI patient group, and the AD patient group, did not provide a sufficient accuracy rate, so a discriminant analysis was performed on the two groups, the hospital control group and the MCI patient group.
- Example 2 a discriminant analysis was performed on the two groups, the hospital control group and the AD patient group, using serum samples belonging to the same hospital control group as in Example 1 above, together with serum samples belonging to the AD patient group.
- FIG 17 shows the discrimination coefficients of the discriminant equation obtained by discriminant analysis and their significance. From this figure, it was found that the three elements Mg (P ⁇ 0.05), Ca (P ⁇ 0.01), and Rb (P ⁇ 0.05) were significant for discrimination. This is clearly different from Example 1 above.
- the discrimination coefficients of the discriminant equation used here are as shown in Figure 17, and the overall structure of the discriminant equation is shown in Figure 20 as the formula "F(AD)".
- Figure 15 is a histogram showing the frequency distribution of the discriminant scores calculated by discriminant analysis. From this figure, it can be seen that most of the discriminant scores of the hospital control group are distributed in the right region of the figure, and most of the discriminant scores of the AD patient group are distributed in the left region of the figure, in other words, they are divided into left and right near the point (position) where the discriminant score value is 0.0. It was also found that the discriminant scores of the case group (AD patient group) and the control group (hospital control group) are mixed in the region close to the point (position) where the discriminant score value is 0.0. However, in Example 2, the distribution location of the hospital control group is the right region, while in the above Example 1, it is the left region, so the two are different in that the distribution location of the hospital control group in Example 2 is the left-right opposite to that in the above Example 1.
- Figure 16 shows the sensitivity and specificity obtained by the discriminant analysis.
- FIG. 19 shows the ROC curve obtained in the discriminant analysis of the two groups, the hospital control group and the AD patient group, in Example 2.
- AUC area under the ROC curve
- AUC area under the ROC curve
- FIG. 22 is a graph showing the relationship between the discriminant score obtained in the two-group discriminant analysis in Example 2 and the probability that the subject has AD (discriminant score-AD incidence relationship).
- This graph was obtained by performing a binomial logistic regression analysis using the discriminant score obtained in the discriminant analysis, as in Example 1 above. According to this graph, as in Example 1 above, the greater the negative value of the discriminant score, the higher the probability (risk) of AD. For example, if the discriminant score is approximately -2.2 or less, it can be evaluated that "the subject is suspected to have AD with a probability of 90% or more.” Conversely, for example, if the discriminant score is approximately +2.2 or more, the incidence probability is 10% or less, and it can be evaluated that "the subject is suspected not to have AD.”
- the discriminant equation (F(AD)) for assessing the risk of developing AD calculated by the two-group discriminant analysis in Example 2 is shown in Figure 20.
- the method for assessing the risk of developing AD using this discriminant equation can be used as an auxiliary when diagnosing dementia in outpatients at the neurology, neuropsychiatry, psychotherapy, or general internal medicine departments of medical institutions such as hospitals. If this is realized, it is expected that early detection of AD in the subject will make it easier to select a treatment method to suppress the progression of AD.
- the concentrations of the 17 types of evaluation elements Na, Mg, P, S, K, Ca, Fe, Co, Cu, Zn, As, Se, Rb, Sr, Mo, Ag, Cs contained in serum samples from a total of 846 subjects belonging to the resident control group were measured in the same manner as in Example 1 above.
- the results were then compared with the concentrations of the evaluation elements in serum samples belonging to the three groups obtained in Example 1 above: the hospital control group, the MCI patient group, and the AD patient group. The results are shown in Figure 24.
- the concentration comparison table in FIG. 24 shows the average concentration values of the 17 elements in the evaluation element group in serum samples belonging to the resident control group, as well as the average concentration values of the evaluation element group in serum samples belonging to the three groups, the hospital control group, the MCI patient group, and the AD patient group, obtained in Example 1 above.
- the 17 elements in the evaluation element group nine elements, Na, Mg, S, Ca, Fe, Zn, As, Se, and Mo, showed a large difference in the average concentration (average concentration difference) between the resident control group and the hospital control group.
- a significant difference high significance of discrimination
- Figure 25 is a radar chart showing the ratio of the average concentration of the 17 elements in the evaluation element group for each element in the MCI patient group and the AD patient group.
- Figure 25 shows the concentration ratio when the resident control group is used as the standard, that is, when the concentration data value of the resident control group is set to 1.
- Example 3 as in Example 1, significant differences were observed in the average values and ratios of the concentrations of the 17 elements in the evaluation element group among the three groups, the resident control group, the MCI patient group, and the AD patient group, and the correlations between the 17 elements in the evaluation element group in each of these three groups revealed that the correlations were clearly different among these three groups.
- Gender was added as an explanatory variable because the total number of subjects in the disease groups was small, with a total of 65 subjects in the MCI patient group (27 males, 38 females) and a total of 50 subjects in the AD patient group (18 males, 32 females) compared to the total of 846 subjects in the resident control group (251 males, 595 females).
- Figure 28 shows the standardized discrimination coefficients (discrimination coefficients when the mean is 0.0 and the standard deviation is 1.0) of the two discriminant functions (discriminant functions 1 and 2) used in the discriminant analysis of the three groups, and their significance. From the figure, it was found that the following 12 elements were significant in discriminating between the three groups: sex and 12 elements: Na (P ⁇ 0.05), Mg (P ⁇ 0.01), S (P ⁇ 0.01), K (P ⁇ 0.01), Ca (P ⁇ 0.01), Fe (P ⁇ 0.01), Cu (P ⁇ 0.05), Zn (P ⁇ 0.01), As (P ⁇ 0.05), Se (P ⁇ 0.01), Rb (P ⁇ 0.01), and Mo (P ⁇ 0.05).
- the sensitivity was 95.4% (62/65), which was as high as the discriminant analysis of the two groups (i) and (ii) above.
- the specificity was also 95.7% (810/846), which was also as high as the discriminant analysis of the two groups (i) and (ii) above.
- the correct diagnosis rate was also high at 95.7% (872/911). Therefore, it was determined that the discriminant analysis (iii) above, which used the concentration data of the 17 elements selected as the evaluation element group, gender data, and age group (generation) data as explanatory variables, performed the discrimination appropriately. Therefore, it was estimated that highly reliable results could be obtained for the risk assessment of MCI.
- FIG. 35 shows the standardized discrimination coefficients of the two discriminant functions (discriminant functions 1 and 2) used in the discriminant analysis of the two groups, the resident control group and the MCI patient group, performed using the concentration data of the 17 elements in the evaluation group and the gender data.
- the standardized discrimination coefficients and their significances are shown in FIG. 35 .
- Figure 35 shows that the elements that were significant in distinguishing between the resident control group and the MCI patient group were gender and 11 elements: Na (P ⁇ 0.01), Mg (P ⁇ 0.01), S (P ⁇ 0.01), Ca (P ⁇ 0.01), Fe (P ⁇ 0.01), Cu (P ⁇ 0.05), Zn (P ⁇ 0.01), As (P ⁇ 0.01), Se (P ⁇ 0.01), Rb (P ⁇ 0.01), and Mo (P ⁇ 0.01).
- Figure 36 is a histogram showing the frequency distribution of the discriminant scores obtained by discriminant analysis of two groups, a resident control group and an MCI patient group, when the concentration data of the 17 elements used for evaluation and the gender data were used.
- Figure 38 shows the ROC (Receiver Operating Characteristic) curve.
- This ROC curve was obtained by changing the discriminant score obtained in the discriminant analysis of the two groups, the resident control group and the MCI patient group, from the lowest value to the highest value in sequence when the concentration data of the 17 evaluation elements and the gender data were used, and calculating the sensitivity and specificity at any time from the number of samples classified into the control group (resident control group) and the number of samples classified into the case group (MCI patient group).
- Example 3 The closer the AUC value, which indicates the goodness of discrimination, to 1, the more accurate the judgment is.
- the AUC value of 0.981 obtained in Example 3 indicates that the discrimination (prediction) between the two groups in Example 3 was performed very accurately. Therefore, it was determined that the method of Example 3 is sufficiently effective as a tool for diagnosing the risk of MCI.
- Example 3 The AUC value of 0.981 in Example 3 is clearly higher than the AUC of 0.79 for MMSE, so the method of Example 3 was found to be sufficiently effective as a tool for diagnosing the risk of MCI.
- Figure 40 is a graph showing the relationship between the discriminant score obtained in the two-group discriminant analysis in Example 3 and the probability that the subject suffers from MCI (discriminant score-MCI incidence relationship). This graph was obtained by performing a binomial logistic regression analysis using the discriminant score obtained in the discriminant analysis, as in Examples 1 and 2 above. According to this graph, as in Example 1 above (see Figure 21), the greater the negative value of the discriminant score, the higher the probability (risk) of MCI.
- the discriminant score is approximately -4.0 or less, it can be evaluated that "the subject is suspected to suffer from MCI with a probability of 90% or more.” Conversely, for example, if the discriminant score is approximately +0.25 or more, the probability of affliction is 10% or less, and it can be evaluated that "the subject is suspected not to suffer from MCI.”
- Example 3 the discriminant formula for assessing the risk of developing MCI: F(MCI) calculated by the discriminant analysis (ii) above using the concentration data of 17 elements in the group of elements to be evaluated and the gender data is shown in FIG. 39.
- the method for assessing the risk of developing MCI using this discriminant formula: F(MCI) can be suitably used as a "screening method for dementia risk" for the general population other than patients in the neurology, neuropsychiatry, psychotherapy, or general internal medicine departments of medical institutions such as hospitals. If this is realized, it is expected that early detection of MCI in the subject will make it easier to select a treatment method to suppress the progression of MCI.
- FIG. 39 also shows the discriminant equation for assessing the risk of developing MCI: F(MCI), calculated by the above discriminant analysis (i) in which only the concentration data of the 17 elements in the group of elements to be evaluated is used, and the above discriminant analysis (iii) in which the concentration data of the 17 elements in the group of elements to be evaluated, the gender data, and the age group (generation) data are used.
- F(MCI) the discriminant equation for assessing the risk of developing MCI
- Example 3 it was determined that the discriminant functions 1 and 2 (see FIG. 28) used in the discriminant analysis of the three groups, the resident control group, the MCI patient group, and the AD patient group, did not provide a sufficient accuracy rate, so a discriminant analysis was further performed on the two groups, the resident control group and the MCI patient group.
- Example 4 a discriminant analysis of the two groups, the resident control group and the AD patient group, was performed using a serum sample belonging to the AD patient group as well as a serum sample belonging to the same resident control group as in Example 3 above.
- the sensitivity was high at 92.0% (46/50), and the specificity was also high at 95.2% (805/846).
- the accuracy rate was also high at 95.0% (851/896). Therefore, when the concentration data of the 17 elements selected as the evaluation element group, gender data, and age group (generation) data were used as explanatory variables, it was determined that the discrimination between the resident control group and the AD patient group was performed appropriately. Therefore, it was estimated that highly reliable results could be obtained for the risk assessment of AD.
- FIG. 35 shows the standardized discrimination coefficients of the two discriminant functions (discriminant functions 1 and 2) used in the discriminant analysis of the two groups, the resident control group and the AD patient group, which was performed using the concentration data of the 17 evaluation elements and the gender data.
- the standardized discrimination coefficients and their significances are shown in FIG. 35.
- Figure 35 shows that the elements that were significant in distinguishing between the resident control group and the AD patient group were gender and 11 elements: Na (P ⁇ 0.01), Mg (P ⁇ 0.01), S (P ⁇ 0.05), K (P ⁇ 0.01), Ca (P ⁇ 0.01), Fe (P ⁇ 0.01), Cu (P ⁇ 0.01), Zn (P ⁇ 0.01), Se (P ⁇ 0.01), Rb (P ⁇ 0.05), and Mo (P ⁇ 0.01).
- K was suggested to be involved in AD, but no involvement in MCI was shown.
- Figure 37 is a histogram showing the frequency distribution of the discriminant scores obtained by discriminant analysis of two groups, a resident control group and an AD patient group, when the concentration data of the 17 elements in the evaluation group and gender data were used.
- Example 4 The value of 0.972 obtained in Example 4 indicated that the discrimination (prediction) between the two groups in Example 4 was performed very accurately. Therefore, it was determined that the method of Example 4 is sufficiently effective as a tool for diagnosing the risk of AD.
- Example 4 since the AUC value of 0.972 in Example 4 is clearly higher than the AUC of 0.79 for MMSE, it was determined that the method of Example 4 has sufficient effectiveness as a tool for diagnosing the risk of AD.
- FIG. 41 is a graph showing the relationship between the discriminant score obtained in the two-group discriminant analysis in Example 4 and the probability that the subject has AD (discriminant score-AD incidence relationship).
- This graph was obtained by performing a binomial logistic regression analysis using the discriminant score obtained in the discriminant analysis, as in Examples 1 and 2 above. According to this graph, as in Example 2 above (see FIG. 22), the greater the negative value of the discriminant score, the higher the probability (risk) of AD.
- the discriminant score is approximately -3.9 or less, it can be evaluated that "the subject is suspected to have AD with a probability of 90% or more.” Conversely, for example, if the discriminant score is approximately +0.25 or more, the incidence probability is 10% or less, and it can be evaluated that "the subject is suspected not to have MCI.”
- Example 4 the discriminant formula F(AD) for assessing the risk of developing MCI calculated by the discriminant analysis (ii) above using the concentration data of 17 elements in the group of elements to be evaluated and the gender data is shown in Figure 39.
- the method for assessing the risk of developing AD using this discriminant formula F(AD) can be suitably used as a "screening method for dementia risk" for the general population other than patients in the neurology, neuropsychiatry, psychotherapy, or general internal medicine departments of medical institutions such as hospitals. If this is realized, it is expected that early detection of AD in the subject will make it easier to select a treatment method to suppress the progression of AD.
- FIG. 39 also shows the discriminant equation F(AD) for assessing the risk of developing MCI, calculated by the discriminant analysis (i) above, in which only the concentration data of the 17 elements in the group of elements to be evaluated is used, and the discriminant analysis (iii) above, in which the concentration data of the 17 elements in the group of elements to be evaluated, the gender data, and the age group (generation) data are used.
- the present invention is widely applicable to fields in which it is desirable to quickly and easily predict whether a person (or animal) is suffering from dementia (MCI or AD) and to assess the risk of developing the condition.
- MCI dementia
- Reference Signs List 1 Test tube 2 Blood (plasma or serum) sample 5 Element group concentration measurement unit 10 Dementia risk assessment system 11 Data storage unit 12 Calculation unit 13 Index generation unit
Landscapes
- Health & Medical Sciences (AREA)
- Life Sciences & Earth Sciences (AREA)
- Engineering & Computer Science (AREA)
- Chemical & Material Sciences (AREA)
- Biomedical Technology (AREA)
- Hematology (AREA)
- Immunology (AREA)
- Physics & Mathematics (AREA)
- Molecular Biology (AREA)
- Urology & Nephrology (AREA)
- Medicinal Chemistry (AREA)
- Food Science & Technology (AREA)
- Pathology (AREA)
- Analytical Chemistry (AREA)
- Biochemistry (AREA)
- General Health & Medical Sciences (AREA)
- General Physics & Mathematics (AREA)
- Ecology (AREA)
- Biophysics (AREA)
- Inorganic Chemistry (AREA)
- Biotechnology (AREA)
- Cell Biology (AREA)
- Microbiology (AREA)
- Investigating Or Analysing Biological Materials (AREA)
Priority Applications (1)
| Application Number | Priority Date | Filing Date | Title |
|---|---|---|---|
| JP2024544922A JP7698805B2 (ja) | 2023-02-21 | 2024-02-20 | 認知症リスク評価方法及び認知症リスク評価システム |
Applications Claiming Priority (2)
| Application Number | Priority Date | Filing Date | Title |
|---|---|---|---|
| JP2023025639 | 2023-02-21 | ||
| JP2023-025639 | 2023-02-21 |
Publications (1)
| Publication Number | Publication Date |
|---|---|
| WO2024177086A1 true WO2024177086A1 (ja) | 2024-08-29 |
Family
ID=92501368
Family Applications (1)
| Application Number | Title | Priority Date | Filing Date |
|---|---|---|---|
| PCT/JP2024/006138 Ceased WO2024177086A1 (ja) | 2023-02-21 | 2024-02-20 | 認知症リスク評価方法及び認知症リスク評価システム |
Country Status (2)
| Country | Link |
|---|---|
| JP (1) | JP7698805B2 (https=) |
| WO (1) | WO2024177086A1 (https=) |
Citations (4)
| Publication number | Priority date | Publication date | Assignee | Title |
|---|---|---|---|---|
| JP2005524071A (ja) * | 2002-04-25 | 2005-08-11 | フューチャー データ インコーポレイティド | 元素不均衡の診断試験 |
| WO2016042805A1 (ja) * | 2014-09-15 | 2016-03-24 | 株式会社レナテック | 癌評価方法及び癌評価システム |
| WO2019065854A1 (ja) * | 2017-09-27 | 2019-04-04 | 株式会社レナテック | がんリスク評価方法及びがんリスク評価システム |
| WO2021039941A1 (ja) * | 2019-08-30 | 2021-03-04 | ニプロ株式会社 | アルツハイマー型認知症又は軽度認知症を判別する方法 |
-
2024
- 2024-02-20 JP JP2024544922A patent/JP7698805B2/ja active Active
- 2024-02-20 WO PCT/JP2024/006138 patent/WO2024177086A1/ja not_active Ceased
Patent Citations (4)
| Publication number | Priority date | Publication date | Assignee | Title |
|---|---|---|---|---|
| JP2005524071A (ja) * | 2002-04-25 | 2005-08-11 | フューチャー データ インコーポレイティド | 元素不均衡の診断試験 |
| WO2016042805A1 (ja) * | 2014-09-15 | 2016-03-24 | 株式会社レナテック | 癌評価方法及び癌評価システム |
| WO2019065854A1 (ja) * | 2017-09-27 | 2019-04-04 | 株式会社レナテック | がんリスク評価方法及びがんリスク評価システム |
| WO2021039941A1 (ja) * | 2019-08-30 | 2021-03-04 | ニプロ株式会社 | アルツハイマー型認知症又は軽度認知症を判別する方法 |
Also Published As
| Publication number | Publication date |
|---|---|
| JPWO2024177086A1 (https=) | 2024-08-29 |
| JP7698805B2 (ja) | 2025-06-25 |
Similar Documents
| Publication | Publication Date | Title |
|---|---|---|
| Batsis et al. | Diagnostic accuracy of body mass index to identify obesity in older adults: NHANES 1999–2004 | |
| Skillbäck et al. | Diagnostic performance of cerebrospinal fluid total tau and phosphorylated tau in Creutzfeldt-Jakob disease: results from the Swedish Mortality Registry | |
| Mensel et al. | Prevalence of renal cysts and association with risk factors in a general population: an MRI-based study | |
| Foerch et al. | Serum glial fibrillary acidic protein as a biomarker for intracerebral haemorrhage in patients with acute stroke | |
| Kalra et al. | Detection of cerebral degeneration in amyotrophic lateral sclerosis using high-field magnetic resonance spectroscopy | |
| JP7288283B2 (ja) | 小児がん検査用尿中代謝物マーカー | |
| KR102305151B1 (ko) | 암 평가 방법 및 암 평가 시스템 | |
| KR102635700B1 (ko) | 암 리스크 평가 방법 및 암 리스크 평가 시스템 | |
| Karim et al. | Independent replication of advanced brain age in mild cognitive impairment and dementia: detection of future cognitive dysfunction | |
| WO2015168669A1 (en) | Human health property monitoring system | |
| Sugimoto et al. | Value of the apparent diffusion coefficient for quantification of low-grade hepatic encephalopathy | |
| Yang et al. | Combined GFAP, NFL, Tau, and UCH-L1 panel increases prediction of outcomes in neonatal encephalopathy | |
| Lotan et al. | Quantitative imaging features predict spinal tap response in normal pressure hydrocephalus | |
| Brown et al. | Lead (Pb) in Alzheimer’s dementia: a systematic review of human case-control studies | |
| Kalra et al. | Cerebral degeneration predicts survival in amyotrophic lateral sclerosis | |
| Hameed et al. | Early neurological changes in aging cervical spine: insights from PROMIS mobility assessment | |
| Behzadi et al. | A systematic review and meta-analysis of major blood protein biomarkers that predict unfavorable outcomes in severe traumatic brain injury | |
| JP7698805B2 (ja) | 認知症リスク評価方法及び認知症リスク評価システム | |
| JP6629782B2 (ja) | 加齢黄斑変性症のリスク評価方法及びシステム | |
| Miah et al. | Reticulocyte hemoglobin equivalent (Ret-He) as a potential diagnostic marker of iron deficiency anemia among Bangladeshi adults | |
| Brewińska et al. | Usefulness of neurological assessment scales in prognosis of meningoencephalitis of unknown origin in Yorkshire Terriers | |
| Schmidt et al. | Procalcitonin as a postmortem sepsis marker. A comparison of the validity of results obtained from blood serum, aqueous humour and cerebrospinal fluid | |
| Hagiwara et al. | Prognostic impact of muscle mass in idiopathic interstitial pneumonia: analysis of idiopathic pulmonary fibrosis and other idiopathic interstitial pneumonias | |
| Zaidi et al. | Comparison of APACHE II SAPS II and SOFA scoring systems as predictors of mortality in ICU patients | |
| JP6875451B2 (ja) | 犬のがんリスク評価方法及びがんリスク評価システム |
Legal Events
| Date | Code | Title | Description |
|---|---|---|---|
| WWE | Wipo information: entry into national phase |
Ref document number: 2024544922 Country of ref document: JP |
|
| 121 | Ep: the epo has been informed by wipo that ep was designated in this application |
Ref document number: 24760384 Country of ref document: EP Kind code of ref document: A1 |
|
| NENP | Non-entry into the national phase |
Ref country code: DE |
|
| 122 | Ep: pct application non-entry in european phase |
Ref document number: 24760384 Country of ref document: EP Kind code of ref document: A1 |