WO2024176614A1 - 色素データ取得方法、色素データ取得装置、及び色素データ取得プログラム - Google Patents
色素データ取得方法、色素データ取得装置、及び色素データ取得プログラム Download PDFInfo
- Publication number
- WO2024176614A1 WO2024176614A1 PCT/JP2023/046650 JP2023046650W WO2024176614A1 WO 2024176614 A1 WO2024176614 A1 WO 2024176614A1 JP 2023046650 W JP2023046650 W JP 2023046650W WO 2024176614 A1 WO2024176614 A1 WO 2024176614A1
- Authority
- WO
- WIPO (PCT)
- Prior art keywords
- dye
- intensity values
- data
- objects
- data acquisition
- Prior art date
- Legal status (The legal status is an assumption and is not a legal conclusion. Google has not performed a legal analysis and makes no representation as to the accuracy of the status listed.)
- Ceased
Links
Images




Classifications
-
- G—PHYSICS
- G01—MEASURING; TESTING
- G01N—INVESTIGATING OR ANALYSING MATERIALS BY DETERMINING THEIR CHEMICAL OR PHYSICAL PROPERTIES
- G01N21/00—Investigating or analysing materials by the use of optical means, i.e. using sub-millimetre waves, infrared, visible or ultraviolet light
- G01N21/62—Systems in which the material investigated is excited whereby it emits light or causes a change in wavelength of the incident light
- G01N21/63—Systems in which the material investigated is excited whereby it emits light or causes a change in wavelength of the incident light optically excited
- G01N21/64—Fluorescence; Phosphorescence
- G01N21/6428—Measuring fluorescence of fluorescent products of reactions or of fluorochrome labelled reactive substances, e.g. measuring quenching effects, using measuring "optrodes"
-
- G—PHYSICS
- G01—MEASURING; TESTING
- G01J—MEASUREMENT OF INTENSITY, VELOCITY, SPECTRAL CONTENT, POLARISATION, PHASE OR PULSE CHARACTERISTICS OF INFRARED, VISIBLE OR ULTRAVIOLET LIGHT; COLORIMETRY; RADIATION PYROMETRY
- G01J3/00—Spectrometry; Spectrophotometry; Monochromators; Measuring colours
- G01J3/28—Investigating the spectrum
- G01J3/44—Raman spectrometry; Scattering spectrometry ; Fluorescence spectrometry
-
- G—PHYSICS
- G01—MEASURING; TESTING
- G01N—INVESTIGATING OR ANALYSING MATERIALS BY DETERMINING THEIR CHEMICAL OR PHYSICAL PROPERTIES
- G01N21/00—Investigating or analysing materials by the use of optical means, i.e. using sub-millimetre waves, infrared, visible or ultraviolet light
- G01N21/62—Systems in which the material investigated is excited whereby it emits light or causes a change in wavelength of the incident light
- G01N21/63—Systems in which the material investigated is excited whereby it emits light or causes a change in wavelength of the incident light optically excited
- G01N21/64—Fluorescence; Phosphorescence
- G01N2021/6417—Spectrofluorimetric devices
- G01N2021/6421—Measuring at two or more wavelengths
-
- G—PHYSICS
- G01—MEASURING; TESTING
- G01N—INVESTIGATING OR ANALYSING MATERIALS BY DETERMINING THEIR CHEMICAL OR PHYSICAL PROPERTIES
- G01N21/00—Investigating or analysing materials by the use of optical means, i.e. using sub-millimetre waves, infrared, visible or ultraviolet light
- G01N21/62—Systems in which the material investigated is excited whereby it emits light or causes a change in wavelength of the incident light
- G01N21/63—Systems in which the material investigated is excited whereby it emits light or causes a change in wavelength of the incident light optically excited
- G01N21/64—Fluorescence; Phosphorescence
- G01N21/6428—Measuring fluorescence of fluorescent products of reactions or of fluorochrome labelled reactive substances, e.g. measuring quenching effects, using measuring "optrodes"
- G01N2021/6439—Measuring fluorescence of fluorescent products of reactions or of fluorochrome labelled reactive substances, e.g. measuring quenching effects, using measuring "optrodes" with indicators, stains, dyes, tags, labels, marks
- G01N2021/6441—Measuring fluorescence of fluorescent products of reactions or of fluorochrome labelled reactive substances, e.g. measuring quenching effects, using measuring "optrodes" with indicators, stains, dyes, tags, labels, marks with two or more labels
-
- G—PHYSICS
- G01—MEASURING; TESTING
- G01N—INVESTIGATING OR ANALYSING MATERIALS BY DETERMINING THEIR CHEMICAL OR PHYSICAL PROPERTIES
- G01N2201/00—Features of devices classified in G01N21/00
- G01N2201/12—Circuits of general importance; Signal processing
- G01N2201/129—Using chemometrical methods
- G01N2201/1293—Using chemometrical methods resolving multicomponent spectra
Definitions
- One aspect of the embodiment relates to a dye data acquisition method, a dye data acquisition device, and a dye data acquisition program.
- Patent Document 1 discloses clustering of cells using fluorescent data of each color of light from cells output from a flow cytometer.
- Non-Patent Document 2 discloses unmixing fluorescent data output from a flow cytometer to generate a fluorescent spectrum for each fluorescent dye, and then performing clustering processing on the fluorescent spectra.
- One aspect of the embodiment has been made in consideration of this problem, and aims to provide a dye data acquisition method, a dye data acquisition device, and a dye data acquisition program that are capable of obtaining accurate fluorescence spectra even when observation conditions change.
- the dye data acquisition method includes a data acquisition step of acquiring spectral data, which is a distribution of fluorescence intensity values for C (C is an integer of 2 or more) detection wavelengths, for N (N is an integer of 2 or more) objects; a clustering step of clustering the N objects into L (L is an integer of 2 or more and N-1 or less) object groups based on the intensity values of each object for the C detection wavelengths, and generating L cluster matrices in which the intensity values for the C detection wavelengths are arranged for each clustered object group; a calculation step of calculating statistics of the intensity values of the object groups at the C detection wavelengths for each of the L cluster matrices; and a data generation step of performing unmixing for the C detection wavelengths using the statistics for the C detection wavelengths for each of the L cluster matrices, and generating K dye data showing the distribution for each of K (K is an integer of 2 or more and C or less) fluorescent dyes.
- spectral data which is a distribution of fluorescence intensity
- the dye data acquisition device is a dye data acquisition device that processes spectral data that is a distribution of fluorescence intensity values for C (C is an integer of 2 or more) detection wavelengths for N (N is an integer of 2 or more) objects, clusters the N objects into L (L is an integer of 2 or more and N-1 or less) object groups based on the intensity values of each object for the C detection wavelengths, generates L cluster matrices in which the intensity values for the C detection wavelengths are arranged for each clustered object group, calculates statistics of the intensity values of the object groups at the C detection wavelengths for each L cluster matrix, and performs unmixing for the C detection wavelengths using the statistics for the C detection wavelengths for each L cluster matrix, generating K dye data showing the distribution for each K fluorescent dye (K is an integer of 2 or more and C or less).
- the dye data acquisition program is a dye data acquisition program for generating dye data showing the distribution of fluorescent dyes in N (N is an integer of 2 or more) objects based on spectral data that is a distribution of fluorescence intensity values for each of C (C is an integer of 2 or more) detection wavelengths, and causes a computer to execute the steps of: clustering the N objects into L (L is an integer of 2 or more and N-1 or less) object groups based on the intensity values of each object for each of the C detection wavelengths, generating L cluster matrices in which the intensity values for each of the clustered object groups are arranged; calculating statistics of the intensity values of the object groups at the C detection wavelengths for each of the L cluster matrices; and performing unmixing for the C detection wavelengths using the statistics for the C detection wavelengths for each of the L cluster matrices, and generating K dye data showing the distribution for each of K (K is an integer of 2 or more and C or less) fluorescent dyes.
- spectral data of the fluorescence distribution of C detection wavelengths is obtained for each of N objects.
- This spectral data is clustered into L object groups, L cluster matrices are generated in which the intensity values of the object groups are arranged for each of the C detection wavelengths, and statistics of the intensity values of the object groups are calculated for each of the L cluster matrices.
- K dye data indicating the distribution of K fluorescent dyes for each object are generated.
- the dye data acquisition method includes a data acquisition step of acquiring spectral data, which is a distribution of fluorescence intensity values for each of C (C is an integer of 2 or more) detection wavelengths for N (N is an integer of 2 or more) objects; a clustering step of clustering the C detection wavelengths for each of the N objects into M (M is an integer of 2 or more and C-1 or less) detection wavelength groups based on the intensity values, and generating M cluster matrices in which the intensity values for each of the N objects are arranged for each clustered detection wavelength group; a calculation step of calculating statistics of the intensity values of the detection wavelength groups in the N objects for each of the M cluster matrices; and a data generation step of performing unmixing for the N objects using the statistics for the N objects for each of the M cluster matrices, and generating K dye data showing the distribution for each of K (K is an integer of 2 or more and M or less) fluorescent dyes.
- spectral data which is a distribution of fluorescence intensity values for each
- the dye data acquisition device is a dye data acquisition device that processes spectral data that is a distribution of fluorescence intensity values for C (C is an integer of 2 or more) detection wavelengths for N (N is an integer of 2 or more) objects, and clusters the C detection wavelengths into M (M is an integer of 2 or more and C-1 or less) detection wavelength groups based on the intensity values for each of the N objects, generates M cluster matrices in which the intensity values for each of the N objects are arranged for each clustered detection wavelength group, calculates statistics of the intensity values of the detection wavelength groups in the N objects for each of the M cluster matrices, and performs unmixing for the N objects using the statistics for the N objects for each of the M cluster matrices, and generates K dye data showing the distribution for each of K (K is an integer of 2 or more and M or less) fluorescent dyes.
- the dye data acquisition program is a dye data acquisition program for generating dye data indicating the distribution of fluorescent dyes in N (N is an integer of 2 or more) objects based on spectral data that is a distribution of fluorescence intensity values for each of C (C is an integer of 2 or more) detection wavelengths, and causes a computer to execute the steps of: clustering the C detection wavelengths into M (M is an integer of 2 or more and C-1 or less) detection wavelength groups based on the intensity values for each of the N objects, generating M cluster matrices in which the intensity values for each of the N objects are arranged for each of the clustered detection wavelength groups; calculating statistics of the intensity values of the detection wavelength groups in the N objects for each of the M cluster matrices; and performing unmixing for the N objects using the statistics for the N objects for each of the M cluster matrices to generate K dye data indicating the distribution for each of K (K is an integer of 2 or more and M or less) fluorescent dyes.
- spectral data of the fluorescence distribution of C detection wavelengths is obtained for each of N objects.
- This spectral data is clustered into M detection wavelength groups, M cluster matrices are generated in which the intensity values of the detection wavelength groups are arranged for each of the N objects, and statistics of the intensity values of the detection wavelength groups are calculated for each of the M cluster matrices.
- K dye data indicating the distribution of K fluorescent dyes for each object are generated. In this way, even if the type of dye to be observed or the type of excitation light used for observation changes, unmixing suitable for the observation conditions can be performed, and dye data that is highly accurate fluorescence spectral data can be obtained.
- FIG. 1 is a schematic configuration diagram of a pigment data acquisition system 1 according to an embodiment.
- FIG. 2 is a schematic diagram of the data acquisition device 3 of FIG. 1 .
- 2 is a block diagram showing an example of a hardware configuration of the data processing device 5 of FIG. 1 .
- 2 is a block diagram showing a functional configuration of a data processing device 5 in FIG. 1 .
- 5 is a diagram showing an image of matrix data Y' regenerated by the statistical value calculation unit 203 in FIG. 4 and dye matrix data X' derived by the matrix estimation unit 204 in FIG. 4 .
- FIG. 13 is a schematic configuration diagram of a data acquisition device 3A according to a modified example.
- the dye data acquisition system 1 is a schematic diagram of a dye data acquisition system 1, which is a dye data acquisition device according to an embodiment.
- the dye data acquisition system 1 is a device for generating dye data for identifying the amount of dye (fluorescent dye) contained in a sample such as a cell or particle that is an analysis target.
- the dye data generated by the dye data acquisition system 1 is used for the purpose of counting, selecting, and analyzing the characteristics of cells through the analysis of the data. Therefore, the dye data acquisition system 1 is required to generate dye data of a large amount of analysis targets with high throughput.
- the dye data acquisition system 1 includes a data acquisition device 3 that performs analysis by flow cytometry on the analysis target, and a data processing device 5 that processes the data acquired by the data acquisition device 3.
- the data acquisition device 3 and the data processing device 5 may be configured to be able to transmit and receive data between them using wired or wireless communication, or may be configured to be able to input and output data via a recording medium.
- the data acquisition device 3 and the data processing device 5 may also be configured as an integrated device.
- FIG. 2 is a schematic diagram of the data acquisition device 3 in FIG. 1.
- the data acquisition device 3 is a system for performing flow cytometry, generally called a flow cytometer, and is composed of a fluid system 52, an optical system (optical system) 53, and an electronic system (signal processing device) 54.
- the fluid system 52 includes a flow cell 56 into which a sample fluid containing analytes such as cells or particles is injected, and which allows the analytes contained in the sample fluid to be aligned and passed through a thin channel 55.
- This flow cell 56 also has a function (not shown) for sorting (classifying and distributing) the gated analytes by controlling an electric field or the like.
- the optical system 53 is a system that optically analyzes the analyte passing through the flow cell 56 by flow cytometry.
- the optical system 53 includes light sources 7a, 7b, 7c, 7d, dichroic mirrors 57a, 57b, 57c, mirror 57d, lens 8, filters 9a, 9b, 9c, 9d, dichroic mirrors 10b, 10c, and photodetectors 11a, 11b, 11c, 11d, and guides various types of light generated from the analyte by flow cytometry to the photodetectors 11a, 11b, 11c, 11d.
- the light sources 7a, 7b, 7c, 7d are light source devices that generate light (excitation light) having different central wavelengths (excitation wavelengths).
- the light sources 7a, 7b, 7c, 7d are, for example, laser light sources, light-emitting diodes, or superluminescent diodes.
- the dichroic mirror 57a transmits the light emitted from the light source 7a toward the lens 8, and reflects the light emitted from the other light sources 7b, 7c, and 7d toward the lens 8.
- the dichroic mirror 57b reflects the light emitted from the light source 7b toward the dichroic mirror 57a, and transmits the light emitted from the light sources 7c and 7d toward the dichroic mirror 57a.
- the dichroic mirror 57c reflects the light emitted from the light source 7c toward the dichroic mirror 57b, and transmits the light emitted from the light source 7d toward the dichroic mirror 57b.
- the mirror 57d reflects the light emitted from the light source 7d toward the dichroic mirror 57c.
- the lens 8 focuses the light emitted from the light sources 7a, 7b, 7c, and 7d on the channel 55 in the flow cell 56.
- the filter 9a transmits forward scattered light generated from the sample fluid by irradiation with light (i.e., at least one of the lights from the light sources 7a, 7b, 7c, and 7d).
- the filter 9b transmits the first fluorescence of the first wavelength band reflected by the dichroic mirror 10b
- the filter 9c transmits the second fluorescence of the second wavelength band reflected by the dichroic mirror 10c.
- the filter 9d transmits the third fluorescence of the third wavelength band among the fluorescence transmitted through the dichroic mirror 10c.
- the photodetectors 11a, 11b, 11c, and 11d are provided on the optical axes of the forward scattered light, the first fluorescence, the second fluorescence, and the third fluorescence, respectively, and measure the intensities of the forward scattered light, the first fluorescence, the second fluorescence, and the third fluorescence.
- the photodetectors 11a, 11b, 11c, and 11d are, for example, photomultiplier tubes, avalanche photodiodes, HPDs (Hybrid Photo Detectors), SiPMs (Silicon Photomultipliers), and the like.
- the photodetectors 11a, 11b, 11c, and 11d may be configured as a single photodetector with multiple detection ports.
- An example of such a single photodetector is a multi-anode photomultiplier tube.
- the optical system 53 can measure the intensity of each of the fluorescence for each of C detection wavelengths (C is an integer equal to or greater than 2) depending on the number of combinations of dichroic mirrors, filters, and photodetectors.
- the optical system 53 is capable of measuring the intensities of the forward scattered light, the first fluorescence, the second fluorescence, and the third fluorescence while switching between irradiating light of multiple wavelength bands from the light sources 7a, 7b, 7c, and 7d. This allows the intensities of fluorescence in multiple wavelength bands to be measured efficiently.
- the optical system 53 may also be capable of measuring the intensities of the forward scattered light, the first fluorescence, the second fluorescence, and the third fluorescence while continuously irradiating light of multiple wavelength bands from the light sources 7a, 7b, 7c, and 7d.
- the optical system 53 may also have a configuration capable of observing side scattered light using a configuration similar to that described above.
- the electronic system 54 is a device for collecting data on the light intensity measured by the optical system 53. Specifically, the electronic system 54 is electrically connected to the multiple photodetectors 11a, 11b, 11c, and 11d, and generates array data in which the intensity values for each analyte after A/D conversion are arrayed one-dimensionally by A/D converting the intensity signals indicating the intensity detected by each channel of the multiple photodetectors 11a, 11b, 11c, and 11d, and transmits the array data to the outside.
- the electronic system 54 may directly A/D convert the intensity signals detected by the multiple photodetectors 11a, 11b, 11c, and 11d to generate the array data, or may correct the intensity signals or the intensity values after A/D conversion using various parameters and generate array data based on the corrected intensity signals or the corrected intensity values.
- Figure 3 is a block diagram showing an example of the hardware configuration of the data processing device 5
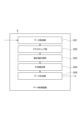
- Figure 4 is a block diagram showing the functional configuration of the data processing device 5.
- the data processing device 5 includes, as functional components, a data acquisition unit 201, a clustering unit 202, a statistical value calculation unit 203, a matrix estimation unit 204, and a data generation unit 205.
- Each functional unit of the data processing device 5 shown in FIG. 4 is realized by loading a program (a dye data acquisition program according to the embodiment) onto hardware such as the CPU 101 and RAM 102, and operating the communication module 104 and the input/output module 106 under the control of the CPU 101, and reading and writing data in the RAM 102.
- the CPU 101 of the data processing device 5 executes this computer program to cause each functional unit of FIG. 4 to function, and sequentially executes processes corresponding to the dye data acquisition method described later.
- the CPU 101 may be a standalone piece of hardware, or may be implemented in a programmable logic such as an FPGA, as in a software processor.
- the RAM and ROM may also be standalone pieces of hardware, or may be built into a programmable logic such as an FPGA. All of the various data required to execute this computer program and all of the various data generated by executing this computer program are stored in built-in memories such as ROM 103 and RAM 102, or in storage media such as a hard disk drive.
- the functions of the functional components of the data processing device 5 are described in detail below.
- the data acquisition unit 201 acquires array data relating to fluorescence in pre-specified C wavelength bands (C is an integer of 2 or more) for N analytes (N is an integer of 2 or more) from the data acquisition device 3.
- C array data are spectral data obtained by measuring the distribution of fluorescence intensity values for each of the C wavelength bands from the N analytes while switching between irradiating light in multiple wavelength bands in the data acquisition device 3.
- the number C of acquired array data (the number C of wavelength bands of observed fluorescence) is specified in advance to be equal to or greater than the maximum number of dyes that can be contained in the analytes.
- the clustering unit 202 reads the C array data acquired by the data acquisition unit 201, and performs clustering on the N analytes constituting the C array data based on the intensity values of each analyte for each of the C wavelength bands. Prior to the clustering process, the clustering unit 202 generates matrix data Y in which the intensity values of the N analytes constituting each of the C array data are arranged in parallel in one dimension.
- the clustering unit 202 clusters the N analytes into L object groups (L is an integer between 2 and N-1) based on the distribution information of the intensity values of each fluorescence wavelength band. For example, the clustering unit 202 selects a wavelength band in which intensity values are likely to differ between dyes, creates a histogram of the intensity values of that wavelength band, and sets a threshold between two peaks based on the histogram. Furthermore, the clustering unit 202 can cluster the analytes into two object groups by comparing the set threshold with the intensity values of the array data. The clustering unit 202 can classify the analytes into three or more object groups by a similar function.
- the number L of object groups to be clustered by the clustering unit 202 is set in advance as a parameter stored in the data processing device 5 in correspondence with the number of types of dyes that may exist in the analytes.
- the clustering unit 202 then divides and regenerates the matrix data Y in which the intensity values of the analytes of the C array data are arranged in parallel in one dimension into cluster matrices for each of the L object groups.
- the number L of object groups to be clustered by the clustering unit 202 may be set in advance according to the type of detection wavelength band and the number (C) of detection wavelength bands.
- the number L of object groups to be clustered by the clustering unit 202 may also be set independently of these.
- the statistical value calculation unit 203 and the matrix estimation unit 204 obtain a mixing matrix A for generating K dye data indicating the respective distributions of K dyes (K is an integer between 2 and C) from C array data, based on the L cluster matrices obtained for the analysis target.
- K is an integer between 2 and C
- Y matrix data of C rows and N columns
- A matrix data of C rows and K columns
- X matrix data of K rows and N columns.
- the statistical value calculation unit 203 regenerates matrix data Y' by compressing the matrix data Y generated by the clustering unit 202 in units of object groups clustered by the clustering unit 202.
- the statistical value calculation unit 203 calculates a statistical value for each object group of the clustered cluster matrix for the intensity values of each row of the matrix data Y, and compresses the object groups of each row into one object having the calculated statistical value.
- the statistical value calculation unit 203 regenerates matrix data Y', which is matrix data of C rows and L columns.
- the statistical value calculation unit 203 may calculate, as the statistical value, an average value based on the integrated value of the intensity values, may calculate the most frequent value of the intensity values, or may calculate the median value of the intensity values.
- Fig. 5 shows an image of the matrix data Y' regenerated by the statistical value calculation unit 203 and the corresponding dye matrix data X'. One square shown in Fig. 5 represents one element of the matrix data.
- the dye matrix data X and matrix data Y divided into three object groups PGr 01 to PGr 03 are compressed into three columns of dye matrix data X' and matrix data Y', with the statistical values for each of the object groups PGr 01 to PGr 03 being used as representative values.
- the matrix estimation unit 204 derives the mixing matrix A based on the matrix data Y' as follows. That is, the matrix estimation unit 204 sets an initial value to the mixing matrix A, calculates the following loss function (loss value) Los while sequentially changing the value of the mixing matrix A, and derives the mixing matrix A that reduces the value of the loss function Los. Note that a regularization term such as the L1 norm ⁇
- j is a parameter indicating the row position of the matrix data (corresponding to the wavelength band of fluorescence)
- the matrix subscript 1j indicates the matrix data of the jth row of the first cluster matrix
- the matrix subscript 2j indicates the matrix data of the jth row of the second cluster matrix
- the matrix subscript 3j indicates the matrix data of the jth row of the third cluster matrix
- the parameters a, b, and c indicate the average values of the statistics of each column of the matrix data Y'.
- the matrix estimation unit 204 calculates a loss function for each of the L cluster matrices divided by the clustering unit 202 by referring to the statistical values of the C pieces of matrix data Y', calculates a loss function Los based on the sum of the L loss functions, and obtains a mixing matrix A based on the loss function Los. In this case, the matrix estimation unit 204 corrects the loss function calculated for each of the L cluster matrices by dividing it by the average values a, b, and c of the statistical values of the C pieces of matrix data Y', and then obtains the loss function Los by calculating the sum of the corrected loss functions.
- the matrix estimation unit 204 may calculate the loss function for each of the L cluster matrices by correcting it by dividing the row components of the difference value Y'-AX' for each wavelength band of fluorescence by the C statistical values corresponding to each wavelength band of fluorescence.
- the matrix estimation unit 204 derives the mixing matrix A and the dye matrix data X' based on the matrix data Y' as follows. That is, the matrix estimation unit 204 sets initial values to the mixing matrix A and the dye matrix data X', calculates a loss function (loss value) Los using the following formula while sequentially changing the values of the mixing matrix A and the dye matrix data X', and derives the mixing matrix A and the dye matrix data X' that reduces the value of the loss function Los.
- a regularization term such as the L1 norm ⁇
- the calculation may be performed with a constraint that the mixing matrix A and the dye matrix data X' are non-negative values.
- j is a parameter indicating the row position of the matrix data (corresponding to the wavelength band of fluorescence)
- i is a parameter indicating the column position of the matrix data (corresponding to the i-th cluster).
- w ij represents the weight of each element of the matrix data, and may be calculated from the value of each element or its standard deviation. It is also possible to set all w ij to the same value and not consider the weight of each element.
- the matrix estimation unit 204 calculates a loss function for each of the L cluster matrices divided by the clustering unit 202 by referring to the statistical values of the C pieces of matrix data Y', calculates a loss function Los based on the sum of the L loss functions Los i , and obtains a mixing matrix A based on the loss function Los. Note that the matrix estimation unit 204 may calculate the loss function Los i for each of the L cluster matrices by correcting by dividing the row components for each wavelength band of the fluorescence of the difference value Y'-AX' by the C statistical values corresponding to each wavelength band of the fluorescence.
- the data generating unit 205 obtains K pieces of dye data by unmixing the C pieces of sequence data obtained for the analysis target using the mixing matrix A derived by the matrix estimation unit 204. Specifically, the data generating unit 205 calculates dye matrix data X by applying the inverse matrix A ⁇ 1 of the mixing matrix A to the matrix data Y generated by the clustering unit 202 based on the C pieces of sequence data. Then, the data generating unit 205 reproduces K pieces of dye data from the dye matrix data X and outputs the reproduced K pieces of dye data.
- the output destination at this time may be an output device of the data processing device 5 such as a display or a touch panel display, or may be an external device connected to the data processing device 5 so as to be able to communicate data.
- the dye data generated by the data generating unit 205 may be used in data analysis for the purpose of counting, selecting, analyzing characteristics, etc. of the analysis target.
- Figure 6 is a flowchart showing the procedure for the observation process using the dye data acquisition system 1.
- the data acquisition device 3 executes an observation process for multiple analysis targets, generating and transmitting array data (step S1).
- the data acquisition unit 201 of the data processing device 5 acquires array data for C fluorescent wavelength bands from the data acquisition device 3 (step S2; data acquisition step).
- the clustering unit 202 of the data processing device 5 performs clustering on the C pieces of sequence data, and the N analysis objects of the sequence data are clustered into L object groups (step S3; clustering step).
- the statistical value calculation unit 203 of the data processing device 5 calculates the statistical values of the L object groups, thereby regenerating matrix data Y' based on the matrix data Y generated by the clustering unit 202 (step S4; calculation step).
- the matrix estimation unit 204 of the data processing device 5 derives a mixing matrix A based on the matrix data Y' (step S5; data generation step).
- the data generation unit 205 of the data processing device 5 unmixes the matrix data Y generated based on the C array data for the analysis target using the mixing matrix A, thereby acquiring and outputting K dye data (step S6; data generation step). This completes the observation process for multiple analysis targets.
- spectral data showing the distribution of fluorescence in C wavelength bands is acquired for each of N analysis targets.
- This spectral data is clustered into L object groups, L cluster matrices are generated in which the intensity values of the object groups are arranged for each of the C fluorescence wavelength bands, and statistics of the intensity values of the object groups are calculated for each of the L cluster matrices.
- K dye data showing the distribution of K fluorescent dyes for each target are generated.
- Flow cytometry is a technique that enables the identification or quantification of cell populations by staining cells, cell surface proteins, and intracellular proteins, and can be used for applications such as cell sorting and immunophenotyping. According to this embodiment, it is possible to accurately identify which cells have become tumorigenic by analyzing the combination of expression of antibodies used on blood cells, for example, based on the acquired dye data.
- spectral data is obtained that is a distribution of intensity values for each of C fluorescent wavelength bands. This allows the use of light in multiple wavelength bands to efficiently observe fluorescence from multiple types of fluorescent dyes. As a result, when multiple fluorescent dyes are observed, highly accurate dye data can be obtained.
- N analytes are clustered based on distribution information of intensity values for each of C fluorescence wavelength bands.
- clustering can be performed based on the similarity of the fluorescence wavelength distribution.
- unmixing suitable for the observation conditions is performed, and highly accurate dye data can be obtained.
- the statistical values of the array data are calculated based on the integrated value, the mode, or the median value of the intensity values of the object groups.
- unmixing can be performed based on the overall tendency of the intensity values of the L object groups in the cluster matrix, and unmixing suitable for the observation conditions can be performed, making it possible to obtain highly accurate dye data.
- the mixing matrix A is obtained using the statistics of C fluorescence wavelength bands for each of L cluster matrices, and unmixing is performed using the mixing matrix A.
- the mixing matrix A was derived by calculation based on reference information (fluorescence spectrum, absorption spectrum, etc.) of each dye. In this embodiment, even if such reference information is unknown, the mixing matrix can be estimated from the matrix data Y obtained from the array data. As a result, the throughput when acquiring dye data can be improved while improving the accuracy of separation data.
- the loss function Los is calculated based on the statistical values of C fluorescence wavelength bands for each of L cluster matrices using non-negative matrix factorization, and the mixing matrix A is obtained based on the sum of the loss functions Los.
- the loss function Los is calculated based on the statistical values of L object groups of clustered array data, and the mixing matrix A is obtained based on the sum of these loss functions Los, and unmixing can be performed using the mixing matrix A. This makes it possible to further improve the accuracy of the generated dye data even if there is a difference in the amount of each dye contained in multiple analysis targets.
- the separation accuracy of dyes with relatively large amounts is emphasized, and as a result, the separation accuracy of dyes with relatively small amounts decreases, but in this embodiment, the separation accuracy of multiple dyes can be uniformly improved.
- the throughput when acquiring dye data can also be improved.
- the loss function Los for each of the L cluster matrices is corrected using coefficients a, b, and c based on statistical values, and the mixing matrix A is calculated based on the sum of the corrected loss functions Los.
- the loss function Los is calculated based on the statistical values of the L object groups of the clustered sequence data, and each loss function Los is corrected based on the statistical values when calculating the sum of the loss functions Los. This makes it possible to generate dye data with high accuracy even when there is a difference in the fluorescence intensity of each dye in the sequence data of the analysis target.
- Figure 7 is a graph to explain a general method of identifying populations of analytes in flow cytometry.
- a dot plot DP graph is generated based on the fluorescence intensity in the wavelength band of "detection wavelength 1" and the fluorescence intensity in the wavelength band of "detection wavelength 2" for multiple cells, and a histogram HG1 of the intensity of "detection wavelength 1" and a histogram HG2 of the intensity of "detection wavelength 2" are created based on the dot plot DP.
- a population of "dye A" and a population of "dye B" are identified by gating based on a threshold determined based on the distributions of HG1 and HG2, or based on the dot plot DP.
- the fluorescence from a single dye contains multiple types of fluorescence wavelength bands, and the distribution of wavelength bands contained in the fluorescence varies in a complex manner between different dyes.
- one analyte may contain multiple dyes.
- the sequence data of C fluorescence wavelength bands is unmixed and processed, making it possible to quantitatively obtain the expression amount of each dye with high accuracy.
- Figures 8 to 11 show the distribution of dye data for two dyes acquired by the dye data acquisition system 1.
- part (a) is a graph showing a dot plot of intensity values of two fluorescence wavelength bands
- part (b) is a graph showing the expression levels (distribution) of two dyes, "Dye A" and "Dye B”.
- Figure 8 shows the results of dye data acquired by omitting clustering processing in the data processing device 5 when there is a difference in the number of each dye (when the number of cells for dye A is 1/100 of the number of cells for dye B), and Figure 9 shows the results of dye data acquired by performing clustering processing in the data processing device 5 when there is a difference in the number of each dye (when the number of cells for dye A is 1/100 of the number of cells for dye B).
- FIG. 10 shows the results of acquiring dye data without performing clustering processing in the data processing device 5 when there is a difference in intensity between dyes (when the intensity of the cell of dye A is 1/10 of the intensity of the cell of dye B)
- FIG. 11 shows the results of acquiring dye data by performing clustering processing in the data processing device 5 when there is a difference in intensity between dyes (when the intensity of the cell of dye A is 1/10 of the intensity of the cell of dye B).
- FIG. 12 shows histograms of the intensity of a certain fluorescence wavelength band for each cell of dye A and for each cell of dye B acquired by the dye data acquisition system 1, and (b) shows a histogram of the expression amount of dye B acquired by the dye data acquisition system 1.
- the dye data acquired by this embodiment allows for accurate separation of the expression amount of dye B.
- a decision tree in addition to the K-means method, a decision tree, a support vector machine, KNN (K nearest neighbors), a self-organizing map, a spectral clustering, a Gaussian mixture model, DBSCAN, affinity propagation, MeanShift, Ward, agglomerative clustering, OPTICS, BIRCH, or other machine learning methods, deep learning methods, etc.
- the matrix data Y may be preprocessed before applying clustering.
- the dimension of the C-dimensional data of each analysis object may be reduced by phasor analysis, principal component analysis, singular value decomposition, independent component analysis, linear discriminant analysis, t-SNE, UMAP, or other machine learning methods.
- the clustering unit 202 of the data processing device 5 may further generate M cluster matrices in which the intensity values of each detection target object are arranged for each wavelength group by clustering the C fluorescence wavelength bands of the matrix data Y based on the intensity values of each wavelength band (M is an integer between 2 and C-1).
- the cluster matrices may be generated before or after the generation of the L cluster matrices described above.
- the statistical value calculation unit 203 regenerates the matrix data Y' by compressing the matrix data Y for each clustered wavelength group using the statistical values in a manner similar to the above-described method. In this way, the S/N of the dye data can be improved by clustering the fluorescence wavelength bands. In addition, the amount of calculation required for unmixing can be further reduced. In addition, the accuracy of separation of the dye data can be maintained by performing unmixing using the statistical values of the intensity values for each clustered wavelength group.
- the clustering unit 202 of the data processing device 5 may perform only the clustering into the above-mentioned M wavelength groups and generate only M cluster matrices, without performing the clustering into L object groups in the above-mentioned embodiment.
- the data generation unit 205 of the data processing device 5 performs unmixing using the statistics of the N analysis objects for each of the M cluster matrices to generate K pieces of dye data (K is an integer between 2 and M).
- the data acquisition device 3 of the above embodiment may be modified to the configuration shown in FIG. 13.
- the difference between the data acquisition device 3A according to the modified example shown in FIG. 13 and the data acquisition device 3A is that the optical system 53 includes a spectrometer 58 and a detector 59.
- the spectrometer 58 disperses the fluorescence generated from the sample fluid into multiple wavelength bands (for example, 1024 channel wavelength bands).
- the detector 59 is a one-dimensional detector or a two-dimensional detector having multiple pixels (for example, 1024 pixels), and measures the intensity of the fluorescence of each wavelength band incident on each pixel from the spectrometer 58 and outputs it to the electronic system 54.
- Such a data acquisition device 3A can generate array data of multiple fluorescence wavelength bands.
- the 1024-channel array data generated by the data acquisition device 3A is divided into 512 cluster matrices by the data processing device 5 clustering two adjacent channels into one wavelength group.
- the method further includes a data acquisition device that acquires spectral data that is a distribution of intensity values for each of the C detection wavelengths by irradiating excitation light of each of the multiple excitation wavelengths onto the object.
- the statistical value is calculated based on the integrated value, the mode, or the median value of the intensity values of the object group. In this case, unmixing suitable for the observation conditions is performed, and highly accurate dye data can be obtained.
- a mixing matrix is obtained using statistics of C detection wavelengths for each of L cluster matrices, and unmixing is performed using the mixing matrix.
- the amount of calculation required for unmixing can be reduced.
- the accuracy of separation of pigment data can be improved. As a result, the throughput when acquiring pigment data can be improved while increasing the accuracy of separated data.
- the data generation step it is also preferable to use non-negative matrix factorization to calculate loss values based on the statistics of C detection wavelengths for each of L cluster matrices, and to obtain a mixing matrix based on the sum of the loss values. In this case, it is possible to improve the throughput when acquiring dye data while improving the accuracy of the separation data.
- the C detection wavelengths are clustered into M detection wavelength groups (M is an integer between 2 and C-1) based on the intensity values, and M cluster matrices are further generated in which the intensity values for each of the N objects are arranged for each clustered detection wavelength group.
- M is an integer between 2 and C-1
- M cluster matrices are further generated in which the intensity values for each of the N objects are arranged for each clustered detection wavelength group.
- the dye data acquisition method of the embodiment may be [2] "the dye data acquisition method described in [1] above, in which, in the data acquisition step, the target object is irradiated with excitation light of a plurality of excitation wavelengths, thereby acquiring the spectral data, which is a distribution of the intensity values for each of the C detection wavelengths.”
- the dye data acquisition method of the embodiment may be [3] "the dye data acquisition method described in [2] above, in which in the clustering step, the N objects are clustered based on distribution information of the intensity values for each of the C detection wavelengths.”
- the pigment data acquisition method of the embodiment may be [5] "the pigment data acquisition method described in any one of [1] to [4] above, in which in the data generation step, a mixing matrix is obtained using the statistics of the C detection wavelengths for each of the L cluster matrices, and unmixing is performed using the mixing matrix.”
- the dye data acquisition method of the embodiment may be [6] "the dye data acquisition method described in [5] above, in which in the data generation step, a loss value is calculated based on the statistical values of the C detection wavelengths for each of the L cluster matrices using non-negative matrix factorization, and the mixing matrix is obtained based on the sum of the loss values.”
- the dye data acquisition method of the embodiment may be [7] "the dye data acquisition method described in [6] above, in which, in the data generation step, the loss value for each of the L cluster matrices is corrected based on the statistical value, and the mixing matrix is obtained based on the sum of the corrected loss values.”
- the dye data acquisition method of the embodiment may be [8] "a dye data acquisition method according to any one of [1] to [7] above, in which in the clustering step, for each of the N objects, the C detection wavelengths are clustered into M detection wavelength groups (M is an integer between 2 and C-1) based on the intensity values, and M cluster matrices are further generated in which the intensity values for each of the N objects are arranged for each clustered detection wavelength group.”
- Reference Signs List 1 Pigment data acquisition system, 3, 3A: Data acquisition device, 5: Data processing device, 201: Data acquisition section, 202: Clustering section, 203: Statistical value calculation section, 204: Matrix estimation section, 205: Data generation section, A: Mixing matrix.
Landscapes
- Physics & Mathematics (AREA)
- Health & Medical Sciences (AREA)
- Spectroscopy & Molecular Physics (AREA)
- Immunology (AREA)
- Chemical & Material Sciences (AREA)
- General Physics & Mathematics (AREA)
- Chemical Kinetics & Catalysis (AREA)
- Optics & Photonics (AREA)
- Nuclear Medicine, Radiotherapy & Molecular Imaging (AREA)
- Life Sciences & Earth Sciences (AREA)
- Analytical Chemistry (AREA)
- Biochemistry (AREA)
- General Health & Medical Sciences (AREA)
- Pathology (AREA)
- Investigating, Analyzing Materials By Fluorescence Or Luminescence (AREA)
Priority Applications (3)
| Application Number | Priority Date | Filing Date | Title |
|---|---|---|---|
| JP2024541848A JP7564408B1 (ja) | 2023-02-24 | 2023-12-26 | 色素データ取得方法、色素データ取得装置、及び色素データ取得プログラム |
| CN202380094638.3A CN120731358A (zh) | 2023-02-24 | 2023-12-26 | 色素数据取得方法、色素数据取得装置和色素数据取得程序 |
| DE112023005866.0T DE112023005866T5 (de) | 2023-02-24 | 2023-12-26 | Farbstoffdaten-erfassungsverfahren, farbstoffdaten-erfassungsvorrichtung und farbstoffdaten-erfassungsprogramm |
Applications Claiming Priority (2)
| Application Number | Priority Date | Filing Date | Title |
|---|---|---|---|
| JP2023-027533 | 2023-02-24 | ||
| JP2023027533 | 2023-02-24 |
Publications (1)
| Publication Number | Publication Date |
|---|---|
| WO2024176614A1 true WO2024176614A1 (ja) | 2024-08-29 |
Family
ID=92500939
Family Applications (1)
| Application Number | Title | Priority Date | Filing Date |
|---|---|---|---|
| PCT/JP2023/046650 Ceased WO2024176614A1 (ja) | 2023-02-24 | 2023-12-26 | 色素データ取得方法、色素データ取得装置、及び色素データ取得プログラム |
Country Status (4)
| Country | Link |
|---|---|
| JP (1) | JP7564408B1 (https=) |
| CN (1) | CN120731358A (https=) |
| DE (1) | DE112023005866T5 (https=) |
| WO (1) | WO2024176614A1 (https=) |
Citations (4)
| Publication number | Priority date | Publication date | Assignee | Title |
|---|---|---|---|---|
| JP2020087465A (ja) * | 2018-11-16 | 2020-06-04 | ソニー株式会社 | 情報処理装置、情報処理方法及びプログラム |
| JP2021036224A (ja) * | 2019-08-23 | 2021-03-04 | ソニー株式会社 | 情報処理装置、情報処理方法、プログラム及び情報処理システム |
| US20220082488A1 (en) * | 2020-06-26 | 2022-03-17 | Cytek Biosciences, Inc. | Methods of forming multi-color fluorescence-based flow cytometry panel |
| WO2023026742A1 (ja) * | 2021-08-25 | 2023-03-02 | 浜松ホトニクス株式会社 | 色素画像取得方法、色素画像取得装置、及び色素画像取得プログラム |
-
2023
- 2023-12-26 JP JP2024541848A patent/JP7564408B1/ja active Active
- 2023-12-26 WO PCT/JP2023/046650 patent/WO2024176614A1/ja not_active Ceased
- 2023-12-26 DE DE112023005866.0T patent/DE112023005866T5/de active Pending
- 2023-12-26 CN CN202380094638.3A patent/CN120731358A/zh active Pending
Patent Citations (4)
| Publication number | Priority date | Publication date | Assignee | Title |
|---|---|---|---|---|
| JP2020087465A (ja) * | 2018-11-16 | 2020-06-04 | ソニー株式会社 | 情報処理装置、情報処理方法及びプログラム |
| JP2021036224A (ja) * | 2019-08-23 | 2021-03-04 | ソニー株式会社 | 情報処理装置、情報処理方法、プログラム及び情報処理システム |
| US20220082488A1 (en) * | 2020-06-26 | 2022-03-17 | Cytek Biosciences, Inc. | Methods of forming multi-color fluorescence-based flow cytometry panel |
| WO2023026742A1 (ja) * | 2021-08-25 | 2023-03-02 | 浜松ホトニクス株式会社 | 色素画像取得方法、色素画像取得装置、及び色素画像取得プログラム |
Also Published As
| Publication number | Publication date |
|---|---|
| JP7564408B1 (ja) | 2024-10-08 |
| JPWO2024176614A1 (https=) | 2024-08-29 |
| CN120731358A (zh) | 2025-09-30 |
| DE112023005866T5 (de) | 2026-01-29 |
Similar Documents
| Publication | Publication Date | Title |
|---|---|---|
| US20240344985A1 (en) | Dye image acquisition method, dye image acquisition device, and dye image acquisition program | |
| USRE49543E1 (en) | Fine particle measuring apparatus | |
| US12487167B2 (en) | Methods and apparatus for full spectrum flow cytometer | |
| JP2023098911A (ja) | 分析システム | |
| US20260104343A1 (en) | Information processing device, information processing method, program, and information processing system | |
| CN101201313B (zh) | 改变测量系统的一个或多个参数的方法 | |
| CN113168529A (zh) | 信息处理设备、信息处理方法和程序 | |
| WO2021182031A1 (ja) | 粒子解析システムおよび粒子解析方法 | |
| JPWO2017126170A1 (ja) | 微小粒子測定装置、情報処理装置及び情報処理方法 | |
| JP7564408B1 (ja) | 色素データ取得方法、色素データ取得装置、及び色素データ取得プログラム | |
| EP4653848A1 (en) | Separated image acquisition method, separated image acquisition device, and separated image acquisition program | |
| CN117274236B (zh) | 基于高光谱图像的尿液成分异常检测方法及系统 | |
| WO2026042345A1 (ja) | 色素データ取得方法、色素データ取得装置、及び色素データ取得プログラム | |
| WO2026042344A1 (ja) | 色素データ取得方法、色素データ取得装置、及び色素データ取得プログラム | |
| EP4653849A1 (en) | Fluorescent image acquisition method, fluorescent image acquisition device, and fluorescent image acquisition program | |
| WO2026042403A1 (ja) | 画像取得方法、装置、及びプログラム |
Legal Events
| Date | Code | Title | Description |
|---|---|---|---|
| WWE | Wipo information: entry into national phase |
Ref document number: 2024541848 Country of ref document: JP |
|
| 121 | Ep: the epo has been informed by wipo that ep was designated in this application |
Ref document number: 23924258 Country of ref document: EP Kind code of ref document: A1 |
|
| WWE | Wipo information: entry into national phase |
Ref document number: 202380094638.3 Country of ref document: CN |
|
| WWE | Wipo information: entry into national phase |
Ref document number: 112023005866 Country of ref document: DE |
|
| WWP | Wipo information: published in national office |
Ref document number: 202380094638.3 Country of ref document: CN |
|
| WWP | Wipo information: published in national office |
Ref document number: 112023005866 Country of ref document: DE |
|
| 122 | Ep: pct application non-entry in european phase |
Ref document number: 23924258 Country of ref document: EP Kind code of ref document: A1 |