WO2024095378A1 - 予測装置、予測方法、及びプログラム - Google Patents
予測装置、予測方法、及びプログラム Download PDFInfo
- Publication number
- WO2024095378A1 WO2024095378A1 PCT/JP2022/040922 JP2022040922W WO2024095378A1 WO 2024095378 A1 WO2024095378 A1 WO 2024095378A1 JP 2022040922 W JP2022040922 W JP 2022040922W WO 2024095378 A1 WO2024095378 A1 WO 2024095378A1
- Authority
- WO
- WIPO (PCT)
- Prior art keywords
- prediction
- quality
- prediction result
- unit
- result
- Prior art date
- Legal status (The legal status is an assumption and is not a legal conclusion. Google has not performed a legal analysis and makes no representation as to the accuracy of the status listed.)
- Ceased
Links
Images







Classifications
-
- H—ELECTRICITY
- H04—ELECTRIC COMMUNICATION TECHNIQUE
- H04W—WIRELESS COMMUNICATION NETWORKS
- H04W16/00—Network planning, e.g. coverage or traffic planning tools; Network deployment, e.g. resource partitioning or cells structures
- H04W16/22—Traffic simulation tools or models
-
- H—ELECTRICITY
- H04—ELECTRIC COMMUNICATION TECHNIQUE
- H04W—WIRELESS COMMUNICATION NETWORKS
- H04W48/00—Access restriction; Network selection; Access point selection
- H04W48/16—Discovering, processing access restriction or access information
Definitions
- the present invention relates to a technology for predicting the quality of services used by a device.
- the transmission (transmission) of information collected by an information transmitting device to an information receiving device via a network is used in a variety of fields.
- information from a device (information transmitting device) that can be obtained using sensors such as cameras and LiDAR (Light Detection and Ranging) is transmitted via a network to an information processing platform (information receiving device) on the edge/cloud side.
- the quality of the network (NW) used to transmit the information, or the quality of the transmitted information (e.g. video) itself, is important. Both the quality of the network (NW) and the quality of the transmitted information itself can be obtained by measurement.
- conventional technology may overestimate quality, which may have a negative impact on the applications of the quality prediction. Furthermore, conventional technology may reduce the effectiveness of prediction results based on actual values (and prediction results that take these into account). In other words, conventional quality prediction technology may not be able to make appropriate quality predictions.
- the present invention has been made in consideration of the above points, and aims to provide a technology for appropriately predicting the quality of services related to devices.
- a prediction device for predicting quality of service for a device comprising: an acquisition unit that acquires a first prediction result from a first prediction unit that predicts quality based on a usage record of the service, and acquires a second prediction result from a second prediction unit that predicts a possible quality according to a current state of the device; and a quality prediction unit that uses the first prediction result and the second prediction result to calculate a quality prediction result to be used in a predetermined function.
- the disclosed technology provides a technique for appropriately predicting the quality of services related to a device.
- FIG. 1 is a diagram illustrating an example of a system configuration related to NW quality prediction.
- FIG. 1 is a diagram for explaining a problem.
- FIG. 13 is a diagram for explaining Problem 2.
- FIG. 1 is a diagram for explaining an overview of the present embodiment.
- 1 is a diagram showing an apparatus configuration (system configuration) according to an embodiment of the present invention;
- FIG. 2 is a sequence diagram for explaining the operation in the present embodiment.
- FIG. 13 is a diagram for explaining a specific information exchange. 13 is a flowchart of logic example 2.
- FIG. 2 is a diagram illustrating an example of the configuration of a quality/change prediction unit 30.
- FIG. 2 is a diagram illustrating an example of the configuration of a quality prediction unit 10A.
- FIG. 13 is a diagram illustrating an example of a NW quality history database.
- FIG. 2 illustrates an example of a hardware configuration of the apparatus.
- quality changes refers to, for example, deterioration of quality or improvement of quality.
- Quality prediction and quality change prediction may be referred to as “quality/change prediction.”
- the technology according to the present invention can also be applied to quality/change prediction for things other than communications in a network.
- the technology according to the present invention can also be applied to quality/change prediction for video when providing video acquired by a device.
- Both "communications in a network” and “provision of video” are examples of "services related to devices.” It should be noted that "services related to devices” can also be rephrased as "services used by devices.”
- quality change is “quality” in a broad sense, and quality and quality change may be collectively referred to as “quality.”
- the network quality to be predicted includes, but is not limited to, bandwidth, packet loss rate, delay, jitter, etc.
- the number of prediction means (quality prediction units 10) is not limited to a specific number.
- the number of prediction means (quality prediction units 10) may be one, two, or three or more.
- edge/cloud computing In recent years, edge/cloud computing has been used in various fields. In edge/cloud computing, for example, information on the device side obtained by sensors such as cameras and LiDAR (Light Detection and Ranging) is transmitted via a network to an information processing platform on the edge/cloud side.
- sensors such as cameras and LiDAR (Light Detection and Ranging)
- LiDAR Light Detection and Ranging
- the information processing platform processes and manipulates the collected information for users such as humans and AI. In addition, this information is used to transmit downstream information such as sending signals to control the device from the information processing platform as necessary, or sending alert notifications.
- the quality of the network (NW) used for information transmission and the quality of the transmitted information (e.g. video) itself can both be measured through test information transmission or information transmission based on actual use. Meanwhile, technology to predict the quality of a NW and the quality of information transmitted using that NW based on past performance and the current environment/situation is being widely studied in fields dealing with future predictions, particularly in the field of machine learning/AI.
- Figure 1 shows an example of a system configuration related to network quality prediction.
- an information transmitting device 1 and a wireless base station 2 are connected via a wireless access network 4, and the wireless base station 2 and an information receiving device 3 are connected via a core network 5.
- the control device 6 predicts the quality of the wireless access network, for example, using the multi-radio proactive control technology disclosed in Non-Patent Document 1.
- the control device 7 predicts the network quality in a specific area/specific time period, for example, using the quality prediction technology disclosed in Non-Patent Document 2.
- Quality prediction of a network used for information transmission is used for various purposes such as operation planning of an autonomous vehicle and network control, for example, when controlling the method of information transmission (e.g., controlling the transmission bit rate of video), an erroneous quality prediction may cause the information transmission (control) to fail. For example, if a transmission bit rate larger than the available bandwidth of the network is set due to an overly positive evaluation of quality that may adversely affect the application of the quality prediction, this may result in a degradation of the quality of information transmission, such as distorting or stopping the video on the information receiving side.
- prediction means A is "E2E network quality prediction based on the actual information transmission results (results accumulated in the time-space direction) in a specific information transmission use case such as remote monitoring control of autonomous vehicles based on video transmission”
- prediction means B and C are network quality predictions according to the current situation (e.g., radio wave propagation environment) rather than the results, in an environment where the information transmission amount is controlled using min ⁇ A, B, C ⁇ (bps) as the predicted result of the network bandwidth, the information transmission amount tends to be kept low.
- the actual throughput value for video transmission will be equal to or less than that, excluding overhead.
- prediction result A by prediction means A based on the actual throughput value also tends to decrease, and min ⁇ A, B, C ⁇ also tends to decrease due to the influence of A.
- min ⁇ A, B, C ⁇ will continue to drop and will eventually become 0 in theory. This will result in the network bandwidth prediction result remaining at 0 bps, making it impossible to utilize network quality prediction for various purposes, such as controlling information transmission based on the network bandwidth prediction. In other words, the effectiveness of prediction results based on performance values (and prediction results that take this into account) will decrease.
- Prediction means A is a means for performing E2E network quality prediction (A) based on the throughput performance value in actual information transmission
- prediction means B is a means for performing network quality prediction (B) based on the radio wave propagation environment in the location of the device (e.g., information transmitting device 1 or information receiving device 3) performing the communication for which the quality is predicted.
- the NW quality prediction value of prediction means A is "NW-A: 3Mbps, NW-B: 2Mbps, NW-C: 5Mbps
- the NW quality prediction value of prediction means B is "NW-A: 5Mbps, NW-B: 5Mbps, NW-C: 6Mbps”.
- the prediction result is "NW-A: 3Mbps, NW-B: 2Mbps, NW-C: 5Mbps".
- the NW quality prediction value of prediction means A is "NW-A: 3Mbps, NW-B: 2Mbps, NW-C: 5Mbps
- the NW quality prediction value of prediction means B is "NW-A: 5Mbps, NW-B: 1Mbps, NW-C: 4Mbps”.
- the prediction result is "NW-A: 3Mbps, NW-B: 1Mbps, NW-C: 4Mbps".
- ⁇ Example of Task 2 Diagram> A specific example of problem 2 will be described with reference to Fig. 3. Nos. 1 to 4 in Fig. 3 show state changes (changes over time) in the driving environment of an autonomous vehicle when the above-mentioned control is performed.
- the "throughput performance value” shown in Fig. 3 is the throughput performance value that is the basis for the predicted bandwidth of prediction means A, and the "packet loss rate” is the packet loss rate when the throughput performance value is measured.
- the "bandwidth prediction value” is not based on the performance value, but is a prediction value of prediction means B based on the current situation such as the radio wave propagation environment, and is, for example, a prediction value using the technology disclosed in Non-Patent Document 1.
- the actual throughput is 1 Mbps
- the actual packet loss rate is 10%
- the predicted bandwidth is 10 Mbps at the quality degradation point, and everywhere else, the actual throughput is 10 Mbps
- the actual packet loss rate is 0%
- the predicted bandwidth is 10 Mbps.
- the prediction device predicts network quality (including changes such as quality degradation) by combining a network quality prediction means A that estimates the available bandwidth from a safe side based on the track record of what was available in actual information transmission, and a network quality prediction means B that estimates the available bandwidth that can be taken depending on the current situation, such as the device position of an autonomous vehicle or the like, and the physical environment, such as the radio wave propagation environment, rather than based on the track record.
- a network quality prediction means A that estimates the available bandwidth from a safe side based on the track record of what was available in actual information transmission
- a network quality prediction means B that estimates the available bandwidth that can be taken depending on the current situation, such as the device position of an autonomous vehicle or the like, and the physical environment, such as the radio wave propagation environment, rather than based on the track record.
- prediction means A and B are not limited to the above.
- prediction means A may be a prediction means that cannot respond to changes in the physical environment but can take into account traffic congestion conditions that affect information transmission in E2E
- prediction means B may be a prediction means that can respond to changes in the radio wave propagation environment but cannot take into account background traffic.
- the method of adoption/reflection in the final network quality/change prediction result is determined according to the characteristics of the prediction method and the characteristics of the prediction result.
- Figure 4 also uses the driving environment of an autonomous vehicle as an example.
- the actual throughput value is 1Mbps
- the actual packet loss rate value is 10%
- the predicted bandwidth value is 10Mbps.
- the actual throughput value is 10Mbps
- the actual packet loss rate value is 0%
- the predicted bandwidth value is 10Mbps.
- state “2” which is the state after using "1”
- the actual throughput will be 10Mbps
- the actual packet loss rate will be 0%
- the predicted bandwidth will be 10Mbps.
- the quality degradation points will be released (recovery based on challenging usage plans/usage results).
- Fig. 5 is a configuration diagram of a prediction device according to this embodiment. As shown in Fig. 5, the prediction device according to this embodiment has a plurality of quality prediction units 10 (10A to 10C are shown as examples), a user information management unit 20, a quality/change prediction unit 30, a quality prediction unit management unit 40, and a quality/change prediction result transmission unit 50.
- a configuration including multiple quality prediction units 10, user information management units 20, quality/change prediction units 30, quality prediction unit management units 40, and quality/change prediction result transmission units 50 may be called a prediction system.
- the configuration in which the quality/change prediction unit 30 exists may be called a prediction device or a prediction system.
- the quality/change prediction unit 30 may be called a prediction device.
- each quality prediction unit 10 transmits the quality prediction results to the quality/change prediction unit 30.
- the user information management unit 20 transmits user information related to the quality/change prediction (information related to the utilization use of the quality/change prediction) to the quality/change prediction unit 30.
- the quality prediction unit management unit 40 transmits the characteristics of the quality prediction unit to the quality/change prediction unit 30.
- the quality/change prediction unit 30 executes prediction processing based on the information received in S101 to S105.
- the quality/change prediction unit 30 transmits the quality/change prediction result to the quality/change prediction result transmission unit 50.
- the quality/change prediction result transmission unit 50 transmits the quality/change prediction result to the external function 60.
- External function 60 is, for example, a control function (control device) that controls a device that performs communication that is the subject of quality prediction.
- External function 60 may be a planning function that uses the quality/change prediction results, an alert notification function that uses the quality/change prediction results, or a function other than these.
- External functions are examples of "predetermined functions.”
- the quality/change prediction unit 30 does not receive a prediction result from a certain quality prediction unit 10, it predicts the quality/change based on the results of the other quality prediction units 10.
- the quality/change prediction unit 30 may include in the quality/change prediction result what information was used to predict the result. For example, information such as "This result is based on the results of A and B" or "This result is based only on B" may be included in the quality/change prediction result.
- the prediction device of this embodiment predicts network quality (including changes such as quality degradation) by combining a network quality prediction means A that estimates the available bandwidth from a safe side based on the track record of availability in actual information transmission, and a network quality prediction means B that estimates the available bandwidth that can be taken depending on the current situation, such as the device position of an autonomous vehicle or the like, and the physical environment, such as the radio wave propagation environment.
- the quality/change prediction unit 30 does not simply adopt the worst value (lower limit value) of the prediction results by the multiple quality prediction units 10 as the NW quality/change prediction result, but determines how to adopt/reflect the prediction result by the quality prediction unit 10 into the final NW quality/change prediction result according to the characteristics of the quality prediction unit 10 or the characteristics of the prediction result.
- the final prediction result is the prediction result that is output to the quality/change prediction result transmission unit 50.
- the quality/change prediction unit 30 may predict (final) quality that does not include changes such as quality degradation. Alternatively, it may predict changes such as quality degradation without predicting quality that does not include changes such as quality degradation (i.e., without outputting the final predicted result of the quality).
- At least one of the multiple quality prediction units 10 corresponds to prediction means A, and at least one of the multiple quality prediction units 10 corresponds to prediction means B.
- quality prediction unit 10A is prediction means A
- quality prediction unit 10B is prediction means B.
- quality prediction unit 10A prediction means A
- quality prediction unit 10B prediction means B
- Fig. 7 shows 10A and 10B as the quality prediction unit 10.
- Quality prediction unit 10A performs E2E network quality prediction based on information transmission records, while quality prediction unit 10B performs network quality prediction that predicts possible quality not based on information transmission records but based on the device's current status, such as the device's location and the radio wave propagation environment at that location. Both quality prediction unit 10A and quality prediction unit 10B perform network quality prediction for communications that are the subject of quality prediction and are performed by a certain device.
- the quality prediction unit 10A transmits the throughput, packet loss rate, and delay of each information transmission flow to the quality/change prediction unit 30.
- the quality prediction unit 10B transmits the bandwidth, packet loss rate, delay, and prediction reliability (prediction value also includes confidence interval) of each network to the quality/change prediction unit 30.
- the user information management unit 20 transmits user information related to the quality/change prediction (information related to the use of the quality/change prediction) to the quality/change prediction unit 30.
- An example of information sent from the user information management unit 20 is as follows:
- the quality prediction unit management unit 40 transmits the characteristics of the quality prediction unit 10 (e.g., A: based on actual values, B: available bandwidth prediction for the wireless section based on the radio wave propagation environment) to the quality/change prediction unit 30.
- A based on actual values
- B available bandwidth prediction for the wireless section based on the radio wave propagation environment
- the quality/change prediction unit 30 executes a prediction process for the network quality/change. As a result of the prediction process, the quality/change prediction unit 30 transmits, for example, the following information to the quality/change prediction result transmission unit 50.
- logic example 1 and logic example 2 will be explained based on specific examples.
- operation example 1 and operation example 2 will be explained.
- the user information and predicted values for operation example 1 and operation example 2 are as follows.
- the predicted values are the predicted bandwidth (X Mbps) and the packet loss rate (X%) when the actual throughput value on which the predicted bandwidth is based is measured.
- ⁇ User information and predicted values in operation example 1> ⁇ User information related to judgment Recommended transmission bit rate: 5Mbps ⁇ NW quality prediction value of NW quality prediction unit 10A NW-A: 3 Mbps, 10% NW-B: 2Mbps, 1% NW-C: 5Mbps, 0% ⁇ NW quality prediction value of NW quality prediction unit 10B NW-A: 5Mbps, 5% NW-B: 5Mbps, 2% NW-C: 6Mbps, 1% ⁇ User Information and Prediction Values in Operation Example 2> ⁇ User information related to judgment Recommended transmission bit rate: 3Mbps ⁇ NW quality prediction value of NW quality prediction unit 10A NW-A: 3 Mbps, 10% NW-B: 2Mbps, 1% NW-C: 5Mbps, 0% ⁇ Network quality prediction value of prediction means B NW-A: 5Mbps, 5% NW-B: 1Mbps, 2% NW-C: 4Mbps, 1% ⁇ Logic example 1 for predicting network quality/changes> In logic example 1, the quality/variation prediction unit 30 adopts the worst value (lower limit
- the value of the quality/change prediction unit 10 adopted above is used as the predicted value of the packet loss rate (if the predicted band of A is adopted, the predicted value of the packet loss rate of A).
- the predicted delay value can be determined in the same way as the packet loss rate, or the larger value can be used as a safer option (depending on the policy).
- NW-A 3Mbps
- 10% NW-B 2Mbps
- 1% NW-C 5Mbps
- 0% ⁇ Quality degradation detection result
- NW-A NG (quality degradation)
- NW-B NG (quality degradation)
- NW-C OK (no quality degradation)
- NW quality prediction results and the quality deterioration detection results are as follows:
- the quality/change prediction unit 30 receives the result of E2E network quality prediction (A) based on the throughput performance value in actual information transmission, the result of network quality prediction (B) based on the radio wave propagation environment, the characteristics of the quality prediction unit 10 (A, B), and user information related to the quality/change prediction.
- the network quality prediction result includes the predicted bandwidth, packet loss rate, and delay.
- the quality/change prediction unit 30 determines whether the predicted band of A is smaller than the predicted band of B. If the result of the determination is Yes, the process proceeds to S203, and if the result is No, the process proceeds to S204.
- the quality/change prediction unit 30 judges whether the packet loss rate when measuring the throughput performance value on which A's predicted bandwidth is based is n% (e.g., 1%) or less. If the judgment result is Yes, proceed to S204, and if the judgment result is No, proceed to S205.
- the quality/change prediction unit 30 adopts the predicted bandwidth/packet loss rate/delay of B as the NW quality prediction result.
- the quality/change prediction unit 30 adopts the predicted bandwidth/packet loss rate/delay of A as the NW quality prediction result.
- the quality/change prediction unit 30 compares the NW quality prediction result with the user information related to the quality/change prediction to determine whether it corresponds to a change (deterioration), and transmits the NW quality prediction result and the deterioration determination result together to the quality/change prediction result transmission unit 50 as the quality/change prediction result.
- the prediction result by B is used to calculate the final prediction result. Note that here, as an example of "calculation”, the prediction result by B is used as is. If the packet loss rate based on past performance is greater than (or greater than) the threshold, it is determined that there is no bandwidth greater than or equal to the actual throughput value, and the prediction result by A is used.
- the predicted delay value may be determined in the same way as the packet loss rate, or the larger value may be adopted as a policy to err on the side of caution (depending on the policy).
- Logic Example 2 can calculate a network bandwidth prediction result that is close to the actual available bandwidth while avoiding overestimation based on a certain degree of reliable evidence, and can detect quality degradation based on that bandwidth.
- logic example 2 determines whether there is a margin left in the available bandwidth estimated on the safe side based on the packet loss rate actual value in quality prediction unit 10A, and determines whether there is a prediction that there is an available bandwidth greater than the actual bandwidth, as indicated by another prediction means (quality prediction unit 10B).
- NW-A 3Mbps
- 10% NW-B 5Mbps
- 2% NW-C 6Mbps
- NW-B OK (no quality degradation)
- NW-C OK (no quality degradation)
- the NW quality prediction result and the quality degradation detection result are as follows:
- the quality/change prediction unit 30 adopts the value of " ⁇ (A's predicted bandwidth) + (B's predicted bandwidth) ⁇ /2" as the predicted bandwidth.
- the predicted bandwidth of B may be divided by the number of flows sharing the bandwidth and used as the "predicted bandwidth of B" in the above formula.
- the value of " ⁇ (predicted bandwidth of A) + ⁇ (predicted bandwidth of B) ⁇ /( ⁇ + ⁇ )" may be used as the predicted bandwidth.
- ⁇ and ⁇ are, for example, predetermined weights.
- Logic Example 3 avoids overestimating the available bandwidth by gradually increasing the margin that is considered to be left in the estimated available bandwidth on the safe side.
- the packet loss rate when measuring the actual throughput value on which A's predicted bandwidth is based is n% (e.g., 1%) or less, and if "A's predicted bandwidth ⁇ B's predicted bandwidth" and B's reliability (%) is p% (e.g., 90%) or more, the quality/change prediction unit 30 adopts a value taking into account B's predicted bandwidth, as in logic examples 2 and 3, and if B's reliability (%) is less than p%, the quality/change prediction unit 30 adopts A's predicted bandwidth.
- the method of taking into account may be changed depending on the value of p.
- the value of B's predicted band ⁇ p/100 may be taken into account.
- Logic example 4 makes it possible to determine whether or not a prediction means (example: B) that estimates the possible (maximum) available bandwidth predicts that there is an "available bandwidth greater than the actual bandwidth” depending on the reliability of the prediction result.
- a prediction means example: B
- the quality/change prediction unit 30 adopts a value taking into account the predicted bandwidth of B, as in logic examples 2 and 3. Note that the above "lower limit” may be replaced with an intermediate value or an upper limit depending on the policy.
- Logic example 5 makes it possible to determine whether or not a prediction means (example: B) that estimates the possible (maximum) available bandwidth predicts that there is an "available bandwidth greater than the actual bandwidth” depending on the confidence interval of the prediction result and the policy of how far to go into the margin that is considered to remain in the available bandwidth estimated from a safe side.
- a prediction means example: B
- the quality/change prediction unit 30 adopts the value of A's predicted bandwidth x ⁇ ( ⁇ >1).
- the packet loss rate and delay are the same as in example 2.
- ⁇ is a predetermined coefficient.
- Logic example 6 makes it possible to avoid a situation in which the network bandwidth prediction results continue to decline even when only a prediction method (e.g., A) that estimates the available bandwidth from a conservative perspective is available.
- a prediction method e.g., A
- the quality/change prediction unit 30 assumes that the predicted bandwidth of quality prediction unit 10A (which estimates the available bandwidth from a safe side) is used as a base, and that it provides protection using the predicted bandwidths of quality prediction unit 10B and quality prediction unit 10C (which estimate the (maximum) possible available bandwidth).
- Quality prediction unit 10C is one of the "prediction means B.”
- the quality/change prediction unit 30 compares the actual throughput value, B's predicted bandwidth, and C's predicted bandwidth when the packet loss rate when the actual throughput value was measured in the past is m% (e.g. 5%) or less, and adopts the predicted bandwidth of the quality prediction unit 10 (B or C) that has predicted a value close to the actual throughput value more frequently.
- the packet loss rate and delay are the same as in logic example 1 (and example 2).
- the quality/change prediction unit 30 compares the throughput actual value, the predicted bandwidth of B, and the predicted bandwidth of C when the packet loss rate when the throughput actual value was measured in the past is m% (e.g., 5%) or less, and adopts the predicted bandwidth of the quality prediction unit 10 (B or C) with the smaller total value of the difference between the throughput actual value and the predicted bandwidth.
- the packet loss rate and delay are the same as in example 1.
- Logic Example 8 makes it possible to utilize forecasting methods that are believed to provide predictions that are closer to the actual situation when viewed cumulatively.
- ⁇ Network quality/change prediction logic example 9> In logic example 9, with respect to part (2) of logic example 7, if the packet loss rate when measuring the throughput actual value on which the predicted bandwidth of A is based is n% (e.g., 1%) or less and "the predicted bandwidth of A is less than the predicted bandwidth of B and the predicted bandwidth of A is less than the predicted bandwidth of C", the quality/change prediction unit 30 compares the throughput actual value, the predicted bandwidth of B, and the predicted bandwidth of C in the case where the packet loss rate when the throughput actual value was measured in the past is k% (e.g., 20%) or more, and adopts the predicted bandwidth of the prediction means having the smaller total value of the difference between the throughput actual value and the predicted bandwidth (only cases where the predicted bandwidth is larger are counted).
- the packet loss rate and delay are the same as in example 1.
- Example 9 allows for the use of a predictive method that is less prone to overestimating quality, which can have a detrimental effect on the application of the quality prediction.
- Examples 7, 8, and 9 we have shown examples of combination methods when there are three or more types of prediction methods, but the reliability and confidence intervals shown in Examples 4 and 5 may be used as a method of taking each prediction method into account (a method of determining whether to take each prediction method into account).
- the above are examples of methods for adopting (combining) the prediction results from each prediction means, and the method for taking each prediction means into account (including the degree to which it is taken into account) may be changed depending on the current situation, such as the device location and surrounding environment, or on policies, or it may be possible to change whether or not to take a certain prediction means into account.
- Fig. 9 is a configuration diagram of the prediction device.
- the prediction device is a device that predicts the quality (or quality change) of a service related to a device.
- the quality/change prediction unit 30 includes an acquisition unit 31, a quality prediction unit 32, and a judgment unit 33.
- the quality prediction unit 32 may not be included.
- the judgment unit 33 may not be included.
- the acquisition unit 31 acquires a first prediction result from a first prediction unit (e.g., prediction means A) that predicts quality based on the usage history of the service, and acquires a second prediction result from a second prediction unit (e.g., prediction means B) that predicts the possible quality according to the current situation of the device.
- the acquired prediction result is stored, for example, in a storage unit such as a memory provided in the quality/change prediction unit 30, and is read out and used by the quality prediction unit 32 or the determination unit 33.
- the quality prediction unit 32 uses the first prediction result and the second prediction result to calculate a quality prediction result to be used in a specified function.
- An example of the calculation logic is as described above.
- the determination unit 33 uses the first prediction result, the second prediction result, and the user information to determine whether or not there has been a change in the quality of the service. For example, if the user information is that "the information transmission delay must be less than X ms," the determination unit 33 uses the first prediction result and the second prediction result to predict the delay, for example, using the logic example described above, and outputs a determination result that there has been a deterioration in quality if the delay exceeds X.
- the determination unit 33 may use the prediction results from the quality prediction unit 32.
- the quality prediction unit 10A includes an operation plan acquisition unit 11, an event information acquisition unit 12, a time/location information acquisition unit 13, a device sensor such as an IMU 14, a future location prediction unit 15, a NW quality prediction unit 16, a NW quality history database 17, and a NW quality prediction result transmission unit 18.
- the outline of the operation is as follows.
- the operation plan acquisition unit 11, event information acquisition unit 12, time/position information acquisition unit 13, and device sensor 14 such as an IMU transmit the operation plan, event information, time/position information (present), acceleration, angular velocity, and other sensor information of the device (target device) that communicates with the target device for which quality prediction is to be performed to the future position prediction unit 15.
- the future location prediction unit 15 predicts the future location of the target device based on the received information and transmits the time/location information (future) to the NW quality prediction unit 16.
- the NW quality prediction unit 16 refers to the NW quality history database 17 based on the time/location information (future) and obtains the throughput, packet loss rate, and delay (actual values) of each information transmission flow.
- the NW quality prediction unit 16 transmits the NW quality prediction results (throughput, packet loss rate, and delay of each information transmission flow) to the NW quality prediction result transmission unit 18.
- the NW quality prediction result transmission unit 18 transmits the NW quality prediction results to external functions that use the NW quality prediction results.
- the quality prediction unit 10A predicts the NW quality using information in the NW quality history database 17.
- Figure 11 shows an image of the NW quality history database 17.
- the NW quality history database 17 in this example stores information source identifiers, time, position, speed/attitude, and NW quality.
- identifier we assume an identifier at the network (line) level (including information on what kind of QoS control has been applied), but it is also acceptable to assign an identifier so that filtering can be done at the device/equipment level as a broad classification, and at the flow-based level based on the application as a finer classification.
- the quality prediction unit 10A uses time/location information (future) as a key to refer to information in the NW quality history database 17.
- time/location information (future)
- the range of information to be referred to is, for example, as shown in (1) or (2) below.
- n which is the filtering threshold
- n is increased gradually.
- a method of gradually increasing n is used, only the most recent results will be referenced, so a method of increasing n discontinuously may be used.
- this method can be used to automatically restore quality when the results of a sudden network quality degradation deviate from the basis information used when calculating predicted values based on past results.
- n the maximum value of n is greater than the accumulation period of the information transmission record (in places where the frequency of information transmission based on the use case is low, it is assumed that trial information transmission will be carried out, in which case the period will be used), then theoretically there will be at least one information transmission record in n, making it possible to predict network quality using this function.
- outlier testing may be included as necessary.
- an outlier test (Smirnoff-Grubbs test) is performed and the average value or the xx percentile value is extracted.
- ⁇ Quality index, granularity, and QoS control> The relationship between the quality index of each network, the granularity such as flow/line/device unit, and QoS control is as follows.
- the target of quality/change prediction is network quality.
- the target of quality/change prediction may be video quality (VMAF, etc.).
- the target of prediction may be the state of a device (speed, acceleration, attitude, etc.).
- the quality prediction calculation policy may be such that a result on the safe side is always calculated, that it depends on the judgment basis, that it always calculates a result on the dangerous side, etc. It may also be assumed that a policy according to the KPI of information transmission or the characteristics of the transmitted information is applied. Furthermore, the applied policy may be changed as necessary.
- Any of the functional units and any of the combinations of the functional units among the quality prediction unit 10, the user information management unit 20, the quality/change prediction unit 30, the quality prediction unit management unit 40, and the quality/change prediction result transmission unit 50 described in this embodiment can be realized, for example, by causing a computer to execute a program.
- This computer may be a physical computer or a virtual machine on the cloud.
- the prediction device and prediction system described in this embodiment can be realized, for example, by having a computer execute a program.
- This computer may be a physical computer or a virtual machine on the cloud.
- the device can be realized by using hardware resources such as a CPU and memory built into a computer to execute a program corresponding to the processing performed by the device.
- the program can be recorded on a computer-readable recording medium (such as a portable memory) and then stored or distributed.
- the program can also be provided via a network such as the Internet or email.
- FIG. 12 is a diagram showing an example of the hardware configuration of the computer.
- the computer in FIG. 12 has a drive device 1000, an auxiliary storage device 1002, a memory device 1003, a CPU 1004, an interface device 1005, a display device 1006, an input device 1007, an output device 1008, etc., all of which are interconnected by a bus BS.
- the computer may further include a GPU.
- the program that realizes the processing on the computer is provided by a recording medium 1001, such as a CD-ROM or a memory card.
- a recording medium 1001 storing the program is set in the drive device 1000, the program is installed from the recording medium 1001 via the drive device 1000 into the auxiliary storage device 1002.
- the program does not necessarily have to be installed from the recording medium 1001, but may be downloaded from another computer via a network.
- the auxiliary storage device 1002 stores the installed program as well as necessary files, data, etc.
- the memory device 1003 When an instruction to start a program is received, the memory device 1003 reads out and stores the program from the auxiliary storage device 1002.
- the CPU 1004 realizes the functions related to the device in accordance with the program stored in the memory device 1003.
- the interface device 1005 is used as an interface for connecting to a network, etc.
- the display device 1006 displays a GUI (Graphical User Interface) based on a program, etc.
- the input device 1007 is composed of a keyboard and mouse, buttons, a touch panel, etc., and is used to input various operational instructions.
- the output device 1008 outputs the results of calculations.
- a prediction apparatus for predicting quality of service for a device comprising: Memory, at least one processor coupled to the memory; Including, The processor, obtaining a first prediction result from a first prediction unit that predicts quality based on a usage record of the service, and obtaining a second prediction result from a second prediction unit that predicts a possible quality according to a current state of the device; a prediction device that calculates a quality prediction result to be used in a predetermined function, using the first prediction result and the second prediction result.
- the prediction device according to claim 1, wherein the processor determines whether or not to use the second prediction result in calculating the quality prediction result, based on the first prediction result.
- a prediction apparatus for predicting a change in quality of service for a device comprising: Memory, at least one processor coupled to the memory; Including, The processor, obtaining a first prediction result from a first prediction unit that predicts quality based on a usage record of the service, and obtaining a second prediction result from a second prediction unit that predicts a possible quality according to a current state of the device; a prediction device that determines whether or not there is a change in quality of the service, using the first prediction result, the second prediction result, and user information.
- the user information is information related to an application of the quality prediction.
- a prediction method executed by a prediction device for predicting quality of service for a device comprising: an acquisition step of acquiring a first prediction result from a first prediction unit that predicts quality based on a usage record of the service, and acquiring a second prediction result from a second prediction unit that predicts a possible quality according to a current state of the device; a quality prediction step of calculating a quality prediction result to be used in a predetermined function using the first prediction result and the second prediction result.
- a prediction method executed by a prediction device for predicting a change in quality of service for a device comprising: an acquisition step of acquiring a first prediction result from a first prediction unit that predicts quality based on a usage record of the service, and acquiring a second prediction result from a second prediction unit that predicts a possible quality according to a current state of the device; and a determining step of determining whether or not there is a change in quality of the service by using the first prediction result, the second prediction result, and user information.
- a non-transitory storage medium storing a program for causing a computer to function as each unit in the prediction device according to any one of claims 1 to 5.
Landscapes
- Engineering & Computer Science (AREA)
- Computer Networks & Wireless Communication (AREA)
- Signal Processing (AREA)
- Computer Security & Cryptography (AREA)
- Data Exchanges In Wide-Area Networks (AREA)
Abstract
デバイスに関するサービスの品質を予測する予測装置において、前記サービスの利用実績に基づき品質を予測する第1予測部から第1予測結果を取得し、前記デバイスの現在の状況に応じて取り得る品質を予測する第2予測部から第2予測結果を取得する取得部と、前記第1予測結果と前記第2予測結果とを用いて、所定の機能において利用するための品質予測結果を算出する品質予測部とを備える。
Description
本発明は、デバイスが利用するサービスの品質を予測する技術に関連するものである。
情報送信装置側で収集した情報をネットワーク経由で情報受信装置側へ送信(伝送)する形態は、様々な分野で利用されている。例えば、エッジ/クラウドコンピューティングでは、例えば、カメラやLiDAR(Light Detection and Ranging)等のセンサで取得できるデバイス(情報送信装置)側の情報をネットワーク経由でエッジ/クラウド側の情報処理基盤(情報受信装置)に伝送する。
情報受信装置側へ伝送された情報を有効に活用するためには、情報伝送に利用されるネットワーク(NW)の品質、あるいは、伝送された情報(例:映像)そのものの品質が重要である。ネットワーク(NW)の品質と伝送された情報そのものの品質はいずれも計測により取得することが可能である。
また、過去の実績や現在の環境/状況から、NWの品質やそのNWを利用して伝送される情報の品質を予測する品質予測技術について、幅広く検討されている。
エクストリームNaaSに向けた無線技術ーマルチ無線プロアクティブ制御技術Cradio https://journal.ntt.co.jp/wp-content/uploads/2021/08/JN20210819.pdf
5GAA A-200055 https://5gaa.org/wp-content/uploads/2020/05/5GAA_A-200055_eNESQO_TR_final.pdf
上記の品質予測技術について、従来技術では、品質予測の活用用途に悪影響を及ぼし得る品質を過大評価する可能性がある。また、従来技術では、実績値に基づく予測結果(およびそれを考慮した予測結果)の実効性が低下する可能性がある。すなわち、従来の品質予測技術では、適切に品質予測を行うことができない可能性がある。
本発明は上記の点に鑑みてなされたものであり、デバイスに関するサービスの品質の予測を適切に行うための技術を提供することを目的とする。
開示の技術によれば、デバイスに関するサービスの品質を予測する予測装置であって、
前記サービスの利用実績に基づき品質を予測する第1予測部から第1予測結果を取得し、前記デバイスの現在の状況に応じて取り得る品質を予測する第2予測部から第2予測結果を取得する取得部と、
前記第1予測結果と前記第2予測結果とを用いて、所定の機能において利用するための品質予測結果を算出する品質予測部と
を備える予測装置が提供される。
前記サービスの利用実績に基づき品質を予測する第1予測部から第1予測結果を取得し、前記デバイスの現在の状況に応じて取り得る品質を予測する第2予測部から第2予測結果を取得する取得部と、
前記第1予測結果と前記第2予測結果とを用いて、所定の機能において利用するための品質予測結果を算出する品質予測部と
を備える予測装置が提供される。
開示の技術によれば、デバイスに関するサービスの品質の予測を適切に行うための技術が提供される。
以下、図面を参照して本発明の実施の形態(本実施の形態)を説明する。以下で説明する実施の形態は一例に過ぎず、本発明が適用される実施の形態は、以下の実施の形態に限られるわけではない。
以下、デバイス(情報送信装置に相当)と情報処理基盤(情報受信装置に相当)がネットワークを介して接続された全体システムにおいて、デバイスと情報処理基盤間の情報伝送に関する品質及び品質変化を予測する技術について説明する。なお、「品質変化」とは、例えば、品質が劣化すること、品質が改善すること、などである。品質予測及び品質変化予測を「品質/変化予測」と記載する場合がある。
以下では、本発明に係る技術をネットワーク(NW)における通信に対する品質予測及び品質変化予測に適用する場合を主に説明しているが、これは一例に過ぎない。本発明に係る技術は、ネットワークにおける通信以外の品質/変化予測にも適用可能である。例えば、本発明に係る技術は、デバイスによる取得した映像を提供する際の映像の品質/変化予測にも適用可能である。なお、「ネットワークにおける通信」、「映像の提供」はいずれも「デバイスに関するサービス」の例である。なお、「デバイスに関するサービス」を「デバイスが利用するサービス」に言い換えてもよい。
また、品質変化は広い意味で「品質」であり、品質と品質変化とを総称して「品質」と呼んでもよい。以下、本実施の形態に関連する従来技術と課題についてより詳細に説明する。
また、予測の対象とするNWの品質としては、帯域、パケットロス率、遅延、ジッタなどがあるが、これらに限定されない。また、予測手段(品質予測部10)の数は、特定の数に限定されない。予測手段(品質予測部10)の数は、1でもよいし、2でもよいし、3以上でもよい。
(従来技術について)
近年、エッジ/クラウドコンピューティングの形態が様々な分野で活用されている。エッジ/クラウドコンピューティングでは、例えば、カメラやLiDAR(Light Detection and Ranging)等のセンサで取得できるデバイス側の情報をネットワーク経由でエッジ/クラウド側の情報処理基盤に伝送する。
近年、エッジ/クラウドコンピューティングの形態が様々な分野で活用されている。エッジ/クラウドコンピューティングでは、例えば、カメラやLiDAR(Light Detection and Ranging)等のセンサで取得できるデバイス側の情報をネットワーク経由でエッジ/クラウド側の情報処理基盤に伝送する。
情報処理基盤において、収集した情報に対して、ヒトやAIなどの情報の利用者向けに情報処理/加工を施す。加えてそれらの情報を活用し、必要に応じて情報処理基盤側からデバイス側を制御する信号の送信やアラート通知といった下り方向の情報伝送を実施する。
情報伝送に利用されるネットワーク(NW)の品質と伝送された情報(例:映像)そのものの品質はいずれも、試験的な情報伝送あるいは実際の用途に基づく情報伝送そのものを通して計測できる。一方、過去の実績や現在の環境/状況からNWの品質やそのNWを利用して伝送される情報の品質を予測する技術について、未来予測を取り扱う分野、とりわけ機械学習/AI分野を中心に幅広く検討されている。
図1に、NW品質予測に関連するシステム構成の一例を示す。図1に示す例では、無線アクセスNW4を介して情報送信装置1と無線基地局2が接続され、コアNW5を介して無線基地局2と情報受信装置3が接続されている。
制御装置6は、例えば、非特許文献1に開示されたマルチ無線プロアクティブ制御技術を用いて、無線アクセスNWの品質の予測を行う。また、制御装置7は、例えば、非特許文献2に開示された品質予測技術を用いて、特定エリア/特定時間帯におけるNW品質の予測を行う。
(課題について)
上述した従来技術の課題として、下記の(1)課題1と(2)課題2を説明する。なお、以下の課題の説明内容は公知技術ではない。
上述した従来技術の課題として、下記の(1)課題1と(2)課題2を説明する。なお、以下の課題の説明内容は公知技術ではない。
(1)課題1
情報伝送に利用されるNWの品質予測を、自動運転車の運行計画策定、及びNW制御等の様々な用途に活用する場合において、例えば情報伝送の方法を制御する(例:映像の送信ビットレートを制御する)際には、誤った品質予測が情報伝送(制御)の失敗を招く可能性がある。例えば、品質予測の活用用途に悪影響を及ぼし得る品質を過大に良いほうに評価したために、NWの可用帯域よりも大きい送信ビットレートを設定した場合、その影響で、情報受信側の映像が乱れる、止まる等の情報伝送の品質低下が発生する可能性がある。
情報伝送に利用されるNWの品質予測を、自動運転車の運行計画策定、及びNW制御等の様々な用途に活用する場合において、例えば情報伝送の方法を制御する(例:映像の送信ビットレートを制御する)際には、誤った品質予測が情報伝送(制御)の失敗を招く可能性がある。例えば、品質予測の活用用途に悪影響を及ぼし得る品質を過大に良いほうに評価したために、NWの可用帯域よりも大きい送信ビットレートを設定した場合、その影響で、情報受信側の映像が乱れる、止まる等の情報伝送の品質低下が発生する可能性がある。
(2)課題2
予測精度を向上させるために、予測根拠あるいは予測特性の異なる複数の予測手段(例:予測手段A/B/C)を組み合わせてNW品質を予測することが考えられる。この場合、「課題1」で記載した事態を回避する(品質予測の活用用途に悪影響を及ぼし得る品質の過大評価を回避する)ために、常に安全側に倒す方針(例:予測手段A/B/Cに基づくNW帯域の予測結果がそれぞれA/B/Cであればmin{A,B,C}をNW帯域の予測結果として採用する)で予測を続けると、予測手段によっては実効的な予測ができなくなる可能性がある。常に安全側に倒す方針とは、例えば、予測手段A/B/Cに基づくNW帯域の予測結果がそれぞれA/B/Cであればmin{A,B,C}をNW帯域の予測結果として採用することである。
予測精度を向上させるために、予測根拠あるいは予測特性の異なる複数の予測手段(例:予測手段A/B/C)を組み合わせてNW品質を予測することが考えられる。この場合、「課題1」で記載した事態を回避する(品質予測の活用用途に悪影響を及ぼし得る品質の過大評価を回避する)ために、常に安全側に倒す方針(例:予測手段A/B/Cに基づくNW帯域の予測結果がそれぞれA/B/Cであればmin{A,B,C}をNW帯域の予測結果として採用する)で予測を続けると、予測手段によっては実効的な予測ができなくなる可能性がある。常に安全側に倒す方針とは、例えば、予測手段A/B/Cに基づくNW帯域の予測結果がそれぞれA/B/Cであればmin{A,B,C}をNW帯域の予測結果として採用することである。
より具体的には、例えば、予測手段Aが「映像伝送に基づく自動運転車等の遠隔監視制御といった具体的な情報伝送ユースケースにおいて実際に情報伝送した実績(時空間方向に蓄積される実績)に基づくE2EでのNW品質予測」であり、予測手段B,Cが、実績ではなく現在状況(例:電波伝搬環境)に応じたNW品質予測である場合において、min{A,B,C}(bps)をNW帯域の予測結果として情報伝送量を制御する環境下では、情報伝送量が低く抑えられる傾向になる。
例えば、映像の送信ビットレートをmin{A,B,C}(bps)以下とする制御では、オーバーヘッドを除くと映像伝送におけるスループット実績値はそれ以下となる。
スループット実績値に基づく予測手段Aによる予測結果(予測結果A)も低下傾向となり、min{A, B, C}はAの影響で低下傾向となる。
突発的なNW品質低下の影響によるスループット実績値の低下に応じてmin{A,B,C}は低下し続け、理論上では最終的に0になる。NWの帯域予測結果が0bpsとなり続ける事態となり、NWの帯域予測に基づいて情報伝送を制御する等、様々な用途へのNW品質予測の活用ができなくなる。つまり、実績値に基づく予測結果(及びそれを考慮した予測結果)の実効性が低下する。
<課題2の具体例>
上述した課題2での状況の具体例を、図2のシステム構成を例にとって説明する。図2に示すシステムでは、情報送信装置1と情報受信装置3が、NW-A、NW-B、及びNW-Cにより接続されている。
上述した課題2での状況の具体例を、図2のシステム構成を例にとって説明する。図2に示すシステムでは、情報送信装置1と情報受信装置3が、NW-A、NW-B、及びNW-Cにより接続されている。
ここで、予測手段Aと予測手段Bがあるとする。予測手段Aは、実際の情報伝送におけるスループット実績値に基づくE2EでのNW品質予測(A)を行う手段であり、予測手段Bは、品質予測対象の通信を行うデバイス(例:情報送信装置1あるいは情報受信装置3)の存在する場所における無線電波の伝搬環境に基づくNW品質予測(B)を行う手段である。
ここでは、予測手段AによるNW品質予測(A)の値をベースに、予測手段BによるNW品質予測(B)の値でガードをかけるように予測を行うことを想定する。つまり、NW品質予測(A)の値がNW品質予測(B)の値を超える場合、NW品質予測(B)の値を採用する。以下、この想定において、下記の動作例1、動作例2を示す。
動作例1において、予測手段AのNW品質予測値=「NW-A:3Mbps、NW-B:2Mbps、NW-C:5Mbps」であり、予測手段BのNW品質予測値=「NW-A:5Mbps、NW-B:5Mbps、NW-C:6Mbps」である。この場合、予測結果=「NW-A:3Mbps、NW-B:2Mbps、NW-C:5Mbps」となる。
動作例2において、予測手段AのNW品質予測値=「NW-A:3Mbps、NW-B:2Mbps、NW-C:5Mbps」であり、予測手段BのNW品質予測値=「NW-A:5Mbps、NW-B:1Mbps、NW-C:4Mbps」である。この場合、予測結果=「NW-A:3Mbps、NW-B:1Mbps、NW-C:4Mbps」となる。
上記の予測結果をNWの可用帯域として、可用帯域を超えないように情報伝送量を制御し続けると、実際の情報伝送におけるスループット実績値は低下する一方になるため、最終的には全てのNWの帯域予測結果が0Mbpsになる。
<課題2の具体例:図解>
課題2の具体例を、図3を参照して説明する。図3の1~4は、上述したような制御を行った場合における、自動運転車の走行環境の状態変化(時間の経過に伴う変化)を示している。図3に示す「スループット実績値」は予測手段Aの予測帯域の根拠となるスループット実績値であり、「パケットロス率」は、そのスループット実績値を測定した際のパケットロス率である。「帯域予測値」は、実績値に基づくのではなく、電波伝搬環境等の現在状況に基づく予測手段Bの予測値であり、例えば非特許文献1に開示の技術を用いた予測値である。
課題2の具体例を、図3を参照して説明する。図3の1~4は、上述したような制御を行った場合における、自動運転車の走行環境の状態変化(時間の経過に伴う変化)を示している。図3に示す「スループット実績値」は予測手段Aの予測帯域の根拠となるスループット実績値であり、「パケットロス率」は、そのスループット実績値を測定した際のパケットロス率である。「帯域予測値」は、実績値に基づくのではなく、電波伝搬環境等の現在状況に基づく予測手段Bの予測値であり、例えば非特許文献1に開示の技術を用いた予測値である。
「1」の状態において、「スループット実績値:10Mbps、パケットロス率実績値:0%、帯域予測値:10Mbps」であり、品質劣化ポイントはない。
「2」の状態において、品質劣化ポイントにおいて「スループット実績値:1Mbps、パケットロス率実績値:10%、帯域予測値:10Mbps」であり、それ以外の場所では、「スループット実績値:10Mbps、パケットロス率実績値:0%、帯域予測値:10Mbps」である。
「3」の状態において、品質劣化ポイントにおいて「当該NWを利用しない or 1Mbps以下の範囲で利用」であり、それ以外の場所では、「スループット実績値:10Mbps、パケットロス率実績値:0%、帯域予測値:10Mbps」である。
「4」の状態において、全て品質劣化ポイントになってしまい、例えば、全領域で「当該NWを利用しない or 1Mbps以下の範囲で利用」になる。
(実施の形態の概要)
上述した課題1、2をふまえ、本実施の形態に係る技術の概要を説明する。
上述した課題1、2をふまえ、本実施の形態に係る技術の概要を説明する。
天候(雨)等の物理環境の変化やイベントトラフィック(輻輳)起因で、あるポイントのスループット実績値が低下した場合、その時点(及びその影響が継続していると想定される間)では、そのポイントを品質劣化ポイントとして考慮する必要がある。
一方で、一度発生した突発的なNW品質低下の影響によるスループット実績値の低下に引きずられ続けるNW品質予測では、図3に示したように、理論上全ての領域が品質劣化ポイントとして解釈されてしまう事態に収束する。そのため、課題1で記載した事態を回避するために安全側を考慮しつつも、統計処理等の何かしらの手段で実効的なNW品質予測とする必要がある。
そこで、本実施の形態では、後述する予測装置が、実際の情報伝送で利用できた実績に基づいて安全側から可用帯域を推定するNW品質の予測手段Aと、実績に基づくのではなく、自動運転車等のデバイス位置や電波伝搬環境といった物理的な環境などの現在状況に応じて取り得る可用帯域を推定するNW品質の予測手段Bとを組み合わせてNW品質(品質劣化等の変化を含む)を予測する。
なお、予測手段A、Bは上記に限られない。例えば、予測手段Aは、物理環境の変化には対応できないがE2Eでの情報伝送に影響を与えるトラフィックの混雑状況を考慮できる予測手段であり、予測手段Bは、電波伝搬環境の変化に対応できるが背景トラフィックを考慮できない予測手段である、としてもよい。
NW品質予測結果として、複数の予測手段による予測結果の最悪値(下限値)を単純に採用するのではなく、予測手段の特性及び予測結果の特性に応じて最終的なNW品質/変化予測結果への採用/反映方法を決定する。
上記の手法を適用した場合の状態変化の例を、図4を参照して説明する。図4も、図3と同様に、自動運転車の走行環境を例にとっている。
「1」の品質劣化ポイントにおいて「スループット実績値:1Mbps、パケットロス率実績値:10%、帯域予測値:10Mbps」であり、それ以外の場所では、「スループット実績値:10Mbps、パケットロス率実績値:0%、帯域予測値:10Mbps」である。
この「1」において、品質劣化ポイントで劣化を考慮したNW利用を実施する。「1」の利用後、「スループット実績値:1Mbps、パケットロス率実績値:10%、帯域予測値:10Mbps」となる。
「1」の利用後の状態である「2」において、パケットロス率が閾値以下のため、帯域予測値を信頼してチャレンジングな(本来利用したかった方法=10Mbpsでの)NW利用を行う。
「2」の利用後、「スループット実績値:10Mbps、パケットロス率実績値:0%、帯域予測値:10Mbps」になる。「3」において、品質劣化ポイントの解放(チャレンジングな利用企図/利用実績に基づく回復)が行われる。
以下、本実施の形態に係る装置構成と動作の例を詳細に説明する。
(装置構成、全体動作)
図5は、本実施の形態における予測装置の構成図である。図5に示すように、本実施の形態の予測装置は、複数の品質予測部10(例として10A~10Cを示す)、ユーザ情報管理部20、品質/変化予測部30、品質予測部管理部40、品質/変化予測結果送信部50を有する。
図5は、本実施の形態における予測装置の構成図である。図5に示すように、本実施の形態の予測装置は、複数の品質予測部10(例として10A~10Cを示す)、ユーザ情報管理部20、品質/変化予測部30、品質予測部管理部40、品質/変化予測結果送信部50を有する。
複数の品質予測部10ユーザ情報管理部20、品質/変化予測部30、品質予測部管理部40、品質/変化予測結果送信部50を備える構成を予測システムと呼んでもよい。
また、品質/変化予測部30が存在する構成を予測装置又は予測システムと呼んでもよい。また、品質/変化予測部30を予測装置と呼んでもよい。
予測装置の全体動作例を図6のシーケンス図を参照して説明する。
S101~S103において、各品質予測部10は、品質/変化予測部30に対して品質予測結果を送信する。
S104において、ユーザ情報管理部20は、品質/変化予測に関わるユーザ情報(品質/変化予測の活用用途に関わる情報)を品質/変化予測部30に対して送信する。S105において、品質予測部管理部40は、品質/変化予測部30に対して品質予測部の特性を送信する。
S106において、品質/変化予測部30は、S101~S105で受信した情報に基づいて、予測処理を実行する。
S107において、品質/変化予測部30は、品質/変化予測結果送信部50に対して品質/変化予測結果を送信する。S108において、品質/変化予測結果送信部50は、外部機能60に品質/変化予測結果を送信する。
外部機能60は、例えば、品質予測の対象とする通信を行うデバイスを制御する制御機能(制御装置)である。外部機能60は、品質/変化予測結果を利用する計画策定機能であってもよいし、品質/変化予測結果を利用するアラート通知機能であってもよいし、これら以外の機能であってもよい。外部機能は「所定の機能」の例である。
なお、図5に示す構成において、品質/変化予測部30は、ある品質予測部10からの予測結果を受信しない場合は、それ以外の品質予測部10の結果に基づいて品質/変化を予測する。
また、品質/変化予測部30は、品質/変化予測結果に、その結果を予測するために利用した情報が何かを含めても構わない。例えば、「この結果はA,Bの結果に基づいた結果である」、あるいは「この結果はBのみに基づく結果である」などの情報を品質/変化予測結果に含めることとしてよい。
(予測方法について)
前述のとおり、本実施の形態に係る予測装置では、実際の情報伝送で利用できた実績に基づいて安全側から可用帯域を推定するNW品質の予測手段Aと、自動運転車等のデバイス位置や電波伝搬環境といった物理的な環境などの現在状況に応じて取り得る可用帯域を推定するNW品質の予測手段Bとを組み合わせてNW品質(品質劣化等の変化を含む)を予測する。
前述のとおり、本実施の形態に係る予測装置では、実際の情報伝送で利用できた実績に基づいて安全側から可用帯域を推定するNW品質の予測手段Aと、自動運転車等のデバイス位置や電波伝搬環境といった物理的な環境などの現在状況に応じて取り得る可用帯域を推定するNW品質の予測手段Bとを組み合わせてNW品質(品質劣化等の変化を含む)を予測する。
本実施の形態における品質/変化予測部30は、NW品質/変化予測結果として、複数の品質予測部10による予測結果の最悪値(下限値)を単純に採用するのではなく、品質予測部10の特性あるいは予測結果の特性に応じて、品質予測部10による予測結果の、最終的なNW品質/変化予測結果への採用/反映方法を決定する。なお、最終的な予測結果とは、品質/変化予測結果送信部50へ出力される予測結果である。
なお、品質/変化予測部30は、品質劣化等の変化を含まない(最終的な)品質の予測を行ってもよい。また、品質劣化等の変化を含まない品質の予測を行わずに(つまり、当該品質の最終的な予測結果を出力せずに)、品質劣化等の変化の予測を行うこととしてもよい。
図5に示すシステム構成において、複数の品質予測部10のうちの少なくとも1つは予測手段Aに対応し、複数の品質予測部10のうちの少なくとも1つは予測手段Bに対応する。なお、以降の説明では、品質予測部10Aが予測手段Aであり、品質予測部10Bが予測手段Bであるとする。また、品質予測部10A(予測手段A)を「A」と表記し、品質予測部10B(予測手段B)を「B」と表記する場合がある。
(動作の具体例)
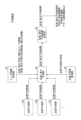
本実施の形態に係る技術をNW品質/変化の予測に適用した場合における、各機能部の間でやりとりされる情報の例を、図7を参照して説明する。ここでは、NW品質/変化予測に基づく映像伝送制御を行う場合を想定する。予測装置の構成は図5に示した構成と同じである。ただし、図7では、品質予測部10として、10Aと10Bを示している。
本実施の形態に係る技術をNW品質/変化の予測に適用した場合における、各機能部の間でやりとりされる情報の例を、図7を参照して説明する。ここでは、NW品質/変化予測に基づく映像伝送制御を行う場合を想定する。予測装置の構成は図5に示した構成と同じである。ただし、図7では、品質予測部10として、10Aと10Bを示している。
品質予測部10Aは、情報伝送実績に基づくE2EでのNW品質予測を行い、品質予測部10Bは、情報伝送実績に基づくのではなく、デバイス位置及びその位置の電波伝搬環境等の、デバイスの現在状況に基づいて取り得る品質を予測するNW品質予測を行うものとする。品質予測部10Aと品質予測部10Bのいずれも、あるデバイスが行う、品質予測の対象とする通信についてのNW品質予測を行う。
S1において、品質予測部10Aは、品質/変化予測部30に対して、各情報伝送フローのスループット、パケットロス率、及び遅延を送信する。
S2において、品質予測部10Bは、品質/変化予測部30に対して、各NWの帯域、パケットロス率、遅延、及び予測信頼度(予測値には信頼区間も含む)を送信する。
S3において、ユーザ情報管理部20は、品質/変化予測部30に対して、品質/変化予測に関わるユーザ情報(品質/変化予測の活用用途に関わる情報)を送信する。
ユーザ情報管理部20から送信される情報の例は下記のとおりである。
・映像伝送要件(例:推奨送信ビットレート○bps、遅延○s)
・QoS制御ポリシー(例:制御信号、映像、エンタメ情報を順にPQで制御)
S4において、品質予測部管理部40は、品質/変化予測部30に対して、品質予測部10の特性(例:A:実績値ベース、B:電波伝搬環境に基づく無線区間の可用帯域予測)を送信する。
・QoS制御ポリシー(例:制御信号、映像、エンタメ情報を順にPQで制御)
S4において、品質予測部管理部40は、品質/変化予測部30に対して、品質予測部10の特性(例:A:実績値ベース、B:電波伝搬環境に基づく無線区間の可用帯域予測)を送信する。
S1~S4の情報に基づいて、品質/変化予測部30はNW品質/変化の予測処理を実行する。予測処理の結果として、品質/変化予測部30は品質/変化予測結果送信部50に対して、例えば下記の情報を送信する。
○NW品質としてどの程度の品質を見込めるかの情報、具体的には、各情報伝送フローの可用NW品質予測結果
・帯域:○bps
・パケットロス率:○%
・遅延:○s
○QoS制御ポリシーに則って制御した際に要件を満たすNW品質かどうか(品質劣化と見なせるかどうか)を示す情報、具体的には、品質劣化検知結果
・帯域:○bps以上 or 未満
・パケットロス率:○s以下 or 超過
・遅延:○s以下 or 超過
上記の例で、例えば、「帯域が○bps未満」を通知することは、品質劣化が検知されたことを通知することに相当する。
・帯域:○bps
・パケットロス率:○%
・遅延:○s
○QoS制御ポリシーに則って制御した際に要件を満たすNW品質かどうか(品質劣化と見なせるかどうか)を示す情報、具体的には、品質劣化検知結果
・帯域:○bps以上 or 未満
・パケットロス率:○s以下 or 超過
・遅延:○s以下 or 超過
上記の例で、例えば、「帯域が○bps未満」を通知することは、品質劣化が検知されたことを通知することに相当する。
(NW品質/変化予測方法の例)
図7に示した構成におけるNW品質/変化の予測を例にとって、品質/変化予測部30によるNW品質/変化の予測のためのロジックの例を説明する。また、ここでは、図2に示したように、品質予測の対象とする通信を行うデバイスが使用するNWとして、NW-A、NW-B、NW-Cがあるものとする。
図7に示した構成におけるNW品質/変化の予測を例にとって、品質/変化予測部30によるNW品質/変化の予測のためのロジックの例を説明する。また、ここでは、図2に示したように、品質予測の対象とする通信を行うデバイスが使用するNWとして、NW-A、NW-B、NW-Cがあるものとする。
まず、ロジック例1とロジック例2それぞれを、具体例に基づき説明する。いずれの具体例においても、動作例1と動作例2を説明する。動作例1と動作例2それぞれのユーザ情報と予測値は下記のとおりである。予測値は、予測帯域(〇Mbps)と、予測帯域の根拠となったスループット実績値を計測した際のパケットロス率(〇%)である。
<動作例1のユーザ情報と予測値>
○判定に関わるユーザ情報
推奨送信ビットレート:5Mbps
○NW品質予測部10AのNW品質予測値
NW-A:3Mbps,10%
NW-B:2Mbps,1%
NW-C:5Mbps,0%
○NW品質予測部10BのNW品質予測値
NW-A:5Mbps,5%
NW-B:5Mbps,2%
NW-C:6Mbps,1%
<動作例2のユーザ情報と予測値>
○判定に関わるユーザ情報
推奨送信ビットレート:3Mbps
○NW品質予測部10AのNW品質予測値
NW-A:3Mbps,10%
NW-B:2Mbps,1%
NW-C:5Mbps,0%
○予測手段BのNW品質予測値
NW-A:5Mbps,5%
NW-B:1Mbps,2%
NW-C:4Mbps,1%
<NW品質/変化の予測のロジック例1>
ロジック例1では、品質/変化予測部30は、NWの帯域予測について、複数の品質/変化予測部10による予測結果のうちの最悪値(下限値)を予測値として採用する。
○判定に関わるユーザ情報
推奨送信ビットレート:5Mbps
○NW品質予測部10AのNW品質予測値
NW-A:3Mbps,10%
NW-B:2Mbps,1%
NW-C:5Mbps,0%
○NW品質予測部10BのNW品質予測値
NW-A:5Mbps,5%
NW-B:5Mbps,2%
NW-C:6Mbps,1%
<動作例2のユーザ情報と予測値>
○判定に関わるユーザ情報
推奨送信ビットレート:3Mbps
○NW品質予測部10AのNW品質予測値
NW-A:3Mbps,10%
NW-B:2Mbps,1%
NW-C:5Mbps,0%
○予測手段BのNW品質予測値
NW-A:5Mbps,5%
NW-B:1Mbps,2%
NW-C:4Mbps,1%
<NW品質/変化の予測のロジック例1>
ロジック例1では、品質/変化予測部30は、NWの帯域予測について、複数の品質/変化予測部10による予測結果のうちの最悪値(下限値)を予測値として採用する。
パケットロス率の予測値としては上記で採用された品質/変化予測部10の値(Aの予測帯域が採用された場合はAのパケットロス率の予測値)を採用する。
遅延の予測値としては、パケットロス率と同様の方法で決めてもよいし、安全側に倒すポリシーとして大きい方の値を採用することとしても構わない(ポリシーによる)。
<ロジック例1の動作例1>
前述の 動作例1におけるユーザ情報/予測値の場合、NW品質予測結果と品質劣化検知結果は下記のとおりである。
前述の 動作例1におけるユーザ情報/予測値の場合、NW品質予測結果と品質劣化検知結果は下記のとおりである。
〇制御根拠判定結果
・NW品質予測結果
NW-A:3Mbps,10%
NW-B:2Mbps,1%
NW-C:5Mbps,0%
・品質劣化検知結果
NW-A:NG(品質劣化あり)
NW-B:NG(品質劣化あり)
NW-C:OK(品質劣化なし)
<ロジック例1の動作例2>
前述の 動作例2におけるユーザ情報/予測値の場合、NW品質予測結果と品質劣化検知結果は下記のとおりである。
・NW品質予測結果
NW-A:3Mbps,10%
NW-B:2Mbps,1%
NW-C:5Mbps,0%
・品質劣化検知結果
NW-A:NG(品質劣化あり)
NW-B:NG(品質劣化あり)
NW-C:OK(品質劣化なし)
<ロジック例1の動作例2>
前述の 動作例2におけるユーザ情報/予測値の場合、NW品質予測結果と品質劣化検知結果は下記のとおりである。
○制御根拠判定結果
・NW品質予測結果
NW-A:3Mbps,10%
NW-B:1Mbps,2%
NW-C:4Mbps,1%
・品質劣化検知結果
NW-A:OK(品質劣化なし)
NW-B:NG(品質劣化あり)
NW-C:OK(品質劣化なし)
<NW品質/変化の予測のロジック例2>
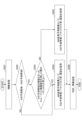
ロジック例2を図8のフローチャートを参照して説明する。
・NW品質予測結果
NW-A:3Mbps,10%
NW-B:1Mbps,2%
NW-C:4Mbps,1%
・品質劣化検知結果
NW-A:OK(品質劣化なし)
NW-B:NG(品質劣化あり)
NW-C:OK(品質劣化なし)
<NW品質/変化の予測のロジック例2>
ロジック例2を図8のフローチャートを参照して説明する。
S201において、品質/変化予測部30は、実際の情報伝送におけるスループット実績値に基づくE2EでのNW品質予測(A)の結果と無線電波の伝搬環境に基づくNWの品質予測(B)の結果、品質予測部10(A、B)の特性、品質/変化予測に関わるユーザ情報を受信する。なお、NW品質予測結果には、予測帯域、パケットロス率、遅延が含まれているとする。
S202において、品質/変化予測部30は、Aの予測帯域がBの予測帯域よりも小さいかどうかを判断する。判断結果がYesであればS203に進み、NoであればS204に進む。
S203において、品質/変化予測部30は、Aの予測帯域の根拠となったスループット実績値を計測した際のパケットロス率がn%(例:1%)以下かどうかを判断する。判断結果がYesであればS204に進み、NoであればS205に進む。
S204において、品質/変化予測部30は、NW品質予測結果として、Bの予測帯域/パケットロス率/遅延を採用する。S205において、品質/変化予測部30は、NW品質予測結果として、Aの予測帯域/パケットロス率/遅延を採用する。
S206において、品質/変化予測部30は、NW品質予測結果を品質/変化予測に関わるユーザ情報と照らし合わせることで、変化(劣化)に相当するかを判定し、NW品質予測結果と当該劣化判定結果を合わせて品質/変化予測結果として品質/変化予測結果送信部50に送信する。
上記の例では、過去実績としてパケットロス率が閾値以下(又は未満)であることを契機として、NWにおいてスループット実績値以上の帯域があると判断(推測)して、可用帯域側の予測結果(Bによる予測結果)を、最終的な予測結果の算出に利用する。なお、ここでは、「算出」の例として、Bによる予測結果をそのまま採用している。過去実績としてパケットロス率が閾値よりも大きい場合(又は閾値以上の場合)、スループット実績値以上の帯域がないと判断し、Aによる予測結果を採用している。
すなわち、上記の処理をまとめると下記のとおりである。
(1)品質予測部10Aの予測帯域をベースに品質予測部10Bの予測帯域でガードをかけることを前提とする。
(2)Aの予測帯域の根拠となったスループット実績値を計測した際のパケットロス率がn %(例:1 %)以下かつ「Aの予測帯域<Bの予測帯域」であればBの予測帯域を採用する。
(3)パケットロス率の予測値としては採用された予測結果の値(Bの予測帯域が採用された場合はBのパケットロス率の予測値)を採用する。
(4)遅延の予測値としては、パケットロス率と同様の方法で決めてもよいし、安全側に倒すポリシーとして大きい方の値を採用するとしてもよい(ポリシーによる)。
上記のような処理により、ロジック例2では、ある程度信頼できる根拠に基づいて過大評価を回避しつつ、実際の可用帯域に近いNWの帯域予測結果の算出と、その帯域に基づく品質劣化検知を行うことができる。
すなわち、ロジック例2により、品質予測部10Aにおけるパケットロス率実績値によって安全側から推定される可用帯域にマージンが残されているかどうかを判定することで、他の予測手段(品質予測部10B)が示すように実績以上の可用帯域が存在すると予測するかどうか、を判定する。
<ロジック例2の動作例1>
ロジック例2において、動作例1のユーザ情報/予測値の場合、NW品質予測結果と品質劣化検知結果は下記のとおりである。
ロジック例2において、動作例1のユーザ情報/予測値の場合、NW品質予測結果と品質劣化検知結果は下記のとおりである。
〇制御根拠判定結果
・NW品質予測結果
NW-A:3Mbps,10%
NW-B:5Mbps,2%
NW-C:6Mbps,1%
・品質劣化検知結果
NW-A:NG(品質劣化あり)
NW-B:OK(品質劣化なし)
NW-C:OK(品質劣化なし)
<ロジック例2の動作例2>
ロジック例2において、動作例2のユーザ情報/予測値の場合、NW品質予測結果と品質劣化検知結果は下記のとおりである。
・NW品質予測結果
NW-A:3Mbps,10%
NW-B:5Mbps,2%
NW-C:6Mbps,1%
・品質劣化検知結果
NW-A:NG(品質劣化あり)
NW-B:OK(品質劣化なし)
NW-C:OK(品質劣化なし)
<ロジック例2の動作例2>
ロジック例2において、動作例2のユーザ情報/予測値の場合、NW品質予測結果と品質劣化検知結果は下記のとおりである。
○制御根拠判定結果
・NW品質予測結果
NW-A:3Mbps,10%
NW-B:1Mbps,2%
NW-C:4Mbps,1%
・品質劣化検知結果
NW-A:OK(品質劣化なし)
NW-B:NG(品質劣化あり)
NW-C:OK(品質劣化なし)
更なるロジック例を以下に説明する。
・NW品質予測結果
NW-A:3Mbps,10%
NW-B:1Mbps,2%
NW-C:4Mbps,1%
・品質劣化検知結果
NW-A:OK(品質劣化なし)
NW-B:NG(品質劣化あり)
NW-C:OK(品質劣化なし)
更なるロジック例を以下に説明する。
<NW品質/変化予測のロジック例3>
ロジック例3では、ロジック例2の(2)の部分について、Aの予測帯域の根拠となったスループット実績値を計測した際のパケットロス率がn%(例:1%)以下かつ「Aの予測帯域<Bの予測帯域」であれば、品質/変化予測部30は、「{(Aの予測帯域)+(Bの予測帯域)}/2」の値を予測帯域として採用する。
ロジック例3では、ロジック例2の(2)の部分について、Aの予測帯域の根拠となったスループット実績値を計測した際のパケットロス率がn%(例:1%)以下かつ「Aの予測帯域<Bの予測帯域」であれば、品質/変化予測部30は、「{(Aの予測帯域)+(Bの予測帯域)}/2」の値を予測帯域として採用する。
なお、上記の計算式は一例である。例えば、Bの予測帯域について、帯域を共用するフロー数でBの予測帯域を割った値を、上記計算式の「Bの予測帯域」として使用してもよい。また、「{α(Aの予測帯域)+β(Bの予測帯域)}/(α+β)」の値を予測帯域として採用してもよい。α、βは、例えば予め定めた重みである。
Bの予測帯域は帯域全体であり、実際の各フローの可用帯域はその一部であることから、ロジック例3では、安全側から推定される可用帯域に残されていると考えられるマージンへの踏み込みを段階的に実施することで可用帯域の過大評価を回避する。
<NW品質/変化予測のロジック例4>
ロジック例4では、ロジック例2の(2)の部分について、品質/変化予測部30は、Aの予測帯域の根拠となったスループット実績値を計測した際のパケットロス率がn%(例:1%)以下かつ「Aの予測帯域<Bの予測帯域」かつBの信頼度(%)がp%(例:90%)以上であれば、ロジック例2及び例3と同様にBの予測帯域を加味した値を採用し、Bの信頼度(%)がp%未満であればAの予測帯域を採用する。
ロジック例4では、ロジック例2の(2)の部分について、品質/変化予測部30は、Aの予測帯域の根拠となったスループット実績値を計測した際のパケットロス率がn%(例:1%)以下かつ「Aの予測帯域<Bの予測帯域」かつBの信頼度(%)がp%(例:90%)以上であれば、ロジック例2及び例3と同様にBの予測帯域を加味した値を採用し、Bの信頼度(%)がp%未満であればAの予測帯域を採用する。
なお、pの大小により加味の方法を変更することとしてもよい。例えば、Bの予測帯域×p/100の値を加味対象とする、などの方法を取っても構わない。
ロジック例4により、予測結果の信頼度に応じて、取り得る(最大の)可用帯域を推定する予測手段(例:B)が示す「実績以上の可用帯域」が存在すると予測するかどうか、を判定することができる。
<NW品質/変化予測のロジック例5>
ロジック例5では、ロジック例2の(2)の部分について、品質/変化予測部30は、Aの予測帯域の根拠となったスループット実績値を計測した際のパケットロス率がn%(例:1%)以下かつ「Aの予測帯域<Bのp%(例:95%)信頼区間下限値」であれば、ロジック例2及び例3と同様にBの予測帯域を加味した値を採用する。なお、上記の「下限値」は、ポリシーによって、中間値又は上限値に置き換えてもよい。
ロジック例5では、ロジック例2の(2)の部分について、品質/変化予測部30は、Aの予測帯域の根拠となったスループット実績値を計測した際のパケットロス率がn%(例:1%)以下かつ「Aの予測帯域<Bのp%(例:95%)信頼区間下限値」であれば、ロジック例2及び例3と同様にBの予測帯域を加味した値を採用する。なお、上記の「下限値」は、ポリシーによって、中間値又は上限値に置き換えてもよい。
ロジック例5により、予測結果の信頼区間と、安全側から推定される可用帯域に残されていると考えられるマージンにどこまで踏み込むかのポリシーと、に応じて、取り得る(最大の)可用帯域を推定する予測手段(例:B)が示す「実績以上の可用帯域」が存在すると予測するかどうか、を判定することができる。
<NW品質/変化予測のロジック例6>
ロジック例6では、品質/変化予測部30は、品質予測部10Aの予測帯域の根拠となったスループット実績値を計測した際のパケットロス率がn%(例:1%)以下であれば、Aの予測帯域×α(α>1)の値を採用する。パケットロス率と遅延に関しては例2と同様である。αは予め定めた係数である。
ロジック例6では、品質/変化予測部30は、品質予測部10Aの予測帯域の根拠となったスループット実績値を計測した際のパケットロス率がn%(例:1%)以下であれば、Aの予測帯域×α(α>1)の値を採用する。パケットロス率と遅延に関しては例2と同様である。αは予め定めた係数である。
ロジック例6により、安全側から可用帯域を推定する予測手段(例:A)のみ利用可能な場合でもNWの帯域予測結果が低下し続ける事態を回避することが可能となる。
<NW品質/変化予測のロジック例7>
ロジック例7では、品質/変化予測部30は、下記の(1)、(2)を行う。
ロジック例7では、品質/変化予測部30は、下記の(1)、(2)を行う。
(1)品質/変化予測部30は、品質予測部10A(安全側から可用帯域を推定)の予測帯域をベースに、品質予測部10Bと品質予測部10C(取り得る(最大の)可用帯域を推定)の予測帯域でガードをかけることを前提とする。品質予測部10Cは「予測手段B」の一つである。
(2)品質/変化予測部30は、Aの予測帯域の根拠となったスループット実績値を計測した際のパケットロス率がn %(例:1 %)以下かつ「Aの予測帯域<Bの予測帯域、かつ、Aの予測帯域<Cの予測帯域」であれば、過去にスループット実績値を計測した際のパケットロス率がm%(例:5%)以下の場合における、スループット実績値、Bの予測帯域、Cの予測帯域を比較し、スループット実績値に近い値を予測した回数が多い方の品質予測部10(B又はC)の予測帯域を採用する。パケットロス率と遅延に関してはロジック例1(及び例2)と同様である。
ロジック例7では、高頻度に実情と近い予測実績が積み上げられている予測手段を活用することができる。
<NW品質/変化予測のロジック例8>
ロジック例8では、ロジック例7の(2)の部分について、品質/変化予測部30は、Aの予測帯域の根拠となったスループット実績値を計測した際のパケットロス率がn%(例:1%)以下かつ「Aの予測帯域<Bの予測帯域、かつ、Aの予測帯域<Cの予測帯域」であれば、過去にスループット実績値を計測した際のパケットロス率がm%(例:5%)以下の場合における、スループット実績値、Bの予測帯域、Cの予測帯域を比較し、スループット実績値と予測帯域の差分の合計値が小さい方の品質予測部10(B又はC)の予測帯域を採用する。パケットロス率と遅延に関しては例1と同様である。
ロジック例8では、ロジック例7の(2)の部分について、品質/変化予測部30は、Aの予測帯域の根拠となったスループット実績値を計測した際のパケットロス率がn%(例:1%)以下かつ「Aの予測帯域<Bの予測帯域、かつ、Aの予測帯域<Cの予測帯域」であれば、過去にスループット実績値を計測した際のパケットロス率がm%(例:5%)以下の場合における、スループット実績値、Bの予測帯域、Cの予測帯域を比較し、スループット実績値と予測帯域の差分の合計値が小さい方の品質予測部10(B又はC)の予測帯域を採用する。パケットロス率と遅延に関しては例1と同様である。
ロジック例8により、累積で見た際に、より実情と近い予測ができていると考えられる予測手段を活用することができる。
<NW品質/変化予測のロジック例9>
ロジック例9では、ロジック例7の(2)の部分について、品質/変化予測部30は、Aの予測帯域の根拠となったスループット実績値を計測した際のパケットロス率がn%(例:1%)以下かつ「Aの予測帯域<Bの予測帯域、かつ、Aの予測帯域<Cの予測帯域」であれば、過去にスループット実績値を計測した際のパケットロス率がk%(例:20%)以上の場合における、スループット実績値、Bの予測帯域、Cの予測帯域を比較し、スループット実績値と予測帯域の差分(予測帯域の方が大きい場合のみを集計)の合計値が小さい方の予測手段の予測帯域を採用する。パケットロス率と遅延に関しては例1と同様である。
ロジック例9では、ロジック例7の(2)の部分について、品質/変化予測部30は、Aの予測帯域の根拠となったスループット実績値を計測した際のパケットロス率がn%(例:1%)以下かつ「Aの予測帯域<Bの予測帯域、かつ、Aの予測帯域<Cの予測帯域」であれば、過去にスループット実績値を計測した際のパケットロス率がk%(例:20%)以上の場合における、スループット実績値、Bの予測帯域、Cの予測帯域を比較し、スループット実績値と予測帯域の差分(予測帯域の方が大きい場合のみを集計)の合計値が小さい方の予測手段の予測帯域を採用する。パケットロス率と遅延に関しては例1と同様である。
ロジック例9により、品質予測の活用用途に悪影響を及ぼし得る品質の過大評価をする傾向が小さい予測手段を活用することができる。
<補足>
以上、ロジック例1~9を説明した。ロジック例1~9のうちのいずれか複数のロジックを組み合わせて実施してもよい。
以上、ロジック例1~9を説明した。ロジック例1~9のうちのいずれか複数のロジックを組み合わせて実施してもよい。
例4、5に関して、パケットロス率実績値の考慮を外した形態(パケットロス率実績値の値に関わらず、Bの信頼度や信頼区間に応じてBの予測帯域を加味する形態)でも構わない(これを採用するかどうかはポリシーによる)。
例7、8、9に関して、予測手段が3種類以上ある場合の組み合わせ方法の例を示したが、各予測手段を加味する方法(加味するかどうかを判定する方法)として例4,5に示した信頼度や信頼区間を用いても構わない。
上記は各予測手段による予測結果の採用方法(組み合わせ方法)の例であり、デバイス位置や周辺環境等の現在状況、あるいは、ポリシー、に応じて、各予測手段を加味する方法(程度を含む)を変動させてもよいし、ある予測手段を加味するかどうかを変動させても構わない。
(品質/変化予測部30の構成例)
上述したような、「最終的な品質予測」あるいは「品質変化の判定」を実行する品質/変化予測部30の構成例を図9に示す。前述のように、品質/変化予測部30を予測装置と呼ぶ場合、図9は、予測装置の構成図である。当該予測装置は、デバイスに関するサービスの品質(又は品質変化)を予測する装置である。
上述したような、「最終的な品質予測」あるいは「品質変化の判定」を実行する品質/変化予測部30の構成例を図9に示す。前述のように、品質/変化予測部30を予測装置と呼ぶ場合、図9は、予測装置の構成図である。当該予測装置は、デバイスに関するサービスの品質(又は品質変化)を予測する装置である。
図9に示すように、品質/変化予測部30は、取得部31、品質予測部32、判定部33を備える。図9において、品質予測部32を備えないこととしてもよい。図9において、判定部33を備えないこととしてもよい。
取得部31は、サービスの利用実績に基づき品質を予測する第1予測部(例:予測手段A)から第1予測結果を取得し、デバイスの現在の状況に応じて取り得る品質を予測する第2予測部(例:予測手段B)から第2予測結果を取得する。取得した予測結果は、例えは、品質/変化予測部30が備えるメモリ等の記憶部に格納され、品質予測部32あるいは判定部33により読み出されて利用される。
品質予測部32は、第1予測結果と第2予測結果とを用いて、所定の機能において利用するための品質予測結果を算出する。算出のロジック例は前述したとおりである。
判定部33は、第1予測結果、第2予測結果、及び、ユーザ情報を用いて、サービスの品質変化の有無を判定する。例えば、ユーザ情報が、「情報伝送の遅延はXms以下であることを要する」であるとすると、例えば、判定部33は、第1予測結果と第2予測結果を用いて、例えば前述のロジック例を用いて遅延を予測し、その遅延がXを超えていれば品質劣化あり、との判定結果を出力する。
なお、遅延等の品質の予測に関しては、判定部33は、品質予測部32による予測結果を用いても良い。
(品質予測部10Aの構成例)
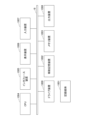
情報伝送実績に基づくE2EでのNW品質予測を行う品質予測部10Aの内部構成例を図10に示す。図10に示すように、本例での品質予測部10Aは、運行計画取得部11、イベント情報取得部12、時刻/位置情報取得部13、IMU等デバイスセンサ14、未来位置予測部15、NW品質予測部16、NW品質履歴データベース17、NW品質予測結果送信部18を備える。動作概要は下記のとおりである。
情報伝送実績に基づくE2EでのNW品質予測を行う品質予測部10Aの内部構成例を図10に示す。図10に示すように、本例での品質予測部10Aは、運行計画取得部11、イベント情報取得部12、時刻/位置情報取得部13、IMU等デバイスセンサ14、未来位置予測部15、NW品質予測部16、NW品質履歴データベース17、NW品質予測結果送信部18を備える。動作概要は下記のとおりである。
運行計画取得部11、イベント情報取得部12、時刻/位置情報取得部13、IMU等デバイスセンサ14からそれぞれ、品質予測を行う対象の通信を行うデバイス(対象デバイス)における、運行計画、イベント情報、時刻/位置情報(現在)、加速度、角速度等センサ情報が未来位置予測部15に送信される。
未来位置予測部15は、受信した情報に基づいて、対象デバイスについての未来の位置を予測し、時刻/位置情報(未来)をNW品質予測部16に送信する。NW品質予測部16は、時刻/位置情報(未来)に基づいてNW品質履歴データベース17を参照し、各情報伝送フローのスループット、パケットロス率、遅延(実績値)を取得する。
NW品質予測部16は、NW品質予測結果(各情報伝送フローのスループット、パケットロス率、遅延)をNW品質予測結果送信部18に送信する。NW品質予測結果送信部18は、NW品質予測結果を利用する外部機能などに対してNW品質予測結果を送信する。
(品質予測部10AによるNW品質の予測方法について)
上述のように、品質予測部10Aは、NW品質履歴データベース17の情報を用いてNW品質の予測を行う。
上述のように、品質予測部10Aは、NW品質履歴データベース17の情報を用いてNW品質の予測を行う。
図11に、NW品質履歴データベース17のイメージを示す。図9に示すように、本例のNW品質履歴データベース17には、情報源識別子、時刻、位置、速度/姿勢、NW品質が格納される。
「識別子」に関しては、NW(回線)レベル(どのようなQoS制御をされたのかの情報を含む)の識別子を想定するが、大きな区分としてのデバイス/装置レベルのフィルタリングができ、小さな区分としてアプリケーションに基づくフロー単位のレベルでフィルタリングできるように、識別子を付与する形態でも構わない。
<参照する情報の範囲について>
品質予測部10Aは、時刻/位置情報(未来)をキーにNW品質履歴データベース17の情報を参照する。どの範囲の情報を参照するかに関しては、例えば下記の(1)、(2)のとおりである。
品質予測部10Aは、時刻/位置情報(未来)をキーにNW品質履歴データベース17の情報を参照する。どの範囲の情報を参照するかに関しては、例えば下記の(1)、(2)のとおりである。
(1)時刻でフィルタリング(予測対象時刻の前後n(分)の範囲)
(2)位置でフィルタリング(予測対象位置から半径n(m)の範囲)
具体的なnの与え方の例を説明する。
(2)位置でフィルタリング(予測対象位置から半径n(m)の範囲)
具体的なnの与え方の例を説明する。
〇イベントトラフィックに対応するためには、できるだけ直近の実績を参照することが望ましい。
そこで、例えば、フィルタリングの閾値となるnをはじめは小さく取り、検索結果がない(=直近の実績がない)場合はnを大きくする。例えば、nを徐々に大きくする。ただし、nを徐々に大きくする方法を用いる場合、直近の実績のみを参照することになってしまうため、nは非連続に大きくする方法を用いてもよい。
より具体的には、そもそも「直近」の実績がなければイベントトラフィックへの対応はできないため、2~3段階程度でnを大きくする方法を想定する。例えばこの方法により、実績に基づく予測値算出時の根拠情報から、突発的なNW品質低下の実績値が外れることによる品質自動回復を行うことができる。
○情報伝送実績の蓄積周期とnの最大値との関係は下記の(1)、(2)のとおりである。
なお、情報伝送実績がない場合は本機能でのNW品質予測は不可とする(この場合、他のNW品質予測に基づいてNW品質/変化が予測される)。
(1)情報伝送実績の蓄積周期(ユースケースに基づく情報伝送の頻度が低い場所では試験的な情報伝送の実施が想定されるが、その場合はその周期)よりもnの最大値が大きければ、理論上nの中に少なくとも一つは情報伝送実績が存在することになるので本機能でのNW品質予測が可能である。
その情報伝送実績は更新されていくため、突発的なNW品質低下の実績値が残り続ける(=品質劣化ポイントと見なされ続ける)問題は発生しない。これにより課題2を回避できる。
(2)情報伝送実績の蓄積周期よりもnの最大値が小さければ、本機能でのNW品質予測に使える情報伝送実績がない状態が一時的に発生する。情報伝送実績がない場合、本機能でのNW品質予測自体が不可になるため、そもそも課題2に記載の事態は発生しない。これは、前述の「実績に基づく予測値算出時の根拠情報から、突発的なNW品質低下の実績値が外れる」ことと同様である。
<スループット(実績値)が複数あった場合の処理について>
データベースにスループット(実績値)が複数あった場合、例えば、下記の(1)~(5)のいずれかを採用する。
データベースにスループット(実績値)が複数あった場合、例えば、下記の(1)~(5)のいずれかを採用する。
(1)最大値を抽出(その際のパケットロス率を抽出)。
(2)パケットロス率がn(%)以下でフィルタリングした後に最大値を抽出。
(3)最大値に安全率(例:その時のパケットロス率がn(%)であれば、(100-n)/100など)をかけた数値を採用する。
(4)スループット(実績値)×上記安全率で最大となる数値を採用する。
(5)平均値を採用する。
上記の(1)~(5)のいずれにおいても、必要に応じて外れ値検定の実施を含むこととしてよい。
遅延に関しては、例えば、外れ値検定(スミルノフ=グラブス検定)を実施の上、平均値あるいはxx %タイル値を抽出する。
<品質指標、粒度、QoS制御について>
各NWの品質指標と、フロー/回線/デバイス単位などの粒度と、QoS制御との関係については下記のとおりである。
各NWの品質指標と、フロー/回線/デバイス単位などの粒度と、QoS制御との関係については下記のとおりである。
本機能は、実績値に基づく品質指標を対象とすることから、どのようなQoS制御をした何のフローか、の単位で結果が抽出されることを想定する。
どの結果を参照すべきか、スループット実績値としては何を用いるのが適切か(各結果を合算すべきか否か)等については、ユーザ情報に依存するため、制御根拠判定機能側に任せるような役割分担を想定する。
(その他の例)
以上、品質/変化予測の対象がNW品質の場合の例を主に説明した。前述のとおり、これは一例であり、品質/変化予測の対象が映像品質(VMAF等)であってもよい。また、予測の対象がデバイスの状態(速度、加速度、姿勢等)であってもよい。
以上、品質/変化予測の対象がNW品質の場合の例を主に説明した。前述のとおり、これは一例であり、品質/変化予測の対象が映像品質(VMAF等)であってもよい。また、予測の対象がデバイスの状態(速度、加速度、姿勢等)であってもよい。
また、品質予測算出ポリシーとして、常に安全側の結果を算出する、判定根拠に依存する、常に危険側の結果を算出する、等を想定してもよい。情報伝送のKPIあるいは伝送情報の特性に応じたポリシーを適用することを想定してもよい。また、適用するポリシーを必要に応じて変更してもよい。
(ハードウェア構成例)
本実施の形態で説明した「品質予測部10、ユーザ情報管理部20、品質/変化予測部30、品質予測部管理部40、品質/変化予測結果送信部50」のうちの、いずれの機能部、及び、いずれの「複数の機能部の組み合わせ」も、例えば、コンピュータにプログラムを実行させることにより実現できる。このコンピュータは、物理的なコンピュータであってもよいし、クラウド上の仮想マシンであってもよい。
本実施の形態で説明した「品質予測部10、ユーザ情報管理部20、品質/変化予測部30、品質予測部管理部40、品質/変化予測結果送信部50」のうちの、いずれの機能部、及び、いずれの「複数の機能部の組み合わせ」も、例えば、コンピュータにプログラムを実行させることにより実現できる。このコンピュータは、物理的なコンピュータであってもよいし、クラウド上の仮想マシンであってもよい。
本実施の形態で説明した予測装置と予測システムはいずれも、例えば、コンピュータにプログラムを実行させることにより実現できる。このコンピュータは、物理的なコンピュータであってもよいし、クラウド上の仮想マシンであってもよい。
上記の「コンピュータにプログラムを実行させることにより実現できる」ものを総称して「装置」と呼ぶことにする。
すなわち、当該装置は、コンピュータに内蔵されるCPUやメモリ等のハードウェア資源を用いて、当該装置で実施される処理に対応するプログラムを実行することによって実現することが可能である。上記プログラムは、コンピュータが読み取り可能な記録媒体(可搬メモリ等)に記録して、保存したり、配布したりすることが可能である。また、上記プログラムをインターネットや電子メール等、ネットワークを通して提供することも可能である。
図12は、上記コンピュータのハードウェア構成例を示す図である。図12のコンピュータは、それぞれバスBSで相互に接続されているドライブ装置1000、補助記憶装置1002、メモリ装置1003、CPU1004、インタフェース装置1005、表示装置1006、入力装置1007、出力装置1008等を有する。なお、当該コンピュータは、更にGPUを備えてもよい。
当該コンピュータでの処理を実現するプログラムは、例えば、CD-ROM又はメモリカード等の記録媒体1001によって提供される。プログラムを記憶した記録媒体1001がドライブ装置1000にセットされると、プログラムが記録媒体1001からドライブ装置1000を介して補助記憶装置1002にインストールされる。但し、プログラムのインストールは必ずしも記録媒体1001より行う必要はなく、ネットワークを介して他のコンピュータよりダウンロードするようにしてもよい。補助記憶装置1002は、インストールされたプログラムを格納すると共に、必要なファイルやデータ等を格納する。
メモリ装置1003は、プログラムの起動指示があった場合に、補助記憶装置1002からプログラムを読み出して格納する。CPU1004は、メモリ装置1003に格納されたプログラムに従って、当該装置に係る機能を実現する。インタフェース装置1005は、ネットワーク等に接続するためのインタフェースとして用いられる。表示装置1006はプログラムによるGUI(Graphical User Interface)等を表示する。入力装置1007はキーボード及びマウス、ボタン、又はタッチパネル等で構成され、様々な操作指示を入力させるために用いられる。出力装置1008は演算結果を出力する。
(実施の形態のまとめ、効果等)
以上説明したとおり、本実施の形態で説明した技術により、デバイスに関するサービスの品質の予測を適切に行ことが可能となる。より具体的には、下記の(1)、(2)の効果を得ることができる。
以上説明したとおり、本実施の形態で説明した技術により、デバイスに関するサービスの品質の予測を適切に行ことが可能となる。より具体的には、下記の(1)、(2)の効果を得ることができる。
(1)実際の情報伝送で利用できた実績に基づいて安全側から品質を予測する手段と自動運転車等のデバイス位置や電波伝搬環境といった物理的な環境などの現在状況に応じて取り得る品質を予測する手段を組み合わせることで、品質予測の活用用途に悪影響を及ぼし得る品質の過大評価を回避した品質/変化予測結果を提示できる。
(2)実際の情報伝送で利用できた実績以上の品質/変化予測結果を提示する際に、実績を考慮しつつ、現在状況に応じて取り得る品質を予測する手段の予測結果を加味することで、品質予測の活用用途に悪影響を及ぼし得る品質の過大評価を回避しつつ実効的な品質/変化予測結果を提示できる。
以上の実施形態に関し、更に以下の付記を開示する。
<付記>
(付記項1)
デバイスに関するサービスの品質を予測する予測装置であって、
メモリと、
前記メモリに接続された少なくとも1つのプロセッサと、
を含み、
前記プロセッサは、
前記サービスの利用実績に基づき品質を予測する第1予測部から第1予測結果を取得し、前記デバイスの現在の状況に応じて取り得る品質を予測する第2予測部から第2予測結果を取得し、
前記第1予測結果と前記第2予測結果とを用いて、所定の機能において利用するための品質予測結果を算出する
予測装置。
(付記項2)
前記プロセッサは、前記第1予測結果に基づいて、前記第2予測結果を前記品質予測結果の算出に利用するか否かを判断する
付記項1に記載の予測装置。
(付記項3)
前記サービスが、ネットワークを利用した通信であり、前記第1予測結果の予測帯域が前記第2予測結果の予測帯域よりも小さい場合において、
前記プロセッサは、前記第1予測結果の予測帯域の根拠となったスループット実績値を計測した際のパケットロス率が閾値以下であることを検知した場合に、前記第2予測結果の予測帯域を前記品質予測結果の算出に利用する
付記項2に記載の予測装置。
(付記項4)
デバイスに関するサービスの品質変化を予測する予測装置であって、
メモリと、
前記メモリに接続された少なくとも1つのプロセッサと、
を含み、
前記プロセッサは、
前記サービスの利用実績に基づき品質を予測する第1予測部から第1予測結果を取得し、前記デバイスの現在の状況に応じて取り得る品質を予測する第2予測部から第2予測結果を取得し、
前記第1予測結果、前記第2予測結果、及び、ユーザ情報を用いて、前記サービスの品質変化の有無を判定する
予測装置。
(付記項5)
前記ユーザ情報は、品質予測の活用用途に関わる情報である
付記項4に記載の予測装置。
(付記項6)
デバイスに関するサービスの品質を予測する予測装置が実行する予測方法であって、
前記サービスの利用実績に基づき品質を予測する第1予測部から第1予測結果を取得し、前記デバイスの現在の状況に応じて取り得る品質を予測する第2予測部から第2予測結果を取得する取得ステップと、
前記第1予測結果と前記第2予測結果とを用いて、所定の機能において利用するための品質予測結果を算出する品質予測ステップと
を備える予測方法。
(付記項7)
デバイスに関するサービスの品質変化を予測する予測装置が実行する予測方法であって、
前記サービスの利用実績に基づき品質を予測する第1予測部から第1予測結果を取得し、前記デバイスの現在の状況に応じて取り得る品質を予測する第2予測部から第2予測結果を取得する取得ステップと、
前記第1予測結果、前記第2予測結果、及び、ユーザ情報を用いて、前記サービスの品質変化の有無を判定する判定ステップと
を備える予測方法。
(付記項8)
コンピュータを、付記項1ないし5のうちいずれか1項に記載の予測装置における各部として機能させるためのプログラムを記憶した非一時的記憶媒体。
(付記項1)
デバイスに関するサービスの品質を予測する予測装置であって、
メモリと、
前記メモリに接続された少なくとも1つのプロセッサと、
を含み、
前記プロセッサは、
前記サービスの利用実績に基づき品質を予測する第1予測部から第1予測結果を取得し、前記デバイスの現在の状況に応じて取り得る品質を予測する第2予測部から第2予測結果を取得し、
前記第1予測結果と前記第2予測結果とを用いて、所定の機能において利用するための品質予測結果を算出する
予測装置。
(付記項2)
前記プロセッサは、前記第1予測結果に基づいて、前記第2予測結果を前記品質予測結果の算出に利用するか否かを判断する
付記項1に記載の予測装置。
(付記項3)
前記サービスが、ネットワークを利用した通信であり、前記第1予測結果の予測帯域が前記第2予測結果の予測帯域よりも小さい場合において、
前記プロセッサは、前記第1予測結果の予測帯域の根拠となったスループット実績値を計測した際のパケットロス率が閾値以下であることを検知した場合に、前記第2予測結果の予測帯域を前記品質予測結果の算出に利用する
付記項2に記載の予測装置。
(付記項4)
デバイスに関するサービスの品質変化を予測する予測装置であって、
メモリと、
前記メモリに接続された少なくとも1つのプロセッサと、
を含み、
前記プロセッサは、
前記サービスの利用実績に基づき品質を予測する第1予測部から第1予測結果を取得し、前記デバイスの現在の状況に応じて取り得る品質を予測する第2予測部から第2予測結果を取得し、
前記第1予測結果、前記第2予測結果、及び、ユーザ情報を用いて、前記サービスの品質変化の有無を判定する
予測装置。
(付記項5)
前記ユーザ情報は、品質予測の活用用途に関わる情報である
付記項4に記載の予測装置。
(付記項6)
デバイスに関するサービスの品質を予測する予測装置が実行する予測方法であって、
前記サービスの利用実績に基づき品質を予測する第1予測部から第1予測結果を取得し、前記デバイスの現在の状況に応じて取り得る品質を予測する第2予測部から第2予測結果を取得する取得ステップと、
前記第1予測結果と前記第2予測結果とを用いて、所定の機能において利用するための品質予測結果を算出する品質予測ステップと
を備える予測方法。
(付記項7)
デバイスに関するサービスの品質変化を予測する予測装置が実行する予測方法であって、
前記サービスの利用実績に基づき品質を予測する第1予測部から第1予測結果を取得し、前記デバイスの現在の状況に応じて取り得る品質を予測する第2予測部から第2予測結果を取得する取得ステップと、
前記第1予測結果、前記第2予測結果、及び、ユーザ情報を用いて、前記サービスの品質変化の有無を判定する判定ステップと
を備える予測方法。
(付記項8)
コンピュータを、付記項1ないし5のうちいずれか1項に記載の予測装置における各部として機能させるためのプログラムを記憶した非一時的記憶媒体。
以上、本実施の形態について説明したが、本発明はかかる特定の実施形態に限定されるものではなく、特許請求の範囲に記載された本発明の要旨の範囲内において、種々の変形・変更が可能である。
10 品質予測部
11 運行計画取得部
12 イベント情報取得部
13 時刻/位置情報取得部
14 IMU等デバイスセンサ
15 未来位置予測部
16 NW品質予測部
17 NW品質履歴データベース
18 NW品質予測結果送信部
20 ユーザ情報管理部
30 品質/変化予測部
31 取得部
32 品質予測部
33 判定部
40 品質予測部管理部
50 品質/変化予測結果送信部
60 外部機能
1000 ドライブ装置
1001 記録媒体
1002 補助記憶装置
1003 メモリ装置
1004 CPU
1005 インタフェース装置
1006 表示装置
1007 入力装置
1008 出力装置
11 運行計画取得部
12 イベント情報取得部
13 時刻/位置情報取得部
14 IMU等デバイスセンサ
15 未来位置予測部
16 NW品質予測部
17 NW品質履歴データベース
18 NW品質予測結果送信部
20 ユーザ情報管理部
30 品質/変化予測部
31 取得部
32 品質予測部
33 判定部
40 品質予測部管理部
50 品質/変化予測結果送信部
60 外部機能
1000 ドライブ装置
1001 記録媒体
1002 補助記憶装置
1003 メモリ装置
1004 CPU
1005 インタフェース装置
1006 表示装置
1007 入力装置
1008 出力装置
Claims (8)
- デバイスに関するサービスの品質を予測する予測装置であって、
前記サービスの利用実績に基づき品質を予測する第1予測部から第1予測結果を取得し、前記デバイスの現在の状況に応じて取り得る品質を予測する第2予測部から第2予測結果を取得する取得部と、
前記第1予測結果と前記第2予測結果とを用いて、所定の機能において利用するための品質予測結果を算出する品質予測部と
を備える予測装置。 - 前記品質予測部は、前記第1予測結果に基づいて、前記第2予測結果を前記品質予測結果の算出に利用するか否かを判断する
請求項1に記載の予測装置。 - 前記サービスが、ネットワークを利用した通信であり、前記第1予測結果の予測帯域が前記第2予測結果の予測帯域よりも小さい場合において、
前記品質予測部は、前記第1予測結果の予測帯域の根拠となったスループット実績値を計測した際のパケットロス率が閾値以下であることを検知した場合に、前記第2予測結果の予測帯域を前記品質予測結果の算出に利用する
請求項2に記載の予測装置。 - デバイスに関するサービスの品質変化を予測する予測装置であって、
前記サービスの利用実績に基づき品質を予測する第1予測部から第1予測結果を取得し、前記デバイスの現在の状況に応じて取り得る品質を予測する第2予測部から第2予測結果を取得する取得部と、
前記第1予測結果、前記第2予測結果、及び、ユーザ情報を用いて、前記サービスの品質変化の有無を判定する判定部と
を備える予測装置。 - 前記ユーザ情報は、品質予測の活用用途に関わる情報である
請求項4に記載の予測装置。 - デバイスに関するサービスの品質を予測する予測装置が実行する予測方法であって、
前記サービスの利用実績に基づき品質を予測する第1予測部から第1予測結果を取得し、前記デバイスの現在の状況に応じて取り得る品質を予測する第2予測部から第2予測結果を取得する取得ステップと、
前記第1予測結果と前記第2予測結果とを用いて、所定の機能において利用するための品質予測結果を算出する品質予測ステップと
を備える予測方法。 - デバイスに関するサービスの品質変化を予測する予測装置が実行する予測方法であって、
前記サービスの利用実績に基づき品質を予測する第1予測部から第1予測結果を取得し、前記デバイスの現在の状況に応じて取り得る品質を予測する第2予測部から第2予測結果を取得する取得ステップと、
前記第1予測結果、前記第2予測結果、及び、ユーザ情報を用いて、前記サービスの品質変化の有無を判定する判定ステップと
を備える予測方法。 - コンピュータを、請求項1ないし5のうちいずれか1項に記載の予測装置における各部として機能させるためのプログラム。
Priority Applications (2)
| Application Number | Priority Date | Filing Date | Title |
|---|---|---|---|
| PCT/JP2022/040922 WO2024095378A1 (ja) | 2022-11-01 | 2022-11-01 | 予測装置、予測方法、及びプログラム |
| JP2024553991A JPWO2024095378A1 (ja) | 2022-11-01 | 2022-11-01 |
Applications Claiming Priority (1)
| Application Number | Priority Date | Filing Date | Title |
|---|---|---|---|
| PCT/JP2022/040922 WO2024095378A1 (ja) | 2022-11-01 | 2022-11-01 | 予測装置、予測方法、及びプログラム |
Publications (1)
| Publication Number | Publication Date |
|---|---|
| WO2024095378A1 true WO2024095378A1 (ja) | 2024-05-10 |
Family
ID=90930078
Family Applications (1)
| Application Number | Title | Priority Date | Filing Date |
|---|---|---|---|
| PCT/JP2022/040922 Ceased WO2024095378A1 (ja) | 2022-11-01 | 2022-11-01 | 予測装置、予測方法、及びプログラム |
Country Status (2)
| Country | Link |
|---|---|
| JP (1) | JPWO2024095378A1 (ja) |
| WO (1) | WO2024095378A1 (ja) |
Citations (3)
| Publication number | Priority date | Publication date | Assignee | Title |
|---|---|---|---|---|
| JP2009278421A (ja) * | 2008-05-15 | 2009-11-26 | Nec Corp | 無線品質劣化予測システム |
| US20100214923A1 (en) * | 2009-02-20 | 2010-08-26 | Clear Wireless Llc | Predictive throughput management |
| JP2012209760A (ja) * | 2011-03-30 | 2012-10-25 | Sony Corp | 無線通信装置、通信システムおよび情報処理方法 |
-
2022
- 2022-11-01 WO PCT/JP2022/040922 patent/WO2024095378A1/ja not_active Ceased
- 2022-11-01 JP JP2024553991A patent/JPWO2024095378A1/ja active Pending
Patent Citations (3)
| Publication number | Priority date | Publication date | Assignee | Title |
|---|---|---|---|---|
| JP2009278421A (ja) * | 2008-05-15 | 2009-11-26 | Nec Corp | 無線品質劣化予測システム |
| US20100214923A1 (en) * | 2009-02-20 | 2010-08-26 | Clear Wireless Llc | Predictive throughput management |
| JP2012209760A (ja) * | 2011-03-30 | 2012-10-25 | Sony Corp | 無線通信装置、通信システムおよび情報処理方法 |
Also Published As
| Publication number | Publication date |
|---|---|
| JPWO2024095378A1 (ja) | 2024-05-10 |
Similar Documents
| Publication | Publication Date | Title |
|---|---|---|
| JP6761793B2 (ja) | 車両用制御装置 | |
| JP4571235B2 (ja) | 経路制御装置、経路異常予測装置、方法、およびプログラム | |
| EP3748923B1 (en) | Ensuring backup path performance for predictive routing in sd-wans | |
| CN118479315B (zh) | 一种基于电梯物联网的通信系统及数据发送方法 | |
| WO2011102317A1 (ja) | モニタリングシステム、装置および方法 | |
| KR102779346B1 (ko) | 스마트 apt 통신 제어 및 상태 모니터링 시스템 | |
| US11777854B2 (en) | Globally avoiding simultaneous reroutes in a network | |
| CN119155177B (zh) | 一种用于实现网络服务器的搭建方法及系统 | |
| CN119835671A (zh) | 用于两轮车通信设备的控制系统 | |
| CN119749315A (zh) | 一种充电数据异常检测和安全处理系统 | |
| US12184561B1 (en) | Systems and methods to utilize edge computing to respond to latency in connected vehicles | |
| CN118644069A (zh) | 一种智能交通系统的异构终端分级管理方法及系统 | |
| WO2024095378A1 (ja) | 予測装置、予測方法、及びプログラム | |
| CN120498901B (zh) | 算力网络异常节点识别方法、装置、设备及存储介质 | |
| CN120220351B (zh) | 一种智能化楼宇防火消防管理系统及方法 | |
| CN119012305B (zh) | 一种便携式救援通信终端的控制系统 | |
| JP2014112779A (ja) | データ送信制御装置、データ送信制御方法、および、コンピュータ・プログラム | |
| CN118739955A (zh) | 一种雨刮电机控制方法和设备 | |
| KR102484733B1 (ko) | 위치정보 기반 대기시간 제공 방법 | |
| JP7658422B2 (ja) | 車載装置、制御サーバ、測定データの収集方法及びプログラム | |
| KR102861408B1 (ko) | Ai 기반 학내 전산 장비 장애 예측 및 유지 보수 시스템 | |
| CN119176094B (zh) | 一种车载控制器快速容灾管理方法及系统 | |
| CN121585998A (zh) | 一种融合移动5g的跨域资源调度系统 | |
| CN119450642B (zh) | 基于5G RedCap的通信增强方法、装置、设备及存储介质 | |
| CN120389979A (zh) | 一种配电网ftu设备短报文通信方法及系统 |
Legal Events
| Date | Code | Title | Description |
|---|---|---|---|
| 121 | Ep: the epo has been informed by wipo that ep was designated in this application |
Ref document number: 22964399 Country of ref document: EP Kind code of ref document: A1 |
|
| WWE | Wipo information: entry into national phase |
Ref document number: 2024553991 Country of ref document: JP |
|
| NENP | Non-entry into the national phase |
Ref country code: DE |
|
| 122 | Ep: pct application non-entry in european phase |
Ref document number: 22964399 Country of ref document: EP Kind code of ref document: A1 |