WO2024053392A1 - Deterioration inhibition control system, deterioration inhibition control method and deterioration inhibition control program, and recording medium having deterioration inhibition control program described thereon - Google Patents
Deterioration inhibition control system, deterioration inhibition control method and deterioration inhibition control program, and recording medium having deterioration inhibition control program described thereon Download PDFInfo
- Publication number
- WO2024053392A1 WO2024053392A1 PCT/JP2023/030174 JP2023030174W WO2024053392A1 WO 2024053392 A1 WO2024053392 A1 WO 2024053392A1 JP 2023030174 W JP2023030174 W JP 2023030174W WO 2024053392 A1 WO2024053392 A1 WO 2024053392A1
- Authority
- WO
- WIPO (PCT)
- Prior art keywords
- deterioration
- negative electrode
- rate
- positive electrode
- charge
- Prior art date
Links
- 230000006866 deterioration Effects 0.000 title claims abstract description 224
- 238000000034 method Methods 0.000 title claims description 35
- 230000005764 inhibitory process Effects 0.000 title abstract 7
- 230000009467 reduction Effects 0.000 claims abstract description 20
- 230000007423 decrease Effects 0.000 claims description 71
- 230000001629 suppression Effects 0.000 claims description 55
- 238000007599 discharging Methods 0.000 claims description 21
- 230000008569 process Effects 0.000 claims description 9
- 230000003247 decreasing effect Effects 0.000 claims description 6
- 238000004891 communication Methods 0.000 description 25
- 238000010586 diagram Methods 0.000 description 14
- 238000012423 maintenance Methods 0.000 description 13
- HBBGRARXTFLTSG-UHFFFAOYSA-N Lithium ion Chemical compound [Li+] HBBGRARXTFLTSG-UHFFFAOYSA-N 0.000 description 10
- 229910001416 lithium ion Inorganic materials 0.000 description 10
- 239000007773 negative electrode material Substances 0.000 description 10
- 239000007774 positive electrode material Substances 0.000 description 10
- 230000006870 function Effects 0.000 description 7
- 230000002265 prevention Effects 0.000 description 7
- 238000012545 processing Methods 0.000 description 7
- 230000008859 change Effects 0.000 description 5
- WHXSMMKQMYFTQS-UHFFFAOYSA-N Lithium Chemical compound [Li] WHXSMMKQMYFTQS-UHFFFAOYSA-N 0.000 description 4
- 230000010354 integration Effects 0.000 description 4
- 229910052744 lithium Inorganic materials 0.000 description 4
- 239000011149 active material Substances 0.000 description 3
- 230000001413 cellular effect Effects 0.000 description 3
- 230000008602 contraction Effects 0.000 description 3
- 230000014759 maintenance of location Effects 0.000 description 2
- 238000012986 modification Methods 0.000 description 2
- 230000004048 modification Effects 0.000 description 2
- 101150012579 ADSL gene Proteins 0.000 description 1
- 102100020775 Adenylosuccinate lyase Human genes 0.000 description 1
- 108700040193 Adenylosuccinate lyases Proteins 0.000 description 1
- 238000004458 analytical method Methods 0.000 description 1
- 230000005540 biological transmission Effects 0.000 description 1
- 230000015572 biosynthetic process Effects 0.000 description 1
- 238000004590 computer program Methods 0.000 description 1
- 238000005336 cracking Methods 0.000 description 1
- 238000013500 data storage Methods 0.000 description 1
- 238000005516 engineering process Methods 0.000 description 1
- 238000002474 experimental method Methods 0.000 description 1
- 230000014509 gene expression Effects 0.000 description 1
- 238000009499 grossing Methods 0.000 description 1
- 230000036541 health Effects 0.000 description 1
- 230000016507 interphase Effects 0.000 description 1
- 238000007726 management method Methods 0.000 description 1
- 238000005259 measurement Methods 0.000 description 1
- 229910052987 metal hydride Inorganic materials 0.000 description 1
- 229910052759 nickel Inorganic materials 0.000 description 1
- PXHVJJICTQNCMI-UHFFFAOYSA-N nickel Substances [Ni] PXHVJJICTQNCMI-UHFFFAOYSA-N 0.000 description 1
- -1 nickel metal hydride Chemical class 0.000 description 1
- 239000013307 optical fiber Substances 0.000 description 1
- 238000004088 simulation Methods 0.000 description 1
- 239000007784 solid electrolyte Substances 0.000 description 1
- 230000007704 transition Effects 0.000 description 1
Images


Classifications
-
- H—ELECTRICITY
- H01—ELECTRIC ELEMENTS
- H01M—PROCESSES OR MEANS, e.g. BATTERIES, FOR THE DIRECT CONVERSION OF CHEMICAL ENERGY INTO ELECTRICAL ENERGY
- H01M10/00—Secondary cells; Manufacture thereof
- H01M10/42—Methods or arrangements for servicing or maintenance of secondary cells or secondary half-cells
- H01M10/44—Methods for charging or discharging
-
- H—ELECTRICITY
- H01—ELECTRIC ELEMENTS
- H01M—PROCESSES OR MEANS, e.g. BATTERIES, FOR THE DIRECT CONVERSION OF CHEMICAL ENERGY INTO ELECTRICAL ENERGY
- H01M10/00—Secondary cells; Manufacture thereof
- H01M10/42—Methods or arrangements for servicing or maintenance of secondary cells or secondary half-cells
- H01M10/48—Accumulators combined with arrangements for measuring, testing or indicating the condition of cells, e.g. the level or density of the electrolyte
-
- H—ELECTRICITY
- H02—GENERATION; CONVERSION OR DISTRIBUTION OF ELECTRIC POWER
- H02J—CIRCUIT ARRANGEMENTS OR SYSTEMS FOR SUPPLYING OR DISTRIBUTING ELECTRIC POWER; SYSTEMS FOR STORING ELECTRIC ENERGY
- H02J7/00—Circuit arrangements for charging or depolarising batteries or for supplying loads from batteries
Definitions
- the present disclosure relates to a deterioration prevention control system, a deterioration prevention control method, and a deterioration prevention control program for suppressing deterioration of a secondary battery.
- lithium ion batteries have been used for various purposes.
- a common method is to use the voltage, current, and temperature of the lithium ion battery as they are, and to switch the charging/discharging control method.
- a method has been proposed in which the internal state of the lithium ion battery (more specifically, the deterioration state of the positive electrode and the negative electrode) is estimated and the charge/discharge control method is switched (for example, see Patent Document 1).
- Patent Document 1 proposes a method of changing the operating conditions of a secondary battery when the difference between the capacity of the positive electrode and the capacity of the negative electrode or the difference between the discharge end potential of the positive electrode and the discharge end potential of the negative electrode is reversed to a negative value. has been done.
- the present disclosure has been made in view of these circumstances, and its purpose is to provide a technology that can suppress the deterioration of secondary batteries to the maximum extent.
- a deterioration suppression control system includes an acquisition unit that acquires battery data including the voltage and current of the secondary battery, and based on the battery data of the secondary battery, an estimation unit that estimates a reduction rate of the current positive electrode surplus capacity with respect to the initial positive electrode surplus capacity and a reduction rate of the current negative electrode surplus capacity with respect to the initial negative electrode surplus capacity; If the rate of decrease in the surplus capacity of the negative electrode is greater than the rate of decrease in the surplus capacity of the negative electrode, the charge/discharge control is switched to prioritize suppression of deterioration of the positive electrode, and if the rate of decrease in the surplus capacity of the negative electrode is greater than the rate of decrease in the surplus capacity of the positive electrode, A charge/discharge control section that switches to charge/discharge control that prioritizes deterioration suppression.
- deterioration of secondary batteries can be suppressed to the maximum extent.
- FIG. 2 is a diagram for explaining a deterioration suppression control system for a secondary battery.
- FIG. 3 is a diagram showing an example of a storage deterioration characteristic map.
- FIG. 3A is a diagram illustrating an example of a charge/discharge deterioration characteristic map.
- FIG. 3B is a diagram showing an example of a charge/discharge deterioration characteristic map. It is a figure which shows an example of the charge/discharge curve of a secondary battery, a positive electrode, and a negative electrode, and a dV/dQ curve. It is a figure which shows another example of the dV/dQ curve of a secondary battery.
- FIG. 3 is a diagram showing an example of a storage deterioration characteristic map.
- FIG. 3A is a diagram illustrating an example of a charge/discharge deterioration characteristic map.
- FIG. 3B is a diagram showing an example of a charge/discharge deterioration characteristic map. It
- FIG. 2 is a diagram showing an example of charge/discharge curves of a secondary battery, a positive electrode, and a negative electrode in an initial state of a certain secondary battery.
- FIG. 3 is a diagram showing an example of contraction of charge/discharge curves of a secondary battery, a positive electrode, and a negative electrode. It is a flowchart which shows the flow of the switching process of the charging/discharging control method by the deterioration suppression control system based on embodiment. It is a flow chart which shows an example of deterioration prevention control at the time of charge by a deterioration prevention control system concerning an embodiment.
- FIG. 1 is a diagram for explaining a secondary battery deterioration suppression control system 10.
- the deterioration suppression control system 10 is a system for analyzing the deterioration state of the secondary battery 21 mounted on the electric vehicle 20 and performing optimal deterioration suppression control of the secondary battery 21.
- the deterioration suppression control system 10 may be constructed, for example, on an in-house server installed in the in-house facility or data center of a business that provides a deterioration analysis service for the secondary battery 21 mounted on the electric vehicle 20.
- the deterioration suppression control system 10 may be constructed on a cloud server that is used based on a cloud service.
- the deterioration suppression control system 10 may be constructed on a plurality of servers distributed and installed at a plurality of bases (data centers, company facilities).
- the plurality of servers may be a combination of a plurality of in-house servers, a plurality of cloud servers, or a combination of an in-house server and a cloud server.
- an electric vehicle 20 used by a delivery company is assumed as the electric vehicle 20.
- a secondary battery 21 mounted on the electric vehicle 20 supplies power to a drive motor (not shown).
- the secondary battery 21 is composed of a plurality of cells or a plurality of parallel cell blocks connected in series.
- Each parallel cell block is composed of a plurality of cells connected in parallel.
- a lithium ion battery cell As the cell, a lithium ion battery cell, a nickel metal hydride battery cell, a lead battery cell, etc. can be used.
- this specification assumes an example in which a lithium ion battery cell (nominal voltage: 3.6-3.7V) is used.
- the number of cells or parallel cell blocks connected in series is determined according to the voltage of the drive motor.
- the voltage sensor 22 detects the voltage across each of the cells connected in series or the parallel cell block (the voltage between the positive electrode and the negative electrode).
- a shunt resistor is connected in series with a plurality of series-connected cells or a plurality of parallel cell blocks.
- the current sensor 23 detects the current flowing through the series-connected cells or parallel cell blocks based on the voltage across the shunt resistor. Note that a Hall element may be used instead of the shunt resistor.
- the temperature sensor 24 detects the temperature of a plurality of cells or a parallel cell block based on a divided voltage of a thermistor and a resistor installed in at least one of the plurality of cells or a parallel cell block.
- the control unit 25 is configured by a BMU (Battery Management Unit) and an ECU (Electronic Control Unit) working together.
- the BMU estimates SOC (State of Charge) by combining the OCV (Open Circuit Voltage) method and the current integration method.
- the OCV method is a method of estimating the SOC based on the measured OCV of each cell and the SOC-OCV curve of the cell.
- the current integration method is a method of estimating the SOC based on the OCV at the start of charging/discharging of each cell and the integrated value of the measured current. In the current integration method, current measurement errors accumulate as the charging/discharging time increases. Therefore, it is preferable to correct the SOC estimated by the current integration method using the SOC estimated by the OCV method.
- the BMU samples the voltage, current, temperature, and SOC of multiple cells or multiple parallel cell blocks periodically (eg, every 10 seconds).
- the BMU transmits battery data including voltage, current, temperature, and SOC of multiple cells or multiple parallel cell blocks to the ECU via the in-vehicle network.
- CAN Controller Area Network
- LIN Local Interconnect Network
- the communication unit 26 has a function of executing communication signal processing with the communication unit 33 of the charging station 30 and a function of executing wireless signal processing for connecting to the network 5.
- the communication unit 26 is, for example, a mobile phone network (cellular network), wireless LAN, V2I (vehicle-to-infrastructure), V2V (vehicle-to-vehicle), ETC system (electronic toll collection system), D SRC (Dedicated Short Range Communications) ) can be used to access the network 5.
- the network 5 is a general term for communication paths such as the Internet, a leased line, and a VPN (Virtual Private Network), and the communication medium and protocol are not limited.
- the communication medium for example, a mobile phone network (cellular network), wireless LAN, wired LAN, optical fiber network, ADSL network, CATV network, etc. can be used.
- As a communication protocol for example, TCP (Transmission Control Protocol)/IP (Internet Protocol), UDP (User Datagram Protocol)/IP, Ethernet (registered trademark), etc. can be used.
- the ECU may transmit the sampled battery data to the deterioration prevention control system 10 each time, or it may accumulate it in an internal memory and transmit the battery data stored in the memory to the deterioration prevention control system 10 at a predetermined timing. You can also send it. Note that while the electric vehicle 20 and the charging stand 30 are connected by a charging cable, the ECU may transmit the battery data stored in the memory to the deterioration suppression control system 10 via the charging stand 30.
- the secondary battery 21 in the electric vehicle 20 can be charged from the outside.
- the charging stand 30 is connected to the commercial power system 2 and charges the secondary battery 21.
- batteries are charged with alternating current for normal charging and direct current for quick charging.
- alternating current for example, single phase 100/200V
- the charging voltage or charging current is controlled by a charger (not shown) in the electric vehicle 20.
- direct current the charging voltage or charging current is controlled by the power supply unit 31 of the charging station 30.
- the power supply unit 31 includes a rectifier circuit, a filter, and a DC/DC converter, and generates DC power by full-wave rectifying the AC power supplied from the commercial power system 2 with the rectifier circuit and smoothing it with the filter.
- a DC/DC converter controls the voltage or current of the generated DC power.
- CHAdeMO registered trademark
- ChaoJi GB/T
- Combo Combined Charging System
- CHAdeMO, ChaoJi, and GB/T use CAN as a communication method.
- Combo uses PLC (Power Line Communication) as a communication method.
- a charging cable that uses the CAN method includes communication lines in addition to power lines.
- the control section 25 of the electric vehicle 20 establishes a communication channel with the control section 32 of the charging station 30. Note that in a charging cable that employs the PLC method, communication signals are transmitted superimposed on the power line.
- the communication unit 33 of the charging station 30 has a function of executing communication signal processing with the communication unit 26 of the electric vehicle 20 and a function of executing signal processing for connecting to the network 5.
- the communication unit 33 can access the network 5 using, for example, a wired LAN, a wireless LAN, or a mobile phone network (cellular network).
- the deterioration suppression control system 10 includes a control section 11, a storage section 12, and a communication section 13.
- the communication unit 13 is a communication interface (for example, NIC: Network Interface Card) for connecting to the network 5 by wire or wirelessly.
- the control unit 11 includes a data acquisition unit 111, a deterioration estimation unit 112, and a charge/discharge control unit 113.
- control unit 11 can be realized by cooperation of hardware resources and software resources, or by only hardware resources.
- Hardware resources include CPU, ROM, RAM, GPU (Graphics Processing Unit), ASIC (Application Specific Integrated Circuit), FPGA (Field Program Mable Gate Array) and other LSIs can be used.
- Programs such as operating systems and applications can be used as software resources.
- the program is pre-recorded in the memory of the storage unit 12 here, it may also be provided via a telecommunications line such as the Internet or by being recorded on a (non-temporary) recording medium such as a memory card.
- the storage unit 12 includes a nonvolatile recording medium such as an HDD or an SSD, and stores various data.
- the storage unit 12 includes a battery data holding unit 121 and a deterioration characteristic holding unit 122.
- the battery data holding unit 121 stores battery data acquired by the data acquisition unit 111 from the electric vehicle 20 or the charging station 30.
- the deterioration characteristic holding unit 122 holds storage deterioration characteristics, charge deterioration characteristics, discharge deterioration characteristics of the positive electrode, storage deterioration characteristics, charge deterioration characteristics, and discharge deterioration characteristics of the negative electrode for each type of secondary battery.
- the deterioration characteristic holding unit 122 stores, as battery information for identifying the type of the secondary battery, a model number, a model, a cell shape, a positive electrode material, a composition ratio of the positive electrode material, a negative electrode material, a composition ratio of the negative electrode material, an energy weight density, It retains at least one piece of information such as energy volume density.
- the data in the deterioration characteristic holding unit 122 is updated every time a new type of secondary battery is registered. Furthermore, when the characteristic information of a registered secondary battery is updated, the data in the deterioration characteristic holding unit 122 is also updated.
- Storage deterioration of a secondary battery is a deterioration that progresses over time depending on the temperature of the secondary battery at each point in time and the SOC at each point in time. It progresses over time regardless of whether it is being charged or discharged.
- Storage deterioration mainly occurs due to the formation of a film (SEI (Solid Electrolyte Interphase) film) on the negative electrode. Storage deterioration depends on the SOC and temperature at each time point.
- SEI Solid Electrolyte Interphase
- Charging/discharging deterioration of a secondary battery is a deterioration that progresses as the number of charging/discharging increases.
- Charge/discharge deterioration mainly occurs due to cracking or peeling due to expansion or contraction of the active material.
- Charge/discharge deterioration depends on the SOC range, temperature, and current rate used. Generally, the wider the SOC range used, the higher the temperature, and the higher the current rate, the faster the charge/discharge deterioration rate increases.
- the storage deterioration characteristics, charging deterioration characteristics, and discharge deterioration characteristics of the positive electrode, and the storage deterioration characteristics, charge deterioration characteristics, and discharge deterioration characteristics of the negative electrode are derived in advance for each type of secondary battery through experiments and simulations by the battery manufacturer.
- FIG. 2 is a diagram showing an example of a storage deterioration characteristic map.
- the horizontal axis indicates SOC [%], and the vertical axis indicates storage deterioration coefficient Ks.
- storage deterioration progresses approximately linearly with respect to the value obtained by elapsed time (h) to the 0.5 power law (square root). Note that, depending on the type of secondary battery, the time may progress approximately linearly with respect to a value obtained by multiplying the elapsed time (h) by the 0.4 power law or by the 0.6 power law.
- FIG. 2 only depicts storage deterioration characteristics for two types of temperatures, 25° C. and 45° C., for simplicity, storage deterioration characteristics for many temperatures are actually generated.
- the storage deterioration characteristic may be defined not by a map but by a storage deterioration characteristic model (function) having SOC and temperature as explanatory variables and the storage deterioration coefficient Ks as an objective variable.
- FIGS. 3A and 3B are diagrams showing an example of a charge/discharge deterioration characteristic map.
- FIG. 3A shows an example of a charge deterioration characteristic map
- FIG. 3B shows an example of a discharge deterioration characteristic map.
- the horizontal axis indicates the usage range of SOC [%].
- each SOC value indicates the lower limit of the 10% usage range. For example, SOC 10% indicates that the battery is charged and discharged within the SOC range of 10 to 20%, and SOC 11% indicates that the battery is charged and discharged within the SOC range of 11 to 21%.
- the vertical axis indicates charge/discharge deterioration coefficients Kc and Kd.
- charge/discharge deterioration progresses approximately linearly with respect to the value obtained by multiplying the total charge amount or the total discharge amount (Ah) by the 0.5 power law (square root). Note that depending on the type of secondary battery, the rate may progress approximately linearly with respect to a value obtained by 0.4th power or 0.6th power of the total charge amount or total discharge amount (Ah).
- FIGS. 3A and 3B only depict charge/discharge deterioration characteristics for two types of current rates, 0.1C and 0.8C, but in reality, charge/discharge deterioration characteristics for many current rates are depicted. generated.
- the charging/discharging deterioration rate increases in the low and high SOC usage ranges, as shown in FIG. 3A.
- the charging/discharging deterioration rate increases in a region where the SOC usage range is low.
- the charge/discharge deterioration characteristics are also influenced by temperature, although it does not contribute as much as the current rate. Therefore, in order to improve the estimation accuracy of the charge/discharge deterioration rate, the charge/discharge deterioration characteristics that define the relationship between the SOC usage range and the charge/discharge deterioration coefficient are calculated for each two-dimensional combination of multiple current rates and multiple temperatures. It is preferable to prepare. On the other hand, when generating a simple charge/discharge deterioration characteristic map, it is sufficient to assume that the temperature is room temperature and prepare charge/discharge deterioration characteristics for each of a plurality of current rates.
- charge/discharge deterioration characteristics are defined not by a map but by a charge/discharge deterioration characteristic model (function) that uses the SOC usage range, current rate, and temperature as explanatory variables, and uses the charge/discharge deterioration coefficients Kc and Kd as objective variables. may be done.
- the temperature may be a constant.
- the storage deterioration characteristics, charge deterioration characteristics, and discharge deterioration characteristics of the secondary battery explained above are prepared for each of the positive electrode and the negative electrode.
- the storage deterioration characteristics, charge deterioration characteristics, and discharge deterioration characteristics of the secondary battery are used in switching processing of deterioration suppression control, which will be described later, and are not used in deterioration estimation processing of the secondary battery.
- the deterioration status of the positive electrode and negative electrode is independently analyzed by analyzing peak information appearing in the dV/dQ curve obtained by differentiating the charge/discharge curve of the secondary battery.
- the charge/discharge curve of a secondary battery is a curve that defines the relationship between charge/discharge amount and battery voltage.
- FIG. 4 is a diagram showing an example of a charge/discharge curve and a dV/dQ curve of a secondary battery, a positive electrode, and a negative electrode.
- the figure above shows the charge-discharge curve.
- the horizontal axis shows the capacity [Ah]
- the left vertical axis shows the battery voltage [V]
- the right vertical axis shows the negative electrode potential [VvsL + /L].
- the positive electrode potential [VvsL + /L] and the negative electrode potential [VvsL + /L] are potentials when the lithium potential is set to 0V.
- Battery voltage is the difference between the positive electrode potential and the negative electrode potential, and is defined by OCV.
- the figure below shows dV/dQ curves obtained by differentiating the charge/discharge curves of the secondary battery, positive electrode, and negative electrode, respectively.
- the horizontal axis shows capacitance [Ah]
- the vertical axis shows dV/dQ [V/Ah].
- lithium ions shuttle between the positive electrode active material and the negative electrode active material during charging and discharging.
- the negative electrode potential increases and the positive electrode potential decreases.
- the battery voltage will drop.
- the positive electrode potential increases and the negative electrode potential decreases. Battery voltage increases.
- the shape of the charge/discharge curve of a secondary battery differs depending on the type and amount of the positive electrode active material and negative electrode active material.
- the charge-discharge curve of a secondary battery has a shape in which the voltage gradually decreases, as shown in Figure 4, and structural changes originating from the positive electrode active material and the negative electrode active material can be extracted from the charge-discharge curve of the secondary battery. That is difficult.
- multiple peaks are observed in the dV/dQ curve of the secondary battery. Whether each peak originates from the structure of the positive electrode active material or the structure of the negative electrode active material can be determined from the shapes of the dV/dQ curve of the positive electrode and the dV/dQ curve of the negative electrode in at least the initial state. It can be estimated.
- Each peak corresponds to the maximum or minimum value of the rate of change of the positive electrode potential or negative electrode potential.
- the positive electrode potential and negative electrode potential are determined by the lithium composition ratio in the active material.
- the lithium composition ratio in the active material when the rate of change in potential becomes maximum or minimum is constant regardless of battery capacity. Therefore, the rate of decrease in the distance between the two peaks originating from the positive electrode of the dV/dQ curve of the secondary battery corresponds to the rate of decrease in the positive electrode capacity.
- the positive electrode It can be estimated that the capacity has decreased to 80% of the initial state. The same applies to the negative electrode.
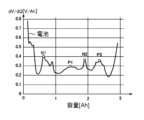
- FIG. 5 shows another example of the dV/dQ curve of a secondary battery.
- four peaks are extracted from the dV/dQ curve of the secondary battery.
- the first peak N1 and the third peak N2 are peaks originating from the negative electrode
- the second peak P1 and the fourth peak P2 are peaks originating from the positive electrode.
- the rate of decrease in the negative electrode capacity can be estimated from the rate of decrease in the distance between the first peak N1 and the third peak N2 (that is, the amount of charge required to transition from the first peak N1 to the third peak N2).
- the rate of decrease in the positive electrode capacity can be estimated from the rate of decrease in the distance between the second peak P1 and the fourth peak P2.
- the positive electrode potential and negative electrode potential can be detected by introducing a metallic lithium reference electrode into the secondary battery.
- the rate of decrease in the distance between the two peaks of the dV/dQ curve of the positive electrode can be directly determined.
- the rate of decrease in the distance between the two peaks of the dV/dQ curve of the negative electrode can be directly determined.
- the peak originating from the positive electrode and the peak originating from the negative electrode are identified among the multiple peaks of the dV/dQ curve of the secondary battery, and the reduction rate of the positive electrode capacity and the negative electrode capacity are Find the rate of decrease.
- the designer fills the positive electrode with more positive electrode active material than the positive electrode active material used for actual charging and discharging, and fills the negative electrode with more negative electrode active material than the negative electrode active material used for actual charging and discharging.
- the width of the charge/discharge curve of the positive electrode becomes wider, and as the amount of the negative electrode active material increases, the width of the charge/discharge curve of the negative electrode becomes wider.
- the width of the charge/discharge curves of the positive and negative electrodes shrinks due to deterioration.
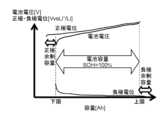
- FIG. 6 is a diagram showing an example of charge/discharge curves of a secondary battery, a positive electrode, and a negative electrode in an initial state of a certain secondary battery.
- the horizontal axis indicates capacity [Ah]
- the vertical axis indicates battery voltage [V], positive electrode potential [VvsL + /L], and negative electrode potential [VvsL + /L].
- the difference between the lower limit capacity of the positive electrode and the lower limit capacity of the battery is the positive electrode surplus capacity.
- the difference between the upper limit capacity of the negative electrode and the upper limit capacity of the battery is the negative electrode surplus capacity.
- FIG. 7 is a diagram showing an example of contraction of the charge/discharge curves of a secondary battery, a positive electrode, and a negative electrode.
- the upper figure shows a state in which the width of the charge/discharge curve of the positive electrode has shrunk by 10% due to deterioration of the positive electrode.
- the figure below shows a state in which the width of the charge/discharge curve of the negative electrode has shrunk by 10% due to deterioration of the negative electrode.
- the BMU of the secondary battery sets the range of the lower limit voltage and upper limit voltage of the secondary battery to the battery capacity.
- FIG. 8 is a flowchart showing the flow of the charging/discharging control method switching process by the deterioration suppression control system 10 according to the embodiment.
- the charge/discharge control unit 113 transmits a maintenance charging instruction to the control unit 32 of the charging station 30.
- maintenance charging may be performed once every several months.
- the power supply unit 31 charges the secondary battery 21 with a constant current at a current rate specified by the deterioration suppression control system 10.
- the control unit 25 of the electric vehicle 20 transmits battery data including voltage, current, temperature, and SOC during maintenance charging to the control unit 32 of the charging station 30.
- the control unit 32 of the charging station 30 transmits the battery data at the time of maintenance charging to the deterioration suppression control system 10.
- the data acquisition unit 111 of the deterioration suppression control system 10 acquires battery data during maintenance charging from the charging stand 30 and stores it in the battery data storage unit 121.
- the deterioration estimating unit 112 statistically processes battery data of a plurality of cells included in the secondary battery 21 during maintenance charging to generate battery data of a representative cell.
- the deterioration estimating unit 112 calculates the rate of decrease in battery capacity during the current maintenance charging with respect to the battery capacity during the previous maintenance charging, and compares the rate of decrease with a threshold value (S12). If the reduction rate is less than or equal to the threshold (N in S12), the process ends without switching the charging/discharging control method.
- the deterioration estimation unit 112 differentiates the charge/discharge curve of the representative cell to generate a dV/dQ curve of the representative cell.
- the deterioration estimating unit 112 estimates the rate of decrease in the current positive electrode surplus capacity with respect to the initial positive electrode surplus capacity based on the decrease rate in the distance between two peaks originating from the positive electrode of the dV/dQ curve.
- the reduction rate of positive electrode surplus capacity is defined as positive electrode relative deterioration degree [%] as shown in (Equation 1) below (S13).
- Positive electrode relative deterioration degree [%] 100 - (current positive electrode capacity - current battery capacity) / (initial positive electrode capacity - initial battery capacity) (Formula 1).
- the deterioration estimation unit 112 estimates the rate of decrease in the current negative electrode surplus capacity with respect to the initial negative electrode surplus capacity based on the decrease rate in the distance between two peaks originating from the negative electrode of the dV/dQ curve.
- the reduction rate of the negative electrode surplus capacity is defined as the negative electrode relative deterioration degree [%] as shown in the following (Equation 2) (S14).
- Negative electrode relative deterioration degree [%] 100 - (current negative electrode capacity - current battery capacity) / (initial negative electrode capacity - initial battery capacity) (Formula 2).
- the charge/discharge control unit 113 switches to charge/discharge control that prioritizes positive electrode deterioration suppression (S16), and the negative electrode relative deterioration degree is changed to the positive electrode relative deterioration degree. If it is larger (N in S15), the charge/discharge control is switched to one that gives priority to suppressing deterioration of the negative electrode (S17).
- the case where the relative deterioration degree of the negative electrode is larger than the relative deterioration degree of the positive electrode corresponds to the example shown in the lower diagram of FIG. Select discharge control.
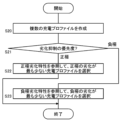
- FIG. 9 is a flowchart illustrating an example of deterioration suppression control during charging by the deterioration suppression control system 10 according to the embodiment.
- the charge/discharge control unit 113 generates a plurality of charging profiles before charging the secondary battery 21 (S20).
- the charge/discharge control unit 113 acquires the target SOC, charge start time, and charge end time of the secondary battery 21 based on the user's operation, and acquires the current SOC of the secondary battery 21 from the control unit 25 of the electric vehicle 20. do.
- the charging/discharging control unit 113 sets a plurality of slots at a predetermined step size within the chargeable time between the acquired charging start time and charging end time.
- the charge/discharge control unit 113 generates a plurality of patterns of charging profiles in which current rates are assigned to each slot within a range that satisfies the condition that the SOC of the secondary battery 21 reaches the target SOC at the charging end time.
- the current rate assigned to one slot may be 0 (dormant period).
- the charge/discharge control unit 113 may comprehensively generate several hundred patterns of charge profiles.
- the charge/discharge control unit 113 When charge/discharge control that prioritizes suppression of positive electrode deterioration is selected (positive electrode in S21), the charge/discharge control unit 113 refers to the storage deterioration characteristics and charge deterioration characteristics of the positive electrode from among the plurality of charging profiles.
- the charging profile that causes the least deterioration of the positive electrode is selected (S22). Specifically, the charge/discharge control unit 113 inputs the current rate and SOC of each slot of the charging profile, and calculates the positive electrode storage deterioration coefficient and the positive electrode charge deterioration coefficient of each slot.
- the charge/discharge control unit 113 selects the charging profile with the smallest total of the storage deterioration coefficient of the positive electrode and the charge deterioration coefficient of the positive electrode.
- the charge/discharge control unit 113 When charge/discharge control that prioritizes suppression of deterioration of the negative electrode is selected (negative electrode in S21), the charge/discharge control unit 113 refers to the storage deterioration characteristics and the charge deterioration characteristics of the negative electrode among the plurality of charging profiles.
- the charging profile that causes the least deterioration of the negative electrode is selected (S23). Specifically, the charge/discharge control unit 113 inputs the current rate and SOC of each slot of the charging profile, and calculates the negative electrode storage deterioration coefficient and the negative electrode charge deterioration coefficient of each slot.
- the charge/discharge control unit 113 selects the charging profile with the smallest sum of the storage deterioration coefficient of the negative electrode and the charge deterioration coefficient of the negative electrode.
- the charge/discharge control unit 113 when the electric vehicle 20 is a self-driving vehicle, a discharge plan in which deterioration is suppressed can be generated based on the delivery plan.
- the charge/discharge control unit 113 generates a plurality of discharge profiles before the electric vehicle 20 departs.
- the charge/discharge control unit 113 refers to the storage deterioration characteristics and charging deterioration characteristics of the positive electrode among the plurality of discharge profiles, and selects the one that causes the most deterioration of the positive electrode. Select less discharge profile.
- the charge/discharge control unit 113 refers to the storage deterioration characteristics and charge deterioration characteristics of the negative electrode among the plurality of discharge profiles, and selects the one that causes the most deterioration of the negative electrode. Select less discharge profile.
- the relative deterioration degree of the positive electrode and the negative electrode are determined based on the change in the peak position of the dV/dQ curve where the structural change of the positive electrode active material and the negative electrode active material appears and the change in battery capacity. Calculate the relative degree of deterioration of Using the relative deterioration degree of the positive electrode and the negative electrode as a measure, the relative deterioration degree of the positive electrode and the relative deterioration degree of the negative electrode are maintained in balance, that is, the charge-discharge curve of the positive electrode and the charge-discharge curve of the negative electrode overlap. Charge/discharge is controlled to maximize the area. Thereby, progression of cell level deterioration (decrease in SOH (State of Health)) can be suppressed to the maximum extent.
- the deterioration suppression control system 10 described above may be implemented in the control unit 25 of the electric vehicle 20 or the control unit 32 of the charging station 30.
- a four-wheeled electric vehicle is assumed as the electric vehicle 20.
- the electric vehicle 20 may be an electric motorcycle (electric scooter), an electric bicycle, or an electric kick scooter.
- electric vehicles include not only full electric vehicles but also low-speed electric vehicles such as golf carts and land cars.
- the object on which the secondary battery 21 is mounted is not limited to the electric vehicle 20. Objects to which the secondary battery 21 is installed include electric ships, railway vehicles, electric vehicles such as multicopters (drones), stationary power storage systems, and consumer electronic devices (smartphones, notebook PCs, etc.).
- an acquisition unit (111) that acquires battery data including voltage and current of the secondary battery (21); Based on the battery data of the secondary battery (21), calculate the rate of decrease in the current surplus capacity of the positive electrode relative to the initial surplus capacity of the positive electrode, and the rate of decrease in the current surplus capacity of the negative electrode relative to the initial surplus capacity of the negative electrode.
- an estimation unit (112) that estimates; If the rate of decrease in the surplus capacity of the positive electrode is greater than the rate of decrease in the surplus capacity of the negative electrode, the charge/discharge control is switched to a mode that prioritizes suppression of deterioration of the positive electrode, and the rate of decrease in the surplus capacity of the negative electrode is greater than the rate of decrease in the surplus capacity of the negative electrode.
- a charge/discharge control unit (113) that switches to charge/discharge control that prioritizes suppression of deterioration of the negative electrode when the rate is greater than the reduction rate;
- a deterioration suppression control system (10) comprising:
- the estimation unit (112) Differentiating a charge/discharge curve that defines the relationship between capacity and voltage of the secondary battery (21) to generate a dV/dQ curve; Estimating the rate of decrease in the surplus capacity of the positive electrode based on the rate of decrease in the distance between two peaks originating from the positive electrode of the dV / dQ curve, The deterioration suppression control system according to item 1 (10 ).
- the rate of decrease in the surplus capacity of the positive electrode and the rate of decrease in the surplus capacity of the negative electrode can be estimated with high accuracy.
- the switching frequency of charge/discharge control can be optimized.
- a deterioration characteristic holding unit (122) that holds storage deterioration characteristics, charging deterioration characteristics, storage deterioration characteristics and charging deterioration characteristics of the positive electrode, and storage deterioration characteristics and charging deterioration characteristics of the negative electrode of the secondary battery (21),
- the charge/discharge control unit (113) When charging and discharging control that prioritizes suppression of deterioration of the positive electrode is selected, a charging profile that causes the least deterioration of the positive electrode is selected by referring to storage deterioration characteristics and charging deterioration characteristics of the positive electrode among multiple charging profile candidates.
- a charging profile that causes the least deterioration of the negative electrode is selected by referring to the storage deterioration characteristics and charge deterioration characteristics of the negative electrode among the plurality of charging profile candidates.
- [Item 5] acquiring battery data including voltage and current of the secondary battery (21); Based on the battery data of the secondary battery (21), calculate the rate of decrease in the current surplus capacity of the positive electrode relative to the initial surplus capacity of the positive electrode, and the rate of decrease in the current surplus capacity of the negative electrode relative to the initial surplus capacity of the negative electrode. a step of estimating; If the rate of decrease in the surplus capacity of the positive electrode is greater than the rate of decrease in the surplus capacity of the negative electrode, the charge/discharge control is switched to a mode that prioritizes suppression of deterioration of the positive electrode, and the rate of decrease in the surplus capacity of the negative electrode is greater than the rate of decrease in the surplus capacity of the negative electrode. If it is larger than the reduction rate, switching to charge/discharge control that prioritizes suppression of deterioration of the negative electrode; A deterioration suppression control method characterized by having the following.
Abstract
In this deterioration inhibition control system, a data acquisition unit acquires battery data including a voltage and a current of a secondary battery. A deterioration estimation unit estimates a reduction rate of the current excess capacity of a cathode to the initial excess capacity of the cathode, and a reduction rate of the current excess capacity of an anode to the initial excess capacity of the anode, on the basis of the battery data of the secondary battery. A charge/discharge control unit is switched to charge/discharge control prioritizing deterioration inhibition of the cathode when the reduction rate of the excess capacity of the cathode is greater than the reduction rate of the excess capacity of the anode, and to charge/discharge control prioritizing deterioration inhibition of the anode when the reduction rate of the excess capacity of the anode is greater than the reduction rate of the excess capacity of the cathode.
Description
本開示は、二次電池の劣化を抑制するための劣化抑制制御システム、劣化抑制制御方法および劣化抑制制御プログラムに関する。
The present disclosure relates to a deterioration prevention control system, a deterioration prevention control method, and a deterioration prevention control program for suppressing deterioration of a secondary battery.
近年、リチウムイオン電池が様々な用途に使用されている。リチウムイオン電池の劣化を抑制するために、リチウムイオン電池の電圧、電流、温度をそのまま使用して、充放電制御方法を切り替える方法が一般的である。これに対して、リチウムイオン電池の内部状態(より具体的には正極と負極の劣化状態)を推定して、充放電制御方法を切り替える方法が提案されている(例えば、特許文献1参照)。特許文献1では、正極の容量と負極の容量の差、または正極の放電端電位と負極の放電端電位の差が負の値に反転したとき、二次電池の動作条件を変更する方法が提案されている。
In recent years, lithium ion batteries have been used for various purposes. In order to suppress the deterioration of lithium ion batteries, a common method is to use the voltage, current, and temperature of the lithium ion battery as they are, and to switch the charging/discharging control method. On the other hand, a method has been proposed in which the internal state of the lithium ion battery (more specifically, the deterioration state of the positive electrode and the negative electrode) is estimated and the charge/discharge control method is switched (for example, see Patent Document 1). Patent Document 1 proposes a method of changing the operating conditions of a secondary battery when the difference between the capacity of the positive electrode and the capacity of the negative electrode or the difference between the discharge end potential of the positive electrode and the discharge end potential of the negative electrode is reversed to a negative value. has been done.
二次電池の設計において、正極と負極にそれぞれ、電池容量の範囲外として実際の充放電に使用しない余剰容量を付加することが一般的である。余剰容量が多く付加されている場合、正極の容量と負極の容量の差、または正極の放電端電位と負極の放電端電位の差に基づく制御が、必ずしも電池容量の最大確保につながるとは限らない。
When designing a secondary battery, it is common to add surplus capacity to the positive and negative electrodes, which is outside the battery capacity and is not used for actual charging and discharging. When a large amount of surplus capacity is added, control based on the difference between the capacity of the positive electrode and the capacity of the negative electrode, or the difference between the discharge end potential of the positive electrode and the discharge end potential of the negative electrode, does not necessarily lead to securing the maximum battery capacity. do not have.
本開示はこうした状況に鑑みなされたものであり、その目的は、二次電池の劣化を最大限に抑制できる技術を提供することにある。
The present disclosure has been made in view of these circumstances, and its purpose is to provide a technology that can suppress the deterioration of secondary batteries to the maximum extent.
上記課題を解決するために、本開示のある態様の劣化抑制制御システムは、二次電池の電圧と電流を含む電池データを取得する取得部と、前記二次電池の電池データをもとに、初期の正極の余剰容量に対する現在の正極の余剰容量の減少率と、初期の負極の余剰容量に対する現在の負極の余剰容量の減少率を推定する推定部と、前記正極の余剰容量の減少率が前記負極の余剰容量の減少率より大きい場合、前記正極の劣化抑制を優先した充放電制御に切り替え、前記負極の余剰容量の減少率が前記正極の余剰容量の減少率より大きい場合、前記負極の劣化抑制を優先した充放電制御に切り替える充放電制御部と、を備える。
In order to solve the above problems, a deterioration suppression control system according to an aspect of the present disclosure includes an acquisition unit that acquires battery data including the voltage and current of the secondary battery, and based on the battery data of the secondary battery, an estimation unit that estimates a reduction rate of the current positive electrode surplus capacity with respect to the initial positive electrode surplus capacity and a reduction rate of the current negative electrode surplus capacity with respect to the initial negative electrode surplus capacity; If the rate of decrease in the surplus capacity of the negative electrode is greater than the rate of decrease in the surplus capacity of the negative electrode, the charge/discharge control is switched to prioritize suppression of deterioration of the positive electrode, and if the rate of decrease in the surplus capacity of the negative electrode is greater than the rate of decrease in the surplus capacity of the positive electrode, A charge/discharge control section that switches to charge/discharge control that prioritizes deterioration suppression.
なお、以上の構成要素の任意の組み合わせ、本開示の表現を装置、システム、方法、コンピュータプログラム、記録媒体などの間で変換したものもまた、本開示の態様として有効である。
Note that any combination of the above components and the expressions of the present disclosure converted between devices, systems, methods, computer programs, recording media, etc. are also effective as aspects of the present disclosure.
本開示によれば、二次電池の劣化を最大限に抑制できる。
According to the present disclosure, deterioration of secondary batteries can be suppressed to the maximum extent.
図1は、二次電池の劣化抑制制御システム10を説明するための図である。劣化抑制制御システム10は、電動車20に搭載された二次電池21の劣化状態を解析し、二次電池21の最適な劣化抑制制御を行うためのシステムである。劣化抑制制御システム10は例えば、電動車20に搭載された二次電池21の劣化解析サービスを提供する事業者の自社施設またはデータセンタに設置された自社サーバ上に構築されてもよい。また、劣化抑制制御システム10は、クラウドサービスに基づき利用するクラウドサーバ上に構築されてもよい。また、劣化抑制制御システム10は、複数の拠点(データセンタ、自社施設)に分散して設置された複数のサーバ上に構築されてもよい。当該複数のサーバは、複数の自社サーバの組み合わせ、複数のクラウドサーバの組み合わせ、自社サーバとクラウドサーバの組み合わせのいずれであってもよい。
FIG. 1 is a diagram for explaining a secondary battery deterioration suppression control system 10. The deterioration suppression control system 10 is a system for analyzing the deterioration state of the secondary battery 21 mounted on the electric vehicle 20 and performing optimal deterioration suppression control of the secondary battery 21. The deterioration suppression control system 10 may be constructed, for example, on an in-house server installed in the in-house facility or data center of a business that provides a deterioration analysis service for the secondary battery 21 mounted on the electric vehicle 20. Moreover, the deterioration suppression control system 10 may be constructed on a cloud server that is used based on a cloud service. Further, the deterioration suppression control system 10 may be constructed on a plurality of servers distributed and installed at a plurality of bases (data centers, company facilities). The plurality of servers may be a combination of a plurality of in-house servers, a plurality of cloud servers, or a combination of an in-house server and a cloud server.
本実施の形態では電動車20として、配送事業者に使用される電動車20を想定する。
In this embodiment, an electric vehicle 20 used by a delivery company is assumed as the electric vehicle 20.
電動車20に搭載される二次電池21は、駆動用モータ(不図示)に電力を供給する。二次電池21は、複数のセルまたは複数の並列セルブロックが直列接続されて構成される。
A secondary battery 21 mounted on the electric vehicle 20 supplies power to a drive motor (not shown). The secondary battery 21 is composed of a plurality of cells or a plurality of parallel cell blocks connected in series.
各並列セルブロックは、複数のセルが並列接続されて構成される。
Each parallel cell block is composed of a plurality of cells connected in parallel.
セルには、リチウムイオン電池セル、ニッケル水素電池セル、鉛電池セルなどを用いることができる。以下、本明細書ではリチウムイオン電池セル(公称電圧:3.6-3.7V)を使用する例を想定する。セルまたは並列セルブロックの直列数は、駆動用モータの電圧に応じて決定される。
As the cell, a lithium ion battery cell, a nickel metal hydride battery cell, a lead battery cell, etc. can be used. Hereinafter, this specification assumes an example in which a lithium ion battery cell (nominal voltage: 3.6-3.7V) is used. The number of cells or parallel cell blocks connected in series is determined according to the voltage of the drive motor.
電圧センサ22は、直列接続されたセルまたは並列セルブロックの両端電圧(正極-負極間の電圧)をそれぞれ検出する。直列接続された複数のセルまたは複数の並列セルブロックと直列に、シャント抵抗が接続される。電流センサ23は、シャント抵抗の両端電圧をもとに、直列接続されたセルまたは並列セルブロックに流れる電流を検出する。なお、シャント抵抗の代わりにホール素子を用いてもよい。温度センサ24は、複数のセルまたは並列セルブロックの少なくとも一つに設置されたサーミスタと抵抗の分圧電圧をもとに、複数のセルまたは並列セルブロックの温度を検出する。
The voltage sensor 22 detects the voltage across each of the cells connected in series or the parallel cell block (the voltage between the positive electrode and the negative electrode). A shunt resistor is connected in series with a plurality of series-connected cells or a plurality of parallel cell blocks. The current sensor 23 detects the current flowing through the series-connected cells or parallel cell blocks based on the voltage across the shunt resistor. Note that a Hall element may be used instead of the shunt resistor. The temperature sensor 24 detects the temperature of a plurality of cells or a parallel cell block based on a divided voltage of a thermistor and a resistor installed in at least one of the plurality of cells or a parallel cell block.
制御部25は、BMU(Battery Management Unit)とECU(Electronic Control Unit)が連携して構成される。BMUは、OCV(Open Circuit Voltage)法と電流積算法を組み合わせて、SOC(State Of Charge)を推定する。OCV法は、計測される各セルのOCVと、セルのSOC-OCVカーブをもとにSOCを推定する方法である。電流積算法は、各セルの充放電開始時のOCVと、計測される電流の積算値をもとにSOCを推定する方法である。電流積算法は、充放電時間が長くなるにつれて、電流の計測誤差が累積していく。したがって、OCV法により推定されたSOCを用いて、電流積算法により推定されたSOCを補正することが好ましい。
The control unit 25 is configured by a BMU (Battery Management Unit) and an ECU (Electronic Control Unit) working together. The BMU estimates SOC (State of Charge) by combining the OCV (Open Circuit Voltage) method and the current integration method. The OCV method is a method of estimating the SOC based on the measured OCV of each cell and the SOC-OCV curve of the cell. The current integration method is a method of estimating the SOC based on the OCV at the start of charging/discharging of each cell and the integrated value of the measured current. In the current integration method, current measurement errors accumulate as the charging/discharging time increases. Therefore, it is preferable to correct the SOC estimated by the current integration method using the SOC estimated by the OCV method.
BMUは、複数のセルまたは複数の並列セルブロックの電圧、電流、温度、SOCを定期的(例えば、10秒間隔)にサンプリングする。BMUは、複数のセルまたは複数の並列セルブロックの電圧、電流、温度、SOCを含む電池データを、車載ネットワークを介してECUに送信する。車載ネットワークとして例えば、CAN(Controller Area Network)やLIN(Local Interconnect Network)を使用することができる。
The BMU samples the voltage, current, temperature, and SOC of multiple cells or multiple parallel cell blocks periodically (eg, every 10 seconds). The BMU transmits battery data including voltage, current, temperature, and SOC of multiple cells or multiple parallel cell blocks to the ECU via the in-vehicle network. For example, CAN (Controller Area Network) or LIN (Local Interconnect Network) can be used as the in-vehicle network.
通信部26は、充電スタンド30の通信部33との通信信号処理を実行する機能と、ネットワーク5に接続するための無線信号処理を実行する機能を有する。通信部26は例えば、携帯電話網(セルラー網)、無線LAN、V2I(Vehicle-to-Infrastructure)、V2V(Vehicle-to-Vehicle)、ETCシステム(Electronic Toll Collection System)、DSRC(Dedicated Short Range Communications)を使用して、ネットワーク5にアクセスすることができる。
The communication unit 26 has a function of executing communication signal processing with the communication unit 33 of the charging station 30 and a function of executing wireless signal processing for connecting to the network 5. The communication unit 26 is, for example, a mobile phone network (cellular network), wireless LAN, V2I (vehicle-to-infrastructure), V2V (vehicle-to-vehicle), ETC system (electronic toll collection system), D SRC (Dedicated Short Range Communications) ) can be used to access the network 5.
ネットワーク5は、インターネット、専用線、VPN(Virtual Private Network)などの通信路の総称であり、その通信媒体やプロトコルは問わない。通信媒体として例えば、携帯電話網(セルラー網)、無線LAN、有線LAN、光ファイバ網、ADSL網、CATV網などを使用することができる。通信プロトコルとして例えば、TCP(Transmission Control Protocol)/IP(Internet Protocol)、UDP(User Datagram Protocol)/IP、イーサネット(登録商標)などを使用することができる。
The network 5 is a general term for communication paths such as the Internet, a leased line, and a VPN (Virtual Private Network), and the communication medium and protocol are not limited. As the communication medium, for example, a mobile phone network (cellular network), wireless LAN, wired LAN, optical fiber network, ADSL network, CATV network, etc. can be used. As a communication protocol, for example, TCP (Transmission Control Protocol)/IP (Internet Protocol), UDP (User Datagram Protocol)/IP, Ethernet (registered trademark), etc. can be used.
ECUは、サンプリングした電池データを、劣化抑制制御システム10に都度送信してもよいし、内部のメモリに蓄積し、所定のタイミングでメモリに蓄積されている電池データを劣化抑制制御システム10に一括送信してもよい。なお、電動車20と充電スタンド30が充電ケーブルで接続されている状態において、ECUは充電スタンド30を介して、メモリに蓄積されている電池データを劣化抑制制御システム10に送信してもよい。
The ECU may transmit the sampled battery data to the deterioration prevention control system 10 each time, or it may accumulate it in an internal memory and transmit the battery data stored in the memory to the deterioration prevention control system 10 at a predetermined timing. You can also send it. Note that while the electric vehicle 20 and the charging stand 30 are connected by a charging cable, the ECU may transmit the battery data stored in the memory to the deterioration suppression control system 10 via the charging stand 30.
電動車20を充電ケーブルで充電スタンド30に接続することにより、電動車20内の二次電池21を外部から充電することができる。充電スタンド30は商用電力系統2に接続され、二次電池21を充電する。
By connecting the electric vehicle 20 to the charging stand 30 with a charging cable, the secondary battery 21 in the electric vehicle 20 can be charged from the outside. The charging stand 30 is connected to the commercial power system 2 and charges the secondary battery 21.
一般的に、普通充電の場合は交流で、急速充電の場合は直流で充電される。交流(例えば、単相100/200V)で充電される場合、電動車20内の充電器(不図示)で充電電圧または充電電流が制御される。直流で充電される場合、充電スタンド30の給電部31で充電電圧または充電電流が制御される。給電部31は、整流回路、フィルタ、DC/DCコンバータを含み、整流回路で商用電力系統2から供給される交流電力を全波整流し、フィルタで平滑化することにより直流電力を生成する。DC/DCコンバータは、生成された直流電力の電圧または電流を制御する。
In general, batteries are charged with alternating current for normal charging and direct current for quick charging. When charging with alternating current (for example, single phase 100/200V), the charging voltage or charging current is controlled by a charger (not shown) in the electric vehicle 20. When charging with direct current, the charging voltage or charging current is controlled by the power supply unit 31 of the charging station 30. The power supply unit 31 includes a rectifier circuit, a filter, and a DC/DC converter, and generates DC power by full-wave rectifying the AC power supplied from the commercial power system 2 with the rectifier circuit and smoothing it with the filter. A DC/DC converter controls the voltage or current of the generated DC power.
急速充電規格として例えば、CHAdeMO(登録商標)、ChaoJi、GB/T、Combo(Combined Charging System)を使用することができる。CHAdeMO2.0では、最大出力(仕様)が1000V×400A=400kWと規定されている。CHAdeMO3.0では、最大出力(仕様)が1500V×600A=900kWと規定されている。ChaoJiでは、最大出力(仕様)が1500V×600A=900kWと規定されている。GB/Tでは、最大出力(仕様)が750V×250A=185kWと規定されている。Comboでは、最大出力(仕様)が900V×400A=350kWと規定されている。CHAdeMO、ChaoJi、GB/Tでは、通信方式としてCANが採用されている。Comboでは、通信方式としてPLC(Power Line Communication)が採用されている。
For example, CHAdeMO (registered trademark), ChaoJi, GB/T, and Combo (Combined Charging System) can be used as the quick charging standard. In CHAdeMO2.0, the maximum output (specification) is specified as 1000V x 400A = 400kW. In CHAdeMO3.0, the maximum output (specification) is specified as 1500V x 600A = 900kW. ChaoJi stipulates that the maximum output (specification) is 1500V x 600A = 900kW. In GB/T, the maximum output (specification) is specified as 750V x 250A = 185kW. Combo stipulates that the maximum output (specification) is 900V x 400A = 350kW. CHAdeMO, ChaoJi, and GB/T use CAN as a communication method. Combo uses PLC (Power Line Communication) as a communication method.
CAN方式を採用した充電ケーブル内には電力線に加えて通信線も含まれている。当該充電ケーブルで電動車20と充電スタンド30が接続されると、電動車20の制御部25は充電スタンド30の制御部32と通信チャンネルを確立する。なお、PLC方式を採用した充電ケーブルでは、通信信号が電力線に重畳されて伝送される。
A charging cable that uses the CAN method includes communication lines in addition to power lines. When the electric vehicle 20 and the charging stand 30 are connected with the charging cable, the control section 25 of the electric vehicle 20 establishes a communication channel with the control section 32 of the charging station 30. Note that in a charging cable that employs the PLC method, communication signals are transmitted superimposed on the power line.
充電スタンド30の通信部33は、電動車20の通信部26との通信信号処理を実行する機能と、ネットワーク5に接続するための信号処理を実行する機能を有する。通信部33は例えば、有線LAN、無線LAN、携帯電話網(セルラー網)を使用して、ネットワーク5にアクセスすることができる。
The communication unit 33 of the charging station 30 has a function of executing communication signal processing with the communication unit 26 of the electric vehicle 20 and a function of executing signal processing for connecting to the network 5. The communication unit 33 can access the network 5 using, for example, a wired LAN, a wireless LAN, or a mobile phone network (cellular network).
劣化抑制制御システム10は、制御部11、記憶部12、通信部13を備える。通信部13は、有線または無線によりネットワーク5に接続するための通信インタフェース(例えば、NIC:Network Interface Card)である。
The deterioration suppression control system 10 includes a control section 11, a storage section 12, and a communication section 13. The communication unit 13 is a communication interface (for example, NIC: Network Interface Card) for connecting to the network 5 by wire or wirelessly.
制御部11は、データ取得部111、劣化推定部112、充放電制御部113を含む。
The control unit 11 includes a data acquisition unit 111, a deterioration estimation unit 112, and a charge/discharge control unit 113.
制御部11の機能はハードウェア資源とソフトウェア資源の協働、またはハードウェア資源のみにより実現できる。ハードウェア資源として、CPU、ROM、RAM、GPU(Graphics Processing Unit)、ASIC(Application Specific Integrated Circuit)、FPGA(Field Programmable Gate Array)、その他のLSIを利用できる。ソフトウェア資源としてオペレーティングシステム、アプリケーションなどのプログラムを利用できる。プログラムは、ここでは記憶部12のメモリに予め記録されているが、インターネット等の電気通信回線を通じて、又はメモリカード等の(非一時的な)記録媒体に記録されて提供されてもよい。
The functions of the control unit 11 can be realized by cooperation of hardware resources and software resources, or by only hardware resources. Hardware resources include CPU, ROM, RAM, GPU (Graphics Processing Unit), ASIC (Application Specific Integrated Circuit), FPGA (Field Program Mable Gate Array) and other LSIs can be used. Programs such as operating systems and applications can be used as software resources. Although the program is pre-recorded in the memory of the storage unit 12 here, it may also be provided via a telecommunications line such as the Internet or by being recorded on a (non-temporary) recording medium such as a memory card.
記憶部12は、HDD、SSDなどの不揮発性の記録媒体を含み、各種データを記憶する。記憶部12は、電池データ保持部121、劣化特性保持部122を含む。電池データ保持部121は、データ取得部111が電動車20または充電スタンド30から取得した電池データを蓄積する。
The storage unit 12 includes a nonvolatile recording medium such as an HDD or an SSD, and stores various data. The storage unit 12 includes a battery data holding unit 121 and a deterioration characteristic holding unit 122. The battery data holding unit 121 stores battery data acquired by the data acquisition unit 111 from the electric vehicle 20 or the charging station 30.
劣化特性保持部122は、二次電池の種別ごとに、正極の保存劣化特性、充電劣化特性、放電劣化特性、負極の保存劣化特性、充電劣化特性、放電劣化特性を保持する。
The deterioration characteristic holding unit 122 holds storage deterioration characteristics, charge deterioration characteristics, discharge deterioration characteristics of the positive electrode, storage deterioration characteristics, charge deterioration characteristics, and discharge deterioration characteristics of the negative electrode for each type of secondary battery.
劣化特性保持部122は、二次電池の種別を特定するための電池情報として、型番、型式、セル形状、正極材料、正極材料の構成比、負極材料、負極材料の構成比、エネルギー重量密度、エネルギー体積密度などの情報の少なくとも一つを保持する。劣化特性保持部122内のデータは、新たな種別の二次電池が登録される度にアップデートされる。また、既登録の二次電池の特性情報がアップデートされたときも、劣化特性保持部122内のデータがアップデートされる。
The deterioration characteristic holding unit 122 stores, as battery information for identifying the type of the secondary battery, a model number, a model, a cell shape, a positive electrode material, a composition ratio of the positive electrode material, a negative electrode material, a composition ratio of the negative electrode material, an energy weight density, It retains at least one piece of information such as energy volume density. The data in the deterioration characteristic holding unit 122 is updated every time a new type of secondary battery is registered. Furthermore, when the characteristic information of a registered secondary battery is updated, the data in the deterioration characteristic holding unit 122 is also updated.
二次電池の保存劣化は、二次電池の各時点における温度、各時点におけるSOCに応じて経時的に進行する劣化である。充放電中であるか否かを問わず時間経過とともに進行する。保存劣化は主に、負極に被膜(SEI(Solid Electrolyte Interphase)膜)が形成されることに起因して発生する。保存劣化は、各時点におけるSOCと温度に依存する。
Storage deterioration of a secondary battery is a deterioration that progresses over time depending on the temperature of the secondary battery at each point in time and the SOC at each point in time. It progresses over time regardless of whether it is being charged or discharged. Storage deterioration mainly occurs due to the formation of a film (SEI (Solid Electrolyte Interphase) film) on the negative electrode. Storage deterioration depends on the SOC and temperature at each time point.
一般的に、各時点におけるSOCが高いほど、また各時点における温度が高いほど、保存劣化速度が増加する。
In general, the higher the SOC at each point in time and the higher the temperature at each point in time, the higher the storage deterioration rate.
二次電池の充放電劣化は、充放電の回数が増えるにつれ進行する劣化である。充放電劣化は主に、活物質の膨張または収縮による割れや剥離などに起因して発生する。充放電劣化は、使用するSOC範囲、温度、電流レートに依存する。一般的に、使用するSOC範囲が広いほど、また温度が高いほど、また電流レートが高いほど、充放電劣化速度が増加する。
Charging/discharging deterioration of a secondary battery is a deterioration that progresses as the number of charging/discharging increases. Charge/discharge deterioration mainly occurs due to cracking or peeling due to expansion or contraction of the active material. Charge/discharge deterioration depends on the SOC range, temperature, and current rate used. Generally, the wider the SOC range used, the higher the temperature, and the higher the current rate, the faster the charge/discharge deterioration rate increases.
正極の保存劣化特性、充電劣化特性、放電劣化特性、負極の保存劣化特性、充電劣化特性、放電劣化特性は、電池メーカによる実験やシミュレーションにより、二次電池の種別ごとに予め導出される。
The storage deterioration characteristics, charging deterioration characteristics, and discharge deterioration characteristics of the positive electrode, and the storage deterioration characteristics, charge deterioration characteristics, and discharge deterioration characteristics of the negative electrode are derived in advance for each type of secondary battery through experiments and simulations by the battery manufacturer.
図2は、保存劣化特性マップの一例を示す図である。横軸はSOC[%]を示し、縦軸は保存劣化係数Ksを示している。一般的に保存劣化は、経過時間(h)を0.5乗則(平方根)した値に対して略線形に進行する。なお、二次電池の種別によっては、経過時間(h)を0.4乗則した値や0.6乗則した値などに対して略線形に進行することもある。
FIG. 2 is a diagram showing an example of a storage deterioration characteristic map. The horizontal axis indicates SOC [%], and the vertical axis indicates storage deterioration coefficient Ks. In general, storage deterioration progresses approximately linearly with respect to the value obtained by elapsed time (h) to the 0.5 power law (square root). Note that, depending on the type of secondary battery, the time may progress approximately linearly with respect to a value obtained by multiplying the elapsed time (h) by the 0.4 power law or by the 0.6 power law.
図2では簡略化のため、25℃と45℃の2種類の温度に対する保存劣化特性しか描いていないが、実際には多数の温度に対する保存劣化特性が生成される。なお保存劣化特性は、マップではなく、SOCと温度を説明変数とし、保存劣化係数Ksを目的変数とする保存劣化特性モデル(関数)で定義されてもよい。
Although FIG. 2 only depicts storage deterioration characteristics for two types of temperatures, 25° C. and 45° C., for simplicity, storage deterioration characteristics for many temperatures are actually generated. Note that the storage deterioration characteristic may be defined not by a map but by a storage deterioration characteristic model (function) having SOC and temperature as explanatory variables and the storage deterioration coefficient Ks as an objective variable.
図3A,図3Bは、充電/放電劣化特性マップの一例を示す図である。図3Aは充電劣化特性マップの一例を示し、図3Bは放電劣化特性マップの一例を示している。横軸はSOC[%]の使用範囲を示す。図3A,図3Bにおいて、各SOCの値は、10%の使用範囲の下限値を示している。例えば、SOC10%はSOCが10~20%の範囲で充放電すること、SOC11%はSOCが11~21%の範囲で充放電することを示している。縦軸は充電/放電劣化係数Kc、Kdを示している。
3A and 3B are diagrams showing an example of a charge/discharge deterioration characteristic map. FIG. 3A shows an example of a charge deterioration characteristic map, and FIG. 3B shows an example of a discharge deterioration characteristic map. The horizontal axis indicates the usage range of SOC [%]. In FIGS. 3A and 3B, each SOC value indicates the lower limit of the 10% usage range. For example, SOC 10% indicates that the battery is charged and discharged within the SOC range of 10 to 20%, and SOC 11% indicates that the battery is charged and discharged within the SOC range of 11 to 21%. The vertical axis indicates charge/discharge deterioration coefficients Kc and Kd.
一般的に充放電劣化は、総充電量または総放電量(Ah)を0.5乗則(平方根)した値に対して略線形に進行する。なお、二次電池の種別によっては、総充電量または総放電量(Ah)を0.4乗則した値や0.6乗則した値などに対して略線形に進行することもある。
In general, charge/discharge deterioration progresses approximately linearly with respect to the value obtained by multiplying the total charge amount or the total discharge amount (Ah) by the 0.5 power law (square root). Note that depending on the type of secondary battery, the rate may progress approximately linearly with respect to a value obtained by 0.4th power or 0.6th power of the total charge amount or total discharge amount (Ah).
図3A,図3Bでは簡略化のため、0.1Cと0.8Cの2種類の電流レートに対する充電/放電劣化特性しか描いていないが、実際には多数の電流レートに対する充電/放電劣化特性が生成される。充電時は、図3Aに示すようにSOCの使用範囲が低い領域と高い領域で充電/放電劣化速度が増加することが分かる。放電時は、図3Bに示すようにSOCの使用範囲が低い領域で充電/放電劣化速度が増加することが分かる。
For simplicity, Figures 3A and 3B only depict charge/discharge deterioration characteristics for two types of current rates, 0.1C and 0.8C, but in reality, charge/discharge deterioration characteristics for many current rates are depicted. generated. During charging, it can be seen that the charging/discharging deterioration rate increases in the low and high SOC usage ranges, as shown in FIG. 3A. During discharging, as shown in FIG. 3B, it can be seen that the charging/discharging deterioration rate increases in a region where the SOC usage range is low.
また、充電/放電劣化特性は、電流レートほどの寄与はないが温度の影響も受ける。したがって充電/放電劣化速度の推定精度を上げるには、複数の電流レートと複数の温度の二次元の組み合わせごとに、SOC使用範囲と充電/放電劣化係数の関係を規定した充電/放電劣化特性を用意することが好ましい。一方、簡易的な充電/放電劣化特性マップを生成する場合、温度は常温とみなし、複数の電流レートごとの充電/放電劣化特性を用意するだけでよい。
Furthermore, the charge/discharge deterioration characteristics are also influenced by temperature, although it does not contribute as much as the current rate. Therefore, in order to improve the estimation accuracy of the charge/discharge deterioration rate, the charge/discharge deterioration characteristics that define the relationship between the SOC usage range and the charge/discharge deterioration coefficient are calculated for each two-dimensional combination of multiple current rates and multiple temperatures. It is preferable to prepare. On the other hand, when generating a simple charge/discharge deterioration characteristic map, it is sufficient to assume that the temperature is room temperature and prepare charge/discharge deterioration characteristics for each of a plurality of current rates.
なお、充電/放電劣化特性は、マップではなく、SOC使用範囲と電流レートと温度を説明変数とし、充電/放電劣化係数Kc、Kdを目的変数とする充電/放電劣化特性モデル(関数)で定義されてもよい。なお温度は定数であってもよい。
Note that the charge/discharge deterioration characteristics are defined not by a map but by a charge/discharge deterioration characteristic model (function) that uses the SOC usage range, current rate, and temperature as explanatory variables, and uses the charge/discharge deterioration coefficients Kc and Kd as objective variables. may be done. Note that the temperature may be a constant.
以上に説明した二次電池の保存劣化特性、充電劣化特性、放電劣化特性を、正極と負極のそれぞれについて用意する。本実施の形態では、二次電池の保存劣化特性、充電劣化特性、放電劣化特性は、後述する劣化抑制制御の切り替え処理に使用し、二次電池の劣化推定処理には使用しない。
The storage deterioration characteristics, charge deterioration characteristics, and discharge deterioration characteristics of the secondary battery explained above are prepared for each of the positive electrode and the negative electrode. In the present embodiment, the storage deterioration characteristics, charge deterioration characteristics, and discharge deterioration characteristics of the secondary battery are used in switching processing of deterioration suppression control, which will be described later, and are not used in deterioration estimation processing of the secondary battery.
本実施の形態では、二次電池の充放電曲線を微分して得られるdV/dQ曲線に現れるピーク情報を解析することで、正極と負極の劣化状況を独立に解析する。二次電池の充放電曲線は、充放電量と電池電圧の関係を規定した曲線である。
In this embodiment, the deterioration status of the positive electrode and negative electrode is independently analyzed by analyzing peak information appearing in the dV/dQ curve obtained by differentiating the charge/discharge curve of the secondary battery. The charge/discharge curve of a secondary battery is a curve that defines the relationship between charge/discharge amount and battery voltage.
図4は、二次電池、正極、負極の充放電曲線と、dV/dQ曲線の一例を示す図である。上の図は充放電曲線を示す。横軸は容量[Ah]を示し、左の縦軸は電池電圧[V]、正極電位[VvsL+/L]、右の縦軸は負極電位[VvsL+/L]を示す。正極電位[VvsL+/L]と負極電位[VvsL+/L]は、リチウム電位を0Vとしたときの電位である。電池電圧は、正極電位と負極電位の差であり、OCVで定義される。
FIG. 4 is a diagram showing an example of a charge/discharge curve and a dV/dQ curve of a secondary battery, a positive electrode, and a negative electrode. The figure above shows the charge-discharge curve. The horizontal axis shows the capacity [Ah], the left vertical axis shows the battery voltage [V], the positive electrode potential [VvsL + /L], and the right vertical axis shows the negative electrode potential [VvsL + /L]. The positive electrode potential [VvsL + /L] and the negative electrode potential [VvsL + /L] are potentials when the lithium potential is set to 0V. Battery voltage is the difference between the positive electrode potential and the negative electrode potential, and is defined by OCV.
例えば、電池容量の下限(SOC=0%)の電池電圧が2.5Vに設定され、電池容量の上限(SOC=100%)の電池電圧が4.2Vに設定される。下の図は、二次電池、正極、負極の充放電曲線をそれぞれ微分して得られるdV/dQ曲線を示す。横軸は容量[Ah]を示し、縦軸はdV/dQ[V/Ah]を示す。
For example, the battery voltage at the lower limit of battery capacity (SOC=0%) is set to 2.5V, and the battery voltage at the upper limit of battery capacity (SOC=100%) is set to 4.2V. The figure below shows dV/dQ curves obtained by differentiating the charge/discharge curves of the secondary battery, positive electrode, and negative electrode, respectively. The horizontal axis shows capacitance [Ah], and the vertical axis shows dV/dQ [V/Ah].
リチウムイオン電池では充電、放電に伴いリチウムイオンが正極活物質と負極活物質の間を往復する。放電時は、リチウムイオンが負極から正極へ移動するに伴い、負極電位が上昇し、正極電位が低下する。電池電圧は低下する。充電時は、リチウムイオンが正極から負極へ移動するに伴い、正極電位が上昇し、負極電位が低下する。電池電圧は上昇する。二次電池の充放電曲線の形状は、正極活物質、負極活物質の種類や量によって異なる。
In a lithium ion battery, lithium ions shuttle between the positive electrode active material and the negative electrode active material during charging and discharging. During discharge, as lithium ions move from the negative electrode to the positive electrode, the negative electrode potential increases and the positive electrode potential decreases. The battery voltage will drop. During charging, as lithium ions move from the positive electrode to the negative electrode, the positive electrode potential increases and the negative electrode potential decreases. Battery voltage increases. The shape of the charge/discharge curve of a secondary battery differs depending on the type and amount of the positive electrode active material and negative electrode active material.
また、充放電曲線の形状は劣化によって変化する。
Additionally, the shape of the charge/discharge curve changes due to deterioration.
一般に二次電池の充放電曲線は図4に示したように、電圧が徐々に低下する形状であり、二次電池の充放電曲線から正極活物質、負極活物質に由来する構造変化を抽出することは困難である。一方、二次電池のdV/dQ曲線では、複数のピークが観察される。各ピークが正極活物質の構造に由来するものであるか、負極活物質の構造に由来するものであるかは、少なくとも初期状態における正極のdV/dQ曲線と負極のdV/dQ曲線の形状から推定することができる。
Generally, the charge-discharge curve of a secondary battery has a shape in which the voltage gradually decreases, as shown in Figure 4, and structural changes originating from the positive electrode active material and the negative electrode active material can be extracted from the charge-discharge curve of the secondary battery. That is difficult. On the other hand, multiple peaks are observed in the dV/dQ curve of the secondary battery. Whether each peak originates from the structure of the positive electrode active material or the structure of the negative electrode active material can be determined from the shapes of the dV/dQ curve of the positive electrode and the dV/dQ curve of the negative electrode in at least the initial state. It can be estimated.
各ピークは正極電位または負極電位の変化率が極大値または極小値をとることに対応している。正極電位、負極電位は活物質中のリチウム組成比によって決定される。電位の変化率が極大または極小になるときの活物質中のリチウム組成比は、電池容量によらず一定である。したがって、二次電池のdV/dQ曲線の正極に由来する2つのピーク間の距離の減少率は、正極容量の減少率に対応する。例えば、現在のdV/dQ曲線の正極に由来する2つのピーク間の距離が、初期状態におけるdV/dQ曲線の正極に由来する2つのピーク間の距離の80%に減少していれば、正極容量が初期状態の80%に減少していると推定できる。負極についても同様である。
Each peak corresponds to the maximum or minimum value of the rate of change of the positive electrode potential or negative electrode potential. The positive electrode potential and negative electrode potential are determined by the lithium composition ratio in the active material. The lithium composition ratio in the active material when the rate of change in potential becomes maximum or minimum is constant regardless of battery capacity. Therefore, the rate of decrease in the distance between the two peaks originating from the positive electrode of the dV/dQ curve of the secondary battery corresponds to the rate of decrease in the positive electrode capacity. For example, if the distance between the two peaks originating from the positive pole of the current dV/dQ curve has decreased to 80% of the distance between the two peaks originating from the positive pole of the dV/dQ curve in the initial state, then the positive electrode It can be estimated that the capacity has decreased to 80% of the initial state. The same applies to the negative electrode.
図5は、二次電池のdV/dQ曲線の別の例を示す。図5に示す例では、二次電池のdV/dQ曲線から4つのピーク(極大値)を抽出している。第1ピークN1と第3ピークN2が負極に由来するピークであり、第2ピークP1と第4ピークP2が正極に由来するピークである。第1ピークN1と第3ピークN2間の距離(すなわち、第1ピークN1から第3ピークN2に遷移するために必要な充電量)の減少率から、負極容量の減少率を推定できる。同様に、第2ピークP1と第4ピークP2間の距離の減少率から、正極容量の減少率を推定できる。
FIG. 5 shows another example of the dV/dQ curve of a secondary battery. In the example shown in FIG. 5, four peaks (maximum values) are extracted from the dV/dQ curve of the secondary battery. The first peak N1 and the third peak N2 are peaks originating from the negative electrode, and the second peak P1 and the fourth peak P2 are peaks originating from the positive electrode. The rate of decrease in the negative electrode capacity can be estimated from the rate of decrease in the distance between the first peak N1 and the third peak N2 (that is, the amount of charge required to transition from the first peak N1 to the third peak N2). Similarly, the rate of decrease in the positive electrode capacity can be estimated from the rate of decrease in the distance between the second peak P1 and the fourth peak P2.
現在の二次電池の充放電曲線を推定するには、SOC=0%~SOC=100%まで低レートでメンテナンス充電する必要がある。電流レートを低く設定するのは電流による電圧降下IRの影響を小さくして、検出電圧を理想的なOCVに近づけるためである。例えば、0.05Cの電流レートで20時間、メンテナンス充電することが理想である。また、0.2Cの電流レートで3分充電し、1分休止後の電圧を検出する制御を繰り返すことで、7時間のメンテナンス充電で、二次電池の充放電曲線を推定することもできる。
To estimate the charge/discharge curve of current secondary batteries, it is necessary to perform maintenance charging at a low rate from SOC=0% to SOC=100%. The reason why the current rate is set low is to reduce the influence of the voltage drop IR caused by the current and bring the detected voltage close to the ideal OCV. For example, it is ideal to perform maintenance charging at a current rate of 0.05C for 20 hours. Furthermore, by repeating the control of charging at a current rate of 0.2C for 3 minutes and detecting the voltage after a 1-minute pause, it is also possible to estimate the charge/discharge curve of the secondary battery in 7 hours of maintenance charging.
正極電位と負極電位は、二次電池内に、金属リチウムの参照極を導入すれば検出可能である。その場合、正極の充放電曲線、負極の充放電曲線、正極のdV/dQ曲線、負極のdV/dQ曲線を推定可能である。それにより、正極のdV/dQ曲線の2つのピーク間の距離の減少率を直接、求めることができる。同様に、負極のdV/dQ曲線の2つのピーク間の距離の減少率を直接、求めることができる。
The positive electrode potential and negative electrode potential can be detected by introducing a metallic lithium reference electrode into the secondary battery. In that case, it is possible to estimate the charge/discharge curve of the positive electrode, the charge/discharge curve of the negative electrode, the dV/dQ curve of the positive electrode, and the dV/dQ curve of the negative electrode. Thereby, the rate of decrease in the distance between the two peaks of the dV/dQ curve of the positive electrode can be directly determined. Similarly, the rate of decrease in the distance between the two peaks of the dV/dQ curve of the negative electrode can be directly determined.
ただし、市販される一般的な二次電池には参照極が設けられない。そこで上述したように本実施の形態では、二次電池のdV/dQ曲線の複数のピークの内、正極に由来するピークと負極に由来するピークを特定し、正極容量の減少率と負極容量の減少率を求める。
However, commercially available general secondary batteries are not provided with a reference electrode. Therefore, as described above, in this embodiment, the peak originating from the positive electrode and the peak originating from the negative electrode are identified among the multiple peaks of the dV/dQ curve of the secondary battery, and the reduction rate of the positive electrode capacity and the negative electrode capacity are Find the rate of decrease.
二次電池の設計では、正極と負極にそれぞれ余剰容量を付加しておくことが一般的である。設計者は、実際の充放電に使用する正極活物質より多くの正極活物質を正極に充填し、実際の充放電に使用する負極活物質より多くの負極活物質を負極に充填する。正極活物質の量を多くするほど正極の充放電曲線の幅が広くなり、負極活物質の量を多くするほど負極の充放電曲線の幅が広くなる。正極と負極の充放電曲線の幅は、劣化により収縮する。
When designing a secondary battery, it is common to add surplus capacity to each of the positive and negative electrodes. The designer fills the positive electrode with more positive electrode active material than the positive electrode active material used for actual charging and discharging, and fills the negative electrode with more negative electrode active material than the negative electrode active material used for actual charging and discharging. As the amount of the positive electrode active material increases, the width of the charge/discharge curve of the positive electrode becomes wider, and as the amount of the negative electrode active material increases, the width of the charge/discharge curve of the negative electrode becomes wider. The width of the charge/discharge curves of the positive and negative electrodes shrinks due to deterioration.
正極の充放電曲線と負極の充放電曲線の重なる領域が電池容量となり、設計者は電池容量の下限をSOC=0%(例えば、電池電圧=2.5V)に設定し、上限をSOC=100%(例えば、電池電圧=4.2V)に設定する。
The area where the charge-discharge curve of the positive electrode and the charge-discharge curve of the negative electrode overlap is the battery capacity, and the designer sets the lower limit of the battery capacity to SOC = 0% (for example, battery voltage = 2.5V) and the upper limit to SOC = 100%. % (for example, battery voltage = 4.2V).
図6は、ある二次電池の初期状態における、二次電池、正極、負極の充放電曲線の一例を示す図である。横軸は容量[Ah]を示し、縦軸は電池電圧[V]、正極電位[VvsL+/L]、負極電位[VvsL+/L]を示す。図6に示す例では、正極の下限容量が電池の下限容量より低く設定されており、実際にはSOC=0%の状態から、さらに放電が可能である。正極の下限容量と電池の下限容量の差が正極余剰容量となる。負極の上限容量が電池の上限容量より高く設定されており、実際にはSOC=100%の状態から、さらに充電が可能である。負極の上限容量と電池の上限容量の差が負極余剰容量となる。
FIG. 6 is a diagram showing an example of charge/discharge curves of a secondary battery, a positive electrode, and a negative electrode in an initial state of a certain secondary battery. The horizontal axis indicates capacity [Ah], and the vertical axis indicates battery voltage [V], positive electrode potential [VvsL + /L], and negative electrode potential [VvsL + /L]. In the example shown in FIG. 6, the lower limit capacity of the positive electrode is set lower than the lower limit capacity of the battery, and further discharge is actually possible from the state of SOC=0%. The difference between the lower limit capacity of the positive electrode and the lower limit capacity of the battery is the positive electrode surplus capacity. The upper limit capacity of the negative electrode is set higher than the upper limit capacity of the battery, and further charging is actually possible from the state of SOC=100%. The difference between the upper limit capacity of the negative electrode and the upper limit capacity of the battery is the negative electrode surplus capacity.
図7は、二次電池、正極、負極の充放電曲線の収縮例を示す図である。上の図は正極の劣化により正極の充放電曲線の幅が10%収縮した状態を示している。下の図は負極の劣化により負極の充放電曲線の幅が10%収縮した状態を示している。二次電池のBMUは、二次電池の下限電圧と上限電圧の範囲を電池容量に設定する。上の図に示すように正極容量が10%減少した場合も、下の図に示すように負極容量が10%減少した場合も、電池容量が10%減少する。
FIG. 7 is a diagram showing an example of contraction of the charge/discharge curves of a secondary battery, a positive electrode, and a negative electrode. The upper figure shows a state in which the width of the charge/discharge curve of the positive electrode has shrunk by 10% due to deterioration of the positive electrode. The figure below shows a state in which the width of the charge/discharge curve of the negative electrode has shrunk by 10% due to deterioration of the negative electrode. The BMU of the secondary battery sets the range of the lower limit voltage and upper limit voltage of the secondary battery to the battery capacity. When the positive electrode capacity decreases by 10% as shown in the upper figure, and when the negative electrode capacity decreases by 10% as shown in the lower figure, the battery capacity decreases by 10%.
図8は、実施の形態に係る劣化抑制制御システム10による、充放電制御方法の切替処理の流れを示すフローチャートである。充放電制御部113はメンテナンスの実施時期が到来すると(S10のY)、充電スタンド30の制御部32にメンテナンス充電指示を送信する。例えば、数ヶ月に1度、メンテナンス充電を行ってもよい。給電部31は、劣化抑制制御システム10から指定された電流レートで二次電池21を定電流充電する。電動車20の制御部25は、メンテナンス充電中の電圧、電流、温度、SOCを含む電池データを充電スタンド30の制御部32に送信する。充電スタンド30の制御部32は、メンテナンス充電の終了後、メンテナンス充電時の電池データを劣化抑制制御システム10に送信する。
FIG. 8 is a flowchart showing the flow of the charging/discharging control method switching process by the deterioration suppression control system 10 according to the embodiment. When the time for performing maintenance arrives (Y in S10), the charge/discharge control unit 113 transmits a maintenance charging instruction to the control unit 32 of the charging station 30. For example, maintenance charging may be performed once every several months. The power supply unit 31 charges the secondary battery 21 with a constant current at a current rate specified by the deterioration suppression control system 10. The control unit 25 of the electric vehicle 20 transmits battery data including voltage, current, temperature, and SOC during maintenance charging to the control unit 32 of the charging station 30. After the maintenance charging is completed, the control unit 32 of the charging station 30 transmits the battery data at the time of maintenance charging to the deterioration suppression control system 10.
劣化抑制制御システム10のデータ取得部111は、メンテナンス充電時の電池データを充電スタンド30から取得して、電池データ保持部121に蓄積する。劣化推定部112は、メンテナンス充電時の二次電池21に含まれる複数のセルの電池データを統計処理して、代表セルの電池データを生成する。
The data acquisition unit 111 of the deterioration suppression control system 10 acquires battery data during maintenance charging from the charging stand 30 and stores it in the battery data storage unit 121. The deterioration estimating unit 112 statistically processes battery data of a plurality of cells included in the secondary battery 21 during maintenance charging to generate battery data of a representative cell.
劣化推定部112は、代表セルの電池データに含まれる容量と電圧をもとに、代表セルの充放電曲線を生成する。容量は電流を積算して求めることができる。劣化推定部112は、SOC=0%(下限電圧)からSOC=100%(上限電圧)までの間に充電された容量を、現在の電池容量と推定する(S11)。
The deterioration estimation unit 112 generates a charge/discharge curve of the representative cell based on the capacity and voltage included in the battery data of the representative cell. Capacity can be determined by integrating current. The deterioration estimation unit 112 estimates the capacity charged between SOC=0% (lower limit voltage) and SOC=100% (upper limit voltage) as the current battery capacity (S11).
劣化推定部112は、前回のメンテナンス充電時の電池容量に対する、今回のメンテナンス充電時の電池容量の減少率を算出し、当該減少率と閾値を比較する(S12)。当該減少率が閾値以下の場合(S12のN)、充放電制御方法の切替を行わずに処理を終了する。
The deterioration estimating unit 112 calculates the rate of decrease in battery capacity during the current maintenance charging with respect to the battery capacity during the previous maintenance charging, and compares the rate of decrease with a threshold value (S12). If the reduction rate is less than or equal to the threshold (N in S12), the process ends without switching the charging/discharging control method.
当該減少率が閾値を超えた場合(S12のY)、劣化推定部112は、代表セルの充放電曲線を微分して、代表セルのdV/dQ曲線を生成する。劣化推定部112は、dV/dQ曲線の正極に由来する2つのピーク間の距離の減少率をもとに、初期の正極余剰容量に対する現在の正極余剰容量の減少率を推定する。本実施の形態では、正極余剰容量の減少率を、下記(式1)に示すように正極相対劣化度[%]として定義する(S13)。
If the rate of decrease exceeds the threshold (Y in S12), the deterioration estimation unit 112 differentiates the charge/discharge curve of the representative cell to generate a dV/dQ curve of the representative cell. The deterioration estimating unit 112 estimates the rate of decrease in the current positive electrode surplus capacity with respect to the initial positive electrode surplus capacity based on the decrease rate in the distance between two peaks originating from the positive electrode of the dV/dQ curve. In the present embodiment, the reduction rate of positive electrode surplus capacity is defined as positive electrode relative deterioration degree [%] as shown in (Equation 1) below (S13).
正極相対劣化度[%]=100-(現在の正極容量-現在の電池容量)/(初期の正極容量-初期の電池容量) ・・・(式1)。
Positive electrode relative deterioration degree [%] = 100 - (current positive electrode capacity - current battery capacity) / (initial positive electrode capacity - initial battery capacity) (Formula 1).
劣化推定部112は、dV/dQ曲線の負極に由来する2つのピーク間の距離の減少率をもとに、初期の負極余剰容量に対する現在の負極余剰容量の減少率を推定する。本実施の形態では、負極余剰容量の減少率を、下記(式2)に示すように負極相対劣化度[%]として定義する(S14)。
The deterioration estimation unit 112 estimates the rate of decrease in the current negative electrode surplus capacity with respect to the initial negative electrode surplus capacity based on the decrease rate in the distance between two peaks originating from the negative electrode of the dV/dQ curve. In this embodiment, the reduction rate of the negative electrode surplus capacity is defined as the negative electrode relative deterioration degree [%] as shown in the following (Equation 2) (S14).
負極相対劣化度[%]=100-(現在の負極容量-現在の電池容量)/(初期の負極容量-初期の電池容量) ・・・(式2)。
Negative electrode relative deterioration degree [%] = 100 - (current negative electrode capacity - current battery capacity) / (initial negative electrode capacity - initial battery capacity) (Formula 2).
充放電制御部113は、正極相対劣化度が負極相対劣化度より大きい場合(S15のY)、正極の劣化抑制を優先した充放電制御に切り替え(S16)、負極相対劣化度が正極相対劣化度より大きい場合(S15のN)、負極の劣化抑制を優先した充放電制御に切り替える(S17)。
If the positive electrode relative deterioration degree is greater than the negative electrode relative deterioration degree (Y in S15), the charge/discharge control unit 113 switches to charge/discharge control that prioritizes positive electrode deterioration suppression (S16), and the negative electrode relative deterioration degree is changed to the positive electrode relative deterioration degree. If it is larger (N in S15), the charge/discharge control is switched to one that gives priority to suppressing deterioration of the negative electrode (S17).
正極相対劣化度が負極相対劣化度より大きい場合とは、図7の上の図の例に相当し、負極余剰容量の方が相対的に多いため、正極の劣化抑制を優先した充放電制御を選択する。
The case where the relative deterioration degree of the positive electrode is greater than the relative deterioration degree of the negative electrode corresponds to the example shown in the upper diagram of FIG. select.
反対に、負極相対劣化度が正極相対劣化度より大きい場合とは、図7の下の図の例に相当し、正極余剰容量の方が相対的に多いため、負極の劣化抑制を優先した充放電制御を選択する。
On the other hand, the case where the relative deterioration degree of the negative electrode is larger than the relative deterioration degree of the positive electrode corresponds to the example shown in the lower diagram of FIG. Select discharge control.
図9は、実施の形態に係る劣化抑制制御システム10による、充電時の劣化抑制制御の一例を示すフローチャートである。充放電制御部113は、二次電池21を充電する前に、複数の充電プロファイルを生成する(S20)。
FIG. 9 is a flowchart illustrating an example of deterioration suppression control during charging by the deterioration suppression control system 10 according to the embodiment. The charge/discharge control unit 113 generates a plurality of charging profiles before charging the secondary battery 21 (S20).
例えば、充放電制御部113は、ユーザの操作にもとづき二次電池21の目標SOC、充電開始時刻、充電終了時刻を取得し、電動車20の制御部25から二次電池21の現在SOCを取得する。充放電制御部113は、取得された充電開始時刻と充電終了時刻との間の充電可能時間内に、所定の刻み幅で複数のスロットを設定する。充放電制御部113は、充電終了時刻に二次電池21のSOCが目標SOCに到達している条件を満たす範囲で、各スロットに電流レートを割り当てた複数パターンの充電プロファイルを生成する。
For example, the charge/discharge control unit 113 acquires the target SOC, charge start time, and charge end time of the secondary battery 21 based on the user's operation, and acquires the current SOC of the secondary battery 21 from the control unit 25 of the electric vehicle 20. do. The charging/discharging control unit 113 sets a plurality of slots at a predetermined step size within the chargeable time between the acquired charging start time and charging end time. The charge/discharge control unit 113 generates a plurality of patterns of charging profiles in which current rates are assigned to each slot within a range that satisfies the condition that the SOC of the secondary battery 21 reaches the target SOC at the charging end time.
一つのスロットに割り当てられる電流レートは0(休止期間)であってもよい。充放電制御部113は、数百パターンの充電プロファイルを網羅的に生成してもよい。
The current rate assigned to one slot may be 0 (dormant period). The charge/discharge control unit 113 may comprehensively generate several hundred patterns of charge profiles.
正極の劣化抑制を優先した充放電制御が選択されている場合(S21の正極)、充放電制御部113は、複数の充電プロファイルの内、正極の保存劣化特性と充電劣化特性を参照して、最も正極の劣化が少ない充電プロファイルを選択する(S22)。具体的には充放電制御部113は、充電プロファイルの各スロットの電流レートとSOCを入力して、各スロットの正極の保存劣化係数と正極の充電劣化係数を算出する。充放電制御部113は、正極の保存劣化係数と正極の充電劣化係数の合計が最も小さい充電プロファイルを選択する。
When charge/discharge control that prioritizes suppression of positive electrode deterioration is selected (positive electrode in S21), the charge/discharge control unit 113 refers to the storage deterioration characteristics and charge deterioration characteristics of the positive electrode from among the plurality of charging profiles. The charging profile that causes the least deterioration of the positive electrode is selected (S22). Specifically, the charge/discharge control unit 113 inputs the current rate and SOC of each slot of the charging profile, and calculates the positive electrode storage deterioration coefficient and the positive electrode charge deterioration coefficient of each slot. The charge/discharge control unit 113 selects the charging profile with the smallest total of the storage deterioration coefficient of the positive electrode and the charge deterioration coefficient of the positive electrode.
負極の劣化抑制を優先した充放電制御が選択されている場合(S21の負極)、充放電制御部113は、複数の充電プロファイルの内、負極の保存劣化特性と充電劣化特性を参照して、最も負極の劣化が少ない充電プロファイルを選択する(S23)。具体的には充放電制御部113は、充電プロファイルの各スロットの電流レートとSOCを入力して、各スロットの負極の保存劣化係数と負極の充電劣化係数を算出する。充放電制御部113は、負極の保存劣化係数と負極の充電劣化係数の合計が最も小さい充電プロファイルを選択する。
When charge/discharge control that prioritizes suppression of deterioration of the negative electrode is selected (negative electrode in S21), the charge/discharge control unit 113 refers to the storage deterioration characteristics and the charge deterioration characteristics of the negative electrode among the plurality of charging profiles. The charging profile that causes the least deterioration of the negative electrode is selected (S23). Specifically, the charge/discharge control unit 113 inputs the current rate and SOC of each slot of the charging profile, and calculates the negative electrode storage deterioration coefficient and the negative electrode charge deterioration coefficient of each slot. The charge/discharge control unit 113 selects the charging profile with the smallest sum of the storage deterioration coefficient of the negative electrode and the charge deterioration coefficient of the negative electrode.
なお、電動車20が自動運転車の場合、配送計画をもとに、劣化抑制された放電計画を生成することができる。充放電制御部113は、電動車20の出発前に、複数の放電プロファイルを生成する。正極の劣化抑制を優先した充放電制御が選択されている場合、充放電制御部113は、複数の放電プロファイルの内、正極の保存劣化特性と充電劣化特性を参照して、最も正極の劣化が少ない放電プロファイルを選択する。負極の劣化抑制を優先した充放電制御が選択されている場合、充放電制御部113は、複数の放電プロファイルの内、負極の保存劣化特性と充電劣化特性を参照して、最も負極の劣化が少ない放電プロファイルを選択する。
Note that when the electric vehicle 20 is a self-driving vehicle, a discharge plan in which deterioration is suppressed can be generated based on the delivery plan. The charge/discharge control unit 113 generates a plurality of discharge profiles before the electric vehicle 20 departs. When charge/discharge control that prioritizes suppression of positive electrode deterioration is selected, the charge/discharge control unit 113 refers to the storage deterioration characteristics and charging deterioration characteristics of the positive electrode among the plurality of discharge profiles, and selects the one that causes the most deterioration of the positive electrode. Select less discharge profile. When charge/discharge control that prioritizes suppression of negative electrode deterioration is selected, the charge/discharge control unit 113 refers to the storage deterioration characteristics and charge deterioration characteristics of the negative electrode among the plurality of discharge profiles, and selects the one that causes the most deterioration of the negative electrode. Select less discharge profile.
以上説明したように本実施の形態によれば、正極活物質と負極活物質の構造変化が現れるdV/dQ曲線のピーク位置の変化と、電池容量の変化に基づき、正極の相対劣化度と負極の相対劣化度を算出する。この正極の相対劣化度と負極の相対劣化度を尺度として、正極の相対劣化度と負極の相対劣化度のバランスが保たれるように、すなわち正極の充放電曲線と負極の充放電曲線の重なる領域が最大化されるように充放電制御する。これにより、セルレベルの劣化進行(SOH(State Of Health)の低下)を最大限に抑制できる。
As explained above, according to the present embodiment, the relative deterioration degree of the positive electrode and the negative electrode are determined based on the change in the peak position of the dV/dQ curve where the structural change of the positive electrode active material and the negative electrode active material appears and the change in battery capacity. Calculate the relative degree of deterioration of Using the relative deterioration degree of the positive electrode and the negative electrode as a measure, the relative deterioration degree of the positive electrode and the relative deterioration degree of the negative electrode are maintained in balance, that is, the charge-discharge curve of the positive electrode and the charge-discharge curve of the negative electrode overlap. Charge/discharge is controlled to maximize the area. Thereby, progression of cell level deterioration (decrease in SOH (State of Health)) can be suppressed to the maximum extent.
以上、本開示を実施の形態をもとに説明した。実施の形態は例示であり、それらの各構成要素や各処理プロセスの組み合わせにいろいろな変形例が可能なこと、またそうした変形例も本開示の範囲にあることは当業者に理解されるところである。
The present disclosure has been described above based on the embodiments. It will be understood by those skilled in the art that the embodiments are illustrative, and that various modifications are possible to the combinations of each component and each treatment process, and that such modifications are also within the scope of the present disclosure. .
上述した劣化抑制制御システム10は、電動車20の制御部25または充電スタンド30の制御部32に実装されてもよい。
The deterioration suppression control system 10 described above may be implemented in the control unit 25 of the electric vehicle 20 or the control unit 32 of the charging station 30.
上記実施の形態では、電動車20として、四輪の電気自動車を想定した。この点、電動バイク(電動スクータ)、電動自転車、電動キックスクータであってもよい。また、電気自動車にはフル規格の電気自動車だけでなく、ゴルフカートやランドカーなどの低速の電気自動車も含まれる。また、二次電池21が搭載される対象は電動車20に限るものではない。二次電池21が搭載される対象には、電動船舶、鉄道車両、マルチコプタ(ドローン)などの電動移動体、定置型蓄電システム、民生用の電子機器(スマートフォン、ノートPCなど)も含まれる。
In the above embodiment, a four-wheeled electric vehicle is assumed as the electric vehicle 20. In this respect, it may be an electric motorcycle (electric scooter), an electric bicycle, or an electric kick scooter. Furthermore, electric vehicles include not only full electric vehicles but also low-speed electric vehicles such as golf carts and land cars. Furthermore, the object on which the secondary battery 21 is mounted is not limited to the electric vehicle 20. Objects to which the secondary battery 21 is installed include electric ships, railway vehicles, electric vehicles such as multicopters (drones), stationary power storage systems, and consumer electronic devices (smartphones, notebook PCs, etc.).
なお、実施の形態は、以下の項目によって特定されてもよい。
Note that the embodiment may be specified by the following items.
[項目1]
二次電池(21)の電圧と電流を含む電池データを取得する取得部(111)と、
前記二次電池(21)の電池データをもとに、初期の正極の余剰容量に対する現在の正極の余剰容量の減少率と、初期の負極の余剰容量に対する現在の負極の余剰容量の減少率を推定する推定部(112)と、
前記正極の余剰容量の減少率が前記負極の余剰容量の減少率より大きい場合、前記正極の劣化抑制を優先した充放電制御に切り替え、前記負極の余剰容量の減少率が前記正極の余剰容量の減少率より大きい場合、前記負極の劣化抑制を優先した充放電制御に切り替える充放電制御部(113)と、
を備えることを特徴とする劣化抑制制御システム(10)。 [Item 1]
an acquisition unit (111) that acquires battery data including voltage and current of the secondary battery (21);
Based on the battery data of the secondary battery (21), calculate the rate of decrease in the current surplus capacity of the positive electrode relative to the initial surplus capacity of the positive electrode, and the rate of decrease in the current surplus capacity of the negative electrode relative to the initial surplus capacity of the negative electrode. an estimation unit (112) that estimates;
If the rate of decrease in the surplus capacity of the positive electrode is greater than the rate of decrease in the surplus capacity of the negative electrode, the charge/discharge control is switched to a mode that prioritizes suppression of deterioration of the positive electrode, and the rate of decrease in the surplus capacity of the negative electrode is greater than the rate of decrease in the surplus capacity of the negative electrode. a charge/discharge control unit (113) that switches to charge/discharge control that prioritizes suppression of deterioration of the negative electrode when the rate is greater than the reduction rate;
A deterioration suppression control system (10) comprising:
これによれば、二次電池(21)の劣化を最大限に抑制できる。
According to this, deterioration of the secondary battery (21) can be suppressed to the maximum.
[項目2]
前記推定部(112)は、
前記二次電池(21)の容量と電圧の関係を規定した充放電曲線を微分して、dV/dQ曲線を生成し、
前記dV/dQ曲線の正極に由来する2つのピーク間の距離の減少率をもとに前記正極の余剰容量の減少率を推定し、
前記dV/dQ曲線の負極に由来する2つのピーク間の距離の減少率をもとに前記負極の余剰容量の減少率を推定することを特徴とする項目1に記載の劣化抑制制御システム(10)。 [Item 2]
The estimation unit (112)
Differentiating a charge/discharge curve that defines the relationship between capacity and voltage of the secondary battery (21) to generate a dV/dQ curve;
Estimating the rate of decrease in the surplus capacity of the positive electrode based on the rate of decrease in the distance between two peaks originating from the positive electrode of the dV / dQ curve,
The deterioration suppression control system according to item 1 (10 ).
これによれば、二次電池(21)の充放電曲線から、正極の余剰容量の減少率と負極の余剰容量の減少率を高精度に推定できる。
According to this, from the charge/discharge curve of the secondary battery (21), the rate of decrease in the surplus capacity of the positive electrode and the rate of decrease in the surplus capacity of the negative electrode can be estimated with high accuracy.
[項目3]
前記二次電池(21)の容量の減少率が閾値を超えたとき、
前記推定部(112)は、前記正極の余剰容量の減少率と前記負極の余剰容量の減少率を推定し、
前記充放電制御部(113)は、両者の関係をもとに前記充放電制御の切り替え制御を実行する項目1に記載の劣化抑制制御システム(10)。 [Item 3]
When the rate of decrease in capacity of the secondary battery (21) exceeds a threshold,
The estimating unit (112) estimates a decreasing rate of surplus capacity of the positive electrode and a decreasing rate of surplus capacity of the negative electrode,
The deterioration suppression control system (10) according toitem 1, wherein the charge/discharge control unit (113) executes switching control of the charge/discharge control based on the relationship between the two.
前記二次電池(21)の容量の減少率が閾値を超えたとき、
前記推定部(112)は、前記正極の余剰容量の減少率と前記負極の余剰容量の減少率を推定し、
前記充放電制御部(113)は、両者の関係をもとに前記充放電制御の切り替え制御を実行する項目1に記載の劣化抑制制御システム(10)。 [Item 3]
When the rate of decrease in capacity of the secondary battery (21) exceeds a threshold,
The estimating unit (112) estimates a decreasing rate of surplus capacity of the positive electrode and a decreasing rate of surplus capacity of the negative electrode,
The deterioration suppression control system (10) according to
これによれば、充放電制御の切り替え頻度を最適化できる。
According to this, the switching frequency of charge/discharge control can be optimized.
[項目4]
前記二次電池(21)の正極の保存劣化特性、充電劣化特性、負極の保存劣化特性、充電劣化特性を保持する劣化特性保持部(122)をさらに備え、
前記充放電制御部(113)は、前記二次電池(21)を充電する場合において、
前記正極の劣化抑制を優先した充放電制御を選択している場合、複数の充電プロファイル候補の内、前記正極の保存劣化特性と充電劣化特性を参照して、最も前記正極の劣化が少ない充電プロファイルを選択し、
前記負極の劣化抑制を優先した充放電制御を選択している場合、複数の充電プロファイル候補の内、前記負極の保存劣化特性と充電劣化特性を参照して、最も前記負極の劣化が少ない充電プロファイルを選択する項目1に記載の劣化抑制制御システム(10)。 [Item 4]
further comprising a deterioration characteristic holding unit (122) that holds storage deterioration characteristics, charging deterioration characteristics, storage deterioration characteristics and charging deterioration characteristics of the positive electrode, and storage deterioration characteristics and charging deterioration characteristics of the negative electrode of the secondary battery (21),
When charging the secondary battery (21), the charge/discharge control unit (113)
When charging and discharging control that prioritizes suppression of deterioration of the positive electrode is selected, a charging profile that causes the least deterioration of the positive electrode is selected by referring to storage deterioration characteristics and charging deterioration characteristics of the positive electrode among multiple charging profile candidates. Select
When charging/discharging control that gives priority to suppressing deterioration of the negative electrode is selected, a charging profile that causes the least deterioration of the negative electrode is selected by referring to the storage deterioration characteristics and charge deterioration characteristics of the negative electrode among the plurality of charging profile candidates. The deterioration suppression control system (10) according toitem 1, which selects.
前記二次電池(21)の正極の保存劣化特性、充電劣化特性、負極の保存劣化特性、充電劣化特性を保持する劣化特性保持部(122)をさらに備え、
前記充放電制御部(113)は、前記二次電池(21)を充電する場合において、
前記正極の劣化抑制を優先した充放電制御を選択している場合、複数の充電プロファイル候補の内、前記正極の保存劣化特性と充電劣化特性を参照して、最も前記正極の劣化が少ない充電プロファイルを選択し、
前記負極の劣化抑制を優先した充放電制御を選択している場合、複数の充電プロファイル候補の内、前記負極の保存劣化特性と充電劣化特性を参照して、最も前記負極の劣化が少ない充電プロファイルを選択する項目1に記載の劣化抑制制御システム(10)。 [Item 4]
further comprising a deterioration characteristic holding unit (122) that holds storage deterioration characteristics, charging deterioration characteristics, storage deterioration characteristics and charging deterioration characteristics of the positive electrode, and storage deterioration characteristics and charging deterioration characteristics of the negative electrode of the secondary battery (21),
When charging the secondary battery (21), the charge/discharge control unit (113)
When charging and discharging control that prioritizes suppression of deterioration of the positive electrode is selected, a charging profile that causes the least deterioration of the positive electrode is selected by referring to storage deterioration characteristics and charging deterioration characteristics of the positive electrode among multiple charging profile candidates. Select
When charging/discharging control that gives priority to suppressing deterioration of the negative electrode is selected, a charging profile that causes the least deterioration of the negative electrode is selected by referring to the storage deterioration characteristics and charge deterioration characteristics of the negative electrode among the plurality of charging profile candidates. The deterioration suppression control system (10) according to
これによれば、二次電池(21)の劣化を最大限に抑制された充電計画を作成できる。
According to this, it is possible to create a charging plan in which deterioration of the secondary battery (21) is suppressed to the maximum extent.
[項目5]
二次電池(21)の電圧と電流を含む電池データを取得するステップと、
前記二次電池(21)の電池データをもとに、初期の正極の余剰容量に対する現在の正極の余剰容量の減少率と、初期の負極の余剰容量に対する現在の負極の余剰容量の減少率を推定するステップと、
前記正極の余剰容量の減少率が前記負極の余剰容量の減少率より大きい場合、前記正極の劣化抑制を優先した充放電制御に切り替え、前記負極の余剰容量の減少率が前記正極の余剰容量の減少率より大きい場合、前記負極の劣化抑制を優先した充放電制御に切り替えるステップと、
を有することを特徴とする劣化抑制制御方法。 [Item 5]
acquiring battery data including voltage and current of the secondary battery (21);
Based on the battery data of the secondary battery (21), calculate the rate of decrease in the current surplus capacity of the positive electrode relative to the initial surplus capacity of the positive electrode, and the rate of decrease in the current surplus capacity of the negative electrode relative to the initial surplus capacity of the negative electrode. a step of estimating;
If the rate of decrease in the surplus capacity of the positive electrode is greater than the rate of decrease in the surplus capacity of the negative electrode, the charge/discharge control is switched to a mode that prioritizes suppression of deterioration of the positive electrode, and the rate of decrease in the surplus capacity of the negative electrode is greater than the rate of decrease in the surplus capacity of the negative electrode. If it is larger than the reduction rate, switching to charge/discharge control that prioritizes suppression of deterioration of the negative electrode;
A deterioration suppression control method characterized by having the following.
これによれば、二次電池(21)の劣化を最大限に抑制できる。
According to this, deterioration of the secondary battery (21) can be suppressed to the maximum.
[項目6]
二次電池(21)の電圧と電流を含む電池データを取得する処理と、
前記二次電池(21)の電池データをもとに、初期の正極の余剰容量に対する現在の正極の余剰容量の減少率と、初期の負極の余剰容量に対する現在の負極の余剰容量の減少率を推定する処理と、
前記正極の余剰容量の減少率が前記負極の余剰容量の減少率より大きい場合、前記正極の劣化抑制を優先した充放電制御に切り替え、前記負極の余剰容量の減少率が前記正極の余剰容量の減少率より大きい場合、前記負極の劣化抑制を優先した充放電制御に切り替える処理と、
をコンピュータに実行させることを特徴とする劣化抑制制御プログラム。 [Item 6]
A process of acquiring battery data including voltage and current of the secondary battery (21);
Based on the battery data of the secondary battery (21), calculate the rate of decrease in the current surplus capacity of the positive electrode relative to the initial surplus capacity of the positive electrode, and the rate of decrease in the current surplus capacity of the negative electrode relative to the initial surplus capacity of the negative electrode. Estimating process;
If the rate of decrease in the surplus capacity of the positive electrode is greater than the rate of decrease in the surplus capacity of the negative electrode, the charge/discharge control is switched to a mode that prioritizes suppression of deterioration of the positive electrode, and the rate of decrease in the surplus capacity of the negative electrode is greater than the rate of decrease in the surplus capacity of the negative electrode. If it is larger than the reduction rate, switching to charge/discharge control that prioritizes suppression of deterioration of the negative electrode;
A deterioration suppression control program characterized by causing a computer to execute.
これによれば、二次電池(21)の劣化を最大限に抑制できる。
According to this, deterioration of the secondary battery (21) can be suppressed to the maximum.
2 商用電力系統、 5 ネットワーク、 10 劣化抑制制御システム、 11 制御部、 12 記憶部、 13 通信部、 20 電動車、 21 二次電池、 22 電圧センサ、 23 電流センサ、 24 温度センサ、 25 制御部、 26 通信部、 30 充電スタンド、 31 給電部、 32 制御部、 33 通信部、 111 データ取得部、 112 劣化推定部、 113 充放電制御部、 121 電池データ保持部、 122 劣化特性保持部。
2 Commercial power system, 5 Network, 10 Deterioration suppression control system, 11 Control unit, 12 Storage unit, 13 Communication unit, 20 Electric vehicle, 21 Secondary battery, 22 Voltage sensor, 23 Current sensor, 24 Temperature sensor, 2 5 Control section , 26 Communication unit, 30 Charging stand, 31 Power supply unit, 32 Control unit, 33 Communication unit, 111 Data acquisition unit, 112 Deterioration estimation unit, 113 Charge/discharge control unit, 121 Battery data retention unit, 122 Deterioration characteristic retention Department.
Claims (7)
- 二次電池の電圧と電流を含む電池データを取得する取得部と、
前記二次電池の電池データをもとに、初期の正極の余剰容量に対する現在の正極の余剰容量の減少率と、初期の負極の余剰容量に対する現在の負極の余剰容量の減少率を推定する推定部と、
前記正極の余剰容量の減少率が前記負極の余剰容量の減少率より大きい場合、前記正極の劣化抑制を優先した充放電制御に切り替え、前記負極の余剰容量の減少率が前記正極の余剰容量の減少率より大きい場合、前記負極の劣化抑制を優先した充放電制御に切り替える充放電制御部と、
を備えることを特徴とする劣化抑制制御システム。 an acquisition unit that acquires battery data including voltage and current of the secondary battery;
Estimating the rate of decrease in the current surplus capacity of the positive electrode relative to the initial surplus capacity of the positive electrode and the rate of decrease in the current surplus capacity of the negative electrode relative to the initial surplus capacity of the negative electrode based on the battery data of the secondary battery. Department and
If the rate of decrease in the surplus capacity of the positive electrode is greater than the rate of decrease in the surplus capacity of the negative electrode, the charge/discharge control is switched to a mode that prioritizes suppression of deterioration of the positive electrode, and the rate of decrease in the surplus capacity of the negative electrode is greater than the rate of decrease in the surplus capacity of the negative electrode. a charge/discharge control unit that switches to charge/discharge control that prioritizes suppression of deterioration of the negative electrode when the rate is greater than the reduction rate;
A deterioration suppression control system comprising: - 前記推定部は、
前記二次電池の容量と電圧の関係を規定した充放電曲線を微分して、dV/dQ曲線を生成し、
前記dV/dQ曲線の正極に由来する2つのピーク間の距離の減少率をもとに前記正極の余剰容量の減少率を推定し、
前記dV/dQ曲線の負極に由来する2つのピーク間の距離の減少率をもとに前記負極の余剰容量の減少率を推定することを特徴とする請求項1に記載の劣化抑制制御システム。 The estimation unit is
Differentiating the charge/discharge curve that defines the relationship between the capacity and voltage of the secondary battery to generate a dV/dQ curve,
Estimating the rate of decrease in the surplus capacity of the positive electrode based on the rate of decrease in the distance between two peaks originating from the positive electrode of the dV / dQ curve,
2. The deterioration suppression control system according to claim 1, wherein the reduction rate of the surplus capacity of the negative electrode is estimated based on the reduction rate of the distance between two peaks originating from the negative electrode of the dV/dQ curve. - 前記二次電池の容量の減少率が閾値を超えたとき、
前記推定部は、前記正極の余剰容量の減少率と前記負極の余剰容量の減少率を推定し、
前記充放電制御部は、両者の関係をもとに前記充放電制御の切り替え制御を実行する請求項1に記載の劣化抑制制御システム。 When the rate of decrease in the capacity of the secondary battery exceeds a threshold,
The estimating unit estimates a decreasing rate of surplus capacity of the positive electrode and a decreasing rate of surplus capacity of the negative electrode,
The deterioration suppression control system according to claim 1, wherein the charge/discharge control section executes switching control of the charge/discharge control based on the relationship between the two. - 前記二次電池の正極の保存劣化特性、充電劣化特性、負極の保存劣化特性、充電劣化特性を保持する劣化特性保持部をさらに備え、
前記充放電制御部は、前記二次電池を充電する場合において、
前記正極の劣化抑制を優先した充放電制御を選択している場合、複数の充電プロファイル候補の内、前記正極の保存劣化特性と充電劣化特性を参照して、最も前記正極の劣化が少ない充電プロファイルを選択し、
前記負極の劣化抑制を優先した充放電制御を選択している場合、複数の充電プロファイル候補の内、前記負極の保存劣化特性と充電劣化特性を参照して、最も前記負極の劣化が少ない充電プロファイルを選択する請求項1に記載の劣化抑制制御システム。 further comprising a deterioration characteristic holding unit that holds storage deterioration characteristics, charge deterioration characteristics, negative electrode storage deterioration characteristics, and charge deterioration characteristics of the positive electrode of the secondary battery,
When charging the secondary battery, the charging/discharging control unit:
When charging/discharging control that prioritizes suppression of deterioration of the positive electrode is selected, a charging profile that causes the least deterioration of the positive electrode is selected by referring to storage deterioration characteristics and charging deterioration characteristics of the positive electrode among multiple charging profile candidates. Select
When charging and discharging control that prioritizes suppression of deterioration of the negative electrode is selected, a charging profile that causes the least deterioration of the negative electrode is selected by referring to storage deterioration characteristics and charge deterioration characteristics of the negative electrode among the plurality of charging profile candidates. The deterioration suppression control system according to claim 1, wherein the deterioration suppression control system selects the following. - 二次電池の電圧と電流を含む電池データを取得するステップと、
前記二次電池の電池データをもとに、初期の正極の余剰容量に対する現在の正極の余剰容量の減少率と、初期の負極の余剰容量に対する現在の負極の余剰容量の減少率を推定するステップと、
前記正極の余剰容量の減少率が前記負極の余剰容量の減少率より大きい場合、前記正極の劣化抑制を優先した充放電制御に切り替え、前記負極の余剰容量の減少率が前記正極の余剰容量の減少率より大きい場合、前記負極の劣化抑制を優先した充放電制御に切り替えるステップと、
を有することを特徴とする劣化抑制制御方法。 obtaining battery data including voltage and current of the secondary battery;
A step of estimating the rate of decrease in the current surplus capacity of the positive electrode relative to the initial surplus capacity of the positive electrode and the rate of decrease in the current surplus capacity of the negative electrode relative to the initial surplus capacity of the negative electrode based on the battery data of the secondary battery. and,
If the rate of decrease in the surplus capacity of the positive electrode is greater than the rate of decrease in the surplus capacity of the negative electrode, the charge/discharge control is switched to a mode that prioritizes suppression of deterioration of the positive electrode, and the rate of decrease in the surplus capacity of the negative electrode is greater than the rate of decrease in the surplus capacity of the negative electrode. If it is larger than the reduction rate, switching to charge/discharge control that prioritizes suppression of deterioration of the negative electrode;
A deterioration suppression control method characterized by having the following. - 二次電池の電圧と電流を含む電池データを取得する処理と、
前記二次電池の電池データをもとに、初期の正極の余剰容量に対する現在の正極の余剰容量の減少率と、初期の負極の余剰容量に対する現在の負極の余剰容量の減少率を推定する処理と、
前記正極の余剰容量の減少率が前記負極の余剰容量の減少率より大きい場合、前記正極の劣化抑制を優先した充放電制御に切り替え、前記負極の余剰容量の減少率が前記正極の余剰容量の減少率より大きい場合、前記負極の劣化抑制を優先した充放電制御に切り替える処理と、
をコンピュータに実行させることを特徴とする劣化抑制制御プログラム。 A process of acquiring battery data including voltage and current of the secondary battery;
A process of estimating the rate of decrease in the current surplus capacity of the positive electrode relative to the initial surplus capacity of the positive electrode and the rate of decrease in the current surplus capacity of the negative electrode relative to the initial surplus capacity of the negative electrode based on the battery data of the secondary battery. and,
If the rate of decrease in the surplus capacity of the positive electrode is greater than the rate of decrease in the surplus capacity of the negative electrode, the charge/discharge control is switched to a mode that prioritizes suppression of deterioration of the positive electrode, and the rate of decrease in the surplus capacity of the negative electrode is greater than the rate of decrease in the surplus capacity of the negative electrode. If it is larger than the reduction rate, switching to charge/discharge control that prioritizes suppression of deterioration of the negative electrode;
A deterioration suppression control program characterized by causing a computer to execute. - 請求項6の充電制御プログラムが記載された非一時的な記録媒体。 A non-temporary recording medium in which the charging control program according to claim 6 is recorded.
Applications Claiming Priority (2)
| Application Number | Priority Date | Filing Date | Title |
|---|---|---|---|
| JP2022-140794 | 2022-09-05 | ||
| JP2022140794 | 2022-09-05 |
Publications (1)
| Publication Number | Publication Date |
|---|---|
| WO2024053392A1 true WO2024053392A1 (en) | 2024-03-14 |
Family
ID=90191114
Family Applications (1)
| Application Number | Title | Priority Date | Filing Date |
|---|---|---|---|
| PCT/JP2023/030174 WO2024053392A1 (en) | 2022-09-05 | 2023-08-22 | Deterioration inhibition control system, deterioration inhibition control method and deterioration inhibition control program, and recording medium having deterioration inhibition control program described thereon |
Country Status (1)
| Country | Link |
|---|---|
| WO (1) | WO2024053392A1 (en) |
Citations (3)
| Publication number | Priority date | Publication date | Assignee | Title |
|---|---|---|---|---|
| JP2010249797A (en) * | 2009-03-26 | 2010-11-04 | Primearth Ev Energy Co Ltd | State determination device and control device of secondary battery |
| JP2018147827A (en) * | 2017-03-08 | 2018-09-20 | 株式会社東芝 | Charge and discharge control device, service condition creation device, program and power storage system |
| WO2022014280A1 (en) * | 2020-07-17 | 2022-01-20 | パナソニックIpマネジメント株式会社 | Information processing method, and charge control device |
-
2023
- 2023-08-22 WO PCT/JP2023/030174 patent/WO2024053392A1/en unknown
Patent Citations (3)
| Publication number | Priority date | Publication date | Assignee | Title |
|---|---|---|---|---|
| JP2010249797A (en) * | 2009-03-26 | 2010-11-04 | Primearth Ev Energy Co Ltd | State determination device and control device of secondary battery |
| JP2018147827A (en) * | 2017-03-08 | 2018-09-20 | 株式会社東芝 | Charge and discharge control device, service condition creation device, program and power storage system |
| WO2022014280A1 (en) * | 2020-07-17 | 2022-01-20 | パナソニックIpマネジメント株式会社 | Information processing method, and charge control device |
Similar Documents
| Publication | Publication Date | Title |
|---|---|---|
| US10036781B2 (en) | Method and apparatus for evaluating the state of health of a lithium battery | |
| CN103163480B (en) | The appraisal procedure of lithium battery health status | |
| CN107576918B (en) | Method and system for estimating residual electric quantity of lithium battery | |
| CN110221222B (en) | Battery safety cut-off voltage prediction method and device and battery management system | |
| US11292360B2 (en) | Battery equalization method and system, vehicle, storage medium, and electronic device | |
| CN103094633B (en) | A kind of detection for electric automobile power battery and maintenance system | |
| CN107402355B (en) | A kind of charging time predictor method | |
| CN110673039B (en) | Lithium iron phosphate battery SOC charging online correction method based on big data | |
| KR20180064220A (en) | Battery management apparatus and method thereof | |
| CN112622693A (en) | Battery management method and device and vehicle | |
| Hu et al. | Study on SOC estimation of lithium battery based on improved BP neural network | |
| Qiu et al. | Battery hysteresis modeling for state of charge estimation based on Extended Kalman Filter | |
| Shi et al. | Electric vehicle battery remaining charging time estimation considering charging accuracy and charging profile prediction | |
| CN107045104A (en) | A kind of On-line Estimation method of lithium titanate battery capacity | |
| JP6316754B2 (en) | Battery management device and power supply device | |
| Windarko et al. | LiPB battery SOC estimation using extended Kalman filter improved with variation of single dominant parameter | |
| CN114114038A (en) | Lithium battery SOC and available capacity joint estimation method under full-life and full-temperature conditions | |
| CN115512777A (en) | Electrochemical model parameter identification method and system based on capacity change rate | |
| Ramezani-al et al. | A novel combined online method for SOC estimation of a Li-Ion battery with practical and industrial considerations | |
| WO2024053392A1 (en) | Deterioration inhibition control system, deterioration inhibition control method and deterioration inhibition control program, and recording medium having deterioration inhibition control program described thereon | |
| CN114114051A (en) | Method and device for determining battery aging value and electronic equipment | |
| Xu et al. | Battery management system for electric drive vehicles: Modelling, state estimation and balancing | |
| CN110031772B (en) | Real-time estimation method for equivalent internal resistance of lithium ion battery | |
| CN109698526A (en) | A kind of safe lithium battery group balance realizing method | |
| CN108446494B (en) | Equalization algorithm for battery module or system |
Legal Events
| Date | Code | Title | Description |
|---|---|---|---|
| 121 | Ep: the epo has been informed by wipo that ep was designated in this application |
Ref document number: 23862931 Country of ref document: EP Kind code of ref document: A1 |