WO2023219082A1 - 接着状態の予測システム、接着状態の予測方法、接着状態の予測プログラム及び接着物の製造方法 - Google Patents
接着状態の予測システム、接着状態の予測方法、接着状態の予測プログラム及び接着物の製造方法 Download PDFInfo
- Publication number
- WO2023219082A1 WO2023219082A1 PCT/JP2023/017451 JP2023017451W WO2023219082A1 WO 2023219082 A1 WO2023219082 A1 WO 2023219082A1 JP 2023017451 W JP2023017451 W JP 2023017451W WO 2023219082 A1 WO2023219082 A1 WO 2023219082A1
- Authority
- WO
- WIPO (PCT)
- Prior art keywords
- adhesion state
- data
- state prediction
- prediction system
- acquired
- Prior art date
- Legal status (The legal status is an assumption and is not a legal conclusion. Google has not performed a legal analysis and makes no representation as to the accuracy of the status listed.)
- Ceased
Links
Images


Classifications
-
- G—PHYSICS
- G01—MEASURING; TESTING
- G01N—INVESTIGATING OR ANALYSING MATERIALS BY DETERMINING THEIR CHEMICAL OR PHYSICAL PROPERTIES
- G01N21/00—Investigating or analysing materials by the use of optical means, i.e. using sub-millimetre waves, infrared, visible or ultraviolet light
- G01N21/84—Systems specially adapted for particular applications
- G01N21/8422—Investigating thin films, e.g. matrix isolation method
-
- C—CHEMISTRY; METALLURGY
- C09—DYES; PAINTS; POLISHES; NATURAL RESINS; ADHESIVES; COMPOSITIONS NOT OTHERWISE PROVIDED FOR; APPLICATIONS OF MATERIALS NOT OTHERWISE PROVIDED FOR
- C09J—ADHESIVES; NON-MECHANICAL ASPECTS OF ADHESIVE PROCESSES IN GENERAL; ADHESIVE PROCESSES NOT PROVIDED FOR ELSEWHERE; USE OF MATERIALS AS ADHESIVES
- C09J201/00—Adhesives based on unspecified macromolecular compounds
-
- C—CHEMISTRY; METALLURGY
- C09—DYES; PAINTS; POLISHES; NATURAL RESINS; ADHESIVES; COMPOSITIONS NOT OTHERWISE PROVIDED FOR; APPLICATIONS OF MATERIALS NOT OTHERWISE PROVIDED FOR
- C09J—ADHESIVES; NON-MECHANICAL ASPECTS OF ADHESIVE PROCESSES IN GENERAL; ADHESIVE PROCESSES NOT PROVIDED FOR ELSEWHERE; USE OF MATERIALS AS ADHESIVES
- C09J5/00—Adhesive processes in general; Adhesive processes not provided for elsewhere, e.g. relating to primers
-
- G—PHYSICS
- G01—MEASURING; TESTING
- G01N—INVESTIGATING OR ANALYSING MATERIALS BY DETERMINING THEIR CHEMICAL OR PHYSICAL PROPERTIES
- G01N21/00—Investigating or analysing materials by the use of optical means, i.e. using sub-millimetre waves, infrared, visible or ultraviolet light
- G01N21/62—Systems in which the material investigated is excited whereby it emits light or causes a change in wavelength of the incident light
- G01N21/63—Systems in which the material investigated is excited whereby it emits light or causes a change in wavelength of the incident light optically excited
- G01N21/64—Fluorescence; Phosphorescence
- G01N21/6428—Measuring fluorescence of fluorescent products of reactions or of fluorochrome labelled reactive substances, e.g. measuring quenching effects, using measuring "optrodes"
-
- G—PHYSICS
- G01—MEASURING; TESTING
- G01N—INVESTIGATING OR ANALYSING MATERIALS BY DETERMINING THEIR CHEMICAL OR PHYSICAL PROPERTIES
- G01N21/00—Investigating or analysing materials by the use of optical means, i.e. using sub-millimetre waves, infrared, visible or ultraviolet light
- G01N21/84—Systems specially adapted for particular applications
- G01N21/88—Investigating the presence of flaws or contamination
- G01N21/8851—Scan or image signal processing specially adapted therefor, e.g. for scan signal adjustment, for detecting different kinds of defects, for compensating for structures, markings, edges
-
- G—PHYSICS
- G01—MEASURING; TESTING
- G01N—INVESTIGATING OR ANALYSING MATERIALS BY DETERMINING THEIR CHEMICAL OR PHYSICAL PROPERTIES
- G01N21/00—Investigating or analysing materials by the use of optical means, i.e. using sub-millimetre waves, infrared, visible or ultraviolet light
- G01N21/62—Systems in which the material investigated is excited whereby it emits light or causes a change in wavelength of the incident light
- G01N21/63—Systems in which the material investigated is excited whereby it emits light or causes a change in wavelength of the incident light optically excited
- G01N21/64—Fluorescence; Phosphorescence
- G01N21/6428—Measuring fluorescence of fluorescent products of reactions or of fluorochrome labelled reactive substances, e.g. measuring quenching effects, using measuring "optrodes"
- G01N2021/6439—Measuring fluorescence of fluorescent products of reactions or of fluorochrome labelled reactive substances, e.g. measuring quenching effects, using measuring "optrodes" with indicators, stains, dyes, tags, labels, marks
-
- G—PHYSICS
- G01—MEASURING; TESTING
- G01N—INVESTIGATING OR ANALYSING MATERIALS BY DETERMINING THEIR CHEMICAL OR PHYSICAL PROPERTIES
- G01N21/00—Investigating or analysing materials by the use of optical means, i.e. using sub-millimetre waves, infrared, visible or ultraviolet light
- G01N21/62—Systems in which the material investigated is excited whereby it emits light or causes a change in wavelength of the incident light
- G01N21/63—Systems in which the material investigated is excited whereby it emits light or causes a change in wavelength of the incident light optically excited
- G01N21/64—Fluorescence; Phosphorescence
- G01N21/645—Specially adapted constructive features of fluorimeters
- G01N21/6456—Spatial resolved fluorescence measurements; Imaging
Definitions
- the present invention relates to an adhesion state prediction system, an adhesion state prediction method, an adhesion state prediction program, and an adhesive manufacturing method.
- Section 9-4 of the SDGs states, ⁇ Improve sustainability by improving infrastructure and industry through improving resource use efficiency and expanding the introduction of clean and environmentally friendly technologies and industrial processes.'' As described above, there is an increasing need for technology that can reduce losses in manufacturing processes, improve product yield, and detect product defects in upstream processes.
- one of the causes of lower yields of various industrial products is the adhesion process.
- defective products produced during the bonding process generally cannot be returned to their original parts or products and must be discarded.
- Lithium-ion batteries which are the key to low-load electric vehicles, are required to have even higher durability from the perspective of ensuring safety, that is, highly accurate adhesive force prediction.
- the product development cycles are short and products are used by a large number of people, making the issue even more important.
- a step of irradiating ultraviolet rays to an ultraviolet curable resin containing a base resin and a photopolymerization initiator a step of detecting fluorescence emitted by the photopolymerization initiator upon receiving ultraviolet rays, and a step of ultraviolet curing based on the detected fluorescence.
- a method for estimating a cured state including a step of estimating the cured state of a resin is disclosed (for example, Patent Document 3).
- Patent Document 2 is only a limited technique that can be applied only to a specific material (synthetic resin cured by ring-opening polymerization) for a specific cause (salt adhesion).
- the data obtained was only data related to fluorescence, and was not multidimensional.
- the data regarding fluorescence intensity and its temporal change acquired in Patent Document 3 is local and does not include positional information in a two-dimensional space. Therefore, none of these methods could predict the occurrence of an abnormality in the adhesion state with high accuracy.
- the present invention has been made in view of these circumstances, and it is an object of the present invention to provide an adhesion state prediction system that can be applied to various adhesive materials and that can predict the adhesion state with high accuracy. Another object of the present invention is to provide a method for predicting an adhesive state, a program for predicting an adhesive state, and a method for manufacturing an adhesive.
- the adhesion state prediction system of the present invention is a system for predicting the adhesion state when an object having adhesive properties is adhered to an object to be adhered, and uses physical property value information on two-dimensional coordinates of the object.
- the present invention includes a data acquisition unit that acquires two or more pieces of data, and an adhesion state prediction unit that predicts the adhesion state between the object and the adherend using the two or more acquired data.
- the adhesion state prediction method of the present invention is a method for predicting the adhesion state when an object having adhesive properties is adhered to an adherend, and includes physical property value information on two-dimensional coordinates of the object.
- the method includes a step of acquiring two or more pieces of data, and a step of predicting an adhesion state between the object and the adherend using the acquired two or more pieces of data.
- the adhesion state prediction program of the present invention is a program for predicting the adhesion state when an object having adhesive properties is adhered to an object to be adhered.
- the method is for executing a step of acquiring two or more pieces of data including information, and a step of predicting an adhesion state between the object and the object to be adhered using the two or more pieces of the acquired data. .
- the method for producing an adhesive of the present invention includes a step of predicting the adhesion state between the target object and the adherend by performing the prediction method of the present invention on the target object having adhesive properties, and the predicted result. and adjusting processing conditions for the object based on the method.
- an adhesion state prediction system a prediction method, a prediction program that can be applied to various adhesive materials and that can predict the adhesion state with high accuracy, and a method for manufacturing an adhesive product using the same. can do.
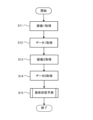
- FIG. 1 is a flowchart illustrating an example of an adhesion state prediction method according to an embodiment of the present invention.
- Figure 2A shows images taken with a normal camera at each temperature when the temperature of the object containing the contrast agent (1) was changed
- Figure 2B shows images taken with a hyperspectral camera at each temperature. This shows a spectrum obtained by averaging the spectra of a specific photographed area.
- Figure 3 shows the behavior of the ratio of the emission intensity at a wavelength of 488 nm and the emission intensity at a wavelength of 590 nm (F488/F590) obtained from the spectroscopic spectrum when the temperature of the target object is changed, and the elastic modulus ( It is a graph showing the behavior of (Log value).
- FIG. 1 is a flowchart illustrating an example of an adhesion state prediction method according to an embodiment of the present invention.
- Figure 2A shows images taken with a normal camera at each temperature when the temperature of the object containing the contrast agent (1) was changed
- Figure 2B shows images taken
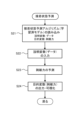
- FIG. 4 is a flowchart illustrating an example of the prediction process.
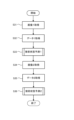
- FIG. 5 is a flowchart showing a method for predicting an adhesion state according to another embodiment of the present invention.
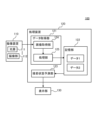
- FIG. 6 is a schematic diagram showing an example of the configuration of an adhesion state prediction system according to an embodiment of the present invention.
- FIG. 7 is a flowchart illustrating an example of a method for manufacturing an adhesive using a method for predicting an adhesive state according to an embodiment of the present invention.
- Adhesion state prediction method A method for predicting an adhesion state according to an embodiment of the present invention will be described first, and then a prediction system that can be used in the prediction method will be described.
- a method for predicting an adhesion state according to an embodiment of the present invention is a method for predicting the adhesion state when an object having adhesive properties is adhered to an adherend, for example, the quality of the final adhesion state.
- the object having adhesive properties is not particularly limited as long as it exhibits adhesive properties, and may be a thermocompression bonding material, an adhesive material, or a curable material.
- the thermocompression bonding material is a material that is melted and bonded by heat, and includes, for example, low-density polyethylene, ethylene/vinyl acetate copolymer, polypropylene, and the like.
- the adhesive material include acrylic, silicone, urethane, and rubber adhesives.
- curable materials include photocurable materials and thermosetting materials.
- the material constituting the adherend is not particularly limited, and may be any of glass, resin material, and metal material.
- FIG. 1 is a flowchart illustrating an example of a method for predicting an adhesion state according to an embodiment of the present invention.
- the adhesion state prediction method according to the present embodiment includes a step of acquiring two or more data including physical property value information on two-dimensional coordinates of the object (data acquisition step, steps S11 to S14). and a step (prediction step, step S15) of predicting the adhesion state between the object and the adherend using the two or more acquired data.
- Data acquisition process In the data acquisition step, two or more pieces of data including physical property value information on two-dimensional coordinates of the object are acquired.
- Data containing information on physical property values on two-dimensional coordinates refers to positional information on two-dimensional coordinates and information on physical property values corresponding to individual positions. This is data including physical property value information, that is, two-dimensional data of physical property value information.
- Physical property value information refers to the physical property value of an object or information related to it.
- the type of physical property information is not particularly limited as long as it is related to predicting the adhesion state. Examples include elastic modulus, degree of curing, hardness, film thickness, moisture content, residual solvent content, coating unevenness, and temperature.
- viscosity ⁇
- dynamic viscoelasticity storage modulus, loss modulus
- tan ⁇ surface tension
- density vapor pressure
- boiling point boiling point
- refractive index curing shrinkage
- glass transition temperature Tg
- SP value polar component (dP ), dispersion component (dD), hydrogen bond component (dH)
- molecular weight number average molecular weight Mn, weight average molecular weight Mw, polydispersity Mw/Mn
- molecular structure information functional group, chemical bond state, radical generation state
- the physical property value information is preferably elastic modulus, degree of curing, hardness, coating unevenness, polarity, moisture content, temperature, or film thickness.
- Most of these physical property value information can be associated with spectral characteristic information obtained from spectral data. Therefore, it is preferable that at least one of the two or more pieces of data includes spectral characteristic information.
- Data including such physical property value information can be obtained by acquiring two-dimensional coordinate information of the target object and being associated with the acquired two-dimensional coordinate information.
- the two-dimensional coordinate information and the physical property value information may be acquired separately or at the same time. When acquired simultaneously, it can be obtained directly or indirectly from the two-dimensional image.
- Examples of two-dimensional images include spectral images (multispectral images, hyperspectral images), reflectance distribution images, temperature distribution images, and the like.
- the two or more pieces of data may be data that includes predetermined physical property value information that is acquired over time, or may be data that is obtained about two or more different types of physical property value information.
- the data acquired over time may be acquired intermittently or continuously.
- the data acquired regarding two or more different types of physical property value information may be acquired at the same time or at different timings.
- the two or more pieces of data includes spectral property information of the object.
- the spectral characteristic information may be the emission intensity at a specific wavelength, the ratio of emission intensities, peak shift, reflectance, etc. obtained from spectral data. It is preferable that these spectral characteristic information be associated with one or more selected from the group consisting of elastic modulus, degree of curing, hardness, polarity, and water content.
- Data including such spectral characteristic information can be obtained from the state of light reflected and emitted from an object when the object is irradiated with light of a predetermined wavelength.
- data including spectral characteristic information may be acquired separately by linking two-dimensional coordinate information and information on light reflected and emitted from the corresponding object; or as a spectral image. They may be acquired at the same time.
- a spectral image can be acquired by a means capable of detecting light reflected and emitted from an object, such as a hyperspectral camera. In that case, it is preferable that the object has a light emission behavior that changes depending on its state.
- the “state of the object” means one piece of physical property value information of the object.
- the luminescence behavior changes refers to a change in one or more of the peak wavelength, intensity, spectrum, fluorescence lifetime, phosphorescence lifetime, etc. of the light reflected and emitted by the object.
- the light emitted by the object may be light emitted by the object itself, or may be fluorescence or phosphorescence generated by exciting a luminescent substance contained in the object.
- an absorbing/emitting substance contained in an object whose absorption/emitting behavior (wavelength and intensity) changes depending on the state of the object is particularly referred to as a "contrast agent.”
- the object contains a contrast agent.
- the contrast agent may be originally contained in the object, or may be added artificially afterwards. If the contrast agent is fluorescent or phosphorescent, it needs to be excited by known means to emit light, but the means are not limited to photoexcitation, current excitation, chemical excitation, thermal excitation, etc. Excitation etc. can be used.
- the contrast agent is preferably a material that is excited to emit light when irradiated with light of a predetermined wavelength, and more preferably a material that is excited and emits fluorescence when irradiated with light of a predetermined wavelength. .
- any known chromic dye can generally be used as long as it responds to the state desired to be observed.
- a chromic dye Adv. Mater. , 2013, 25, p378, JP 2012-172139, JP 2019-38973, etc., photochromic dyes, Acc. Chem. Res. , 2017, 50, p366, JP 2008-291210, WO 2020/171199, etc., solvatochromic dyes, JP 2019-31606, PCT International Publication No. 2015-533892, etc., thermochromic dyes, Chem. Soc. Rev. Electrochromic dyes described in Chem. Eur. J.
- the amount of contrast agent added may be within a range that does not affect adhesion and other required performances and that allows detection of the adhesion state, but is preferably 10 ppm to 1.0% by weight, more preferably It is 50 ppm to 0.5%, more preferably 100 ppm to 0.1%.
- contrast agent a compound whose luminescent behavior changes depending on the hardness of the object, and a compound whose luminescent behavior changes depending on the moisture content and polarity of the object will be exemplified and explained.
- Examples of compounds whose luminescence behavior changes depending on the hardness of the object include phenazine compounds such as contrast agent (1). It is known that when this compound becomes excited by light, it passes through two or more excited states and emits light at different wavelengths depending on whether the environment around the compound itself is an environment that facilitates structural relaxation. It is being The "environment that facilitates structural relaxation” here means that there is sufficient free volume around the contrast agent and it is easy to move, that sufficient thermal energy is available to facilitate molecular movement, and that the surrounding viscosity is low. It is a comprehensive expression of one or more of the following: or the fact that the surrounding area is not a solid but a liquid.
- a small free volume and a high viscosity can be translated into a high elastic modulus and a high degree of curing. That is, by observing the emission wavelength of the contrast agent (1), the hardness of the object, represented by the elastic modulus and degree of hardening, can be obtained.
- the structure of the contrast agent for visualizing such hardness is not particularly limited as long as it is a compound that can emit light from two or more different excited states depending on the surrounding environment. Such dyes are described in Chem. Sci. , 2020, 11, p7525 as a reference.
- the contrast agent (1) has a peak emission intensity near a wavelength of 488 nm under an environment in which structural relaxation is difficult, that is, when the target object has a high elastic modulus.
- the peak of the emission intensity is around a wavelength of 590 nm. Therefore, the ratio (F488/F590) of the emission intensity at a wavelength of 488 nm (F488) and the emission intensity at a wavelength of 590 nm (F590) changes depending on the elastic modulus of the object. That is, the ratio (F488/F590) of emission intensity (F590) as spectral characteristic information can be associated with the elastic modulus.
- FIG. 2A shows images taken with a normal camera at each temperature when the temperature of the object containing the contrast agent (1) was changed
- FIG. 2B shows images taken with a hyperspectral camera at each temperature. This shows a spectrum obtained by averaging the spectra of a specific photographed area.
- the horizontal axis indicates wavelength (nm)
- the vertical axis indicates emission intensity (-).
- Figure 3 shows the behavior of the ratio of the emission intensity at a wavelength of 488 nm and the emission intensity at a wavelength of 590 nm (F488/F590) obtained from the spectroscopic spectrum when the temperature of the target object is changed, and the elastic modulus ( It is a graph showing the behavior of (Log value).
- the horizontal axis shows the temperature (° C.) of the object
- the left vertical axis shows the ratio of emission intensity (F488/F590)
- the right vertical axis shows the Log value of the elastic modulus.
- FIG. 2A shows that as the temperature rises, the emission color changes from blue (around 23 to 70°C), pink (80 to 110°C), and orange (120 to 150°C).
- FIG. 2B it can be seen that as the temperature rises, the peak of the emission intensity shifts to the longer wavelength side. That is, as the temperature rises, the ratio of long wavelength components (red emitting components) to short wavelength components (blue emitting components) increases, that is, the ratio of the emitted light intensity at a wavelength of 488 nm to the emitted light intensity at a wavelength of 590 nm (F488 /F590) becomes smaller (see FIG. 3).
- examples of compounds whose luminescence behavior changes depending on the water content and polarity in the target object include solvatochromic dyes.
- Solvatochromic dyes are dyes whose emission wavelengths and absorption wavelengths change depending on the moisture content and polarity of surrounding objects and solvents. This is because the structure of the excited state of the dye is stabilized or destabilized depending on the type and composition of the solvent, and the energy difference from the ground state changes, so the emission wavelength corresponding to that energy difference changes. It is understood that In other words, by observing the emission wavelength, it is possible to indirectly visualize the type and composition of surrounding objects and solvents that stabilize or destabilize the contrast agent.
- contrast agent for visualizing water content and polarity is not particularly limited as long as it is a dye whose emission wavelength and absorption wavelength change depending on the water content and polarity of surrounding objects and solvents.
- contrast agents include, for example, squarylium dyes such as contrast agent (2).
- Such a dye can be synthesized with reference to the aforementioned WO2020/171199.
- the wavelength of the light (excitation light) irradiated onto the object is appropriately selected depending on the type of contrast agent, the type of object, and the like.
- the contrast agent is a compound that can be excited by visible light
- ultraviolet light ultraviolet light is used as the excitation light.
- the other one of the two or more pieces of data includes film thickness information. This is because these data are deeply related to the adhesion state, regardless of the type of object or adhesion method.
- an image (Image 1) is acquired by a hyperspectral camera while, for example, light of a predetermined wavelength is irradiated (Step S11). Then, data (data 1) including the ratio of luminescence intensity (F488/F590) associated with the elastic modulus is obtained from the image (step S12).
- a reflection spectrum image (image 2) is acquired using a reflection spectroscopic film thickness meter (step S13). Then, data (data 2) including the film thickness is obtained from the reflection spectrum image (step S14).
- the adhesion state between the object and the adherend is analyzed and predicted using two or more pieces of data acquired in the data acquisition step (steps S11 to S14).
- the accuracy of analysis and prediction can be improved by performing such analysis and prediction on two or more pieces of data instead of using a single piece of data.
- Analysis and prediction of the adhesion state can be performed by any method.
- the adhesion state of the object may be analyzed and predicted by comparing two or more pieces of data acquired over time regarding predetermined physical property value information.
- data is obtained in advance when the object is in a standard state (for example, when the adhesion state is good) or when it is in a predetermined state (for example, when the adhesion state is poor and peeling occurs). Then, by comparing these data with the data acquired in the data acquisition step, the adhesion state of the object may be analyzed and predicted. The time when a predetermined state is reached may be, for example, when the adhesion state is good or when poor adhesion occurs.
- the adhesion state may be analyzed and predicted based on a prediction model (learned model) generated in advance by machine learning.
- a prediction model (learned model) generated in advance by machine learning.
- the state of adhesion of the object can be determined based on the accumulated It can be determined (predicted) from data etc.
- FIG. 4 is a flowchart illustrating an example of the adhesion state prediction process (step S15 in FIG. 1).
- a process similar to the data acquisition process described above is performed multiple times. Then, multiple predictive models are constructed based on this. Then, by combining the results of the plurality of prediction models, a learned model (adhesion prediction state algorithm) that can predict information regarding the adhesion state of the object (for example, peeling force, etc.) is created.
- a learned model adheresion prediction state algorithm
- the above prediction model uses machine learning that uses two or more data as explanatory variables and a physical property that indicates the adhesion state of the object (e.g., peeling force) as the objective variable. It can be constructed by doing each.
- the explanatory variables the same data as the data acquired in the data acquisition step (S11 to S14) can be used.
- the objective variable can be selected as appropriate depending on the purpose of the analysis, and variables related to the adhesion state of the object (for example, peeling force, cross-cut test, pencil hardness test, etc.) can be used.
- Machine learning may be supervised learning or unsupervised learning.
- supervised learning refers to a learning method that learns the "relationship between input and output” from learning data with correct answer labels.
- Unsupervised learning refers to a learning method that learns the "structure of a data group" from training data without correct answer labels.
- machine learning may be reinforcement learning, deep learning, or deep reinforcement learning.
- reinforcement learning is a learning method that learns the "optimal sequence of actions" through trial and error.
- Deep learning is a learning method that uses large amounts of data to learn features contained in the data in a step-by-step manner. Deep reinforcement learning refers to a learning method that combines reinforcement learning and deep learning.
- Machine learning includes, for example, linear regression (multiple regression analysis, partial least squares (PLS) regression, LASSO regression, Ridge regression, principal component regression (PCR), etc.), random forest, decision tree, support vector machine (SVM), A prediction model constructed by an analysis method selected from support vector regression (SVR), neural network, discriminant analysis, etc. can be applied.
- linear regression multiple regression analysis, partial least squares (PLS) regression, LASSO regression, Ridge regression, principal component regression (PCR), etc.
- PLS partial least squares
- PCR principal component regression
- SVM support vector machine
- a prediction model constructed by an analysis method selected from support vector regression (SVR), neural network, discriminant analysis, etc. can be applied.
- the adhesion state prediction step the adhesion state is analyzed and predicted using the trained model created above.
- a trained model is read (step S21).
- a learning model of a regression equation is read.
- the explanatory variables of the regression equation are two or more pieces of data acquired in the data acquisition step, and the objective variable is peeling force.
- two or more data to be input as explanatory variables are extracted.
- the extracted data is then input to the explanatory variables of the regression equation of the learned model for each pixel (step S22).
- the peeling force is predicted for each pixel (step S23) and output as a target variable (step S24). This is performed for each of two or more pieces of data.
- the output peeling force for each pixel is plotted on two-dimensional coordinates (step S24). Then, it is divided into areas according to the level of peeling force, and each area is colored and visualized on two-dimensional coordinates. For example, areas where the peeling force exceeds a predetermined threshold are designated as NG areas (areas that cause poor adhesion), and areas that do not exceed the threshold are designated as OK areas (areas that do not cause poor adhesion), and are displayed in different colors. Thereby, it is possible to visualize and predict on the two-dimensional coordinates in which part of the object the adhesion failure will occur.
- NG areas areas that cause poor adhesion
- OK areas areas that do not cause poor adhesion
- HOG Heistograms of Oriented Gradients
- the “HOG feature amount” is a feature amount obtained by converting a local image gradient into a histogram. By acquiring the HOG feature amount, it is possible to detect the gradient of the peeling force and clarify its contour.
- the HOG feature amount can be calculated with reference to various known papers, Japanese Patent Application Publication No. 2018-36689, and the like. Further, the above-mentioned machine learning method can also be used for this boundary clarification algorithm.
- the result of actually measuring the peeling force is compared with the above predicted result.
- the compared results are then added to the training data of the learned model. Thereby, the prediction accuracy of the trained model can be further improved.
- the adhesion state can be predicted with higher accuracy.
- the adhesion state is predicted using two or more pieces of data in the prediction process (step S15).
- the present invention is not limited to this, and the prediction step may be performed each time one or more pieces of data are acquired.
- FIG. 5 is a flowchart showing a method for predicting an adhesion state according to another embodiment of the present invention.
- a spectral image image 1 is acquired (step S31), and data (data 1) including the ratio of emission intensity (F488/F590) associated with the elastic modulus is acquired from there (step S32).
- an adhesion state prediction step step S33
- a reflection spectrum image image 2 is acquired (step S34), and data (data 2) including the film thickness is acquired therefrom (step S35).
- an adhesion state prediction step step S36 is performed. In this way, the prediction step may be performed every time one or more pieces of data are acquired.
- steps S31, S32, S34, and S35 in FIG. 5 correspond to steps S11, S12, S13, and S14 in FIG. 1, respectively. Further, the combination of steps S33 and S36 in FIG. 5 corresponds to step S15 in FIG.
- data including the ratio of emitted light intensity or elastic modulus and data including film thickness are acquired as two or more data, but the data is not limited to this, and the type of object and the What is necessary is to obtain a suitable one depending on the type of attachment and the adhesion method.
- Adhesion state prediction system The adhesion state prediction method according to the present embodiment can be performed by the following adhesion state prediction system. Note that the system for performing the adhesion state prediction method is not limited to the following system.
- FIG. 6 is a schematic diagram showing the configuration of the adhesion state prediction system 100 according to the present embodiment.
- the prediction system 100 includes an imaging device 110, a processing device 120, and a display unit 130.
- the imaging device 110 captures an image showing the light emitting state of the object when it is irradiated with light.
- the imaging device 110 includes a light source 111 and an imaging section 112.
- the light source 111 is not particularly limited as long as it is a means that can irradiate light of a predetermined wavelength onto an object.
- a lamp with a wide range of wavelengths can be applied, and examples thereof include light sources in the ultraviolet, visible, near-infrared, and infrared regions. Examples include xenon lamps, halogen lamps, white LED lamps, near-infrared hyperspectral imaging lighting (such as LDL-222X42CIR-LACL manufactured by CCS Corporation), and laser-excited white light sources that can emit light in the deep ultraviolet to near-infrared wavelength range. (XWS-65 manufactured by KLV, etc.) etc. can be used.
- a light source that includes ultraviolet light is preferred, and when an infrared dye or the like is used, a light source that includes infrared light is preferred.
- a light source with a sharp waveform such as an LED light source, is preferable because it can emphasize the spectrum unique to the contrast agent.
- the shape of the light source may be a normal point light source, but when installing it on a production line, etc., it is preferable to use line lighting (high-intensity condensing line lighting manufactured by CCS Corporation, LDL-222X42CIR-LACL, etc.). .
- the imaging unit 112 is not particularly limited as long as it can capture the state of the light reflected or emitted by the object upon receiving the light from the light source 111, and is appropriately selected according to the type of data to be acquired.
- the imaging device 110 may be a monochrome camera, a color camera, an infrared camera, a multispectral camera, a hyperspectral camera, or the like.
- the image captured by the imaging device 110 is output to the data acquisition unit 121.
- Multispectral cameras and hyperspectral cameras are cameras that can take images at more wavelengths than regular cameras, and have high spectral and spatial resolution, so they can measure multiple objects in one measurement. This method is preferable because it allows quantitative evaluation over a wide range of points.
- the wavelength resolution is 50 nm or less, more preferably 10 nm or less, even more preferably 5 nm or less.
- area type snapshot type
- line type is preferred. Hyperspectral cameras that can measure the visible light range include Specim's Specim IQ and FX-10, Eva Japan's NH series, etc. Hyperspectral cameras that can measure near-infrared range include Specim's FX-17 and SW.
- hyperspectral cameras that can measure the mid-infrared region.
- hyperspectral cameras that can measure far-infrared regions include Specim's FX-50 and MW-IR, but they are not limited to Specim's LW-IR.
- the processing device 120 uses a data acquisition unit 121 that acquires two or more data of the target object from the image, a storage unit 122 that stores the acquired two or more data, and a data acquisition unit 122 that uses the acquired two or more data to determine the target object. and an adhesion state prediction unit 123 that predicts the adhesion state of the adherend.
- the data acquisition unit 121 performs the data acquisition process described above. That is, two-dimensional coordinate information and physical property value information linked thereto are acquired.
- the data acquisition unit 121 includes an image acquisition unit 124 that acquires an image captured by the imaging device 110, and an image acquisition unit 124 that acquires two or more of the above data (data including physical property value information on two-dimensional coordinates) from the image. It has a processing section 125.
- the image acquisition unit 124 may be any means that can acquire images captured by the imaging device 110 or images captured by an external device (not shown).
- the processing unit 125 may be any means that can acquire data of the object from the image acquired by the image acquisition unit 124.
- the processing unit 125 can acquire data including the emission intensity ratio (F488/F590) from the spectral image acquired by the image acquisition unit 124.
- the processing unit 125 may not be necessary, or the processing by the processing unit 125 may not be performed.
- temperature information can be directly obtained from a temperature distribution image obtained by infrared thermography, processing by the processing unit 125 is not necessary.
- film thickness information can be directly obtained from the reflection spectrum data obtained by the reflection spectroscopic film thickness meter, processing by the processing unit 125 is not necessary.
- the storage unit 122 may be any means that can store two or more pieces of data acquired by the processing unit 125.
- the adhesion state prediction unit 123 performs the above prediction process.
- the adhesion state prediction unit 123 may be any means that can analyze the data obtained by the data acquisition unit 121 (for example, the processing unit 125). For example, data including separately acquired reference physical property value information is read out, and the reference data is compared with data obtained from the data acquisition unit 121 (for example, the processing unit 125) to analyze and analyze the adhesion state. You can predict it. Further, the adhesion state prediction unit 123 may predict the adhesion state based on the learned model. Specifically, the adhesion state prediction unit 123 reads the trained model from the storage unit 122 or an external storage device (not shown), and applies the learned model to the data acquisition unit 121 (for example, the processing unit 125). You may input the obtained data and perform calculations. Then, the calculation result, that is, the predicted result of the adhesion state is output.
- the processing device 120 includes storage means such as a hard disk drive (HDD), solid state drive (SSD), and read-only memory (ROM) for storing programs, data, etc., and a central processing unit (120) that performs program execution, calculation processing, etc.
- storage means such as a hard disk drive (HDD), solid state drive (SSD), and read-only memory (ROM) for storing programs, data, etc.
- ROM read-only memory
- a general computer general-purpose computer equipped with a CPU (CPU) can be used. Further, the computer may further include input means such as a keyboard and mouse, and output means such as a monitor and a printer.
- the display section 130 may be any means that can display the results predicted by the adhesion state prediction section 123.
- the display unit 130 may be an output means such as a monitor or a printer.
- the display unit 130 may be configured integrally with the processing device 120.
- the prediction system 100 includes a data acquisition unit 121 that acquires two or more pieces of data about an object, and an adhesive that predicts the adhesion state of the object using the two or more acquired data. It has a state prediction unit 123. As a result, it is possible to perform a multidimensional analysis compared to the conventional method, thereby improving prediction accuracy.
- the prediction system 100 has the imaging device 110, but the prediction system 100 does not need to have the imaging device 110.
- the prediction system 100 may be configured such that the image acquisition unit 124 reads an image showing a light emission state that is separately acquired by an external imaging device (not shown).
- the data acquisition unit includes the image acquisition unit 124 that simultaneously acquires two-dimensional coordinate information and physical property value information, but the present invention is not limited to this. It may be a two-dimensional coordinate information acquisition unit that separately acquires the associated physical property value information.
- the prediction system 100 has the storage unit 122 in the above embodiment, it does not need to have the storage unit 122.
- the prediction system 100 may be configured such that two or more pieces of data acquired by the processing unit 125 can be input directly from the processing unit 125 to the adhesion state prediction unit 123, or an external storage device (not shown) may be configured. It may be configured so that it can be read from
- the prediction system 100 has the display unit 130, but the display unit 130 may not be provided, and the output from the adhesion state prediction unit 123 is displayed on an external display device (not shown). You may also display the results.
- Adhesion state prediction program The adhesion state prediction method according to the present embodiment can be performed by the following adhesion state prediction program.
- the program for predicting the adhesion state causes the computer to execute the data acquisition step (for example, steps S11 to S14 in FIG. 1) and the adhesion state prediction step (for example, step S15 in FIG. 1).
- the contents of each step of the prediction program are the same as the contents of each step of the prediction method.
- the prediction program may be provided stored in a recording medium such as a DVD or a USB memory, or may be stored in a server device on the network so as to be downloadable via the network.
- Adhesive manufacturing method (Embodiment 1)
- the method for predicting the adhesion state described above can be applied to manufacturing processes for various devices and their members. Examples of devices and their components include displays, polarizing plates, touch panels, optical films, and the like.
- the above adhesion state prediction method can be applied, for example, to a step of bonding two adherends together via a thermocompression bonding film in a device manufacturing method.
- FIG. 7 is a flowchart illustrating an example of the adhesive manufacturing method according to the present embodiment.
- a step of preparing a thermocompression bonding film (object) preparation step, step S41
- a heat treatment to melt the thermocompression bonding film heat treatment step, step S42
- data including physical property value information is acquired for the heat-melted thermocompression bonding film (step S43)
- the thermocompression bonding film when the heat-melting thermocompression bonding film is bonded to a glass film (adherent) is obtained.
- /Predict the adhesion state of the glass film interface asdhesion state prediction step, step S44).
- step S45 the predicted result of the adhesion state is visualized (visualization step, step S45), and it is determined whether or not peeling will occur (determination step, step S46). If it is determined that no peeling occurs, the adhesive is bonded to a glass film to obtain an adhesive (bonding process, step S47). On the other hand, if it is determined that peeling occurs, the heat treatment conditions are reviewed (adjustment step, step S48), and the heat treatment step is performed again (heat treatment step, step S42). Each step will be explained below.
- thermocompression bonding film is prepared.
- the thermocompression bonding film may be prepared by applying a thermocompression bonding material onto a base material such as a resin film, or may be prepared by applying a thermocompression bonding material onto a base material in advance.
- the method of applying the thermocompression bonding material onto the base material is not particularly limited, and may be a coating method or a melt extrusion method.
- a resin film is used as the base material, but other base materials may be used depending on the purpose.
- the thermocompression bonding film preferably contains a contrast agent suitable for acquiring data including elastic modulus (for example, the above-mentioned contrast agent (1), excitation wavelength 365 nm).
- a contrast agent suitable for acquiring data including elastic modulus for example, the above-mentioned contrast agent (1), excitation wavelength 365 nm.
- thermocompression film is heat-treated. This heats and melts the thermocompression bonding film, making it easy to bond.
- the heating temperature may be, for example, near the glass transition temperature Tg of the thermocompression film.
- Adhesion state prediction process (steps S43 to S44) Next, the method for predicting the adhesion state of the present invention is carried out.
- a method for predicting an adhesion state is carried out according to the procedure shown in FIG.
- an image (Image 1) showing a light emitting state when a heated and melted thermocompression film is irradiated with light having an excitation wavelength of 365 nm is acquired using a hyperspectral camera. Then, data (data 1) including the ratio of luminescence intensity (F488/F590) associated with the elastic modulus is acquired. Spectroscopic images may be acquired multiple times over time. Further, reflection spectrum data (image 2) of the thermocompression-bonded film that has been heated and melted is acquired using a reflection spectroscopic film thickness meter, and data including the film thickness (data 2) is acquired.
- the reason for acquiring data including film thickness is that the film thickness of the adhesive layer is one of the important factors that determines adhesive strength.
- a temperature distribution image (image 3) of the heated and melted thermocompression bonded film is acquired by infrared thermography, and temperature data (data 3) is acquired (step S43).
- the reason for acquiring temperature data is as follows. For example, if the fluidity of the adhesive visualized with contrast agent (1) is not as expected, and the film thickness is as expected, the temperature may not be high enough or the temperature distribution may be uneven. This is thought to be the cause. Therefore, temperature is important information in understanding why the predicted results of the adhesion state are as they are.
- step S44 using the acquired data 1, 2, and 3, the adhesion state of the thermocompression film/glass film interface when the glass films (adherends) are bonded is predicted (step S44).
- the above data 1, 2, and 3 are input as the explanatory variables of the trained model, and the peeling force is output as the objective variable. Specifically, the peeling force is output for each position on two-dimensional coordinates.
- step S45 Next, the results output in the adhesion state prediction step are visualized.
- the visualization method is not particularly limited, but for example, for each position on two-dimensional coordinates, parts where the peeling force exceeds the threshold (peeling force NG area) and parts where it does not exceed the threshold (peeling force OK area) are displayed in different colors. Thereby, the adhesion state between the thermocompression film and the glass film after the bonding process (including after the end of the durability test) can be predicted in advance.
- step S46 Judgment process
- the determination method is not particularly limited, and can be performed, for example, by comparing with already acquired data. If it is determined in the determination step that no peeling occurs, a bonding step (step S47) is performed. On the other hand, if it is determined that peeling occurs, an adjustment step (step S48) is performed.
- step S47 Bonding process (step S47) If it is determined that no peeling occurs in the above determination step, a glass film is bonded to the heated and melted thermocompression bonded film. Thereby, a bonded product of a thermocompression film and a glass film (a bonded product in which a resin film and a glass film are bonded via a thermocompression bonding material) can be obtained.
- step S48 Adjustment process If it is determined that peeling occurs in the determination step, the heat treatment conditions in the heat treatment step (step S42) are adjusted. For example, the heating temperature and time are set based on the distribution of peeling force. Then, the process returns to the heat treatment process (step S42), and heat treatment is performed again under the conditions set in the adjustment process (step S42). This process is repeated until no peeling force NG areas are detected in the determination process.
- the method for manufacturing an adhesive applies the adhesion state prediction method of the present invention to a thermocompression bonded film (object having adhesive properties), and
- the method includes a step of predicting the adhesion state between the thermocompression film and the glass film when they are bonded together, and a step of adjusting processing conditions for the object based on the prediction result.
- the adhesion state between the thermocompression bonding film and the adherend is predicted, but the present invention is not limited thereto.
- the adhesion state between a curable material or an adhesive material and an adherend may be predicted. Therefore, the heat treatment step (step S42) of the above embodiment may be any step that is appropriate for the type of object.
- the treatment step may be a light irradiation step.
- the adhesion state prediction method of the present invention can be applied, for example, to the process of forming an insulating protective layer such as a solder resist for circuit protection on the surface of a printed wiring board in a method of manufacturing wiring boards such as printed wiring boards. can.
- solder resist forming process first, a photocurable material is coated onto the printed wiring board (coating process). Next, the obtained coating film is irradiated with light to be cured (curing step). Thereby, a solder resist containing a cured product of the photocurable material is formed on the surface of the printed wiring board.
- a photocurable material usually contains a photocurable compound and a photopolymerization initiator.
- the photo-curable compound is preferably a radical-curable compound.
- the photocurable material is a contrast agent suitable for acquiring data including hardness (e.g., the above-mentioned contrast agent (1), excitation wavelength 365 nm) or a contrast agent suitable for acquiring data including polarity (e.g. It is preferable to further include the contrast agent (2) (excitation wavelength: 660 nm).
- contrast agent (1) that can visualize the hardness
- the hardness must be within an appropriate range in order for the photocurable material to maintain sufficient adhesion even in post-processes (developing process, soldering process, etc.). This is because hardness is effective information for predicting the adhesive state.
- Contrast agent (1) is preferable because it allows visualization of not only the hardness but also whether the degree of curing is within an appropriate range, that is, whether the curing reaction is complete.
- contrast agent (2) that can visualize polarity is that the electronic physical properties such as polarity caused by the functional groups of monomers contained in the photocurable material are sensitive to adherends such as printed wiring boards. This is because it is one of the important factors that affect adhesiveness.
- a spectral image (Image 1) showing the light emission state when the coating film is irradiated with light having an excitation wavelength of 660 nm is acquired using a hyperspectral camera. Then, it is possible to obtain the ratio (F800/F750) (data 1) of the emission intensity at a wavelength of 800 nm to the emission intensity at a wavelength of 750 nm, which is associated with the polarity.
- a spectral image (image 2) showing the light emission state when the coating film is irradiated with light with an excitation wavelength of 365 nm is acquired using a hyperspectral camera. Then, data (data 2) including the ratio of the emission intensity at a wavelength of 430 nm to the emission intensity at a wavelength of 600 nm (F430/F600), which is associated with hardness, is acquired.
- the adhesion state prediction process is performed at respective timings after the coating process and after the curing process. Thereby, it is possible to predict in advance the final state of adhesion of the cured product of the photocurable material (including after the end of the durability test), that is, the solder resist to the printed wiring board.
- the method for predicting the adhesion state of the present invention can be applied, for example, to a method for manufacturing a hard coat film.
- Hard coat films are used, for example, as base materials for flexible displays such as organic EL displays, and as barrier films to prevent moisture permeation. and a hard coat layer.
- a photocurable material is coated onto a resin film (coating process).
- the applied photocurable material is irradiated with light and cured (curing step).
- a hard coat layer containing a cured product of the photocurable material is formed.
- the photocurable material may contain a photocurable compound and a photopolymerization initiator, as described above.
- the photo-curable compound is preferably a radical-curable compound.
- the photocurable material further includes a contrast agent (for example, the above-mentioned contrast agent (1), excitation wavelength 365 nm) suitable for acquiring data including the degree of curing.
- a spectral image (Image 1) showing the light emission state when the coating film is irradiated with light with an excitation wavelength of 365 nm is acquired using a hyperspectral camera.
- data (data 1) including the emission intensity at a wavelength of 600 nm, which is associated with coating unevenness, is obtained. That is, in order for the hard coat layer to adhere to the resin film with sufficient adhesive force, it is a prerequisite that the hard coat layer is uniformly formed. Therefore, the contrast agent (1) can be used to visualize whether the amount and distribution of the coating film is within an appropriate range (whether uneven coating is suppressed to a certain level), that is, whether the minimum requirements for adhesion are met.
- the first step of predicting the adhesion state which will be described later, can be performed. If adhesion abnormalities can be predicted at an early stage of the process by dividing and executing the prediction of the adhesion state step by step in this way, it is preferable because it will save time and reduce losses.
- a spectral image (image 2) showing the light emission state when the coating film is irradiated with light with an excitation wavelength of 365 nm is acquired using a hyperspectral camera.
- data (data 2) including the ratio of emission intensity (F430/F600) associated with the degree of curing is obtained.
- reflection spectrum data (image 3) of the coating film is acquired using a reflection spectroscopic film thickness meter.
- data including the film thickness (data 3) is obtained.
- film thickness information is an important factor in predicting the adhesion state, and is preferably acquired in order to improve prediction accuracy.
- an adhesion state prediction step is performed after the coating step (adhesion state prediction 1 in FIG. 5, step S33). Thereby, the adhesion state of the hard coat layer to the resin film after the coating process can be predicted. Furthermore, using the acquired data 2 and data 3, an adhesion state prediction step is performed after the curing step (adhesion state prediction 2, step S33 in FIG. 5). Thereby, the final adhesion state of the hard coat layer to the resin film can be predicted.
- the adhesion state prediction method of the present invention can also be used, for example, to evaluate adhesive films in adhesive film manufacturing methods. Specifically, after applying and forming an adhesive material on a resin film (base material) (coating process), the applied adhesive material is dried (drying process). Then, the obtained adhesive film is evaluated.
- the adhesive material contains an adhesive as a main ingredient.
- the adhesive material is a contrast agent suitable for acquiring data including coating unevenness (for example, the above-mentioned contrast agent (1), excitation wavelength 365 nm) or a contrast agent suitable for acquiring data including the amount of residual solvent (
- whether the adhesive material layer formed on the resin film can exert sufficient adhesion to the adherend depends on whether the adhesive material layer is uniformly formed within an appropriate thickness range. . Therefore, it is preferable to include a contrast agent (1) that can visualize coating unevenness, and it is also preferable to acquire film thickness data.
- a contrast agent (2) that can visualize the amount of residual solvent.
- a spectral image (Image 1) showing the light emission state when the coating film is irradiated with light with an excitation wavelength of 365 nm is acquired using a hyperspectral camera.
- data (data 1) including the emission intensity at a wavelength of 600 nm, which is associated with coating unevenness is obtained.
- reflection spectrum data (image 2) of the coating film is acquired using a film thickness reflection spectrometer.
- data including the film thickness (data 2) is obtained.
- a spectral image (image 3) showing the luminescence state when the coating film is irradiated with light with an excitation wavelength of 660 nm is acquired using a hyperspectral camera.
- data (data 3) including the emission peak shift (F750 to 800) associated with the amount of residual solvent is obtained.
- a polarizing plate includes a polarizer, a transparent resin film, and a cured product of a photocurable material disposed between them.
- a process of coating a photocurable material on a polarizer is performed.
- a translucent resin film is laminated onto the applied photocurable material (lamination step).
- the bonded resin films are irradiated with light to harden the photocurable material (curing step).
- a polarizing plate can be manufactured.
- the photocurable material includes a photocurable compound and a photopolymerization initiator, as described above.
- the photocurable compound is preferably a cationically curable compound.
- the photocurable material is a contrast agent suitable for acquiring data including the degree of curing (for example, the above-mentioned contrast agent (1), excitation wavelength 365 nm), and a contrast agent suitable for acquiring data including water content. (For example, the above-mentioned contrast agent (2), excitation wavelength 660 nm) is preferably further included.
- contrast agent (2) that can visualize the amount of water is that the water contained in the cationic curable compound can be a factor in inhibiting curing, which is important in understanding the causes of insufficient curing. This is because it may serve as information.
- a contrast agent (1) that can visualize the degree of curing, since it can be determined whether the degree of curing is within an appropriate range, that is, whether the curing reaction has been completed. In this way, the reason for visualizing that the curing reaction is completed at an appropriate level is that if the curing is insufficient, it will not be possible to obtain the desired adhesive strength, so the degree of curing is effective in predicting the state of adhesion. This is because it is important information.
- a spectral image (Image 1) showing the light emission state when the coating film is irradiated with light with an excitation wavelength of 365 nm is acquired using a hyperspectral camera. Then, data (data 1) including the ratio of the emission intensity at a wavelength of 430 nm to the emission intensity at a wavelength of 600 nm (F430/F600), which is associated with the degree of curing, is acquired.
- a spectral image (image 2) showing the light emitting state when the cured product is irradiated with light with an excitation wavelength of 660 nm is acquired using a hyperspectral camera. Then, data (data 2) including the luminescence peak shift (F750 to 800), which is linked to the moisture content, is obtained.
- Embodiment 6 In the method for predicting the adhesion state of a solder resist to a printed wiring board described in Embodiment 2, near-infrared reflection spectra (for example, 1000 nm to 2700 nm) of the photocurable material before and after curing are obtained using a hyperspectral camera. It is possible to predict the adhesion state.
- near-infrared reflection spectra for example, 1000 nm to 2700 nm
- a spectral image (image 1) showing a near-infrared absorption spectrum when the coating film is irradiated with light from a halogen lamp as a light source is acquired using a hyperspectral camera.
- data (data 1) associated with the molecular structure information of the photocurable material before curing is acquired.
- a spectral image (image 2) showing a near-infrared absorption spectrum when the coating film is irradiated with halogen lamp light as a light source is acquired using a hyperspectral camera.
- data (data 2) linked to the molecular structure information of the photocurable material after curing is acquired.
- Infrared light is absorbed by the vibrations and rotational motion of molecules, and its energy varies depending on the chemical structure. Therefore, by measuring infrared light, information about the chemical structure and state of molecules can be obtained.
- data 1 and data 2 can be obtained as a near-infrared absorption spectrum (for example, absorbance at a specific wavelength within a wavelength range of 1000 to 2700 nm) from reflected light obtained by a hyperspectral camera.
- data 3 linked to the degree of hardening can be obtained from the difference between data 1 and data 2, that is, (data 1) - (data 2).
- Data 3 which is the difference spectrum between the near-infrared absorption spectra before and after curing, obtained in this way reflects changes in the chemical structure and molecular state due to curing of the photocurable material, so it cannot be linked to the degree of curing. I can do it.
- an adhesion state prediction system that can be applied to various adhesive materials and that can predict the adhesion state with high accuracy.
- defective adhesion and the like can be detected in advance in real time in various manufacturing processes, so that manufacturing efficiency can be improved.
- the present invention can be applied not only to in-line defect detection (process control) in the manufacturing process and quality control of final products, but also to preliminary studies such as material search, prescription study, and process condition study (laboratory study, prototype study, etc.). ) can also be effectively applied.
- Prediction System 110 Imaging Device 111 Light Source 112 Imaging Unit 120 Processing Device 121 Data Acquisition Unit 122 Storage Unit 123 Adhesion State Prediction Unit 124 Image Acquisition Unit 125 Processing Unit 130 Display Unit
Landscapes
- Health & Medical Sciences (AREA)
- Chemical & Material Sciences (AREA)
- Physics & Mathematics (AREA)
- Immunology (AREA)
- Biochemistry (AREA)
- Analytical Chemistry (AREA)
- Life Sciences & Earth Sciences (AREA)
- General Health & Medical Sciences (AREA)
- General Physics & Mathematics (AREA)
- Pathology (AREA)
- Nuclear Medicine, Radiotherapy & Molecular Imaging (AREA)
- Organic Chemistry (AREA)
- Chemical Kinetics & Catalysis (AREA)
- Optics & Photonics (AREA)
- Engineering & Computer Science (AREA)
- Mathematical Physics (AREA)
- Computer Vision & Pattern Recognition (AREA)
- Signal Processing (AREA)
- Investigating, Analyzing Materials By Fluorescence Or Luminescence (AREA)
Abstract
Description
本発明の一実施形態に係る接着状態の予測方法について、先に説明し、その後、当該予測方法に使用可能な予測システムを説明する。
データ取得工程では、対象物の2次元座標上の物性値情報を含むデータを、2以上取得する。
ここで、対象物に含まれる吸収・発光物質であり、対象物の状態に応じて吸収・発光挙動(波長及び強度)が変化するものを特に「造影剤」と呼ぶ。
また、造影剤の添加量は、接着および他の要求性能に影響のない範囲かつ接着状態の検出が可能な量であればよいが、好ましくは重量比で10ppm~1.0%、より好ましくは50ppm~0.5%、さらに好ましくは100ppm~0.1%である。
自由体積が小さいことや粘度が高い状態は、樹脂で言うと弾性率が高いことや硬化度が高いことと言い換えられる。すなわち、造影剤(1)の発光波長を観察することで、弾性率や硬化度に代表される、対象物の硬さを取得することができる。
このような硬さを可視化する造影剤としては、周囲の環境によって2以上の異なる励起状態から発光することが可能な化合物であれば、特に構造は限定されない。
予測工程(ステップS15)では、データ取得工程(ステップS11~S14)で取得した2以上のデータを用いて、対象物と被接着体との接着状態を解析し、予測する。このような解析及び予測を、単独のデータを用いて行うのではなく、2以上のデータについて行うことで、解析及び予測の精度を高めることができる。
「HOG特徴量」とは、局所的な画像勾配をヒストグラム化した特徴量である。HOG特徴量を取得することにより、剥離力の勾配を検出し、その輪郭を明確化することができる。HOG特徴量は、各種公知の論文及び特開2018-36689号公報等を参考として算出することができる。また、この境界明確化のアルゴリズムに対しても前記の機械学習法を使用することができる。
従来は、単独のデータを取得し、当該取得したデータから、対象物の接着状態を予測するものであった。そのため、予測精度が十分ではなかった。
次いで、反射スペクトル画像(画像2)を取得し(ステップS34)、そこから膜厚を含むデータ(データ2)を取得する(ステップS35)。そして、取得したデータを用いて、接着状態予測工程(ステップS36)を行う。このように、1又は2以上のデータを取得するごとに予測工程を行ってもよい。
本実施形態に係る接着状態の予測方法は、以下の接着状態の予測システムによって行うことができる。なお、接着状態の予測方法を行うためのシステムは、以下のシステムに制限されない。
撮像装置110は、光が照射されたときの対象物の発光状態を示す画像を撮像する。撮像装置110は、光源111と、撮像部112とを有する。
なお、マルチスペクトルカメラおよびハイパースペクトルカメラは、通常のカメラよりも多数の波長において撮影が可能なカメラであり、高いスペクトル分解能と空間分解能を持つカメラであるため、対象物を一回の測定で多点・広範囲かつに定量的に評価することが可能であるため好ましい。好ましくは波長分解能が50nm以下、より好ましくは10nm以下、さらに好ましくは5nm以下である。但し、必要以上に解像度を高くすると、データ処理量が多くなりデータ処理部への負荷・処理時間が増大してしまうため、必要最小限の分解能とすることが好ましい。
また、マルチスペクトルカメラおよびハイパースペクトルカメラには、エリア型(スナップショット型)とライン型があり、部材/個別の形態を観察する際にはエリア型が、ロール形状のものを観察する際にはライン型が好ましい。
可視光域を測定可能なハイパースペクトルカメラとしては、Specim社のSpecimIQ、FX-10、エバジャパン社NHシリーズ等、近赤外域を測定可能なハイパースペクトルカメラとしては、Specim社のFX-17、SW-IR、Resonon社のPikaNIR-320、HySpex社のSWIR-640、Imec社のSNAPSCAN-SWIR、エバジャパン社のSIS-IRシリーズおよびSIS-SWIRシリーズ等、中赤外域を測定可能なハイパースペクトルカメラとしては、Specim社のFX-50、MW-IR等、遠赤外域を測定可能なハイパースペクトルカメラとしては、Specim社のLW-IR等、を挙げることができるが、これらに限らない。
処理装置120は、上記画像から、対象物のデータを2以上取得するデータ取得部121と、取得した2以上のデータを記憶する記憶部122と、取得した2以上のデータを用いて、対象物と被接着体の接着状態を予測する接着状態予測部123とを有する。
表示部130は、接着状態予測部123により予測した結果を表示可能な手段であればよい。表示部130は、モニタやプリンタ等の出力手段でありうる。表示部130は、処理装置120と一体に構成されたものでもよい。
本実施形態に係る予測システム100は、上記の通り、対象物について2以上のデータを取得するデータ取得部121と、当該取得した2以上のデータを用いて、対象物の接着状態を予測する接着状態予測部123とを有する。それにより、従来と比べて、多元的に解析することができるため、予測精度を高めることができる。
本実施形態に係る接着状態の予測方法は、以下の接着状態の予測プログラムによって行うことができる。
(実施形態1)
上記接着状態の予測方法は、種々のデバイスやその部材の製造プロセスに適用することができる。デバイスやその部材の例には、ディスプレイや偏光板、タッチパネル、光学フィルム等が含まれる。上記接着状態の予測方法は、例えばデバイスの製造方法において、2つの被着体を、熱圧着フィルムを介して貼り合わせる工程に適用することができる。
図7に示されるように、まず、熱圧着フィルム(対象物)を準備する工程(準備工程、ステップS41)、加熱処理して熱圧着フィルムを溶融させる(加熱処理工程、ステップS42)。次いで、加熱溶融させた熱圧着フィルムについて、物性値情報を含むデータを取得し(ステップS43)、加熱溶融させた熱圧着フィルムをガラスフィルム(被着体)と貼り合わせた場合の、熱圧着フィルム/ガラスフィルム界面の接着状態を予測する(接着状態予測工程、ステップS44)。そして、接着状態の予測結果を可視化し(可視化工程、ステップS45)、剥離が発生するかどうかを判断する(判断工程、ステップS46)。剥離が発生しないと判断されれば、ガラスフィルムと貼り合わせて、接着物を得る(貼合工程、ステップS47)。一方、剥離が発生すると判断されれば、加熱処理条件を見直し(調整工程、ステップS48)、再度、加熱処理工程を行う(加熱処理工程、ステップS42)。以下、各工程について説明する。
まず、熱圧着フィルムを準備する。熱圧着フィルムは、樹脂フィルムなどの基材上に、熱圧着材料を付与して準備してもよいし、基材上に予め熱圧着材料が付与されたものを用いてもよい。基材上に熱圧着材料を付与する方法は、特に制限されず、塗布法であってもよいし、溶融押出法であってもよい。また、本実施形態では、基材として樹脂フィルムを用いているが、用途に応じて他の基材を用いてもよい。
次いで、熱圧着フィルムを加熱処理する。それにより、熱圧着フィルムを加熱溶融させて、接着しやすい状態にする。加熱温度は、例えば熱圧着フィルムのガラス転移温度Tgの近傍としうる。
次いで、本発明の接着状態の予測方法を実施する。本実施形態では、図1に示される手順で、接着状態の予測方法を実施する。
また、加熱溶融した熱圧着フィルムの反射スペクトルデータ(画像2)を反射分光膜厚計により取得し、膜厚を含むデータ(データ2)を取得する。膜厚を含むデータを取得する理由は、接着剤層の膜厚が接着力を決める重要な因子の一つだからである。前述した流動性や弾性率が適切な範囲内にあったとしても、膜厚が適切な範囲内になければ十分な接着力は発現できないため、接着状態を予測する上で膜厚も有効な情報である。
さらに、加熱溶融した熱圧着フィルムの温度分布画像(画像3)を赤外線サーモグラフィにより取得し、温度データ(データ3)を取得する(ステップS43)。温度データを取得する理由は、以下の通りである。例えば、造影剤(1)で可視化した接着剤の流動性が見込み通りになっていなかった場合、膜厚が見込み通りであれば、温度が十分に高くなっていないことや温度分布にムラがあることなどが原因として考えられる。そのため、接着状態の予測結果がなぜそうなっているかを理解する上で、温度は重要な情報だからである。
次いで、上記接着状態予測工程で出力された結果を可視化する。可視化方法は、特に制限されないが、例えば2次元座標上の位置ごとに、剥離力が閾値を超える部分(剥離力NGエリア)と超えない部分(剥離力OKエリア)とに色分けして表示する。それにより、貼り合わせ工程後(耐久試験終了後も含む)の、熱圧着フィルムとガラスフィルムとの接着状態を、事前に予測することができる。
次いで、可視化したデータに基づいて、剥離が発生するかどうかを判断する。判断方法は、特に制限されず、例えば既に取得したデータと照合して行うことができる。そして、判断工程で、剥離が発生しないと判断された場合は、貼り合わせ工程(ステップS47)を行う。一方、剥離が発生すると判断された場合は、調整工程(ステップS48)を行う。
上記判断工程で剥離が発生しないと判断された場合、加熱溶融した熱圧着フィルムに、ガラスフィルムを貼り合わせる。それにより、熱圧着フィルムとガラスフィルムの接着物(樹脂フィルムとガラスフィルムとが、熱圧着材料を介して接着された接着物)を得ることができる。
上記判断工程で剥離が発生すると判断された場合、加熱処理工程(ステップS42)における加熱処理条件を調整する。例えば、剥離力の分布に基づいて、加熱すべき温度や時間を設定する。そして、加熱処理工程(ステップS42)に戻り、調整工程で設定した条件で、再度、加熱処理する(ステップS42)。これを、判断工程において、剥離力のNGエリアが検出されなくなるまで繰り返す。
本発明の接着状態の予測方法は、例えばプリント配線板等の配線基板の製造方法において、プリント配線板の表面に回路保護用のソルダーレジスト等の絶縁性保護層を形成する工程に適用することができる。
硬度を可視化できる造影剤(1)を含むことが好ましい理由は、光硬化性材料が後工程(現像工程、ハンダ工程など)においても十分な接着性を維持するためには適切な範囲の硬度が求められるため、硬度が接着状態を予測する上で有効な情報だからである。造影剤(1)によれば、硬度のみならず、硬化度が適切な範囲である、すなわち硬化反応が完結しているかどうかも可視化できるため好ましい。
また、極性を可視化できる造影剤(2)を含むことが好ましい理由は、光硬化性材料に含まれるモノマーの官能基などに起因する極性などの電子的物性がプリント配線板などの被着体に対する接着性に影響する重要な因子の一つだからである。
また、硬化工程において、塗膜に、励起波長365nmの光を照射したときの発光状態を示す分光画像(画像2)を、ハイパースペクトルカメラにより取得する。そして、硬度と紐付けられる、波長600nmの発光強度に対する波長430nmの発光強度の比(F430/F600)を含むデータ(データ2)を取得する。
本発明の接着状態の予測方法は、例えばハードコートフィルムの製造方法に適用することができる。ハードコートフィルムは、例えば有機ELディスプレイ等のフレキシブルディスプレイ用基材や、水分透過を防ぐためのバリアフィルム等に用いられるものであり、透光性の樹脂フィルムと、光硬化性材料の硬化物を含むハードコート層と、を有する。
すなわち、ハードコート層が樹脂フィルムに対して十分な接着力をもって接着するためには、まずはハードコート層が均一に形成されているかどうかが大前提となる。よって、塗布膜の付量及びその分布が適切な範囲であるかどうか(塗布ムラが一定以下に抑えられているかどうか)、すなわち接着の最低要件を満たしているかどうかを造影剤(1)により可視化することで、後述する接着状態の予測の第一ステップを行うことができる。このように接着状態の予測をステップごとに分割して実行することで、工程の早い段階にて接着異常を予測できれば、時間短縮、ロス削減に繋がり好ましい。
本発明の接着状態の予測方法は、例えば粘着フィルムの製造方法における粘着フィルムの評価に用いることもできる。
具体的には、樹脂フィルム(基材)上に粘着材料を塗布形成した後(塗布工程)、塗布した粘着材料を乾燥させる(乾燥工程)。そして、得られた粘着フィルムを評価する。
また、塗布工程において、塗膜の反射スペクトルデータ(画像2)を、膜厚反射分光計により取得する。それにより、膜厚を含むデータ(データ2)を取得する。
さらに、乾燥工程において、塗膜に、励起波長660nmの光を照射したときの発光状態を示す分光画像(画像3)を、ハイパースペクトルカメラにより取得する。それにより、残留溶媒量と紐付けられる発光ピークシフト(F750~800)を含むデータ(データ3)を取得する。
本発明の接着状態の予測方法は、例えば偏光板の製造方法に適用することができる。偏光板は、偏光子と、透光性の樹脂フィルムと、それらの間に配置された、光硬化性材料の硬化物とを含む。
また、貼り合わせ工程において、硬化物に、励起波長660nmの光を照射したときの発光状態を示す分光画像(画像2)を、ハイパースペクトルカメラにより取得する。そして、水分量と紐付けられる、発光ピークシフト(F750~800)を含むデータ(データ2)を取得する。
実施形態2で記載したプリント配線板に対するソルダーレジストの接着状態の予測方法において、光硬化性材料の硬化前及び硬化後の近赤外反射スペクトル(例えば1000nm~2700nm)をハイパースペクトルカメラにより取得することで、接着状態を予測することができる。
続いて、硬化工程において、塗膜に、光源としてハロゲンランプ光を照射したときの近赤外吸収スペクトルを示す分光画像(画像2)を、ハイパースペクトルカメラにより取得する。そして、硬化後の光硬化性材料の分子構造情報と紐付けられるデータ(データ2)を取得する。
赤外光は分子の振動や回転運動によって吸収され、そのエネルギーは化学構造によって異なる。そのため、赤外光を測定すれば、化学構造や分子の状態に関する情報が得られる。具体的には、ハイパースペクトルカメラにより取得した反射光から近赤外吸収スペクトル(例えば波長1000~2700nmの領域内の特定波長の吸光度など)として、データ1及びデータ2を取得することができる。
また、硬化度に紐づけられるデータ3は、データ1とデータ2の差分、すなわち、(データ1)-(データ2)から求めることができる。このように求めた硬化前後の近赤外吸収スペクトルの差スペクトルであるデータ3は、光硬化性材料の硬化による化学構造や分子の状態の変化を反映しているため、硬化度と紐付けることができる。
110 撮像装置
111 光源
112 撮像部
120 処理装置
121 データ取得部
122 記憶部
123 接着状態予測部
124 画像取得部
125 処理部
130 表示部
Claims (20)
- 接着性を有する対象物を被接着体に接着させたときの、接着状態を予測するシステムであって、
前記対象物の2次元座標上の物性値情報を含むデータを、2以上取得するデータ取得部と、
取得した2以上の前記データを用いて、前記対象物と前記被接着体との接着状態を予測する接着状態予測部と、
を有する、
接着状態の予測システム。 - 前記データ取得部は、
前記対象物の2次元座標情報を取得し、取得した2次元座標情報と対応付けて前記2以上の物性値情報を含むデータを取得する、
請求項1に記載の接着状態の予測システム。 - 前記データ取得部は、
光が照射されたときの前記対象物の反射又は放出される光の状態を示す画像を取得する画像取得部と、
前記取得した画像から、前記対象物の前記2以上のデータを取得する処理部と、
を有する、
請求項2に記載の接着状態の予測システム。 - 前記対象物に光を照射する光源と、
前記光源からの光を受けて発光する前記対象物の発光状態を撮像する撮像部と、をさらに有し、
前記画像取得部は、前記撮像部で撮像した画像を取得する、
請求項3に記載の接着状態の予測システム。 - 前記接着状態予測部は、機械学習による予測モデルに基づいて接着状態を予測する、
請求項1に記載の予測システム。 - 前記接着状態予測部で予測した結果を表示する表示部をさらに有する、
請求項1に記載の接着状態の予測システム。 - 前記2以上のデータは、所定の物性値情報を含むデータを経時的に取得したものである、
請求項1に記載の接着状態の予測システム。 - 前記2以上のデータは、異なる種類の物性値情報を含む、
請求項1に記載の接着状態の予測システム。 - 前記2以上のデータは、同時に取得したものである、
請求項8に記載の接着状態の予測システム。 - 前記2以上のデータの少なくとも一つは、前記対象物の分光特性情報である、
請求項1に記載の接着状態の予測システム。 - 前記分光特性情報は、前記対象物に所定の波長の光を照射したときに、前記対象物から反射又は放出される光の状態を示す画像から得られる、
請求項10に記載の接着状態の予測システム。 - 前記画像は、ハイパースペクトルカメラにより取得されたものである、
請求項11に記載の接着状態の予測システム。 - 前記対象物は、前記対象物の物性に応じて発光挙動が変化する造影剤を含む、
請求項11又は12に記載の接着状態の予測システム。 - 前記造影剤は、所定の光の照射により蛍光を発する、
請求項13に記載の接着状態の予測システム。 - 前記分光特性情報は、弾性率、硬化度、硬度、極性及び水分量からなる群より選ばれる物性値と関連付けられている、
請求項10に記載の接着状態の予測システム。 - 前記2以上のデータの他の一つは、膜厚情報を含む、
請求項15に記載の接着状態の予測システム。 - 前記対象物は、熱圧着材料、硬化性材料、又は粘着材料である、
請求項1に記載の接着状態の予測システム。 - 接着性を有する対象物を被接着体に接着させたときの接着状態を予測する方法であって、
前記対象物の2次元座標上の物性値情報を含むデータを、2以上取得する工程と、
取得した2以上の前記データを用いて、前記対象物と前記被接着体との接着状態を予測する工程と、
を有する、
接着状態の予測方法。 - 接着性を有する対象物を被接着体に接着させたときの接着状態を予測するプログラムであって、
コンピュータに、
前記対象物の2次元座標上の物性値情報を含むデータを、2以上取得する工程と、
取得した2以上の前記データを用いて、前記対象物と前記被接着体との接着状態を予測する工程とを実行させるための、
接着状態の予測プログラム。 - 接着性を有する対象物に対し、請求項18に記載の予測方法を行うことにより、前記対象物と被着体との接着状態を予測する工程と、
前記予測した結果に基づいて、前記対象物の処理条件を調整する工程と、
を含む、
接着物の製造方法。
Priority Applications (3)
| Application Number | Priority Date | Filing Date | Title |
|---|---|---|---|
| CN202380039771.9A CN119173595A (zh) | 2022-05-12 | 2023-05-09 | 粘合状态的预测系统、粘合状态的预测方法、粘合状态的预测程序以及粘合物的制造方法 |
| US18/864,147 US20250305957A1 (en) | 2022-05-12 | 2023-05-09 | Bonded state prediction system, bonded state prediction method, bonded state prediction program and method for producing bonded article |
| JP2024520458A JPWO2023219082A1 (ja) | 2022-05-12 | 2023-05-09 |
Applications Claiming Priority (2)
| Application Number | Priority Date | Filing Date | Title |
|---|---|---|---|
| JP2022-078942 | 2022-05-12 | ||
| JP2022078942 | 2022-05-12 |
Publications (1)
| Publication Number | Publication Date |
|---|---|
| WO2023219082A1 true WO2023219082A1 (ja) | 2023-11-16 |
Family
ID=88730255
Family Applications (1)
| Application Number | Title | Priority Date | Filing Date |
|---|---|---|---|
| PCT/JP2023/017451 Ceased WO2023219082A1 (ja) | 2022-05-12 | 2023-05-09 | 接着状態の予測システム、接着状態の予測方法、接着状態の予測プログラム及び接着物の製造方法 |
Country Status (4)
| Country | Link |
|---|---|
| US (1) | US20250305957A1 (ja) |
| JP (1) | JPWO2023219082A1 (ja) |
| CN (1) | CN119173595A (ja) |
| WO (1) | WO2023219082A1 (ja) |
Citations (3)
| Publication number | Priority date | Publication date | Assignee | Title |
|---|---|---|---|---|
| JP2000094892A (ja) * | 1998-09-11 | 2000-04-04 | Polymark Technographics Internatl Plc | 転写ラベルにおける接着層の状態確認方法 |
| JP2008069243A (ja) * | 2006-09-13 | 2008-03-27 | Nippon Avionics Co Ltd | 接着状態予測方法 |
| JP2021156618A (ja) * | 2020-03-25 | 2021-10-07 | 住友精化株式会社 | 金属樹脂成形品の接着力向上剤の接着力予測方法及び接着力向上剤 |
-
2023
- 2023-05-09 CN CN202380039771.9A patent/CN119173595A/zh active Pending
- 2023-05-09 JP JP2024520458A patent/JPWO2023219082A1/ja active Pending
- 2023-05-09 WO PCT/JP2023/017451 patent/WO2023219082A1/ja not_active Ceased
- 2023-05-09 US US18/864,147 patent/US20250305957A1/en active Pending
Patent Citations (3)
| Publication number | Priority date | Publication date | Assignee | Title |
|---|---|---|---|---|
| JP2000094892A (ja) * | 1998-09-11 | 2000-04-04 | Polymark Technographics Internatl Plc | 転写ラベルにおける接着層の状態確認方法 |
| JP2008069243A (ja) * | 2006-09-13 | 2008-03-27 | Nippon Avionics Co Ltd | 接着状態予測方法 |
| JP2021156618A (ja) * | 2020-03-25 | 2021-10-07 | 住友精化株式会社 | 金属樹脂成形品の接着力向上剤の接着力予測方法及び接着力向上剤 |
Also Published As
| Publication number | Publication date |
|---|---|
| US20250305957A1 (en) | 2025-10-02 |
| CN119173595A (zh) | 2024-12-20 |
| JPWO2023219082A1 (ja) | 2023-11-16 |
Similar Documents
| Publication | Publication Date | Title |
|---|---|---|
| US9931827B2 (en) | Structural repair having optical witness and method of monitoring repair performance | |
| US9372177B2 (en) | Method and system for detecting exposure of composites to high-temperature | |
| US8386969B2 (en) | Method for designing overlay targets and method and system for measuring overlay error using the same | |
| CN111562241B (zh) | 一种对聚合物材料老化的检测及过程分析方法 | |
| CN103364391A (zh) | 测量热扩散系数的装置以及测量热扩散系数的方法 | |
| Zhao et al. | A Soft, Adhesive Self‐Healing Naked‐Eye Strain/Stress Visualization Patch | |
| US8436311B2 (en) | Method of predicting thermal or chemical effect in a coated or painted composite material | |
| JP2005208046A (ja) | 反応性硬化樹脂の硬化状態測定装置及び方法 | |
| Daikos et al. | Monitoring of thickness and conversion of thick pigmented UV-cured coatings by NIR hyperspectral imaging | |
| CN102334029B (zh) | 活性能量线硬化型树脂组合物的硬化度评价方法、硬化度评价薄片、及硬化度评价系统 | |
| US20250305957A1 (en) | Bonded state prediction system, bonded state prediction method, bonded state prediction program and method for producing bonded article | |
| CN102135448B (zh) | 一种防止环境光干扰的表面反射率光谱测量方法 | |
| US11884789B2 (en) | Manufacture of prepreg compositions, and determination of their suitability for use in composite structures | |
| CN115298537A (zh) | 状态确定装置、状态确定方法以及状态确定程序 | |
| CN119779849B (zh) | 碳化物演变实时监测方法、装置、终端及存储介质 | |
| CN108535119B (zh) | 柔性基板的抗弯折性能评估方法 | |
| Thielen et al. | 27‐2: Invited Paper: Correlation of Accelerated Aging to In‐Device Lifetime of Quantum Dot Enhancement Film | |
| CN120070388A (zh) | 一种led封装检测方法及系统 | |
| WO2014174664A1 (ja) | 高分子材料の耐候性評価方法 | |
| CN107122496B (zh) | 基于类别分析法的近红外光谱物质含量索引方法、设备及介质 | |
| Ni et al. | Monitoring the full-field polymerization process by using fluorescent digital image correlation | |
| TWI919636B (zh) | 光譜特徵量測方法 | |
| Muracciole et al. | Energy balance of a semicrystalline polymer during local plastic deformation | |
| FR2985024A1 (fr) | Dispositif de detection de gaz | |
| US20260057502A1 (en) | Strain mapping by hyperspectral imaging |
Legal Events
| Date | Code | Title | Description |
|---|---|---|---|
| 121 | Ep: the epo has been informed by wipo that ep was designated in this application |
Ref document number: 23803559 Country of ref document: EP Kind code of ref document: A1 |
|
| ENP | Entry into the national phase |
Ref document number: 2024520458 Country of ref document: JP Kind code of ref document: A |
|
| WWE | Wipo information: entry into national phase |
Ref document number: 18864147 Country of ref document: US |
|
| NENP | Non-entry into the national phase |
Ref country code: DE |
|
| 122 | Ep: pct application non-entry in european phase |
Ref document number: 23803559 Country of ref document: EP Kind code of ref document: A1 |
|
| WWP | Wipo information: published in national office |
Ref document number: 18864147 Country of ref document: US |