WO2023189738A1 - 情報処理方法、情報処理装置およびプログラム - Google Patents
情報処理方法、情報処理装置およびプログラム Download PDFInfo
- Publication number
- WO2023189738A1 WO2023189738A1 PCT/JP2023/010628 JP2023010628W WO2023189738A1 WO 2023189738 A1 WO2023189738 A1 WO 2023189738A1 JP 2023010628 W JP2023010628 W JP 2023010628W WO 2023189738 A1 WO2023189738 A1 WO 2023189738A1
- Authority
- WO
- WIPO (PCT)
- Prior art keywords
- data
- probability distribution
- user
- item
- information processing
- Prior art date
- Legal status (The legal status is an assumption and is not a legal conclusion. Google has not performed a legal analysis and makes no representation as to the accuracy of the status listed.)
- Ceased
Links
Images









Classifications
-
- G—PHYSICS
- G06—COMPUTING OR CALCULATING; COUNTING
- G06N—COMPUTING ARRANGEMENTS BASED ON SPECIFIC COMPUTATIONAL MODELS
- G06N7/00—Computing arrangements based on specific mathematical models
- G06N7/01—Probabilistic graphical models, e.g. probabilistic networks
-
- G—PHYSICS
- G06—COMPUTING OR CALCULATING; COUNTING
- G06N—COMPUTING ARRANGEMENTS BASED ON SPECIFIC COMPUTATIONAL MODELS
- G06N20/00—Machine learning
-
- G—PHYSICS
- G06—COMPUTING OR CALCULATING; COUNTING
- G06N—COMPUTING ARRANGEMENTS BASED ON SPECIFIC COMPUTATIONAL MODELS
- G06N3/00—Computing arrangements based on biological models
- G06N3/02—Neural networks
- G06N3/08—Learning methods
- G06N3/096—Transfer learning
-
- G—PHYSICS
- G06—COMPUTING OR CALCULATING; COUNTING
- G06Q—INFORMATION AND COMMUNICATION TECHNOLOGY [ICT] SPECIALLY ADAPTED FOR ADMINISTRATIVE, COMMERCIAL, FINANCIAL, MANAGERIAL OR SUPERVISORY PURPOSES; SYSTEMS OR METHODS SPECIALLY ADAPTED FOR ADMINISTRATIVE, COMMERCIAL, FINANCIAL, MANAGERIAL OR SUPERVISORY PURPOSES, NOT OTHERWISE PROVIDED FOR
- G06Q30/00—Commerce
- G06Q30/06—Buying, selling or leasing transactions
- G06Q30/0601—Electronic shopping [e-shopping]
Definitions
- the present disclosure relates to an information processing method, an information processing device, and a program, and particularly relates to an information processing technology that generates data of different domains.
- Patent Document 1 describes a personalized product recommendation system that utilizes deep learning.
- Non-Patent Document 1 describes a method of generating pseudo user behavior history data using a conditional generative adversarial network (CGAN).
- CGAN conditional generative adversarial network
- Patent Document 2 states that when there are restrictions on data that can be used from the perspective of privacy, such as patient data at a hospital, proxy data, which is pseudo data, is generated at each facility instead of local private data.
- proxy data which is pseudo data
- the configuration to be shared on the global server is described. According to the technology described in Patent Document 2, a global model can be learned using proxy data without sharing highly confidential real data (private data).
- Non-Patent Document 1 it is possible to generate user action history data necessary for information recommendation technology, but only data for the same domain as the source domain (domain of the original data) can be generated.
- the method described in Patent Document 2 generates a plurality of private data distributions that collectively represent local private data, and generates a set of virtual data (proxy data) whose distribution is similar to that of the private data (of the same domain). .
- proxy data virtual data
- the present disclosure has been made in view of these circumstances, and aims to provide an information processing method, an information processing device, and a program that can generate data on user behavior history in different domains.
- An information processing method is an information processing method executed by one or more processors, the one or more processors processing a data set including action histories of multiple users with respect to multiple items.
- data of an explanatory variable and a corresponding objective variable can be generated from a joint probability distribution obtained by modifying a part of the joint probability distribution of a given data set, and this generated data is The data will be in a different domain than the original dataset.
- data of different domains can be generated from the original data set.
- the modification may include changing the generation probability distribution of at least some of the explanatory variables.
- the modification may include changing the strength of dependence between explanatory variables.
- the modification may include reflecting a change in a rule that affects the joint probability distribution.
- one or more processors may generate a model expressing a joint probability distribution by performing machine learning using a data set.
- the explanatory variable may include a user attribute and an item attribute.
- the explanatory variable may further include a context.
- the expression of the joint probability distribution includes a user characteristic vector expressed using a vector indicating attributes of a user, and an item expressed using a vector indicating attributes of an item.
- the configuration may include expression of a conditional probability distribution expressed by a function using an inner product with a characteristic vector.
- the expression of the joint probability distribution includes a user characteristic vector expressed using a vector indicating user attributes and an item characteristic expressed using a vector indicating item attributes. It is expressed by a function that uses the sum of the inner product of the vector, the inner product of the item characteristic vector and the context characteristic vector expressed using a vector indicating the attributes of the context, and the inner product of the context characteristic vector and the user characteristic vector.
- the configuration may include expression of a conditional probability distribution.
- the function may be a logistic function.
- An information processing device is an information processing device including one or more processors and one or more memories storing instructions to be executed by the one or more processors, the information processing device including: The two or more processors express a joint probability distribution between a target variable and an explanatory variable, with the user's behavior toward the item as a target variable, for a data set including behavior history of the multiple users toward the multiple items, Part of the joint probability distribution is modified and data is generated based on the modified joint probability distribution.
- a program is configured to cause a computer to perform a data set including behavior history of a plurality of users with respect to a plurality of items, using the user's behavior with respect to the item as a target variable, and between the target variable and the explanatory variable.
- a function to express a joint probability distribution of , a function to modify a part of the joint probability distribution, and a function to generate data according to the modified joint probability distribution are realized.
- FIG. 1 is a conceptual diagram of a typical recommendation system.
- FIG. 2 is a conceptual diagram showing an example of supervised machine learning, which is widely used to construct recommendation systems.
- FIG. 3 is an explanatory diagram showing a typical introduction flow of the recommendation system.
- FIG. 4 is an explanatory diagram of the introduction flow of the recommendation system in a case where data on the facility to which the recommendation system is introduced cannot be obtained.
- FIG. 5 is an explanatory diagram when learning a model by domain application.
- FIG. 6 is an explanatory diagram of the recommendation system introduction flow including the step of evaluating the performance of the learned model.
- FIG. 7 is an explanatory diagram showing an example of learning data and evaluation data used in machine learning.
- FIG. 8 is a graph schematically showing differences in model performance due to differences in data sets.
- FIG. 8 is a graph schematically showing differences in model performance due to differences in data sets.
- FIG. 9 is an explanatory diagram of data necessary for developing a domain generalization model.
- FIG. 10 is a block diagram schematically showing an example of the hardware configuration of the information processing device according to the embodiment.
- FIG. 11 is a functional block diagram showing the functional configuration of the information processing device.
- FIG. 12 is a chart showing an example of action history data.
- FIG. 13 is a diagram illustrating an example of a directed acyclic graph (DAG) that expresses the dependence between variables of the joint probability distribution P(X, Y).
- DAG directed acyclic graph
- FIG. 14 is a diagram showing a specific example of probability expression of the conditional probability distribution P(Y
- FIG. 16 represents the behavioral characteristics of a user defined by the combination of user attribute 1 and user attribute 2, the behavioral characteristics of an item defined by the combination of item attribute 1 and item attribute 2, and the dependence relationships between variables. It is an explanatory diagram showing the relationship with DAG.
- FIG. 17 is a diagram showing an example of the probability distribution P(X) of each attribute of the explanatory variables.
- FIG. 18 is a diagram illustrating an example of a joint probability distribution DAG that includes context as an explanatory variable.
- FIG. 19 is a diagram illustrating an example of probability expression of the conditional probability distribution P(Y
- FIG. 20 is a graph showing an example of calibration.
- FIG. 21 is an explanatory diagram showing an example 1 of a method for modifying a joint probability distribution.
- FIG. 22 is an explanatory diagram showing an example 2 of a method for modifying the joint probability distribution.
- FIG. 23 is an explanatory diagram showing an example of modified user characteristic vectors and item attribute vectors.
- FIG. 24 is a flowchart showing the basic procedure of a data generation method using the information processing device according to the embodiment.
- FIG. 24 is a flowchart showing the basic procedure of a data generation method using the information processing device according to the embodiment.
- FIG. 25 is a flowchart illustrating the procedure of a method for generating data for multiple domains by the information processing apparatus according to the embodiment.
- FIG. 26 is a flowchart showing a procedure for using data generated by the information processing device according to the embodiment for domain generalization learning.
- FIG. 27 is a flowchart showing a procedure for using data generated by the information processing apparatus according to the embodiment for evaluating domain generalizability.
- Information recommendation technology is a technology for recommending (suggesting) items to users.
- FIG. 1 is a conceptual diagram of a typical recommendation system 10.
- the recommendation system 10 receives user information and context information as input, and outputs information on items recommended to the user according to the context.
- Context refers to various "situations" and may include, for example, day of the week, time of day, or weather.
- the items can be various objects, such as books, videos, restaurants, etc.
- the recommendation system 10 generally recommends multiple items at the same time.
- FIG. 1 shows an example in which the recommendation system 10 recommends three items IT1, IT2, and IT3.
- the recommendation is generally considered successful if the user reacts positively to the recommended items IT1, IT2, IT3.
- a positive response may be, for example, a purchase, viewing, or visit.
- Such recommendation technology is widely used, for example, on e-commerce sites and gourmet sites that introduce restaurants.
- FIG. 2 is a conceptual diagram showing an example of supervised machine learning that is widely used to construct the recommendation system 10.
- positive examples and negative examples are prepared based on past user behavior history, and a combination of a user and a context is input into the prediction model 12, and the prediction model 12 is trained so that the prediction error is small.
- a viewed item that the user viewed is a positive example
- a non-viewed item that the user did not view is a negative example.
- Machine learning is performed until the prediction error converges, and the target prediction performance is achieved.
- the prediction model 12 uses the learned (trained) predictive model 12 trained in this way to recommend items with a high predicted viewing probability for the combination of user and context. For example, when a combination of a certain user A and context ⁇ is input to the trained prediction model 12, the prediction model 12 calculates the probability that user A will view a document such as item IT3 under the conditions of context ⁇ . It is inferred that it is high, and recommends an item close to item IT3 to the user A. Note that depending on the configuration of the recommendation system 10, items are often recommended to the user without considering the context.
- a user's action history is almost equivalent to "correct data" in machine learning. Strictly speaking, it can be understood as a task setting that infers the next (unknown) behavior from past behavior history, but it is common to learn latent features based on past behavior history.
- the user's action history may include, for example, a book purchase history, a video viewing history, or a restaurant visit history.
- main feature quantities include user attributes and item attributes.
- User attributes may include various elements such as gender, age, occupation, family structure, and residential area.
- Item attributes can include various elements such as book genre, price, video genre and length, restaurant genre, and location.
- FIG. 3 is an explanatory diagram showing a typical introduction flow of the recommendation system.
- a model 14 that performs a target recommendation task is constructed (step 1), and then the constructed model 14 is introduced and operated (step 2).
- "building" the model 14 means learning the model 14 using learning (training) data and creating a predictive model (recommendation model) that satisfies a practical level of recommendation performance.
- “Operating” the model 14 means, for example, obtaining an output of a recommended item list from the trained model 14 in response to input of a combination of a user and a context.
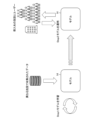
- the construction of the model 14 requires learning data. As shown in FIG. 3, the recommendation system model 14 is generally trained based on data collected at the facility where it is introduced. By performing learning using data collected from the target facility, the model 14 learns the behavior of the users of the target facility, and is able to accurately predict recommended items for the users of the target facility. It is possible.
- FIG. 4 is an explanatory diagram of the introduction flow of the recommendation system when data on the facility to which the recommendation system is introduced cannot be obtained. If the model 14 that has been trained using data collected at a facility different from the facility where it is introduced is operated at the facility where it is inserted, the predictive accuracy of the model 14 will decrease due to differences in user behavior between the facilities. There's a problem.
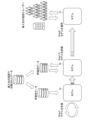
- Domain adaptation is a problem setting related to domain generalization. This is a learning method that uses data from both the source and target domains. The purpose of using data from a different domain even though data for the target domain exists is to compensate for the fact that the amount of data for the target domain is small and insufficient for learning.
- FIG. 5 is an explanatory diagram when learning the model 14 by domain adaptation. Although the amount of data collected at the target domain, the facility where it is being introduced, is relatively smaller than the amount of data collected at a different facility, by learning using both types of data, The model 14 can also predict the behavior of users of the facility where it is introduced with a certain degree of accuracy.
- Non-Patent Document 2 (Ivan Cantador et al, Chapter 27: "Cross-domain Recommender System"), which is a document related to research on domain adaptation in information recommendation, differences in domains are classified into the following four types.
- Item attribute level For example, comedy movies and horror movies are different domains.
- Item type level For example, movies and TV dramas are different domains.
- Item level For example, movies and books are different domains.
- a domain it is defined by the joint probability distribution P(X, Y) of objective variable Y and explanatory variable X, and when Pd1(X, Y) ⁇ Pd2(X, Y), d1 and d2 are They are different domains.
- the joint probability distribution P(X,Y) is the product of the distribution P(X) of the explanatory variable and the conditional probability distribution P(Y
- P(X,Y) P(Y
- X)P(X) P(X
- Prior probability shift When the distribution P(Y) of the objective variable is different, it is called a prior probability shift. For example, a case where the average viewing rate or average purchase rate differs between data sets corresponds to a prior probability shift.
- a prediction/classification model that performs a prediction or classification task makes inferences based on the relationship between the explanatory variable X and the objective variable Y, so if P(Y
- Domain shift can be a problem not only for information recommendation but also for models of various tasks. For example, for a model that predicts the risk of employee retirement, domain shift can become a problem when a predictive model learned using data from one company is used in another company.
- domain shift can be a problem when a model that predicts the amount of antibodies produced by cells is trained using data from one antibody and is used with another antibody.
- VOC Voice of Customer
- domain shift can be a problem when operating a classification model on a different product.
- FIG. 6 is an explanatory diagram of the recommendation system introduction flow including the step of evaluating the performance of the learned model 14.
- the performance of the model 14 is evaluated as "Step 1.5" between Step 1 (the step of learning the model 14) and Step 2 (the step of operating the model 14) explained in FIG. Steps have been added.
- the other configurations are the same as in FIG. 5.
- data collected at an installation destination facility is often divided into learning data and evaluation data. After confirming the predictive performance of the model 14 using the evaluation data, the operation of the model 14 is started.
- the learning data and evaluation data need to be in different domains. Furthermore, in domain generalization, it is preferable to use data from multiple domains as learning data, and it is more preferable that there are many domains that can be used for learning.
- FIG. 7 is an explanatory diagram showing an example of learning data and evaluation data used in machine learning.
- the data set obtained from the joint probability distribution Pd1 (X, Y) of a certain domain d1 is divided into learning data and evaluation data.
- the evaluation data in the same domain as the learning data is referred to as “first evaluation data” and is expressed as "evaluation data 1" in FIG.
- a data set obtained from the joint probability distribution Pd2 (X, Y) of domain d2 different from domain d1 is prepared, and this is used as evaluation data.
- Evaluation data in a domain different from the learning data is referred to as "second evaluation data” and is expressed as "evaluation data 2" in FIG.
- the model 14 is trained using the training data of the domain d1, and the performance of the trained model 14 is calculated using the first evaluation data of the domain d1 and the second evaluation data of the domain d2. is evaluated.
- FIG. 8 is a graph schematically showing differences in model performance due to differences in data sets. If the performance of the model 14 in the learning data is performance A, the performance of the model 14 in the first evaluation data is performance B, and the performance of the model 14 in the second evaluation data is performance C, then normally , as shown in FIG. 8, the relationship is as follows: Performance A>Performance B>Performance C.
- the high generalization performance of the model 14 generally refers to high performance B or a small difference between performances A and B.
- the aim is to achieve high prediction performance even on untrained data without overfitting the training data.
- domain generalizability in this specification, it refers to high performance C or a small difference between performance B and performance C.
- the aim is to achieve consistently high performance even in a domain different from the one used for learning.
- FIG. 9 is an explanatory diagram of data necessary for developing a domain generalization model.
- FIG. 10 is a block diagram schematically showing an example of the hardware configuration of the information processing device 100 according to the embodiment.
- the information processing device 100 has a function of expressing a joint probability distribution between a target variable and a plurality of explanatory variables, and a function of expressing a joint probability distribution between a target variable and a plurality of explanatory variables for a data set consisting of action histories of a plurality of users with respect to a plurality of items. and a function to generate data according to the modified joint probability distribution.
- the information processing device 100 can be realized using computer hardware and software.
- the physical form of the information processing device 100 is not particularly limited, and may be a server computer, a workstation, a personal computer, a tablet terminal, or the like.
- an example will be described in which the processing functions of the information processing apparatus 100 are realized using one computer, but the processing functions of the information processing apparatus 100 may also be realized by a computer system configured using a plurality of computers. Good too.
- the information processing device 100 includes a processor 102, a computer readable medium 104 that is a non-transitory tangible object, a communication interface 106, an input/output interface 108, and a bus 110.
- the processor 102 includes a CPU (Central Processing Unit).
- the processor 102 may include a GPU (Graphics Processing Unit).
- Processor 102 is connected to computer readable media 104, communication interface 106, and input/output interface 108 via bus 110.
- the processor 102 reads various programs, data, etc. stored in the computer-readable medium 104, and executes various processes.
- the term program includes the concept of a program module and includes instructions similar to a program.
- the computer-readable medium 104 is, for example, a storage device that includes a memory 112 that is a main storage device and a storage 114 that is an auxiliary storage device.
- the storage 114 is configured using, for example, a hard disk drive (HDD) device, a solid state drive (SSD) device, an optical disk, a magneto-optical disk, a semiconductor memory, or an appropriate combination thereof.
- the storage 114 stores various programs, data, and the like.
- the memory 112 is used as a work area for the processor 102, and is used as a storage unit that temporarily stores programs and various data read from the storage 114.
- the program stored in the storage 114 is loaded into the memory 112, and the processor 102 executes the instructions of the program, so that the processor 102 functions as a means for performing various processes specified by the program.
- the memory 112 stores various programs executed by the processor 102, such as a joint probability distribution representation program 130, a joint probability distribution modification program 132, and a data generation program 134, and various data.
- the memory 112 includes an original data set storage section 140, a joint probability distribution representation storage section 142, and a generated data storage section 144.
- the original data set storage unit 140 is a storage area in which a data set (hereinafter referred to as an original data set) that becomes the basis for generating data for a different domain is stored.
- the joint probability distribution representation storage unit 142 stores the joint probability distribution representation expressed by the joint probability distribution representation program 130 for the original data set, and the joint probability distribution representation modified by the joint probability distribution modification program 132. It is a storage area.
- the generated data storage unit 144 is a storage area in which pseudo behavior history data generated by the data generation program 134 is stored.
- the communication interface 106 performs communication processing with an external device by wire or wirelessly, and exchanges information with the external device.
- the information processing device 100 is connected to a communication line (not shown) via a communication interface 106.
- the communication line may be a local area network, a wide area network, or a combination thereof.
- the communication interface 106 can play the role of a data acquisition unit that accepts input of various data such as original data sets.
- the information processing device 100 may include an input device 152 and a display device 154.
- Input device 152 and display device 154 are connected to bus 110 via input/output interface 108 .
- Input device 152 may be, for example, a keyboard, a mouse, a multi-touch panel, or other pointing device, an audio input device, or any suitable combination thereof.
- the display device 154 may be, for example, a liquid crystal display, an organic electro-luminescence (OEL) display, a projector, or an appropriate combination thereof.
- OEL organic electro-luminescence
- the input device 152 and the display device 154 may be integrally configured like a touch panel, or the information processing device 100, the input device 152, and the display device 154 may be integrally configured like a touch panel tablet terminal. may be configured.
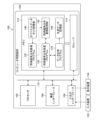
- FIG. 11 is a functional block diagram showing the functional configuration of the information processing device 100.
- the information processing device 100 includes a data acquisition section 220, a joint probability distribution expression section 230, a joint probability distribution modification section 232, a data generation section 234, and a data storage section 240.
- the data acquisition unit 220 acquires a data set of behavior history for each item of a plurality of users in the first domain, which is an original data set.
- the joint probability distribution expression unit 230 models the dependency relationship between the objective variable Y and each explanatory variable X for the original data set, and creates a joint probability distribution P(X, Find Y).
- the joint probability distribution modification unit 232 modifies a part of the joint probability distribution P(X, Y) of the first domain to generate a modified joint probability distribution Pm(X, Y).
- the joint probability distribution modification unit 232 may modify the conditional probability distribution P(Y
- the modified joint probability distribution Pm (X, Y) corresponds to the joint probability distribution between the objective variable Y and each explanatory variable X in a pseudo domain (second domain) different from the first domain. Become.
- the data generation unit 234 generates pseudo action history data for each item of a plurality of pseudo users according to the modified joint probability distribution Pm(X,Y).
- the data generation section 234 includes an explanatory variable generation section 235 and an objective variable generation section 236.
- the explanatory variable generation unit 235 generates an explanatory variable Xmj according to the probability distribution Pm(X) in the modified joint probability distribution Pm(X, Y).
- the objective variable generation unit 236 generates an objective variable Ymj based on the explanatory variable Xmj and according to the conditional probability distribution Pm(Y
- the data generation unit 234 can generate pseudo behavior history data of a large number of pseudo users.
- the pseudo behavior history data generated by the data generation unit 234 is stored in the data storage unit 240.
- the data storage unit 240 stores a generated data set including pseudo behavior history data of a large number of pseudo users.
- the generated data storage section 144 (see FIG. 10) can function as the data storage section 240.
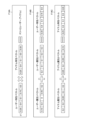
- FIG. 12 is a chart showing an example of behavior history data.
- FIG. 12 shows an example of a table of user behavior history regarding document viewing obtained from a certain company's document viewing system.
- the "item” here is a document.
- the table shown in FIG. 12 includes "time”, “user ID”, “item ID”, “user attribute 1", “user attribute 2”, “item attribute 1", “item attribute 2", “context 1", “ Context 2" and "viewed/not viewed” columns.
- “Time” is the date and time when the item was viewed.
- "User ID” is an identification code that identifies a user, and a unique ID (identification) is defined for each user.
- the item ID is an identification code that identifies an item, and a unique ID is defined for each item.
- "User attribute 1" is, for example, the department to which the user belongs.
- "User attribute 2” is, for example, the user's age.
- “Item attribute 1” is, for example, a document type as a classification category of an item.
- “Item attribute 2” is, for example, the file type of the item.
- Context 1 is, for example, the workplace where the item was viewed.
- Context 2 is, for example, the day of the week when the item was viewed.
- “Browsing presence/absence” in FIG. 12 is an example of the objective variable Y, and “user attribute 1”, “user attribute 2”, “item attribute 1”, “item attribute 2”, “context 1”, and “context 2”
- Each of is an example of explanatory variable X.
- the number of types of explanatory variables X and their combinations are not limited to the example shown in FIG. 12. As explanatory variables .
- the processor 102 If there is data such as the table shown in FIG. 12 as the behavior history, the processor 102 first learns dependencies between variables based on this data (see FIGS. 13 to 18). More specifically, the processor 102 uses a model in which the user, item, and context are each expressed as vectors, and the sum of their respective inner products is the behavior probability, and the model is designed to minimize the error in behavior prediction. Update the parameters.
- a vector representation of a user is expressed, for example, by adding vector representations of each attribute of the user. The same applies to the vector representation of items and the vector representation of context.
- a model that has learned the dependence between variables corresponds to a representation of the joint probability distribution P(X, Y) between the objective variable Y and each explanatory variable X in a given behavioral history data set.
- the processor 102 modifies the dependencies between variables. For example, considering the possibility that other companies are promoting home-based work, the probability of working from home is increased for Context 1 (work location). Also, for example, assuming a company with few seniority factors, we will eliminate dependence on age. Specifically, the age attribute is not added when configuring the user's vector representation.
- the processor 102 generates pseudo behavior history data based on the modified dependencies.
- the processor 102 probabilistically generates data from the upstream of the dependency relationship between variables. That is, the processor 102 first generates attribute data according to a probability distribution, and obtains vector representations of users, items, contexts, etc. based on the generated attributes. Thereafter, the processor 102 generates the presence or absence of an action for the combination of the user, item, and context according to the action probability calculated from the sum of the inner products of these vectors. In this way, data in a domain different from the actual data set used for learning (the data set shown in FIG. 12, which was actually collected from a company) is generated.
- FIG. 13 is an example of a directed acyclic graph (DAG) that expresses the dependence between variables of the joint probability distribution P(X, Y).
- DAG directed acyclic graph
- FIG. 13 shows an example in which four variables, user attribute 1, user attribute 2, item attribute 1, and item attribute 2, are used as explanatory variables X.
- the relationship between each of these explanatory variables X and the objective variable Y, which is the user's behavior toward the item, is expressed, for example, by a graph as shown in FIG. 13.
- the joint probability distribution representation unit 230 obtains a vector representation of the joint probability distribution P(X, Y) based on the dependency relationship between variables, such as the DAG shown in FIG. 13, for example.
- the graph shown in FIG. 13 shows that the user's behavior toward the item, which is the objective variable, depends on the user's behavioral characteristics and the item's characteristics, and the user's behavioral characteristics indicate that the user attribute 1 and the user attribute 2, indicating that the characteristics of the item depend on item attribute 1 and item attribute 2.
- the combination of user attribute 1 and user attribute 2 defines the user's behavioral characteristics. Further, the combination of item attribute 1 and item attribute 2 defines the characteristics of the item. The user's behavior toward the item is defined by a combination of the user's behavioral characteristics and the item's characteristics.
- the graph shown in FIG. 13 shows that elemental decomposition can be performed as follows.
- This type of representation method is called matrix factorization.
- the reason why the sigmoid function is adopted is that the value of the sigmoid function ranges from 0 to 1, and the value of the function can directly correspond to the probability.
- a sigmoid function is an example of a "function" in this disclosure.
- the model expression is not limited to the sigmoid function, and may be expressed using other functions.
- FIG. 14 shows a specific example of probability expression of P(Y
- X). Equation F14A shown in the upper part of FIG. 14 expresses the user characteristic vector ⁇ u and the item characteristic vector ⁇ i as five-dimensional vectors through matrix decomposition, and calculates the sigmoid function ⁇ ( ⁇ u ⁇ i) of these inner products ( ⁇ u ⁇ i). ) is expressed as a conditional probability P(Y 1
- u is an index value that distinguishes users.
- i is an index value that distinguishes items. Note that the dimension of the vector is not limited to five dimensions, but may be set to an appropriate number of dimensions as a hyperparameter of the model.
- the user characteristic vector ⁇ u is expressed by adding user attribute vectors.
- the user characteristic vector ⁇ u is expressed as the sum of a user attribute 1 vector and a user attribute 2 vector.
- the item characteristic vector ⁇ i is expressed by adding up the attribute vectors of the items.
- the item characteristic vector ⁇ i is expressed as the sum of the item attribute 1 vector and the item attribute 2 vector.
- the value of each vector is determined by learning from a data set (learning data) of user behavior history in a given domain.
- P(Y 1
- item) is updated using, for example, stochastic gradient descent (SGD).
- SGD stochastic gradient descent
- the means for expressing the joint probability distribution is not limited to matrix decomposition, but any means that can predict the conditional probability P(Y
- logistic regression or Naive Bayes may be applied.
- an arbitrary prediction model by calibrating the output score so that it becomes close to the probability P(Y
- SVM Small Vector Machine
- GDBT Gradient Boosting Decision Tree
- neural network models of arbitrary architectures can also be used.
- a joint probability distribution may be expressed using an ensemble of a plurality of prediction models.
- ⁇ User characteristic vector ⁇ u ⁇ Item characteristic vector: ⁇ i ⁇ User attribute 1 vector: Vk_u ⁇ 1 ⁇ User attribute 2 vector: Vk_u ⁇ 2 ⁇ Item attribute 1 vector: Vk_i ⁇ 1 ⁇ Item attribute 2 vector: Vk_i ⁇ 2
- ⁇ u Vk_u ⁇ 1+Vk_u ⁇ 2
- the log loss shown in the following equation (1) is used as a loss function during learning.
- the joint probability distribution expression unit 230 learns the parameters of the vector expression so that the above-mentioned loss L becomes small. For example, when performing optimization using stochastic gradient descent, the joint probability distribution expression section calculates the partial differential (gradient) of each parameter with respect to the loss function, and the loss L is calculated in proportion to the magnitude of the gradient. Change the parameter in the direction of decreasing the value.
- the joint probability distribution expression unit 230 updates the parameters of the user attribute 1 vector (Vk_u ⁇ 1) according to the following equation (2).
- ⁇ in equation (2) is the learning speed.
- FIG. 16 represents the behavioral characteristics of a user defined by the combination of user attribute 1 and user attribute 2, the behavioral characteristics of an item defined by the combination of item attribute 1 and item attribute 2, and the dependence relationships between variables. It is an explanatory diagram showing the relationship with DAG. As shown in FIG. 16, formula F14B represents the relationship of the portion surrounded by a frame FR2 indicated by a broken line in the DAG shown in FIG. Further, the formula F14C represents the relationship of the portion surrounded by a frame FR3 indicated by a broken line in the DAG shown in FIG.
- the joint probability distribution P(X,Y) requires a representation of not only P(Y
- the ratio of attribute values existing in the learning data may be used.
- the learning data here refers to the original data set used for learning when determining the joint probability distribution P(X, Y).
- FIG. 17 shows an example of the probability P(X) of each attribute of the explanatory variable.
- the user attribute 2 in the learning data is divided into, for example, six levels, and the existence ratio of each level in the learning data can be the probability distribution of the user attribute 2.
- the existence ratio probability distribution
- the ratio of attribute values existing in the learning data may be applied to the probability distributions of other attributes such as user attribute 1, item attribute 1, and item attribute 2.
- FIG. 18 is an example of a joint probability distribution DAG that includes context as the explanatory variable X.
- the graph shown in Figure 18 shows that the user's behavior toward the item, which is the objective variable, depends on the user's behavior characteristics, the item characteristics, and the context characteristics (complex context). It is shown that the characteristics of are dependent on context attribute 1 and context attribute 2.
- the other configurations are the same as those in FIG. 13.
- the joint probability distribution P(X, Y) can be decomposed into elements as follows. P(Y
- FIG. 19 shows an example of probability representation of P(Y
- Equation F19A shown in the upper part of FIG. 19 expresses the user characteristic vector ⁇ u, the item characteristic vector ⁇ i, and the context characteristic vector ⁇ c as five-dimensional vectors through matrix decomposition, and calculates the sum of the inner products of these three types of vectors.
- This is an example of an expression expressing the sigmoid function ⁇ ( ⁇ u ⁇ i+ ⁇ i ⁇ c+ ⁇ c ⁇ u) as a conditional probability P(Y 1
- the context characteristic vector ⁇ c is expressed by adding context attribute vectors. For example, as in equation F19B shown in the lower part of FIG. 19, the context characteristic vector ⁇ c is expressed as the sum of a context attribute 1 vector and a context attribute 2 vector.
- the values of each vector, User Attribute 1 Vector, User Attribute 2 Vector, Item Attribute 1 Vector, Item Attribute 2 Vector, Context Attribute Vector 1, and Context Attribute 2 Vector are determined by the user behavior history dataset (learning determined by learning from data).
- the parameters to be learned from the data set are the following parameters in addition to the parameters described using FIGS. 13 to 16.
- ⁇ Context characteristic vector ⁇ c ⁇ Context attribute 1 vector: Vk_c ⁇ 1
- Context attribute 2 vector Vk_c ⁇ 2
- ⁇ c Vk_c ⁇ 1+Vk_c ⁇ 2
- the prediction score output from the model may not necessarily correspond to the numerical value of the action probability.
- X) becomes close to the probability of actual action Y 1 (action is taken). Such conversion is called calibration.
- FIG. 20 is a graph showing an example of calibration.
- FIG. 20 shows an example where the prediction score output by the model can take values in the range of "-10" to "+10".
- the explanatory variable X and the objective variable Y can be probabilistically sampled from the joint probability distribution P(X, Y).
- the data generation unit 234 can generate data on the explanatory variable X and the objective variable Y using the following procedure.
- the joint probability distribution P(X,Y) expressed by the DAG shown in FIG. 13 will be explained as an example.
- Step 2 A user characteristic vector and an item characteristic vector are generated based on the corresponding vector representations of the sampled user attributes and item attributes (see FIG. 14).
- Step 3 Obtain P(Y
- the joint probability distribution modification unit 232 modifies P(X,Y) before data generation, and the modified joint probability distribution Pm(X,Y)
- the data generation unit 234 generates data based on the information.
- FIG. 21 is an explanatory diagram showing an example 1 of a method for modifying a joint probability distribution.
- FIG. 21 shows an example in which the joint probability distribution P(X,Y) is modified by changing the probability distribution P(X) of the explanatory variable X.
- the joint probability distribution P(X,Y) can be modified by changing .
- FIG. 21 shows a specific example of how the distribution of user attribute 2 (age) is changed.
- These probabilities for each age group can be determined by statistically processing the original data set.
- Changing the generation distribution means changing the generation probability distribution of data of user attribute 2, and is an example of "changing the generation probability distribution" in the present disclosure.
- FIG. 22 is an explanatory diagram showing an example 2 of a method for modifying a joint probability distribution.
- FIG. 22 shows an example of modifying the conditional probability distribution P(Y
- X) can be changed by changing the strength of the dependency relationship within the frame FR4 indicated by the broken line in the figure.
- FIG. 22 shows an example of the relationship between user attribute 1, user attribute 2, and user behavior characteristics, in which the influence of user attribute 2 on the user behavior characteristics is strengthened.
- FIG. 22 shows an example in which the influence of item attribute 2 and context attribute 2 is eliminated. That is, in FIG. 22, regarding the relationship between item attribute 1, item attribute 2, and item characteristics, an example is shown in which the item characteristics eliminate (erase) the dependence of item attribute 2, and furthermore, the relationship between item attribute 1 and item attribute 1 is Regarding the relationship between the context attribute 2 and the context characteristics, an example is shown in which the item characteristics eliminate the dependence of the item attribute 2. Eliminating dependencies is an extreme example of weakening the degree of influence.
- FIG. 23 shows an example of the modified user characteristic vector and item attribute vector.
- Formula F23A shown in the upper part of FIG. 23 is an example of increasing the degree of influence of user attribute 2.
- An example is shown in which 2 vectors are multiplied by 3 and added to the user attribute 1 vector.
- the coefficient (3 in this case) multiplied by the user attribute 2 vector is a value indicating the degree of influence.
- the user attribute 1 vector may be multiplied by an appropriate coefficient indicating the degree of influence.
- Formula F23B shown in the lower part of FIG. 23 is an example of eliminating the influence of item attribute 2, and the item attribute 1 vector is used as the item characteristic vector without adding the item attribute 2 vector to the item attribute 1 vector.
- the context attribute 1 vector may be used as the context characteristic vector as is, similar to equation F23B.
- Example 3 of how to modify joint probability distribution As a method of modifying the joint probability distribution, for example, if there is an internal rule such as "AA documents must be confirmed within p days", a modification of this rule may be reflected.
- the internal rules may be, for example, internal rules of a company or internal rules of a hospital. Browsing behavior is thought to be changed (affected) by such rules.
- An example of a change in hospital rules is, for example, a change in the conditions for holding a conference.
- an example of a change in the rules regarding purchasing behavior on an EC site is a tax change such as ⁇ the tax rate will be ⁇ % for food and other items.'''
- FIG. 24 is a flowchart showing the basic procedure of a data generation method using the information processing device 100 according to the embodiment.
- step S111 the processor 102 calculates a joint probability distribution P(X, Y) from the learning data.
- the learning data here is, for example, behavior history data actually collected at a facility such as a certain company or hospital, and is data of the above-mentioned original data set.
- the step of determining the joint probability distribution P(X, Y) includes the following two contents [1A] and [1B].
- the process of calculating the joint probability distribution P(X, Y) consists of learning P(Y
- step S112 the processor 102 modifies the joint probability distribution P(X, Y) obtained in step S111.
- P(X,Y) can be modified in the following two ways [2A] and [2B]. That is, there may be an embodiment (2A) in which P(Y
- step S113 the processor 102 generates data from the joint probability distribution modified in step S111.
- step S113 includes the following two processes [3A] and [3B]. That is, step S113 includes a process (3A) of generating X from Pm(X) and a process (3B) of generating Y from Pm(Y
- Processor 102 generates X from Pm(X), and then uses X to generate Y from Pm(Y
- step S113 the processor 102 ends the flowchart of FIG. 24.
- FIG. 25 is a flowchart illustrating the procedure of a method for generating data for multiple domains by the information processing apparatus 100 according to the embodiment.
- steps common to those in FIG. 24 are given the same step numbers, and duplicate explanations will be omitted. The same applies to other figures.
- One set of domain data is obtained by combining the modification in step S112 and the data generation in step S113. Therefore, by changing the modification method and repeating step S112 and step S113 multiple times, a plurality of domain data can be generated.
- step S114 the processor 102 determines whether to generate other domain data. If the determination result in step S114 is Yes, the processor 102 returns to step S112 and performs a modification different from the previous one. In this way, different domain data is generated by executing step S112 and step S113.
- step S114 If the determination result in step S114 is No, the processor 102 ends the flowchart of FIG. 25.
- FIG. 26 is a flowchart illustrating a procedure when data generated by the information processing apparatus 100 according to the embodiment is used for domain generalization learning.
- steps S111 to S113 are the same as in FIG. 24.
- step S115 is added after step S113 in FIG.
- step S115 the processor 102 or another processor performs learning to obtain a domain generalized model based on the original learning data and the generated data.
- Step S115 may be executed by a processor different from the processor 102 that generates data in steps S111 to S113. That is, the information processing device 100 that generates data and the machine learning device that trains the model 14 using the generated data as learning data may be different devices or may be the same device. . Further, step S115 may be executed after generating data for multiple domains, as described with reference to FIG. 25.
- the process of generating data (steps S111 to S113) and the process of learning using the generated data (step S115) may be performed at different timings or may be performed continuously.
- data for one or more, preferably multiple, different domains is generated in advance in steps S111 to S113, and after preparing data to be used for learning, multiple domains including the original learning data (original data set) are generated.
- the model 14 may be trained using data in the domain. Further, for example, when learning the model 14, the learning may be performed by generating data using an on-the-fly method and inputting the generated data to the model 14.
- step S115 the processor 102 or other processor ends the flowchart of FIG. 26.
- FIG. 27 is a flowchart showing a procedure for using data generated by the information processing apparatus 100 according to the embodiment for evaluating domain generalizability.
- steps S111 to S113 are the same as in FIG. 24.
- step S116 is added after step S113.
- step S116 the processor 102 or another processor uses the original learning data or the generated data for model evaluation.
- Step S116 may have the following two aspects [4A] and [4B]. That is, there is a mode (4A) in which the model 14 is trained using the original learning data and the model 14 is evaluated using the generated data, and a mode (4A) in which the model 14 is trained using the generated data and the model 14 is evaluated using the generated data.
- step S116 the processor 102 or other processor ends the flowchart of FIG. 27.
- the data generated by the information processing device 100 and indicating the behavior history of the user of the pseudo domain may have the following uses, for example.
- a program that causes a computer to implement some or all of the processing functions of the information processing device 100 is recorded on a computer readable medium that is an optical disk, a magnetic disk, or a non-transitory information storage medium such as a semiconductor memory, and this It is possible to provide the program through an information storage medium.
- the program signal instead of providing the program by storing it in a tangible, non-transitory computer-readable medium, it is also possible to provide the program signal as a download service using a telecommunications line such as the Internet.
- part or all of the processing functions in the information processing device 100 may be realized by cloud computing, and it is also possible to provide it as SaaS (Software as a Service).
- SaaS Software as a Service
- a process for executing various processes such as the data acquisition unit 220, joint probability distribution expression unit 230, joint probability distribution modification unit 232, data generation unit 234, explanatory variable generation unit 235, and objective variable generation unit 236 in the information processing device 100.
- the hardware structure of the processing unit is, for example, the following various processors.
- processors include programmable logic, which is a processor whose circuit configuration can be changed after manufacturing, such as CPU, GPU, and FPGA (Field Programmable Gate Array), which are general-purpose processors that execute programs and function as various processing units.
- programmable logic which is a processor whose circuit configuration can be changed after manufacturing
- CPU CPU
- GPU GPU
- FPGA Field Programmable Gate Array
- PLDs Programmable Logic Devices
- ASICs Application Specific Integrated Circuits
- One processing unit may be composed of one of these various processors, or may be composed of two or more processors of the same type or different types.
- one processing unit may be configured by a plurality of FPGAs, a combination of a CPU and an FPGA, or a combination of a CPU and a GPU.
- the plurality of processing units may be configured with one processor.
- one processor is configured with a combination of one or more CPUs and software, as typified by computers such as clients and servers. There is a form in which a processor functions as multiple processing units.
- processors that use a single IC (Integrated Circuit) chip, such as System On Chip (SoC), which implements the functions of an entire system including multiple processing units.
- SoC System On Chip
- various processing units are configured using one or more of the various processors described above as a hardware structure.
- circuitry that is a combination of circuit elements such as semiconductor elements.
- the information processing device 100 based on the joint probability distribution Pm(X,Y) obtained by modifying the joint probability distribution P(X,Y) obtained from the given original data set, can generate data showing the behavior history of users in different domains.
- the generated data By using the generated data as learning data, it is possible to learn the domain-generalized model 14.
- domain generalizability can be evaluated by using the generated data as evaluation data.
- pseudo data for different domains can be generated from data for one given domain. It becomes possible to provide a general recommendation system. By using the data generated according to this embodiment, it is possible to contribute to improving the performance of the recommendation system and achieving highly reliable performance evaluation.
- the user action history related to document viewing was explained as an example, but the scope of application of the present disclosure is not limited to document viewing, but also includes viewing medical images, purchasing products, watching content such as videos, etc. Regardless of the purpose, it can be applied to data related to user behavior regarding various items.
Landscapes
- Engineering & Computer Science (AREA)
- Physics & Mathematics (AREA)
- Theoretical Computer Science (AREA)
- General Physics & Mathematics (AREA)
- Software Systems (AREA)
- Artificial Intelligence (AREA)
- Data Mining & Analysis (AREA)
- Evolutionary Computation (AREA)
- Computing Systems (AREA)
- General Engineering & Computer Science (AREA)
- Mathematical Physics (AREA)
- Business, Economics & Management (AREA)
- Mathematical Analysis (AREA)
- Pure & Applied Mathematics (AREA)
- Algebra (AREA)
- Computational Mathematics (AREA)
- Probability & Statistics with Applications (AREA)
- Mathematical Optimization (AREA)
- Finance (AREA)
- Accounting & Taxation (AREA)
- Computational Linguistics (AREA)
- Economics (AREA)
- Biophysics (AREA)
- Health & Medical Sciences (AREA)
- General Health & Medical Sciences (AREA)
- Molecular Biology (AREA)
- Biomedical Technology (AREA)
- Medical Informatics (AREA)
- Computer Vision & Pattern Recognition (AREA)
- Development Economics (AREA)
- Life Sciences & Earth Sciences (AREA)
- Marketing (AREA)
- Strategic Management (AREA)
- General Business, Economics & Management (AREA)
- Information Retrieval, Db Structures And Fs Structures Therefor (AREA)
Priority Applications (2)
| Application Number | Priority Date | Filing Date | Title |
|---|---|---|---|
| JP2024511827A JPWO2023189738A1 (https=) | 2022-03-28 | 2023-03-17 | |
| US18/896,911 US20250021848A1 (en) | 2022-03-28 | 2024-09-26 | Information processing method, information processing apparatus, and program |
Applications Claiming Priority (2)
| Application Number | Priority Date | Filing Date | Title |
|---|---|---|---|
| JP2022051709 | 2022-03-28 | ||
| JP2022-051709 | 2022-03-28 |
Related Child Applications (1)
| Application Number | Title | Priority Date | Filing Date |
|---|---|---|---|
| US18/896,911 Continuation US20250021848A1 (en) | 2022-03-28 | 2024-09-26 | Information processing method, information processing apparatus, and program |
Publications (1)
| Publication Number | Publication Date |
|---|---|
| WO2023189738A1 true WO2023189738A1 (ja) | 2023-10-05 |
Family
ID=88201091
Family Applications (1)
| Application Number | Title | Priority Date | Filing Date |
|---|---|---|---|
| PCT/JP2023/010628 Ceased WO2023189738A1 (ja) | 2022-03-28 | 2023-03-17 | 情報処理方法、情報処理装置およびプログラム |
Country Status (3)
| Country | Link |
|---|---|
| US (1) | US20250021848A1 (https=) |
| JP (1) | JPWO2023189738A1 (https=) |
| WO (1) | WO2023189738A1 (https=) |
Families Citing this family (1)
| Publication number | Priority date | Publication date | Assignee | Title |
|---|---|---|---|---|
| US20250203162A1 (en) * | 2023-12-15 | 2025-06-19 | Dish Network L.L.C. | Weather based content recommendations |
-
2023
- 2023-03-17 WO PCT/JP2023/010628 patent/WO2023189738A1/ja not_active Ceased
- 2023-03-17 JP JP2024511827A patent/JPWO2023189738A1/ja active Pending
-
2024
- 2024-09-26 US US18/896,911 patent/US20250021848A1/en active Pending
Non-Patent Citations (2)
| Title |
|---|
| GOLLAS B, BARTLETT P N, DENUAULT G: "AN INSTRUMENT FOR SIMULTANEOUS EQCM IMPEDANCE AND SECM MEASUREMENTS", ANALYTICAL CHEMISTRY, AMERICAN CHEMICAL SOCIETY, US, vol. 72, no. 02, 15 January 2000 (2000-01-15), US , pages 349 - 356, XP000954973, ISSN: 0003-2700, DOI: 10.1021/ac990796o * |
| JINDONG WANG; CUILING LAN; CHANG LIU; YIDONG OUYANG; TAO QIN; WANG LU; YIQIANG CHEN; WENJUN ZENG; PHILIP S. YU: "Generalizing to Unseen Domains: A Survey on Domain Generalization", ARXIV.ORG, CORNELL UNIVERSITY LIBRARY, 201 OLIN LIBRARY CORNELL UNIVERSITY ITHACA, NY 14853, 12 December 2021 (2021-12-12), 201 Olin Library Cornell University Ithaca, NY 14853, XP091109166 * |
Also Published As
| Publication number | Publication date |
|---|---|
| US20250021848A1 (en) | 2025-01-16 |
| JPWO2023189738A1 (https=) | 2023-10-05 |
Similar Documents
| Publication | Publication Date | Title |
|---|---|---|
| Phillips et al. | Practical considerations for specifying a super learner | |
| US12050762B2 (en) | Methods and systems for integrated design and execution of machine learning models | |
| JP7652916B2 (ja) | 情報をプッシュする方法および装置 | |
| JP7267964B2 (ja) | 生成装置、生成方法および生成プログラム | |
| JP2018190396A (ja) | ネットワークレーティング予測エンジン | |
| Díaz et al. | Targeted learning ensembles for optimal individualized treatment rules with time-to-event outcomes | |
| US12050971B2 (en) | Transaction composition graph node embedding | |
| US20250124256A1 (en) | Efficient Knowledge Distillation Framework for Training Machine-Learned Models | |
| CN111783810A (zh) | 用于确定用户的属性信息的方法和装置 | |
| US20250156300A1 (en) | Confusion Matrix Estimation in Distributed Computation Environments | |
| US20230401488A1 (en) | Machine learning method, information processing system, information processing apparatus, server, and program | |
| US20230368075A1 (en) | Information processing method, information processing apparatus, and program | |
| US12260301B2 (en) | Data generation and annotation for machine learning | |
| US20220215287A1 (en) | Self-supervised pretraining through text alignment | |
| Sola et al. | Deep embeddings and Graph Neural Networks: using context to improve domain-independent predictions: F. Sola et al. | |
| US20250021848A1 (en) | Information processing method, information processing apparatus, and program | |
| US20250209308A1 (en) | Risk Analysis and Visualization for Sequence Processing Models | |
| US12475500B2 (en) | Information processing method, information processing apparatus, and program | |
| CN116362796A (zh) | 一种用于预测转化率的点击转化模型训练方法和系统 | |
| Cerqueira et al. | Constructive aggregation and its application to forecasting with dynamic ensembles | |
| Lee et al. | Smartphone help contents re-organization considering user specification via conditional GAN | |
| US12314739B1 (en) | Apparatus and method for generating an interactive graphical user interface | |
| US20250355710A1 (en) | Near Real-Time Benchmark Data Generation and Display for Dynamic Peer Groups | |
| US20240232294A1 (en) | Combining structured and semi-structured data for explainable ai | |
| US20260017513A1 (en) | Method and user interface for training artificial neural network models in environment including multiple computing nodes |
Legal Events
| Date | Code | Title | Description |
|---|---|---|---|
| 121 | Ep: the epo has been informed by wipo that ep was designated in this application |
Ref document number: 23779754 Country of ref document: EP Kind code of ref document: A1 |
|
| ENP | Entry into the national phase |
Ref document number: 2024511827 Country of ref document: JP Kind code of ref document: A |
|
| NENP | Non-entry into the national phase |
Ref country code: DE |
|
| 122 | Ep: pct application non-entry in european phase |
Ref document number: 23779754 Country of ref document: EP Kind code of ref document: A1 |