WO2023171663A1 - 解析装置、解析方法、およびプログラム - Google Patents
解析装置、解析方法、およびプログラム Download PDFInfo
- Publication number
- WO2023171663A1 WO2023171663A1 PCT/JP2023/008558 JP2023008558W WO2023171663A1 WO 2023171663 A1 WO2023171663 A1 WO 2023171663A1 JP 2023008558 W JP2023008558 W JP 2023008558W WO 2023171663 A1 WO2023171663 A1 WO 2023171663A1
- Authority
- WO
- WIPO (PCT)
- Prior art keywords
- vibration
- image
- analysis
- noise
- natural frequency
- Prior art date
- Legal status (The legal status is an assumption and is not a legal conclusion. Google has not performed a legal analysis and makes no representation as to the accuracy of the status listed.)
- Ceased
Links
Images





Classifications
-
- G—PHYSICS
- G01—MEASURING; TESTING
- G01H—MEASUREMENT OF MECHANICAL VIBRATIONS OR ULTRASONIC, SONIC OR INFRASONIC WAVES
- G01H9/00—Measuring mechanical vibrations or ultrasonic, sonic or infrasonic waves by using radiation-sensitive means, e.g. optical means
-
- G—PHYSICS
- G01—MEASURING; TESTING
- G01H—MEASUREMENT OF MECHANICAL VIBRATIONS OR ULTRASONIC, SONIC OR INFRASONIC WAVES
- G01H17/00—Measuring mechanical vibrations or ultrasonic, sonic or infrasonic waves, not provided for in the other groups of this subclass
-
- G—PHYSICS
- G01—MEASURING; TESTING
- G01H—MEASUREMENT OF MECHANICAL VIBRATIONS OR ULTRASONIC, SONIC OR INFRASONIC WAVES
- G01H3/00—Measuring characteristics of vibrations by using a detector in a fluid
-
- G—PHYSICS
- G06—COMPUTING OR CALCULATING; COUNTING
- G06T—IMAGE DATA PROCESSING OR GENERATION, IN GENERAL
- G06T5/00—Image enhancement or restoration
- G06T5/50—Image enhancement or restoration using two or more images, e.g. averaging or subtraction
-
- G—PHYSICS
- G06—COMPUTING OR CALCULATING; COUNTING
- G06T—IMAGE DATA PROCESSING OR GENERATION, IN GENERAL
- G06T2207/00—Indexing scheme for image analysis or image enhancement
- G06T2207/20—Special algorithmic details
- G06T2207/20212—Image combination
- G06T2207/20221—Image fusion; Image merging
Definitions
- the present disclosure relates to an analysis device, an analysis method, and a program.
- This application claims priority based on Japanese Patent Application No. 2022-036498 filed in Japan on March 9, 2022, the contents of which are incorporated herein.
- Patent Document 1 describes a technique for inspecting the state of a structure by measuring in-plane displacement of the structure from an image taken of the structure, such as a bridge.
- a technology is being considered that measures the vibration state of the object to be inspected (position where vibration occurs, magnitude of vibration, etc.) from captured images.
- the inspection target may generate noise due to vibration.
- it is necessary to identify the vibrations that cause the noise.
- the present disclosure has been made in view of such problems, and provides an analysis device, an analysis method, and a program that can visualize the correlation between vibration and noise of an object to be inspected.
- the analysis device acquires vibration information including a time series of the vibration level of the inspection target and a distribution of vibration levels for each vibration frequency based on an image taken of the inspection target, a vibration image generation unit that generates a vibration image that visualizes the vibration level of each region of the inspection target on the image at a first natural frequency where the peak of the vibration level appears; and the inspection target that is recorded simultaneously with the image.
- noise information including a time series of the sound pressure level of the noise generated from the inspection object and a distribution of the sound pressure level for each vibration frequency is acquired, and the sound pressure level for each of the areas on the image is obtained.
- the apparatus includes an extraction unit that extracts a vibration frequency, and an analysis image generation unit that generates an analysis image in which the vibration image corresponding to the extracted first natural frequency and the sound source image are superimposed.
- an analysis method acquires vibration information including a time series of the vibration level of the inspection object and a distribution of vibration levels for each vibration frequency based on an image taken of the inspection object, generating a vibration image that visualizes the vibration level of each area of the inspection target on the image at a first natural frequency where the peak of the vibration level appears; and audio recording data of the inspection target recorded simultaneously with the image.
- Noise information including a time series of the sound pressure level of the noise generated from the inspection target and a distribution of the sound pressure level for each vibration frequency was obtained based on the above, and the sound pressure level for each region on the image was visualized.
- a step of generating a sound source image a step of extracting a first natural frequency included within a predetermined range from a second natural frequency at which the peak of the sound pressure level of the noise appears, based on the vibration information and the noise information. and generating an analysis image in which the vibration image corresponding to the extracted first natural frequency and the sound source image are superimposed.
- the program acquires vibration information including a time series of the vibration level of the inspection target and a distribution of vibration levels for each vibration frequency based on an image of the inspection target, and a step of generating a vibration image that visualizes the vibration level of each area of the inspection target on the image at a first natural frequency where a peak of the vibration level appears; and recording data of the inspection target recorded simultaneously with the image;
- a sound source that visualizes the sound pressure level of each region on the image by acquiring noise information including a time series of the sound pressure level of the noise generated from the inspection target based on the sound pressure level and the distribution of the sound pressure level for each frequency.
- a step of generating an image and a step of extracting a first natural frequency included within a predetermined range from a second natural frequency at which a peak of the sound pressure level of the noise appears, based on the vibration information and the noise information. and generating an analysis image in which the vibration image corresponding to the extracted first natural frequency and the sound source image are superimposed.
- FIG. 1 is a diagram showing the overall configuration of an analysis system according to a first embodiment of the present disclosure.
- FIG. 1 is a block diagram showing a functional configuration of an analysis device according to a first embodiment of the present disclosure. It is a flow chart which shows an example of processing of an analysis device concerning a 1st embodiment of this indication.
- FIG. 3 is a diagram showing an example of a vibration image according to the first embodiment of the present disclosure.
- FIG. 3 is a diagram illustrating an example of a sound source image according to the first embodiment of the present disclosure.
- FIG. 2 is a first diagram for explaining the functions of the analysis device according to the first embodiment of the present disclosure.
- FIG. 2 is a second diagram for explaining the functions of the analysis device according to the first embodiment of the present disclosure.
- FIG. 1 is a diagram showing the overall configuration of an analysis system according to a first embodiment of the present disclosure.
- FIG. 1 is a block diagram showing a functional configuration of an analysis device according to a first embodiment of the present disclosure. It
- FIG. 3 is a diagram illustrating an example of an analysis image according to the first embodiment of the present disclosure.
- FIG. 3 is a first diagram for explaining the functions of an analysis device according to a second embodiment of the present disclosure.
- FIG. 7 is a second diagram for explaining the functions of the analysis device according to the second embodiment of the present disclosure.
- FIG. 7 is a first diagram for explaining the functions of an analysis device according to a third embodiment of the present disclosure.
- FIG. 7 is a second diagram for explaining the functions of the analysis device according to the third embodiment of the present disclosure.
- FIG. 1 is a diagram showing the overall configuration of an analysis system according to a first embodiment of the present disclosure.
- the analysis system 1 is a system for measuring the vibration and noise of the inspection object 9 and outputting an analysis image that allows the identification of the source position of the noise and the visual confirmation of the mechanism (vibration, etc. that causes the noise).
- the inspection object 9 is, for example, a rotating machine such as a motor or a gas turbine.
- FIG. 1 shows an example in which the inspection object 9 is a rotating shaft of a rotating machine.
- the inspection target 9 may be a rotor blade of a gas turbine or a structure such as a pipe.
- the analysis system 1 includes a camera 2, a plurality of microphones 3, and an analysis device 10.
- the camera 2 photographs the inspection object 9.
- An image D1 (video) captured by the camera 2 is transmitted to the analysis device 10.
- the plurality of microphones 3 each record the sound (noise) emitted by the test object 9. Recorded data D2 recorded by each microphone 3 is transmitted to the analysis device 10.
- the analysis device 10 generates an analysis image that visualizes the state of vibration and noise of the inspection object 9 based on the image D1 and the recorded data D2.
- FIG. 2 is a block diagram showing the functional configuration of the analysis device according to the first embodiment of the present disclosure.
- the analysis device 10 includes a processor 11, a memory 12, a storage 13, a communication interface 14, a display device 15, and an input device 16.
- the processor 11 functions as a vibration image generation section 110, a sound source image generation section 111, an extraction section 112, an analysis image generation section 113, and an estimation section 114 by operating according to a predetermined program.
- the vibration image generation unit 110 acquires vibration information including a time series of vibration levels of the test object 9 and a distribution of vibration levels for each vibration frequency based on an image D1 of the test object 9. Furthermore, the vibration image generation unit 110 generates a vibration image that visualizes the vibration level of each region to be inspected on the image D1 at the first natural frequency where the peak of the vibration level appears.
- the sound source image generation unit 111 generates a noise signal including a time series of the sound pressure level of the noise generated from the test object 9 and a distribution of the sound pressure level for each vibration frequency based on the recorded data D2 of the test object 9 recorded at the same time as the image D1. Get information. Further, the sound source image generation unit 111 generates a sound source image that visualizes the sound pressure level for each region on the image D1.
- the extraction unit 112 Based on the vibration information and the noise information, the extraction unit 112 extracts a first natural frequency included within a predetermined range from the second natural frequency at which the peak of the sound pressure level of the noise appears.
- the analysis image generation unit 113 generates an analysis image in which the vibration image corresponding to the first natural frequency extracted by the extraction unit 112 and the sound source image are superimposed.
- the estimation unit 114 estimates vibrations that cause noise based on the analysis image.
- the predetermined program executed by the processor 11 is stored in a computer-readable recording medium.
- the computer-readable recording medium refers to a magnetic disk, a magneto-optical disk, a CD-ROM, a DVD-ROM, a semiconductor memory, and the like.
- this computer program may be distributed to a computer via a communication line, and the computer receiving the distribution may execute the program.
- this program may be for realizing some of the functions described above.
- it may be a so-called difference file (difference program) that can realize the above-mentioned functions in combination with a program already recorded in the computer system.
- the memory 12 has a memory area necessary for the operation of the processor 11.
- the storage 13 is a so-called auxiliary storage device, and is, for example, an HDD (Hard Disk Drive), an SSD (Solid State Drive), or the like.
- the communication interface 14 is an interface for transmitting and receiving various signals with external devices (camera 2, microphone 3, etc.).
- the display device 15 is a display device that displays analysis images and the like, and is, for example, a liquid crystal display or an organic EL display.
- the input device 16 is an input device that receives operations from the user of the analysis device 10, and is, for example, a general mouse, keyboard, touch sensor, or the like.
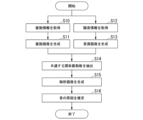
- FIG. 3 is a flowchart illustrating an example of processing by the analysis device according to the first embodiment of the present disclosure.
- the analysis device 10 generates an analysis image for analyzing the source position and cause of noise.
- the vibration image generation unit 110 acquires vibration information based on the image D1 of the inspection object 9 captured by the camera 2 (step S10).
- the vibration information includes a time series of vibration levels for each region (for example, for each pixel) on the image D1 and a distribution of vibration levels for each vibration frequency.
- the vibration image generation unit 110 performs known image processing on the image D1 to obtain a vibration level representing the amount of displacement of the inspection object 9 at each pixel of the image D1.
- the vibration image generation unit 110 also performs frequency analysis (for example, fast Fourier transform) on the time series of vibration levels to obtain a frequency spectrum representing the distribution of vibration levels for each vibration frequency.
- the vibration image generation unit 110 detects the first natural frequency at which the vibration level reaches its peak based on the frequency spectrum. Furthermore, the vibration image generation unit 110 generates a vibration image that visualizes the vibration level of each area on the image D1 at the first natural frequency (step S11).
- FIG. 4 is a diagram illustrating an example of a vibration image according to the first embodiment of the present disclosure.
- the vibration image generation unit 110 performs peak detection of the vibration level based on the frequency spectrum SP1 included in the vibration information D3 acquired from the image D1.
- four peaks P1a, P1b, P1c, and P1d appear in the frequency spectrum SP1.
- the frequencies f1a, f1b, f1c, and f1d corresponding to these peaks are the first natural frequencies indicating the vibration mode of the test object 9.
- the vibration image generation unit 110 generates a vibration image D4 for each of the first natural frequencies f1a, f1b, f1c, and f1d.
- the vibration image D4 is an image obtained by performing image processing (vibration amplification processing) on the image D1 to amplify the amount of displacement of each pixel by X times.
- the vibration image generation unit 110 can visually confirm the vibration state (vibration level of each pixel) at each time even if minute vibrations that are difficult to detect with the naked eye occur in the inspection object 9. It is possible to obtain a vibration image.
- the vibration image D4 may be a contour diagram representing the distribution of vibration levels at the first natural frequency. Furthermore, the vibration image D4 may be a vibration vector image in which a vector representing the direction and magnitude of vibration of each pixel at the first natural frequency is drawn.
- the sound source image generation unit 111 acquires noise information based on the recording data D2 recorded by each of the plurality of microphones 3 (step S12).
- the noise information includes a time series of sound pressure levels for each region (for each pixel) of the image D1 and a distribution of sound pressure levels for each frequency.
- the sound source image generation unit 111 obtains a time series of the sound pressure level of the noise at each pixel on the image D1 based on the sound pressure difference, time difference, etc. of the noise recorded in each recording data.
- the sound source image generation unit 111 also performs frequency analysis (for example, fast Fourier transform) on the time series of sound pressure levels to obtain a frequency spectrum representing the distribution of sound pressure levels for each frequency.
- frequency analysis for example, fast Fourier transform
- the recorded data D2 is recorded at the same time as the image D1. Further, a trigger signal indicating the analysis start timing may be recorded in the image D1 and the recorded data D2. In this case, the sound source image generation unit 111 synchronizes the image D1 and the recorded data D2 based on the trigger signal.
- the sound source image generation unit 111 detects the second natural frequency at which the vibration level reaches its peak based on the frequency spectrum.
- the sound source image generation unit 111 also generates a sound source image that visualizes the sound pressure level of each area on the image D1 at the second natural frequency (step S13).
- FIG. 5 is a diagram illustrating an example of a sound source image according to the first embodiment of the present disclosure.
- the sound source image generation unit 111 performs peak detection of the sound pressure level based on the frequency spectrum SP2 included in the noise information D5 acquired from the recorded data D2.
- two peaks P2a and P2b appear in the frequency spectrum SP2.
- the frequencies f2a and f2b corresponding to these peaks are the second natural frequencies related to the noise of the inspection object 9.
- the sound source image generation unit 111 generates a sound source image D6 for each of the second natural frequencies f2a and f2b.
- the sound source image D6 is, for example, a contour diagram representing the distribution of the sound pressure level at the second natural frequency.
- the extraction unit 112 extracts natural frequencies that substantially match in the structural system and the acoustic system based on the vibration information D3 and the noise information D5. Specifically, the extraction unit 112 compares the frequency spectra SP1 and SP2 of vibration and noise, and extracts the natural frequency at which the peaks of both the vibration level and the sound pressure level appear (step S15).
- FIG. 6 is a first diagram for explaining the functions of the analysis device according to the first embodiment of the present disclosure.
- the first natural frequencies at which the vibration level peaks P1a to P1d appear are frequencies f1a to f1d.
- the second natural frequencies at which the sound pressure level peaks P2a to P2b appear are frequencies f2a and f2b.
- the extracting unit 112 extracts a first natural frequency included in a predetermined range from a second natural frequency of noise, from among the plurality of first natural frequencies of vibration, into a first natural frequency that is common to both the vibration level and the sound pressure level. Extract as frequency.
- the predetermined range R centered on the second natural frequency f2b includes only one first natural frequency f1c where the peak P1c of the vibration level appears. In this case, the extraction unit 112 extracts the first natural frequency f1c.
- FIG. 7 is a second diagram for explaining the functions of the analysis device according to the first embodiment of the present disclosure.
- a plurality of vibration level peaks P1b, P1c, and P1d appear in a predetermined range R centered on the second natural frequency f2b.
- the extraction unit 112 extracts a plurality of first natural frequencies f1b, f1c, and f1d corresponding to these peaks P1b, P1c, and P1d.
- the extraction unit 112 determines that the noise indicated by this peak P2a has no correlation with vibrations (for example, it is a sound unrelated to vibrations such as wind noise), and 1. No natural frequency is extracted.
- the analysis image generation unit 113 generates an analysis image in which the sound source image D6 is superimposed on the vibration image D4 corresponding to the first natural frequency extracted by the extraction unit 112 (step S15).
- FIG. 8 is a diagram illustrating an example of an analysis image according to the first embodiment of the present disclosure. If there is only one first natural frequency extracted in step S14, the analytical image generation unit 113 generates one analytical image D7 in which the sound source image D6 is superimposed on the vibration image D4 corresponding to this first natural frequency. do. Further, as in the examples of FIGS. 7 and 8, when there are a plurality of first natural frequencies extracted in step S14, the analysis image generation unit 113 uses each vibration image D4 corresponding to the first natural frequency as a sound source image D6. A plurality of overlapping analysis images D7 are generated. Note that although the example in FIG. 8 shows an example in which a contour diagram is used as the vibration image D4, the present invention is not limited to this. In other embodiments, a vibration amplified image or a vibration vector image may be used as the vibration image D4.
- the analysis image generation unit 113 displays the generated analysis image D7 on the display device 15.
- the user of the analysis device 10 can refer to the analysis image D7 displayed on the display device 15 to confirm the source position of the noise and the vibration that causes the noise.
- the analysis image generation unit 113 may display them side by side on the display device 15 so that they can be compared, or may switch between each analysis image D7 according to the operation of the user of the analysis device 10. may be displayed.
- the analysis image generation unit 113 may also display information such as the frequency spectra SP1 and SP2 of vibration and noise, the first natural frequency used for the analysis image D7, and the second natural frequency, etc., along with the analysis image D7. good.
- the position where the vibration of the first natural frequency f1b among the three first natural frequencies occurs substantially coincides with the sound source position of the noise (the position where the sound pressure level is maximum). . Further, the positions where vibrations of the other first natural frequencies f1c and f1d occur are far from the source position of the noise. Therefore, the user of the analysis device 10 can estimate that this noise is caused by the vibration of the first natural frequency f1b.
- the analytical image generation unit 113 for example, for each of the plurality of vibrations represented by the first natural frequency extracted by the extraction unit 112, generates two points, one vibration and another vibration.
- a correlation analysis of the vibration data between the two images may be performed, and the results of this analysis may be displayed together with the analysis image D7.
- the user selects one or more vibrations that are estimated to be the cause of the noise by referring to the analysis result of the correlation analysis between the vibrations together with the analysis image D7. For example, in the analysis image D7 shown in FIG.
- the vibration position of the first natural frequency f1b substantially coincides with the sound source position of the noise, and the correlation between the first natural frequency f1b and the first natural frequency f1c is is larger than a preset value.
- the user estimates that two vibrations, the first natural frequency f1b and the first natural frequency f1c, are candidates for the cause of the noise based on the analysis image D7 and the analysis results of the correlation analysis. do.
- the estimation of the cause of noise generation may be performed automatically by the analysis device 10 instead of being performed by the user visually observing the analysis image D7.
- the estimating unit 114 compares the regions (pixels) where the sound pressure level and vibration level are maximum in each analysis image D7, and determines whether the vibration of the first natural frequency shown in each analysis image D7 is noise. Estimate whether this is the cause of the problem. If the distance between the region of the analysis image D7 where the sound pressure level is maximum (sound source position) and the region where the vibration level is the maximum (vibration position) is equal to or less than a threshold value, the estimation unit 114 determines that the analysis image D7 It is estimated that the vibration of the first natural frequency represented by is the cause of the noise.
- the region where the sound pressure level is maximum is the region where the maximum value of the sound pressure level is detected, or the region where a value of up to X% (for example, 90%) from the maximum value of the sound pressure level is detected. .
- the estimating section 114 may further estimate the vibration that causes the noise based on the analysis result.
- the vibration position of the first natural frequency f1b substantially coincides with the sound source position of the noise, and the correlation between the first natural frequency f1b and the first natural frequency f1c is is larger than a preset value.
- the estimation unit 114 determines that the two vibrations represented by the first natural frequency f1b and the first natural frequency f1c are the cause of the noise, based on the analysis image D7 and the analysis result of the correlation analysis. It may be assumed that it is a candidate. Thereby, when noise occurs at a position far from the vibration position, it is possible to prevent this vibration position from being excluded from candidates for the cause of the noise.
- the estimation unit 114 displays on the display device 15 an analysis image D7 showing the vibration estimated to be the cause of the noise, along with the estimation result.
- the estimation unit 114 determines that the distance between the sound source position and the vibration position is equal to or less than the threshold value for the plurality of analysis images D7, the estimation unit 114 considers the plurality of vibrations shown in the analysis images D7 as candidate causes of noise. It may be estimated as In this case, the estimation unit 114 may display the plurality of estimation results and the analysis image D7 on the display device 15 to prompt the user to confirm. By narrowing down the candidates and displaying them in this way, the user can reduce the effort of checking all the analysis images D7.
- the analysis device 10 includes the vibration image generation unit 110 that generates the vibration image D4 that visualizes the vibration level of each region of the inspection object 9, and the sound pressure level of each region of the inspection object 9. a sound source image generation unit 111 that generates a sound source image D6 that visualizes the sound source image D6; an extraction unit 112 that extracts a first natural frequency where the peaks of vibration level and sound pressure level appear in common; It includes an analysis image generation unit 113 that generates an analysis image in which a corresponding vibration image D4 and a sound source image D6 are superimposed.
- the analysis device 10 can provide the user with an analysis image D7 in which the correlation between the intensity of vibration and noise, the correlation between the vibration position and the sound source position of the noise, etc. can be visually recognized. I can do it. Further, since the user can easily estimate the vibration that causes the noise by referring to the analysis image D7, the user can take appropriate measures against the noise at an early stage.
- the extracting unit 112 extracts a plurality of first natural frequencies included within a predetermined range from the second natural frequency
- the analytical image generating unit 113 extracts a plurality of first natural frequencies included in a predetermined range from the second natural frequency
- an analysis image generating unit 113 extracts a plurality of first natural frequencies that correspond to each of the plurality of first natural frequencies.
- An analysis image D7 is generated.
- the analysis device 10 can generate an analysis image D7 for each vibration mode.
- the user can check the correlation between the vibration position and the source position of the noise using the analysis image D7.
- the causative vibration can be estimated with high accuracy.
- the analysis device 10 further includes an estimation unit 114 that automatically estimates vibrations that cause noise based on the analysis image D7.
- the analysis device 10 can make the user recognize the vibration that is estimated to be the cause of the noise. Furthermore, even if a plurality of analysis images D7 are generated, the analysis device 10 allows the user to check all the analysis images D7 by presenting the analysis image D7 corresponding to the vibration estimated as the cause to the user. The effort can be reduced.
- the estimation unit 114 estimates that the vibration of the first natural frequency shown in the analysis image D7 is the cause of the noise. Furthermore, if the distance between the vibration position and the sound source position in the analysis image D7 exceeds a threshold, the estimation unit 114 estimates that the vibration at the first natural frequency shown in the analysis image D7 is not the cause of the noise.
- the analysis device 10 can accurately estimate whether the vibration in each analysis image D7 is the cause of the noise from the correlation between the vibration position shown in the analysis image and the sound source position.
- the extraction unit 112 extracts the first natural frequency included within a predetermined range from the second natural frequency of noise.
- the extraction unit 112 when the frequency that is a predetermined times (n times) the first natural frequency is included within a predetermined range from the second natural frequency, the extraction unit 112 according to the present embodiment extracts the first natural frequency from the second natural frequency. further extract.
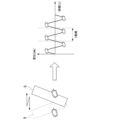
- FIG. 9 is a first diagram for explaining the functions of the analysis device according to the second embodiment of the present disclosure.
- the inspection object 9 may collide with structures on both sides due to vibration and generate noise.
- noise is generated twice during one period of vibration (one period of the first natural frequency). In other words, noise is generated at twice the frequency of the first natural frequency of vibration.
- FIG. 10 is a second diagram for explaining the functions of the analysis device according to the second embodiment of the present disclosure.
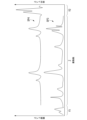
- FIG. 10 shows frequency spectra SP1 and SP2 of the vibration and noise illustrated in FIG. 9.
- a frequency f1c' that is twice the first natural frequency f1c at which the peak P1c appears is included within the predetermined range R of the second natural frequency f2b of the noise.
- the extraction unit 112 extracts only the first natural frequency f1c as a natural frequency that has a correlation with the second natural frequency f2b of the noise.
- the analysis device 10 can generate an analysis image D7 representing vibration candidates that cause noise.
- the analysis image generation unit 113 when there are a plurality of first natural frequencies, the analysis image generation unit 113 generates a plurality of analysis images D7 in which the sound source image D6 is superimposed on each of the vibration images D4 corresponding to the first natural frequencies.
- the analysis device 10 according to the second embodiment can generate an analysis image D7 representing candidates for vibrations that cause noise, taking into account the possibility that noise is generated at a period n times the frequency of vibrations. explained.
- the analysis image generation unit 113 according to the present embodiment superimposes and displays the frequency spectra of vibration and noise used when creating the analysis image, and displays an analysis image related to the peak of the frequency spectrum specified by the user. Display.
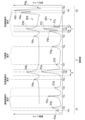
- FIG. 11 is a first diagram for explaining the functions of the analysis device according to the third embodiment of the present disclosure.
- the analytical image generation unit 113 calculates vibrations included in the vibration information D3 acquired from the image D1, with the horizontal axis representing the frequency, the first vertical axis representing the vibration level, and the second vertical axis representing the sound pressure level.
- a frequency spectrum obtained by overlapping the frequency spectrum SP3 of the noise information D5 obtained from the recording data D2 and the frequency spectrum SP4 of the noise included in the noise information D5 acquired from the recorded data D2 is displayed.
- the display layout in FIG. 11 is an example, and the display layout is not limited to this.
- the following two reasons can be considered for displaying a frequency spectrum with a wide frequency range by overlapping two frequency spectra.
- vibration when the frequency is low, the amount of displacement of the inspection object is large, and it is easy to determine whether it is vibration. In the case of high frequencies, it may be difficult to determine vibration because the amount of displacement of the object to be inspected is small.
- sound pressure in the case of low frequencies, as the wavelength becomes longer, it may be difficult to identify the location where the noise is generated. In the case of high frequencies, the wavelength is short, so it is easy to identify the location where the noise is occurring. That is, the lower the frequency of the inspection target, the easier it is to determine vibration, and the higher the frequency, the easier it is to identify the location where the noise is occurring.
- the inspection object 9 may have a vibration level or sound pressure level peak in the ranges Y1 and Y2. As shown in FIG. 11, in an example according to the present embodiment, the peak of the sound pressure level is seen on the high frequency side (range Y2), and the peak of the vibration level is seen on the low frequency side (range Y1).
- the analysis image generation unit 113 When generating the analysis image D7 (see FIG. 8), the analysis image generation unit 113 according to the present embodiment takes into consideration that peaks of vibration level or sound pressure level may exist in the ranges Y1 and Y2, and takes SP3 and SP4 into consideration. Display the frequency spectrum in a frequency range that includes and.
- FIG. 12 is a second diagram for explaining the functions of the analysis device according to the third embodiment of the present disclosure.
- the user specifies the peak of the vibration level or sound pressure level from the frequency spectrum displayed by the analysis image generation unit 113.
- the analysis image generation unit 113 additionally displays an image related to the peak of the specified frequency spectrum together with the frequency spectrum.
- the analysis image generation unit 113 superimposes the sound source image D6 at f4b on the vibration image D4 corresponding to this first natural frequency.
- One additional image D7 is displayed.
- the analysis image generation unit 113 additionally displays one analysis image D7 if there is an analysis image D7 related to the vibration image D4 corresponding to this first natural frequency f3e.
- the analysis image generation unit 113 since there are a plurality of first natural frequencies extracted in step S14, the analysis image generation unit 113 generates a plurality of analysis images in which the sound source image D6 at f4d is superimposed on each vibration image D4 corresponding to the first natural frequency. Display D7 additionally.
- the analysis image generation unit 113 When the peak P3h, P3i, or P3j of SP3 is specified, the analysis image generation unit 113 generates a plurality of analysis images D7 associated with each vibration image D4 corresponding to the first natural frequency (f3h, f3i, f3j), These analysis images D7 are additionally displayed.
- the analysis image is generated.
- the unit 113 additionally displays the vibration image D4. The same applies when P3d, P3f, and P3g are specified.
- the analysis image D7 is not additionally displayed.
- the analysis image generation unit 113 additionally displays the sound source image D6.
- P4c, P4e, P4f, and P4g are specified.
- the analysis device 10 multiplies a certain first natural frequency by n, and if the second natural frequency f4a falls within a predetermined range, the analysis device 10 calculates a certain first natural frequency and a second natural frequency f4a. It is possible to additionally display an analysis image D7 representing candidates for vibrations that cause noise related to. In that case, the user may set whether to display the analysis image D7 representing the candidate.
- the analysis image generation unit 113 When an arbitrary natural frequency is specified in ranges Y1 and Y2 where the frequency spectra of SP3 and SP4 do not overlap, the analysis image generation unit 113 additionally displays the next image together with the frequency spectrum.
- the analysis image generation unit 113 When the peak P3a or P3b of SP3 is specified, if the peak of SP4 does not exist in the range Y1, the analysis image generation unit 113 additionally displays the vibration image D4.
- peak P4e, P4f, or P4g of SP4 is specified, if the peak of SP1 does not exist in range Y2, analysis image generation unit 113 additionally displays sound source image D6.
- the peak of SP3 is within a predetermined range of one of the second natural frequencies as a result of multiplying the first natural frequency in the range Y1 by n. If the vibration is included in the first natural frequency and the second natural frequency, it is also possible to generate an analysis image D7 representing a candidate vibration that causes noise.
- the analysis device 10 can provide the user with a frequency spectrum with a wide frequency range and an image related to the peak of the frequency spectrum.
- the user can refer to images related to that peak and estimate the cause of the noise or vibration. .
- the analysis device (10) calculates the time series of the vibration level of the test object (9) and the vibration level for each vibration frequency based on the image taken of the test object (9).
- a generation unit (110) generates a time series of the sound pressure level of the noise generated from the inspection object (9) and a distribution of the sound pressure level for each vibration frequency based on the recorded data of the inspection object (9) recorded at the same time as the image.
- a sound source image generation unit (111) that acquires noise information including noise information and generates a sound source image that visualizes the sound pressure level for each region on the image; an extraction unit (112) that extracts a first natural frequency included within a predetermined range from a second natural frequency that appears, and an analysis in which a vibration image corresponding to the extracted first natural frequency and a sound source image are superimposed.
- An analysis image generation unit (113) that generates an image.
- the analysis device can provide the user with an analysis image that allows the user to visually confirm the correlation between the intensity of vibration and noise, the correlation between the vibration position and the sound source position of the noise, etc. . Further, since the user can easily estimate the vibration that causes the noise by referring to the analysis image, the user can take appropriate measures against the noise at an early stage.
- the extraction unit (112) includes a plurality of first natural frequencies included within a predetermined range from the second natural frequency.
- the natural frequencies are extracted, and the analysis image generation section generates a plurality of analysis images corresponding to each of the plurality of first natural frequencies.
- the analysis device can generate an analysis image for each vibration mode.
- the user can check the correlation between the vibration position and the source position of the noise using the analysis image to check the cause of the noise. It is possible to estimate the vibration with high accuracy.
- the extraction unit (112) has a frequency that is the first natural frequency multiplied by a predetermined value. If the first natural frequency is within a predetermined range from the second natural frequency, the first natural frequency is extracted.
- the analysis device can generate an analysis image representing candidates for vibrations that cause noise, taking into account the possibility that noise will occur at a frequency that is a predetermined times the frequency of vibrations.
- the analysis device (10) estimates vibrations that cause noise based on the analysis image.
- the apparatus further includes a section (114).
- the analysis device can make the user recognize vibrations that are presumed to be the cause of the noise.
- the analysis device presents the user with the analysis image corresponding to the vibration estimated as the cause, thereby reducing the user's effort to check all the analysis images. be able to.
- the estimating unit (114) determines the area where the sound pressure level is maximum and the vibration level in the analysis image. If the distance to the maximum region is less than or equal to the threshold, it is estimated that the vibration of the first natural frequency shown in the analysis image is the cause of the noise.
- the analysis device can accurately estimate that the vibration in the analysis image is the cause of the noise from the correlation between the vibration position shown in the analysis image and the sound source position.
- the estimating unit (114) determines a region where the sound pressure level is maximum in the analysis image; If the distance to the region where the vibration level is maximum exceeds a threshold value, it is estimated that the vibration of the first natural frequency shown in the analysis image is not the cause of the noise.
- the analysis device can accurately estimate from the correlation between the vibration position shown in the analysis image and the sound source position that the vibration in this analysis image is not the cause of the noise.
- the analysis image generation unit (113) generates frequency spectra of vibration and noise on the same axis. Overlay images to display images associated with the specified peaks in the frequency spectrum.
- the analysis device can provide the user with a frequency spectrum with a wide frequency range and an image related to the peak of the frequency spectrum.
- the inspection target may have a peak in vibration level or sound pressure level within a range where the frequency spectra of vibration and noise do not overlap. Even in a range where the frequency spectra of vibration and noise do not overlap, the user can refer to the frequency spectrum and an image related to the peak of the frequency spectrum and estimate the cause of the noise or vibration.
- the analysis method includes a time series of the vibration level of the inspection object (9) and a vibration level of each vibration frequency based on images taken of the inspection object (9). a step of acquiring vibration information including distribution and generating a vibration image visualizing the vibration level of each region of the inspection target (9) on the image at the first natural frequency where the peak of the vibration level appears; Based on the recorded data of the test object (9) recorded at the same time, noise information including the time series of the sound pressure level of the noise generated from the test object (9) and the distribution of the sound pressure level for each vibration frequency is acquired, and an image is obtained.
- the method includes a step of extracting one natural frequency, and a step of generating an analysis image in which a vibration image corresponding to the extracted first natural frequency and a sound source image are superimposed.
- the program generates a time series of vibration levels of the inspection object (9) and a distribution of vibration levels for each vibration frequency based on images taken of the inspection object (9). and generating a vibration image that visualizes the vibration level of each region of the inspection target (9) on the image at the first natural frequency where the peak of the vibration level appears; Based on the recorded data of the inspection object (9), noise information including the time series of the sound pressure level of the noise generated from the inspection object (9) and the distribution of the sound pressure level for each vibration frequency is acquired, and the noise information is displayed on the image.
- the analysis device is caused to execute a step of extracting a natural frequency and a step of generating an analysis image in which a vibration image corresponding to the extracted first natural frequency and a sound source image are superimposed.
- the correlation between the sound source of the noise to be inspected and the vibration can be visualized.
Landscapes
- Physics & Mathematics (AREA)
- General Physics & Mathematics (AREA)
- Engineering & Computer Science (AREA)
- Theoretical Computer Science (AREA)
- Measurement Of Mechanical Vibrations Or Ultrasonic Waves (AREA)
Abstract
Description
本願は、2022年3月9日に、日本に出願された特願2022-036498号に基づき優先権を主張し、その内容をここに援用する。
以下、本開示の第1の実施形態に係る解析システム1および解析装置10について、図1~図8を参照しながら説明する。
図1は、本開示の第1の実施形態に係る解析システムの全体構成を示す図である。
解析システム1は、検査対象9の振動および騒音を計測し、騒音の音源位置の特定およびメカニズム(騒音の原因となる振動等)を視覚的に確認可能な解析画像を出力するためのシステムである。検査対象9は、例えば、モータやガスタービンのような回転機械等である。図1には、検査対象9が回転機械の回転軸である例が示されている。また、他の実施形態では、検査対象9は、ガスタービンの回転翼であってもよいし、配管のような構造物であってもよい。
図2は、本開示の第1の実施形態に係る解析装置の機能構成を示すブロック図である。
図2に示すように、解析装置10は、プロセッサ11と、メモリ12と、ストレージ13と、通信インタフェース14と、表示装置15と、入力装置16とを備えている。
図3は、本開示の第1の実施形態に係る解析装置の処理の一例を示すフローチャートである。
以下、図3を参照しながら、解析装置10が騒音の音源位置および原因を解析するための解析画像を生成する処理の一例について説明する。
図4に示すように、振動画像生成部110は、画像D1から取得した振動情報D3に含まれる周波数スペクトルSP1に基づいて、振動レベルのピーク検出を行う。図4の例では、周波数スペクトルSP1には4つのピークP1a、P1b、P1c、P1dが現れている。これらピークに対応する振動数f1a、f1b、f1c、f1dが、検査対象9の振動モードを示す第1固有振動数である。また、振動画像生成部110は、第1固有振動数f1a、f1b、f1c、f1dそれぞれについて、振動画像D4を生成する。
図5に示すように、音源画像生成部111は、録音データD2から取得した騒音情報D5に含まれる周波数スペクトルSP2に基づいて、音圧レベルのピーク検出を行う。図5の例では、周波数スペクトルSP2には2つのピークP2a、P2bが現れている。これらピークに対応する振動数f2a、f2bが、検査対象9の騒音に関する第2固有振動数である。また、音源画像生成部111は、第2固有振動数f2a、f2bそれぞれについて、音源画像D6を生成する。音源画像D6は、例えば、第2固有振動数における音圧レベルの分布を表すコンター図である。
図6に例示する振動の周波数スペクトルSP1によれば、振動レベルのピークP1a~P1dが現れる第1固有振動数は振動数f1a~f1dである。また、図6に例示する騒音の周波数スペクトルSP2によれば、音圧レベルのピークP2a~P2bが現れる第2固有振動数は振動数f2a、f2bである。抽出部112は、振動の複数の第1固有振動数のうち、騒音の第2固有振動数から所定範囲に含まれる第1固有振動数を、振動レベルおよび音圧レベルが共通して大きくなる固有振動数として抽出する。図6の例では、第2固有振動数f2bを中心とした所定範囲Rに、振動レベルのピークP1cが現れる第1固有振動数f1cが1つのみ含まれている。この場合、抽出部112は、第1固有振動数f1cを抽出する。
図7の例では、第2固有振動数f2bを中心とした所定範囲Rに、複数の振動レベルのピークP1b、P1c、P1dが現れる。この場合、抽出部112は、これらピークP1b、P1c、P1dに対応する複数の第1固有振動数f1b、f1c、f1dを抽出する。
ステップS14で抽出した第1固有振動数が1つのみである場合、解析画像生成部113はこの第1固有振動数に対応する振動画像D4に音源画像D6を重ねた解析画像D7を1つ生成する。また、図7および図8の例のように、ステップS14で抽出した第1固有振動数が複数ある場合、解析画像生成部113は第1固有振動数に対応する振動画像D4それぞれに音源画像D6を重ねた複数の解析画像D7を生成する。なお、図8の例では、振動画像D4としてコンター図を用いる例が示されているが、これに限られることはない。他の実施形態では、振動画像D4として、振動増幅映像または振動ベクトル画像を用いてもよい。
以上のように、本実施形態に係る解析装置10は、検査対象9の領域毎の振動レベルを可視化した振動画像D4を生成する振動画像生成部110と、検査対象9の領域毎の音圧レベルを可視化した音源画像D6を生成する音源画像生成部111と、振動レベルおよび音圧レベルのピークが共通して現れる第1固有振動数を抽出する抽出部112と、抽出した第1固有振動数に対応する振動画像D4と、音源画像D6とを重ねた解析画像を生成する解析画像生成部113と、を備える。
次に、本開示の第2の実施形態に係る解析システム1および解析装置10について、図9~図10を参照しながら説明する。
第1の実施形態と共通の構成要素には同一の符号を付して詳細説明を省略する。
図9に示すように、検査対象9は、振動により両側の構造物に衝突して騒音を発生する場合がある。このとき、振動の1周期(第1固有振動数の1周期)の間に、騒音が2回発生する。つまり、振動の第1固有振動数に対して、2倍の振動数で騒音が発生する。
図10には、図9に例示した振動および騒音を周波数スペクトルSP1、SP2が示されている。図10の例では、振動レベルの複数のピークのうち、ピークP1cが現れる第1固有振動数f1cの2倍の振動数f1c´が、騒音の第2固有振動数f2bの所定範囲R内に含まれるとする。また、他の第1固有振動数f1a、f1b、f1dは、n倍しても第2固有振動数の所定範囲R内に含まれないとする。この場合、抽出部112は、第1固有振動数f1cのみを騒音の第2固有振動数f2bに相関がある固有振動数として抽出する。
次に、本開示の第3の実施形態に係る解析システム1および解析装置10について、図11~図12を参照しながら説明する。
第1の実施形態と共通の構成要素には同一の符号を付して詳細説明を省略する。
第2の実施形態に係る解析装置10は、振動のn倍の周期で騒音が発生する可能性を考慮して、騒音の原因となる振動の候補を表す解析画像D7を生成することができることを説明した。
これらに対し、本実施形態に係る解析画像生成部113は、解析画像を作成する際に用いた振動および騒音の周波数スペクトルを重ねて表示し、ユーザが指定した周波数スペクトルのピークに関連した解析画像を表示する。
解析画像生成部113は、図11に示すように、横軸を振動数とし、第一縦軸を振動レベル、第二縦軸を音圧レベルとして画像D1から取得した振動情報D3に含まれる振動の周波数スペクトルSP3、録音データD2から取得した騒音情報D5に含まれる騒音の周波数スペクトルSP4を重ねた周波数スペクトルを表示する。なお、図11の表示レイアウトは一例であり、これに限定するものではない。
振動に関しては、低い周波数の場合には検査対象の変位量が大きく、振動の判断を行いやすい。高い周波数の場合、検査対象の変位量が小さいため、振動の判断がしにくいことがある。
音圧に関しては、低い周波数の場合には波長が長くなるにつれ、騒音の発生箇所が特定しにくいことがある。高い周波数の場合、波長が短いため騒音の発生箇所が特定しやすい。
すなわち、検査対象は低い周波数であるほど振動の判断をしやすく、高い周波数であるほど騒音の発生箇所を特定しやすい。
このように、振動と音圧との検出可能な範囲が異なるため、図11に示す範囲Y1、Y2のように、各周波数スペクトルの各領域によっては、振動の周波数スペクトルあるいは騒音の周波数スペクトルどちらかの情報が不足している場合も考えうる。
例えば、Y1は振動の周波数スペクトルSP3が存在し、騒音の周波数スペクトルSP4の情報が不足している。
例えば、Y2は騒音の周波数スペクトルSP4が存在し、振動の周波数スペクトルSP3の情報が不足している。
これにより、振動の周波数スペクトルSP3、騒音の周波数スペクトルSP4の周波数スペクトルが重複した範囲Zより外の周波数レンジ(範囲Y1、Y2と示す)であっても、振動または騒音の発生箇所の特定ができることが好ましい。
SP3のピークP3eを指定した場合、解析画像生成部113はこの第1固有振動数f3eに対応する振動画像D4に関連した解析画像D7があれば、解析画像D7を1つ追加で表示する。
SP3のピークP3h、P3iあるいはP3jを指定した場合、解析画像生成部113は第1固有振動数(f3h、f3i、f3j)に対応する振動画像D4それぞれに関連した複数の解析画像D7があれば、それら解析画像D7を追加で表示する。
P3d、P3f、P3gを指定した場合も同様である。
P4c、P4e、P4f、P4gを指定した場合も同様である。
また、解析装置10は、とある第1固有振動数をn倍し、第2固有振動数f4aの所定範囲内に含まれた場合、とある第1固有振動数と第2固有振動数f4aとに関連した騒音の原因となる振動の候補を表す解析画像D7を追加で表示することができる。その場合、候補を表す解析画像D7を表示するかはユーザが設定してもよい。
SP3のピークP3aもしくはP3bを指定した場合、SP4のピークが範囲Y1に存在しなければ、解析画像生成部113は振動画像D4を追加で表示する。
SP4のピークP4e、P4f、あるいはP4gを指定した場合、SP1のピークが範囲Y2に存在しなければ、解析画像生成部113は音源画像D6を追加で表示する。
上述の実施形態に記載の解析装置、解析方法、およびプログラムは、例えば以下のように把握される。
2 カメラ
3 マイクロホン
9 検査対象
10 解析装置
11 プロセッサ
110 振動画像生成部
111 音源画像生成部
112 抽出部
113 解析画像生成部
114 推定部
12 メモリ
13 ストレージ
14 通信インタフェース
15 表示装置
16 入力装置
Claims (9)
- 検査対象を撮影した画像に基づいて前記検査対象の振動レベルの時系列、および振動数毎の振動レベルの分布を含む振動情報を取得して、前記振動レベルのピークが現れる第1固有振動数における、前記画像上の前記検査対象の領域毎の振動レベルを可視化した振動画像を生成する振動画像生成部と、
前記画像と同時に録音した前記検査対象の録音データに基づいて前記検査対象から生じる騒音の音圧レベルの時系列、および振動数毎の音圧レベルの分布を含む騒音情報を取得して、前記画像上の前記領域毎の音圧レベルを可視化した音源画像を生成する音源画像生成部と、
前記振動情報および前記騒音情報に基づいて、前記騒音の音圧レベルのピークが現れる第2固有振動数から所定範囲内に含まれる第1固有振動数を抽出する抽出部と、
抽出した前記第1固有振動数に対応する前記振動画像と、前記音源画像とを重ねた解析画像を生成する解析画像生成部と、
を備える解析装置。 - 前記抽出部は、前記第2固有振動数から所定範囲内に含まれる複数の前記第1固有振動数を抽出し、
前記解析画像生成部は、複数の前記第1固有振動数それぞれに対応する複数の前記解析画像を生成する、
請求項1に記載の解析装置。 - 前記抽出部は、前記第1固有振動数を所定倍した振動数が、前記第2固有振動数から所定範囲内に含まれる場合、当該第1固有振動数を抽出する、
請求項1または2に記載の解析装置。 - 前記解析画像に基づいて、前記騒音の原因となる振動を推定する推定部をさらに備える、
請求項1から3の何れか一項に記載の解析装置。 - 前記推定部は、前記解析画像において前記音圧レベルが最大となる領域と、前記振動レベルが最大となる領域との間の距離が閾値以下である場合、当該解析画像で示される第1固有振動数の振動が前記騒音の原因であると推定する、
請求項4に記載の解析装置。 - 前記推定部は、前記解析画像において前記音圧レベルが最大となる領域と、前記振動レベルが最大となる領域との間の距離が閾値を超える場合、当該解析画像で示される第1固有振動数の振動が前記騒音の原因ではないと推定する、
請求項4または5に記載の解析装置。 - 前記解析画像生成部は、振動および騒音の周波数スペクトルを同一軸上で重ねて表示し、指定した前記周波数スペクトルのピークに関連した画像を表示する、
請求項1または6に記載の解析装置。 - 検査対象を撮影した画像に基づいて前記検査対象の振動レベルの時系列、および振動数毎の振動レベルの分布を含む振動情報を取得して、前記振動レベルのピークが現れる第1固有振動数における、前記画像上の前記検査対象の領域毎の振動レベルを可視化した振動画像を生成するステップと、
前記画像と同時に録音した前記検査対象の録音データに基づいて前記検査対象から生じる騒音の音圧レベルの時系列、および振動数毎の音圧レベルの分布を含む騒音情報を取得して、前記画像上の前記領域毎の音圧レベルを可視化した音源画像を生成するステップと、
前記振動情報および前記騒音情報に基づいて、前記騒音の音圧レベルのピークが現れる第2固有振動数から所定範囲内に含まれる第1固有振動数を抽出するステップと、
抽出した前記第1固有振動数に対応する前記振動画像と、前記音源画像とを重ねた解析画像を生成するステップと、
を有する解析方法。 - 検査対象を撮影した画像に基づいて前記検査対象の振動レベルの時系列、および振動数毎の振動レベルの分布を含む振動情報を取得して、前記振動レベルのピークが現れる第1固有振動数における、前記画像上の前記検査対象の領域毎の振動レベルを可視化した振動画像を生成するステップと、
前記画像と同時に録音した前記検査対象の録音データに基づいて前記検査対象から生じる騒音の音圧レベルの時系列、および振動数毎の音圧レベルの分布を含む騒音情報を取得して、前記画像上の前記領域毎の音圧レベルを可視化した音源画像を生成するステップと、
前記振動情報および前記騒音情報に基づいて、前記騒音の音圧レベルのピークが現れる第2固有振動数から所定範囲内に含まれる第1固有振動数を抽出するステップと、
抽出した前記第1固有振動数に対応する前記振動画像と、前記音源画像とを重ねた解析画像を生成するステップと、
を解析装置に実行させるプログラム。
Priority Applications (2)
| Application Number | Priority Date | Filing Date | Title |
|---|---|---|---|
| JP2024506344A JP7720987B2 (ja) | 2022-03-09 | 2023-03-07 | 解析装置、解析方法、およびプログラム |
| US18/843,834 US20250189362A1 (en) | 2022-03-09 | 2023-03-07 | Analysis device, analysis method, and program |
Applications Claiming Priority (2)
| Application Number | Priority Date | Filing Date | Title |
|---|---|---|---|
| JP2022036498 | 2022-03-09 | ||
| JP2022-036498 | 2022-03-09 |
Publications (1)
| Publication Number | Publication Date |
|---|---|
| WO2023171663A1 true WO2023171663A1 (ja) | 2023-09-14 |
Family
ID=87937327
Family Applications (1)
| Application Number | Title | Priority Date | Filing Date |
|---|---|---|---|
| PCT/JP2023/008558 Ceased WO2023171663A1 (ja) | 2022-03-09 | 2023-03-07 | 解析装置、解析方法、およびプログラム |
Country Status (3)
| Country | Link |
|---|---|
| US (1) | US20250189362A1 (ja) |
| JP (1) | JP7720987B2 (ja) |
| WO (1) | WO2023171663A1 (ja) |
Families Citing this family (1)
| Publication number | Priority date | Publication date | Assignee | Title |
|---|---|---|---|---|
| US12607562B2 (en) * | 2024-05-10 | 2026-04-21 | Digital Harmonic Llc | System and method for measuring, storing, collating, and displaying vibrational spectra of living cells and tissue using digital comparative precision noise reduction |
Citations (4)
| Publication number | Priority date | Publication date | Assignee | Title |
|---|---|---|---|---|
| JP2010091282A (ja) * | 2008-10-03 | 2010-04-22 | Nissan Motor Co Ltd | 音源探査装置および音源探査方法 |
| JP2013167556A (ja) * | 2012-02-16 | 2013-08-29 | Ono Sokki Co Ltd | 音響計測装置 |
| JP2018054378A (ja) * | 2016-09-27 | 2018-04-05 | 株式会社小野測器 | 振動源探査装置及び振動源探査方法 |
| JP2021179321A (ja) * | 2020-05-11 | 2021-11-18 | パナソニックIpマネジメント株式会社 | 状態管理方法、プログラム、及び状態管理システム |
-
2023
- 2023-03-07 JP JP2024506344A patent/JP7720987B2/ja active Active
- 2023-03-07 WO PCT/JP2023/008558 patent/WO2023171663A1/ja not_active Ceased
- 2023-03-07 US US18/843,834 patent/US20250189362A1/en active Pending
Patent Citations (4)
| Publication number | Priority date | Publication date | Assignee | Title |
|---|---|---|---|---|
| JP2010091282A (ja) * | 2008-10-03 | 2010-04-22 | Nissan Motor Co Ltd | 音源探査装置および音源探査方法 |
| JP2013167556A (ja) * | 2012-02-16 | 2013-08-29 | Ono Sokki Co Ltd | 音響計測装置 |
| JP2018054378A (ja) * | 2016-09-27 | 2018-04-05 | 株式会社小野測器 | 振動源探査装置及び振動源探査方法 |
| JP2021179321A (ja) * | 2020-05-11 | 2021-11-18 | パナソニックIpマネジメント株式会社 | 状態管理方法、プログラム、及び状態管理システム |
Also Published As
| Publication number | Publication date |
|---|---|
| JP7720987B2 (ja) | 2025-08-08 |
| US20250189362A1 (en) | 2025-06-12 |
| JPWO2023171663A1 (ja) | 2023-09-14 |
Similar Documents
| Publication | Publication Date | Title |
|---|---|---|
| US9240040B2 (en) | Method and system for predicting errors on components of rotating machines by thermography | |
| JP2016502750A (ja) | 欠陥特定情報を用いるウェハ上の欠陥の検出 | |
| JP7720987B2 (ja) | 解析装置、解析方法、およびプログラム | |
| US20200301126A1 (en) | Method of operating observation device, observation device, and recording medium | |
| JP2019219377A (ja) | 距離差−周波数分析を用いた配管の漏洩感知装置および方法 | |
| JP4745170B2 (ja) | 漏水検出装置および漏水検出方法 | |
| WO2020050192A1 (ja) | 流体漏洩診断装置、流体漏洩診断システム、流体漏洩診断方法、及び、流体漏洩診断プログラムが格納された記録媒体 | |
| US10386409B2 (en) | Non-destructive determination of components of integrated circuits | |
| JP2020024286A (ja) | 計測装置、計測装置の作動方法、およびプログラム | |
| JP7009882B2 (ja) | 表示プログラム、表示方法、及び表示装置 | |
| US11790505B2 (en) | Information processing apparatus, information processing method, and information processing system | |
| JP2021183936A (ja) | 漏水位置推定システム、漏水位置推定方法、及び漏水位置推定プログラム | |
| JP2010198089A (ja) | 位置検出方法およびプログラム、並びに測定装置 | |
| JP6773026B2 (ja) | 漏洩検知装置、漏洩検知システム、漏洩検知方法及びコンピュータ読み取り可能記録媒体 | |
| US12111291B2 (en) | Structure diagnosis apparatus, structure diagnosis method, and computer-readable recording medium | |
| CN111684376A (zh) | 序列数据分析装置、序列数据分析方法以及序列数据分析程序 | |
| US11333580B2 (en) | Anomaly detecting device, anomaly detection method and program | |
| JP7095743B2 (ja) | 流体漏洩診断装置、流体漏洩診断システム、流体漏洩診断方法、及び、流体漏洩診断プログラム | |
| JP2023140760A (ja) | フィン検査システム、フィン検査方法、及びプログラム | |
| US20240302244A1 (en) | Liquid leak detection device, liquid leak detection system, and liquid leak detection method | |
| KR20230105812A (ko) | 내시경 영상을 이용한 용종 진단 방법, 장치 및 프로그램 | |
| JP5728977B2 (ja) | 作業支援装置、作業支援プログラムおよび作業支援方法 | |
| JP2009193099A (ja) | 検査配点方法および装置 | |
| KR20120029679A (ko) | 초음파 신호를 이용한 검사조직 검출 장치 및 방법 | |
| JP2025005088A (ja) | 光ファイバセンシングシステム、光ファイバセンシング装置、及びルート特定方法 |
Legal Events
| Date | Code | Title | Description |
|---|---|---|---|
| 121 | Ep: the epo has been informed by wipo that ep was designated in this application |
Ref document number: 23766839 Country of ref document: EP Kind code of ref document: A1 |
|
| ENP | Entry into the national phase |
Ref document number: 2024506344 Country of ref document: JP Kind code of ref document: A |
|
| WWE | Wipo information: entry into national phase |
Ref document number: 18843834 Country of ref document: US |
|
| NENP | Non-entry into the national phase |
Ref country code: DE |
|
| 122 | Ep: pct application non-entry in european phase |
Ref document number: 23766839 Country of ref document: EP Kind code of ref document: A1 |
|
| WWP | Wipo information: published in national office |
Ref document number: 18843834 Country of ref document: US |