WO2023162239A1 - 解析装置、解析方法、および解析プログラム - Google Patents
解析装置、解析方法、および解析プログラム Download PDFInfo
- Publication number
- WO2023162239A1 WO2023162239A1 PCT/JP2022/008344 JP2022008344W WO2023162239A1 WO 2023162239 A1 WO2023162239 A1 WO 2023162239A1 JP 2022008344 W JP2022008344 W JP 2022008344W WO 2023162239 A1 WO2023162239 A1 WO 2023162239A1
- Authority
- WO
- WIPO (PCT)
- Prior art keywords
- trigger
- behavior
- triggers
- history information
- identifying
- Prior art date
- Legal status (The legal status is an assumption and is not a legal conclusion. Google has not performed a legal analysis and makes no representation as to the accuracy of the status listed.)
- Ceased
Links
Images


Classifications
-
- G—PHYSICS
- G06—COMPUTING OR CALCULATING; COUNTING
- G06Q—INFORMATION AND COMMUNICATION TECHNOLOGY [ICT] SPECIALLY ADAPTED FOR ADMINISTRATIVE, COMMERCIAL, FINANCIAL, MANAGERIAL OR SUPERVISORY PURPOSES; SYSTEMS OR METHODS SPECIALLY ADAPTED FOR ADMINISTRATIVE, COMMERCIAL, FINANCIAL, MANAGERIAL OR SUPERVISORY PURPOSES, NOT OTHERWISE PROVIDED FOR
- G06Q30/00—Commerce
- G06Q30/02—Marketing; Price estimation or determination; Fundraising
- G06Q30/0201—Market modelling; Market analysis; Collecting market data
- G06Q30/0204—Market segmentation
- G06Q30/0205—Market segmentation based on location or geographical consideration
-
- G—PHYSICS
- G06—COMPUTING OR CALCULATING; COUNTING
- G06Q—INFORMATION AND COMMUNICATION TECHNOLOGY [ICT] SPECIALLY ADAPTED FOR ADMINISTRATIVE, COMMERCIAL, FINANCIAL, MANAGERIAL OR SUPERVISORY PURPOSES; SYSTEMS OR METHODS SPECIALLY ADAPTED FOR ADMINISTRATIVE, COMMERCIAL, FINANCIAL, MANAGERIAL OR SUPERVISORY PURPOSES, NOT OTHERWISE PROVIDED FOR
- G06Q30/00—Commerce
- G06Q30/02—Marketing; Price estimation or determination; Fundraising
-
- G—PHYSICS
- G06—COMPUTING OR CALCULATING; COUNTING
- G06Q—INFORMATION AND COMMUNICATION TECHNOLOGY [ICT] SPECIALLY ADAPTED FOR ADMINISTRATIVE, COMMERCIAL, FINANCIAL, MANAGERIAL OR SUPERVISORY PURPOSES; SYSTEMS OR METHODS SPECIALLY ADAPTED FOR ADMINISTRATIVE, COMMERCIAL, FINANCIAL, MANAGERIAL OR SUPERVISORY PURPOSES, NOT OTHERWISE PROVIDED FOR
- G06Q30/00—Commerce
- G06Q30/02—Marketing; Price estimation or determination; Fundraising
- G06Q30/0201—Market modelling; Market analysis; Collecting market data
Definitions
- Patent Literature 1 discloses an analysis device that identifies an environment in which a product purchased by a customer is arranged by analyzing the purchase behavior of the customer. According to the analysis device described in Patent Document 1, it is possible to specify the environment in which the product purchased by the customer was placed, so that the environment in which the product was placed is associated with the purchase status, and the It becomes possible to estimate the difference in the effect of each measure of sales promotion for the product.
- Patent Document 1 it is only possible to identify the environment in which the product purchased by the customer was placed, and it is not possible to grasp the behavioral trends of the target person.
- One aspect of the present invention has been made in view of the above problems, and an example of its purpose is to provide a technique that enables a favorable grasp of the behavioral tendencies of a subject.
- An analysis apparatus includes: identifying means for identifying a plurality of triggers of a change in the behavioral tendency of the subject from the behavior history information of the subject based on actions before and after the trigger; presenting means for presenting the plurality of opportunities specified by the means in chronological order.
- At least one processor identifies a plurality of triggers for changes in behavioral tendencies of the subject from the behavior history information of the subject based on actions before and after the trigger. and presenting the plurality of identified triggers in chronological order.
- An analysis program provides a computer with identifying means for identifying a plurality of triggers for changes in behavioral tendencies of the subject from the behavior history information of the subject based on actions before and after the trigger. and presentation means for presenting the plurality of opportunities specified by the specifying means in chronological order.
- FIG. 1 is a block diagram showing the configuration of an analysis device according to exemplary Embodiment 1 of the present invention
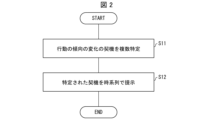
- FIG. FIG. 4 is a flow chart showing the flow of an analysis method according to exemplary embodiment 1 of the present invention
- FIG. 11 is a block diagram showing an example of a main configuration of an analysis device according to exemplary Embodiment 2 of the present invention
- FIG. 4 is a diagram showing examples of training data and prediction rules generated from the training data
- FIG. 10 is a diagram showing an example of selecting some prediction rules from a set of prediction rules; It is a figure which shows the example of presentation of opportunity. It is a figure which shows the other example of presentation of opportunity.
- FIG. 11 is a flowchart showing an example of processing executed by an analysis device according to exemplary embodiment 2 of the present invention
- FIG. 4 is a diagram showing an example of a computer that executes instructions of a program, which is software that implements each function of each device according to each exemplary embodiment of the present invention
- FIG. 1 is a block diagram showing the configuration of the analysis device 1.
- the analysis device 1 includes an identification unit (identification means) 11 and a presentation unit (presentation means) 12 .
- the identifying unit 11 identifies a plurality of triggers for changes in behavioral tendencies of the target person based on actions before and after the trigger from the behavior history information of the target person.
- the presenting unit 12 presents the plurality of opportunities specified by the specifying unit 11 in chronological order.
- a plurality of triggers for changes in behavioral tendencies of the subject are identified from the behavior history information of the subject based on behaviors before and after the trigger. and a presentation unit 12 that presents the plurality of opportunities specified by the specification unit 11 in chronological order. Therefore, according to the analysis device 1 according to this exemplary embodiment, it is possible to obtain an effect that it is possible to appropriately grasp the tendency of the subject's behavior.
- the functions of the analysis device 1 described above can also be realized by a program.
- the analysis program according to the present exemplary embodiment comprises a computer as identifying means for identifying a plurality of triggers for changes in behavioral tendencies of the subject from the behavior history information of the subject based on behaviors before and after the trigger. , a presenting means for presenting the plurality of opportunities specified by the specifying means in chronological order. According to this analysis program, it is possible to obtain an effect that it is possible to appropriately grasp the tendency of the subject's behavior.
- FIG. 2 is a flowchart showing the flow of analysis method S1. Note that the execution subject of each step in this analysis method may be a processor provided in the analysis device 1 or a processor provided in another device. processor.
- At least one processor identifies a plurality of triggers for changes in behavioral tendencies of the subject from the behavior history information of the subject, based on actions before and after the trigger.
- At S12 at least one processor presents the identified multiple triggers in chronological order.
- At least one processor detects, from the behavior history information of the subject, the trigger of the change in the tendency of the behavior of the subject, before and after the trigger.
- a configuration is employed that includes specifying a plurality of triggers based on actions (S11) and presenting the plurality of triggers to be identified in chronological order (S12). Therefore, according to the analysis method S1 according to this exemplary embodiment, it is possible to obtain an effect that it is possible to appropriately grasp the tendency of the subject's behavior.
- purchasing history information in the following explanation can be read as arbitrary behavior history information
- purchasing behavior can be read as arbitrary behavior
- change in trend of purchase amount can be read as arbitrary behavior history information. It can be read as a change in trend.
- FIG. 3 is a block diagram showing an example of the main configuration of the analysis device 2.
- the analysis device 2 is a device that analyzes the purchase history information of a subject.
- a storage unit 21 for storing various data is provided.
- the analysis device 2 also includes an input unit 22 for receiving various data input to the analysis device 2 and an output unit 23 for the analysis device 2 to output various data.
- the control unit 20 also includes a data acquisition unit 201 , a training data generation unit 202 , a rule generation unit 203 , an identification unit 204 , a transition determination unit 205 , a case number calculation unit 206 , and a presentation unit 207 . Note that the number of cases calculation unit 206 will be described later in the item "Regarding chronological order of triggers".
- the data acquisition unit 201 acquires purchase history information that indicates the history of purchase behavior of a plurality of subjects.
- the data acquisition unit 201 may acquire, as purchase history information, data such as ID-POS (Point Of Sales) collected at a store to be analyzed, for example.
- ID-POS is purchase history information associated with a customer's ID (identification information).
- the training data generation unit 202 generates training data used to generate prediction rules for predicting the degree of change in the purchasing behavior of the target person. Then, the rule generation unit 203 uses the training data generated by the training data generation unit 202 to generate a prediction rule for predicting the degree of change in the tendency of the purchase behavior of the subject. Training data, prediction rules, and methods of generating them will be described in the following sections "Generation of training data” and “Generation of prediction rules”.
- the identifying unit 204 identifies, from the purchase history information of the target person, a plurality of triggers for changes in the tendency of the purchase behavior of the target person based on the purchase behaviors before and after the trigger. Although the details will be described later, the identifying unit 204 identifies the trigger based on the predicted value indicated by the prediction rule generated by the rule generating unit 203 .
- the transition determination unit 205 determines the chronological order of the multiple triggers specified by the specifying unit 204 . A method of determining the transition order of the triggers will be described later in the item "Regarding the chronological order of the triggers".
- the presentation unit 207 presents a plurality of opportunities specified by the specifying unit 204 in chronological order.
- presentation means outputting information in a manner recognizable by the target of presentation (typically, the user of the analysis device 2).
- the mode of presentation is not particularly limited as long as the user of the analysis apparatus 2 can recognize the plurality of triggers and their chronological order.
- the presentation unit 207 may present by displaying an image showing a plurality of triggers and their chronological order on an arbitrary display device.
- the output unit 23 is a display device, the presentation unit 207 may cause the output unit 23 to display and output the image.
- the presentation unit 207 may present a plurality of triggers and their chronological order by causing the voice output device to output the plurality of triggers and their chronological order by voice, or cause the printing device to print the plurality of triggers and their chronological order. It may be presented by The presentation by the presentation unit 207 will be described with a specific example in the items of "Incentive presentation example 1" and "Incitement presentation example 2" below.
- the analysis device 2 of the present exemplary embodiment also detects a trigger of a change in the behavioral tendency of the subject based on the behavior history information of the subject, and changes the behavior before and after the trigger. and a presentation unit 207 that presents the plurality of opportunities specified by the specifying unit 204 in chronological order. Therefore, it is possible to appropriately grasp the behavioral tendency of the subject. Further, according to the analysis device 2, by presenting a plurality of triggers specified by the specifying unit 204 in chronological order, it is possible to bring about a change in behavioral tendency (for example, an increase in the monthly purchase amount).
- the action history information used in this exemplary embodiment is purchase history information indicating the history of purchase actions of a plurality of subjects. Then, the identifying unit 204 of the present exemplary embodiment identifies a trigger for a change in purchase amount trend common to a plurality of subjects based on the behavior history information of the plurality of subjects.
- the analysis device 2 it is possible for the user to recognize a plurality of time-series triggers that have changed the trend of the target person's purchase amount. Therefore, according to the analysis device 2, in addition to the effects of the analysis device 1 according to the exemplary embodiment 1, the purchase amount per predetermined period can be continuously increased, and the purchase amount can be continuously increased per predetermined period. It is possible to obtain the effect that it becomes possible to stop the decrease.
- Causal inference which is a technique for statistically analyzing causal relationships, can be applied to identify the trigger for a change in behavioral tendency.
- the outcome when performing an analysis to improve a customer, the outcome may be the amount of change in an index indicating the customer's degree of excellence (for example, monthly purchase amount, monthly number of visits, etc.).
- an index indicating the customer's degree of excellence (for example, monthly purchase amount, monthly number of visits, etc.).
- CATE Conditional Average Treatment Effect
- the exemplary embodiment utilizes a decision list generation technique, which is a rule-based model that combines multiple simple conditions, to create an "action" that results in a higher CATE. In other words, it identifies the triggers for changes in behavioral tendencies.
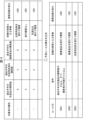
- FIG. 4 is a diagram showing examples of training data and prediction rules generated from the training data. Specifically, the upper part of FIG. 4 shows an example of training data, and the lower part shows an example of prediction rules. This section describes the generation of training data, and the generation of prediction rules is described in the section "Generation of prediction rules" below.
- the training data shown in FIG. 4 is data in which the attribute of the subject, the number of purchases for each category in a predetermined period, events that are candidates for triggers, and changes in the purchase amount are associated.
- the training data generator 202 generates such training data from purchase history information such as ID-POS.
- the training data generation unit 202 first extracts, from the purchase history information acquired by the data acquisition unit 201, a plurality of events that are candidates for increasing the purchase price per predetermined period.
- the event to be extracted may be an event likely to change the purchasing behavior of the subject, and the extraction method is not particularly limited. For example, purchasing a product at a discount, viewing an advertisement for a specific application, receiving a coupon, etc., are considered to change purchasing behavior.
- events may be extracted from purchase history information. This "event” corresponds to "treatment” in the potential outcome framework described above.
- the training data generation unit 202 When extracting an event of purchasing a product at a discount, the training data generation unit 202 randomly extracts the purchase of one product for each target person included in the purchase history information, and the purchase is a purchase at a discount price. It may be determined whether there is In performing this process, the training data generation unit 202 may generate a list in which purchase histories are classified by ID (identification information) of the target person from the purchase history information.
- ID identification information
- the training data generation unit 202 determines that the purchase was made at a discounted price
- the training data generation unit 202 identifies the category of the purchased product, and extracts an event that "the product belonging to the category was purchased at a discount.” good.
- events such as "discount purchase of household detergent” and "discount purchase of dairy products” shown in FIG. is extracted as a candidate for the trigger that increased
- the training data generation unit 202 may extract the event "no discount purchase”.
- the training data generation unit 202 extracts from the purchase history information information indicating the characteristics of the subject at the time when the extracted event occurred. For example, the training data generation unit 202 obtains the target person's age or age group, gender, occupation, family composition, place of residence or purchase value, form of residence, place of work information, purchase time or purchase time period, etc. from the purchase history information. may be extracted. In FIG. 4, such information is represented as "attribute of subject".
- the training data generation unit 202 may generate information indicating the purchase status of the subject at the time when the extracted event occurred from the purchase history information. Specifically, the training data generation unit 202 generates information indicating the number of purchases of products belonging to a predetermined product category in the past six months based on the point in time when the extracted event occurred, as shown in FIG. may be generated and included in the training data. In addition, for example, the training data may include the category, name, price, etc. of the purchased product.
- the training data generation unit 202 calculates an index value indicating the degree of change in the tendency of the purchase behavior of the subject when the event occurred after the time when the extracted event occurred. For example, as in the example of FIG. 4, the training data generator 202 may calculate a change in purchase price over a predetermined period (for example, change in purchase price per month) as the index value. It can be said that the index value indicates the result of occurrence of the extracted event. In addition, it can be said that the index value indicates what happened to the subject after the occurrence of the extracted event. This index value corresponds to the “outcome” in the Potential Outcome Framework described above.
- the rule generation unit 203 uses the training data generated as described above to determine the degree of change in the tendency of the purchase behavior of the subject after the occurrence of the event, specifically, the change in purchase amount per predetermined period. Generate a prediction rule that predicts the degree of This prediction rule associates a condition with a predicted value of the degree of change in behavioral tendency of a subject who satisfies the condition after the event occurs. This predicted value corresponds to the predicted value of the "Conditional Mean Treatment Effect" (CATE) in the Potential Outcomes Framework described above.
- CATE Conditional Mean Treatment Effect
- Such prediction rules can also be generated, for example, using a general decision list generation method.
- the rule generation unit 203 first generates data indicating changes in the purchase amount depending on whether or not the event occurs for each of the “events that are candidates for the trigger” in the training data shown in the upper part of FIG. (hereinafter referred to as event-specific data). For example, when the rule generation unit 203 generates event-specific data for the event “Purchase of household detergent at a discount”, the item “event candidate for trigger” in the training data shown in the upper part of FIG. The item may be replaced with an item indicating whether or not the event "Purchased household detergent at a discount" has occurred.
- event-specific data is generated that indicates changes in the purchase amount when the event "purchasing household detergent at a discount” occurs and when it does not occur.
- the rule generation unit 203 similarly generates event-specific data indicating changes in the purchase price for other events, when the event occurs and when the event does not occur.
- the event-specific data generated as described above shows the relationship between the covariate (feature at the time of event occurrence) x, the event that occurred z, and the result y of the event occurrence. Therefore, the rule generation unit 203 can generate a decision tree for predicting the degree of change in the purchase price per predetermined period by using the above x, y, and z as inputs. The rule generation unit 203 generates a decision tree for each event using event-specific data for each event.
- a decision tree generation method is not particularly limited.
- a known technique is known as a method for generating a decision tree for predicting the conditional average treatment effect (CATE), so such a technique can be applied.
- Specific examples include UpliftIVM (Uplift Incremental Value Modeling), t-stats (Squared t-Statistics Tree), UpliftDT (Uplift Decision tree),
- a decision tree can also be generated using CIT (Causal Inference Tree) or CT (Causal Tree) techniques.
- the rule generator 203 generates a set of prediction rules from the decision tree generated as described above. For example, the rule generation unit 203 uses the path from the root node of the decision tree to each leaf node as a condition, and associates the condition with the predicted value (predicted value of the degree of change in purchase price per predetermined period) at the leaf node. Prediction rules may be generated by According to this method, L prediction rules can be generated from a decision tree having L leaf nodes. The rule generation unit 203 generates a prediction rule as described above for each event that is a candidate for a trigger.
- a set of prediction rules is generated in which the condition, the predicted value of the degree of change in the purchase price per predetermined period, and the event that is the candidate for the trigger are associated with each other, as shown in the lower part of FIG. can do.
- FIG. 4 there are various predicted values of the degree of change in purchase price per predetermined period indicated in the generated prediction rules.
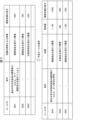
- FIG. 5 is a diagram showing an example of selecting some prediction rules from a set of prediction rules.
- the upper part of FIG. 5 shows a set of prediction rules (same as the lower part of FIG. 4), and the lower part shows prediction rules selected from the set.
- prediction rules include events that can be trigger candidates, so selecting a prediction rule also selects events included in the prediction rule.
- the identifying unit 204 selects a part of the prediction rules from the set of prediction rules to identify events included in the rules as triggers for increasing the purchase price per predetermined period.
- the specifying unit 204 selects the prediction rule based on this predicted value, that is, the purchase amount per predetermined period. It suffices to identify the trigger that increased .
- the identifying unit 204 prioritizes an event corresponding to a prediction rule with a relatively large predicted value of the degree of change in purchasing behavior trend (specifically, the degree of change in purchase amount per predetermined period). It should be specified as an opportunity.
- a prediction rule with a relatively large predicted value of the degree of change in purchasing behavior trend (specifically, the degree of change in purchase amount per predetermined period). It should be specified as an opportunity.
- the identifying unit 204 may identify an event corresponding to a prediction rule in which the predicted value of the degree of change in purchasing behavior trend is equal to or greater than a predetermined value as a trigger.
- the predetermined value may be a fixed value, or may be an average value of predicted values in the generated prediction rule.
- the identifying unit 204 may identify, as a trigger, an event corresponding to a predetermined number of prediction rules having higher predicted values of degree of change in tendency of purchasing behavior among the generated prediction rules.
- the specifying unit 204 preferentially specifies, as a trigger, an event corresponding to a prediction rule in which the number of cases that satisfy the conditions of the prediction rule is relatively large among the examples of purchasing behavior indicated in the purchase history information. good too.
- the effect of being able to identify a valid opportunity that can be expected to lead to a change in the tendency of purchasing behavior of more subjects. is obtained. This is the same for behaviors other than purchasing behavior.
- the identifying unit 204 may identify, as a trigger, an event corresponding to a prediction rule in which the number of cases satisfying a condition is equal to or greater than a predetermined value among cases of purchasing behavior shown in purchase history information.
- the predetermined value may be a fixed value, or may be an average value of the number of cases satisfying conditions in the generated prediction rule.
- the identifying unit 204 may identify an event corresponding to a predetermined number of prediction rules with a higher number of cases satisfying a condition among the generated prediction rules as a trigger.
- prediction rules identification of triggers
- predictions that cover as many target users as possible from a set that includes a large number of prediction rules and that have a large predictive value of the degree of change in purchasing behavior trends It is preferable to select rules.
- useful triggers cannot be identified. For this reason, it is preferable to select a prediction rule that provides a large predicted value for the degree of change in purchasing behavior trends for each target person while covering as many target people as possible.
- the identifying unit 204 determines a set of prediction rules that reduces the loss value calculated using the loss function, and identifies each event corresponding to each prediction rule included in the set as a trigger. good too.
- a loss function can be used to evaluate the validity of a set of prediction rules. Therefore, in addition to the effect of the analysis device 1 according to the exemplary embodiment 1, the effect of being able to specify a plurality of valid triggers as a whole can be obtained. This is the same for behaviors other than purchasing behavior.
- a loss function may be used that includes a term that multiplies the sum of predicted values of the degree of change in purchasing behavior trends in the prediction rule by -1.
- a set of prediction rules selected by the identifying unit 204 is shown in the lower part of FIG. As shown in the figure, all the predicted values of changes in the purchase amount in the prediction rule shown in the lower part of FIG. 5 are positive values, and the values are all large. Therefore, it can be said that each event included in these prediction rules is an opportunity to increase the purchase price.
- the prediction rule shown in the lower part of Fig. 5 includes the item "number of cases".
- the number of cases is calculated by the number of cases calculation unit 206 .
- the number-of-cases calculation unit 206 calculates the number of cases or the number of subjects that satisfy the conditions indicated in the prediction rule as the number of cases. Opportunities included in prediction rules with a large number of cases and a large amount of change in purchase price are considered to be opportunities that can greatly increase the purchase price of many target users.
- the analysis device 2 detects the occurrence of each of the plurality of events that are candidates for the change in the tendency of the purchasing behavior of each subject, extracted from the purchase history information of the plurality of subjects.
- a rule generation unit 203 is provided for generating a plurality of prediction rules for predicting the degree of change in the tendency of the purchase behavior of the target person after the purchase. Then, the identifying unit 204 identifies a plurality of triggers common to a plurality of subjects from among a plurality of events based on the predicted value indicated by the prediction rule.
- the exemplary implementation In addition to the effect of the analysis device 1 according to the first embodiment, the effect of being able to specify a highly relevant trigger is obtained. This is the same for behaviors other than purchasing behavior.
- the prediction rule is based on the occurring event z, the covariate x specified based on the purchase behavior performed before the event z, and the purchase behavior performed after the event z. is generated based on the relationship of the resulting results y. That is, since the prediction rule is generated based on the behavior before and after the occurrence of the event, the identifying unit 204 that identifies the trigger using this prediction rule identifies the trigger based on the behavior before and after the occurrence of the event. It can be said.
- a method for determining the chronological order of the plurality of triggers specified as described above will be described.
- the number of cases calculation unit 206 pairs a plurality of identified triggers, and extracts cases that satisfy all the conditions corresponding to each paired trigger. This processing may be performed for each set that can be made from the identified multiple triggers. Also, this processing may be performed for two sets of triggers, or for sets of three or more triggers. Two stages of chronological order can be determined if two sets of triggers are performed, and three or more stages of chronological order can be determined if performed for sets of three or more triggers. An example of determining the chronological order of two triggers from a pair of triggers will be described below.
- the number-of-cases calculation unit 206 classifies the cases extracted as described above in the order of occurrence of the event that serves as a trigger. In other words, the number-of-cases calculation unit 206 determines that, among the cases that meet the conditions of two triggers, the events occur in the order in which one trigger event occurs first, followed by the other trigger event, and the reverse order. categorized into incidents that occurred. In addition, the number-of-cases calculation unit 206 calculates the number of cases of each classified case.
- the transition determination unit 205 ranks the triggers based on the number of cases calculated by the number-of-cases calculation unit 206 .
- the transition determination unit 205 may specify categories in which the number of cases is greater than or equal to a predetermined threshold value, and may set the order corresponding to those categories as the trigger order. For example, when the threshold is set to 10, the number of cases where the conditions for Trigger B are met after the conditions for Trigger A are met is 100, and the cases where the conditions for Trigger A are met after the conditions for Trigger B are met. is three cases, the transition determination unit 205 ranks the trigger A higher than the trigger B. In FIG.
- the transition determining unit 205 can determine the chronological order of the plurality of triggers specified by the specifying unit 204 by performing such processing for each classification.
- the presentation unit 207 presents the plurality of triggers specified as described above in the chronological order determined as described above.
- the mode of presentation is not particularly limited as long as the user of the analysis apparatus 2 can recognize the plurality of triggers and their chronological order.
- the presentation unit 207 may display a transition graph in which figures indicating each of the plurality of opportunities specified by the specifying unit 204 are connected in chronological order.
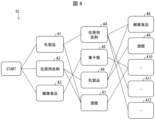
- FIG. 6 is a diagram showing a presentation example of the opportunity.
- a transition graph G1 shown in FIG. 6 indicates each of the plurality of triggers identified by the identifying unit 204 by rectangles A1 to A12, and a line segment connecting the rectangles A1 to A12 represents the chronological order of each trigger. .
- the chronological order is earlier as it is closer to the rectangle labeled "START".
- the presentation unit 207 can generate and display such a transition graph G1 by using the identification result of the identification unit 204 and the determination result of the transition determination unit 205 .
- rectangle A1 indicates the opportunity of purchasing products in the dairy product category at a discount
- rectangle A4 indicates the opportunity of purchasing products in the household detergent category at a discount
- a line segment connecting the rectangles A1 and A4 indicates that the opportunity for the rectangle A4 occurred after the opportunity for the rectangle A1.
- the presentation unit 207 may display the number of cases in which the transition indicated by the line segment occurs in association with the line segment. The number of cases calculated by the number of cases calculation unit 206 may be used.
- Such a transition graph G1 can be suitably used for planning an effective sales strategy.
- the triggers of the first stage are three rectangles A1 to A3. This indicates that in order to continuously increase the purchase amount of the target person, it is important to have the target person purchase at the opportunity of the rectangles A1 to A3.
- the transition graph G1 in FIG. 6 shows that the effective second-stage trigger differs depending on the first-step trigger. For example, if the first step trigger is the trigger for rectangle A1, the second step trigger is the trigger for rectangle A4 or A7, while the first step trigger is the trigger for rectangle A2, The trigger of the second stage is the trigger of rectangle A6 or A7. Similarly, the transition graph G1 in FIG. 6 also shows that the effective third-stage trigger differs depending on the second-step trigger.
- transition graph G1 presented by the analysis device 2 it is possible to effectively convert the target into a good customer by applying a sales promotion plan according to what kind of opportunity the target has undergone. .
- discount coupons for dairy products are distributed to target persons who have not experienced any of these rectangles, so that they can purchase dairy products at a discount.
- a discount coupon for a household detergent may be distributed to a target person who purchases a dairy product at a discount to promote the purchase of the household detergent at a discount.
- a discount coupon for health food may be distributed to the target person who purchases the household detergent at a discount to promote the purchase of the health food at a discount.
- the transition graph G1 it is possible to promote sales of products in a desired category.
- the route to rectangle A8 (health food) is (rectangle A1)-(rectangle A4)-(rectangle A8), (rectangle A2)-(rectangle A6)-(rectangle A8).
- a policy of recommending discount purchases of dairy products and household detergents is derived as a policy for promoting sales of health foods.
- the rectangles A1 to A12 may display information indicating a prediction rule corresponding to the trigger instead of the trigger.
- the transition graph G1 indicates the transition of prediction rules.
- the presenting unit 207 may present an opportunity corresponding to the prediction rule, for example, when the prediction rule is selected.
- Example 2 of opportunity presentation Since transition routes with various triggers are shown in the above-described transition graph G1, those routes may be extracted and individually presented. This will be described with reference to FIG. FIG. 7 is a diagram showing another presentation example of the opportunity.
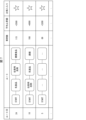
- the table shown in FIG. 7 includes items for route ID, route, number of cases, average increase, and "favorite".
- the presentation unit 207 can generate and display such a table by using the identification result of the identification unit 204, the determination result of the transition determination unit 205, and the calculation result of the number of cases calculation unit 206.
- FIG. 7 includes items for route ID, route, number of cases, average increase, and "favorite".
- the route ID is identification information that identifies the route of the trigger transition.
- a route indicates a plurality of triggers and their transition order.
- FIG. 7 as with the transition graph G1 of FIG. 6, a transition graph in which figures indicating each of a plurality of opportunities are connected in chronological order is used as information indicating a route.
- the number of cases indicates the number of cases that have passed through each opportunity shown in the route in the order of transition, and this number of cases is calculated by the case number calculation unit 206 .
- a route with a large number of cases is considered to be an effective route for changing the tendency of purchasing behavior of a large number of subjects.
- the identifying unit 204 may identify a plurality of triggers common to a plurality of subjects based on the purchase history information of the plurality of subjects, and the analysis device 2 identifies the triggers common to the plurality of subjects in chronological order.
- a case number calculation unit 206 that calculates the number of cases may be provided, and the presentation unit 207 may present the number of cases calculated by the case number calculation unit 206 .
- the average amount of increase is the average amount of increase in the purchase amount per predetermined period in cases that have passed through each opportunity shown in the route in the order of transition.
- a route with a higher average increase is considered to be a route that can be expected to greatly increase the purchase amount of the target person.
- “Favorite” is an item indicating whether or not the route is liked by the user of the analysis device 2, and the contents of the "favorite” item change according to the user's input to the analysis device 2. For example, for a route that the user has input to designate as a favorite, an asterisk in the "favorite” item may be highlighted. If the user designates a route that is judged to be useful as a favorite, the user can easily find that route from many routes by referring to the "favorite" item.
- the presentation unit 207 may display a transition graph in which figures indicating each of the plurality of opportunities identified by the identification unit 204 are connected in chronological order. According to this configuration, in addition to the effects of the analysis apparatus 1 according to the first exemplary embodiment, it is possible to present the triggers and their chronological order to the user in a visually easy-to-understand manner.
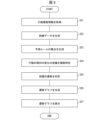
- FIG. 8 is a flowchart showing an example of processing executed by the analysis device 2. As shown in FIG.
- the data acquisition unit 201 acquires action history information indicating the action history of the subject.
- the data acquisition unit 201 may acquire purchase history information indicating purchase behavior histories of a plurality of subjects.
- the acquisition method is not particularly limited, and for example, the data acquisition unit 201 may acquire action history information input via the input unit 22 by the user of the analysis device 2 .
- the training data generation unit 202 uses the input data acquired in S21 to generate training data used to generate a prediction rule for predicting the degree of change in the behavioral tendency of the subject.
- the training data generation unit 202 may generate training data used for generating a prediction rule for predicting changes in the purchase amount of the subject for a predetermined period.
- the method of generating training data is as described in the item "Generation of training data”.
- the rule generation unit 203 generates a set of prediction rules using the training data generated in S22.
- the method of generating the set of prediction rules is as described in the item "Generation of prediction rules”.
- the identifying unit 204 uses the set generated in S23 to identify a plurality of triggers for changes in the tendency of the behavior of the subject.
- the specifying unit 204 may specify a trigger for an increase in the purchase amount of the target person for a predetermined period.
- the method for specifying the trigger is as explained in the item "Specifying the trigger”.
- the transition determination unit 205 determines the transition of the plurality of triggers identified in S24, that is, the chronological order of those triggers.
- the method for judging the chronological order of the triggers is as described in the item "Regarding the chronological order of the triggers".
- the presentation unit 207 generates a transition graph in which the graphics indicating each of the plurality of opportunities identified in S24 are connected in the chronological order determined in S25.
- the transition graph may be a tree-like graph in which a plurality of transition routes are listed, such as the transition graph G1 in FIG. Transitions for each route may be individually indicated.
- the presentation unit 207 displays the transition graph generated in S26 on an arbitrary display device, thereby presenting the plurality of opportunities identified in S25 in chronological order.
- the processing in FIG. 8 ends.
- the mode of presentation by the presentation unit 207 is arbitrary, and is not limited to the example of displaying a transition graph.
- the analysis device 2 can be applied to analyzes based on various behavior history information other than the analysis based on the purchase history information as described above. For example, if service usage history information is used, it is possible to identify a trigger for increasing the service usage frequency of a service user, a trigger for changing a service plan, or the like.
- the analysis device 2 may identify a plurality of triggers for changes in behavioral tendencies of the target person based on the action history information of one target person, and present the triggers in chronological order. For example, if the analysis device 2 is used, based on the training history information of a subject who trains at a training gym, a plurality of triggers for changing the training frequency of the subject can be specified, and the triggers can be presented in chronological order. is also possible. This makes it possible to develop a plan for improving training frequency that is specific to the target person. Similarly, it is also possible to present an opportunity for recovering the physical condition and function of a patient or care recipient in a hospital or nursing care facility.
- an analysis system having functions similar to those of the analysis device 2 can be constructed by using a plurality of devices that can communicate with each other. For example, by distributing the blocks shown in FIG. 3 to a plurality of devices, an analysis system having the same functions as the analysis device 2 can be constructed.
- Some or all of the functions of the analysis devices 1 and 2 may be realized by hardware such as an integrated circuit (IC chip), or by software.
- the analysis devices 1 and 2 are implemented, for example, by computers that execute program instructions, which are software that implements each function.
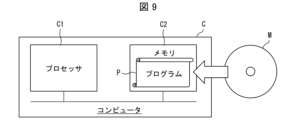
- An example of such a computer (hereinafter referred to as computer C) is shown in FIG.
- Computer C comprises at least one processor C1 and at least one memory C2.
- a program (analysis program) P for operating the computer C as the analysis device 1 or 2 is recorded in the memory C2.
- the processor C1 reads the program P from the memory C2 and executes it, thereby realizing each function of the analysis device 1 or 2.
- processor C1 for example, CPU (Central Processing Unit), GPU (Graphic Processing Unit), DSP (Digital Signal Processor), MPU (Micro Processing Unit), FPU (Floating point number Processing Unit), PPU (Physics Processing Unit) , a microcontroller, or a combination thereof.
- memory C2 for example, a flash memory, HDD (Hard Disk Drive), SSD (Solid State Drive), or a combination thereof can be used.
- the computer C may further include a RAM (Random Access Memory) for expanding the program P during execution and temporarily storing various data.
- Computer C may further include a communication interface for sending and receiving data to and from other devices.
- Computer C may further include an input/output interface for connecting input/output devices such as a keyboard, mouse, display, and printer.
- the program P can be recorded on a non-temporary tangible recording medium M that is readable by the computer C.
- a recording medium M for example, a tape, disk, card, semiconductor memory, programmable logic circuit, or the like can be used.
- the computer C can acquire the program P via such a recording medium M.
- the program P can be transmitted via a transmission medium.
- a transmission medium for example, a communication network or broadcast waves can be used.
- Computer C can also obtain program P via such a transmission medium.
- the identifying means preferentially identifies, as the trigger, the event corresponding to the prediction rule in which the number of cases satisfying the condition is relatively large among the behavior examples indicated in the behavior history information. Or the analysis device according to 3.
- the identification means identifies a plurality of the triggers common to the plurality of subjects based on the action history information of the plurality of subjects, and calculates the number of cases that have undergone the triggers in the chronological order. 6.
- the analysis apparatus according to any one of appendices 1 to 5, further comprising calculating means, wherein the presenting means presents the number of cases calculated by the number of cases calculating means.
- Appendix 7 The analysis device according to any one of appendices 1 to 6, wherein the presenting means displays a transition graph in which figures indicating each of the plurality of triggers identified by the identifying means are connected in chronological order.
- the action history information indicates the history of purchasing actions of a plurality of the subjects, and the identifying means is common to the plurality of subjects based on the action history information of the plurality of subjects, 8.
- the analysis device according to any one of Appendices 1 to 7, which identifies a trigger for a change in purchase price trend.
- At least one processor identifies a plurality of triggers for changes in behavioral tendencies of the subject from the behavior history information of the subject based on actions before and after the triggers, and the identified plurality of triggers. and presenting in chronological order.
- identifying means for causing a computer to identify a plurality of triggers for changes in behavioral tendencies of the subject based on behaviors before and after the triggers from the behavior history information of the target; and a plurality of the triggers identified by the identifying means.
- An analysis program that functions as a presentation means for presenting in chronological order.
- the processor identifies a plurality of triggers for changes in behavioral tendencies of the subject from the behavior history information of the subject based on actions before and after the trigger; an analysis device that executes presentation processing for presenting a plurality of the triggers specified in the processing in chronological order.
- the analysis device may further include a memory, and the memory may store a program for causing the processor to execute the pre-specifying process and the presentation process. Also, this program may be recorded in a computer-readable non-temporary tangible recording medium.
Landscapes
- Business, Economics & Management (AREA)
- Strategic Management (AREA)
- Engineering & Computer Science (AREA)
- Accounting & Taxation (AREA)
- Development Economics (AREA)
- Finance (AREA)
- Entrepreneurship & Innovation (AREA)
- Game Theory and Decision Science (AREA)
- Economics (AREA)
- Marketing (AREA)
- Physics & Mathematics (AREA)
- General Business, Economics & Management (AREA)
- General Physics & Mathematics (AREA)
- Theoretical Computer Science (AREA)
- Data Mining & Analysis (AREA)
- Management, Administration, Business Operations System, And Electronic Commerce (AREA)
Priority Applications (3)
| Application Number | Priority Date | Filing Date | Title |
|---|---|---|---|
| JP2024502756A JP7790545B2 (ja) | 2022-02-28 | 2022-02-28 | 解析装置、解析方法、および解析プログラム |
| PCT/JP2022/008344 WO2023162239A1 (ja) | 2022-02-28 | 2022-02-28 | 解析装置、解析方法、および解析プログラム |
| US18/839,795 US20250173752A1 (en) | 2022-02-28 | 2022-02-28 | Analysis apparatus, analysis method, and storage medium |
Applications Claiming Priority (1)
| Application Number | Priority Date | Filing Date | Title |
|---|---|---|---|
| PCT/JP2022/008344 WO2023162239A1 (ja) | 2022-02-28 | 2022-02-28 | 解析装置、解析方法、および解析プログラム |
Publications (1)
| Publication Number | Publication Date |
|---|---|
| WO2023162239A1 true WO2023162239A1 (ja) | 2023-08-31 |
Family
ID=87765271
Family Applications (1)
| Application Number | Title | Priority Date | Filing Date |
|---|---|---|---|
| PCT/JP2022/008344 Ceased WO2023162239A1 (ja) | 2022-02-28 | 2022-02-28 | 解析装置、解析方法、および解析プログラム |
Country Status (3)
| Country | Link |
|---|---|
| US (1) | US20250173752A1 (cg-RX-API-DMAC7.html) |
| JP (1) | JP7790545B2 (cg-RX-API-DMAC7.html) |
| WO (1) | WO2023162239A1 (cg-RX-API-DMAC7.html) |
Cited By (1)
| Publication number | Priority date | Publication date | Assignee | Title |
|---|---|---|---|---|
| JP7474008B1 (ja) | 2023-12-27 | 2024-04-24 | エグゼヴィータ株式会社 | 情報処理装置、情報処理方法、およびプログラム |
Citations (5)
| Publication number | Priority date | Publication date | Assignee | Title |
|---|---|---|---|---|
| JP2011014077A (ja) * | 2009-07-06 | 2011-01-20 | Nec Corp | アフィリエイト報酬額計算システム、及びアフィリエイト報酬額計算用プログラム |
| JP2014109936A (ja) * | 2012-12-03 | 2014-06-12 | Nec Corp | 情報処理装置、情報処理方法、および情報処理プログラム |
| JP2015201090A (ja) * | 2014-04-09 | 2015-11-12 | 凸版印刷株式会社 | 商品推薦装置、商品推薦方法及びプログラム |
| JP2021513166A (ja) * | 2018-02-09 | 2021-05-20 | オカド・イノベーション・リミテッド | 顧客個人化制御ユニット、システム、および方法 |
| JP2021099718A (ja) * | 2019-12-23 | 2021-07-01 | 富士フイルムビジネスイノベーション株式会社 | 情報処理装置およびプログラム |
-
2022
- 2022-02-28 JP JP2024502756A patent/JP7790545B2/ja active Active
- 2022-02-28 US US18/839,795 patent/US20250173752A1/en active Pending
- 2022-02-28 WO PCT/JP2022/008344 patent/WO2023162239A1/ja not_active Ceased
Patent Citations (5)
| Publication number | Priority date | Publication date | Assignee | Title |
|---|---|---|---|---|
| JP2011014077A (ja) * | 2009-07-06 | 2011-01-20 | Nec Corp | アフィリエイト報酬額計算システム、及びアフィリエイト報酬額計算用プログラム |
| JP2014109936A (ja) * | 2012-12-03 | 2014-06-12 | Nec Corp | 情報処理装置、情報処理方法、および情報処理プログラム |
| JP2015201090A (ja) * | 2014-04-09 | 2015-11-12 | 凸版印刷株式会社 | 商品推薦装置、商品推薦方法及びプログラム |
| JP2021513166A (ja) * | 2018-02-09 | 2021-05-20 | オカド・イノベーション・リミテッド | 顧客個人化制御ユニット、システム、および方法 |
| JP2021099718A (ja) * | 2019-12-23 | 2021-07-01 | 富士フイルムビジネスイノベーション株式会社 | 情報処理装置およびプログラム |
Cited By (3)
| Publication number | Priority date | Publication date | Assignee | Title |
|---|---|---|---|---|
| JP7474008B1 (ja) | 2023-12-27 | 2024-04-24 | エグゼヴィータ株式会社 | 情報処理装置、情報処理方法、およびプログラム |
| WO2025141964A1 (ja) * | 2023-12-27 | 2025-07-03 | エグゼヴィータ株式会社 | 情報処理装置、情報処理方法、および記録媒体 |
| JP2025104163A (ja) * | 2023-12-27 | 2025-07-09 | エグゼヴィータ株式会社 | 情報処理装置、情報処理方法、およびプログラム |
Also Published As
| Publication number | Publication date |
|---|---|
| JPWO2023162239A1 (cg-RX-API-DMAC7.html) | 2023-08-31 |
| US20250173752A1 (en) | 2025-05-29 |
| JP7790545B2 (ja) | 2025-12-23 |
Similar Documents
| Publication | Publication Date | Title |
|---|---|---|
| Coussement et al. | Improving customer attrition prediction by integrating emotions from client/company interaction emails and evaluating multiple classifiers | |
| Ali et al. | Dynamic churn prediction framework with more effective use of rare event data: The case of private banking | |
| JP7673460B2 (ja) | データ分析に用いられる方法、デバイス及びプログラム | |
| Coussement et al. | Integrating the voice of customers through call center emails into a decision support system for churn prediction | |
| US20130166379A1 (en) | Social Targeting | |
| JP6744882B2 (ja) | 行動パターン探索システム、および行動パターン探索方法 | |
| JP5253519B2 (ja) | スマートテキストを生成するための方法、装置、及び記憶媒体 | |
| JP5963320B2 (ja) | 情報処理装置、情報処理方法、及び、プログラム | |
| Peker et al. | A hybrid approach for predicting customers’ individual purchase behavior | |
| JPWO2016016934A1 (ja) | 嗜好分析システム | |
| JP7310171B2 (ja) | 配分方法、抽出方法、配分プログラム、抽出プログラム、配分装置及び抽出装置 | |
| JP7571520B2 (ja) | 情報処理方法、情報処理装置、及び、プログラム | |
| JP7761890B2 (ja) | データ処理装置、推論装置、機械学習装置、データ処理方法、推論方法、及び、機械学習方法 | |
| Gangurde et al. | Building prediction model using market basket analysis | |
| Michel et al. | Effective customer selection for marketing campaigns based on net scores | |
| Huda et al. | Design of prediction model using data mining for segmentation and classification customer churn in e-commerce mall in mall | |
| JP7790545B2 (ja) | 解析装置、解析方法、および解析プログラム | |
| JP7563998B2 (ja) | 計算機及び施策の評価方法 | |
| Xie et al. | Systematic comparisons of customer base prediction accuracy: Pareto/NBD versus neural network | |
| JP6360625B2 (ja) | 検証支援システム及び方法 | |
| Keshanian et al. | Features selection as a Nash-bargaining solution: Applications in online advertising and information systems | |
| Tan et al. | The impact of feature selection: A data‐mining application in direct marketing | |
| WO2023162238A1 (ja) | 顧客分析装置、顧客分析方法、及び、記録媒体 | |
| JP7733590B2 (ja) | データ処理システム、及びデータ処理方法 | |
| Jahromi et al. | Customer churn models: a comparison of probability and data mining approaches |
Legal Events
| Date | Code | Title | Description |
|---|---|---|---|
| 121 | Ep: the epo has been informed by wipo that ep was designated in this application |
Ref document number: 22928763 Country of ref document: EP Kind code of ref document: A1 |
|
| ENP | Entry into the national phase |
Ref document number: 2024502756 Country of ref document: JP Kind code of ref document: A |
|
| WWE | Wipo information: entry into national phase |
Ref document number: 18839795 Country of ref document: US |
|
| NENP | Non-entry into the national phase |
Ref country code: DE |
|
| 122 | Ep: pct application non-entry in european phase |
Ref document number: 22928763 Country of ref document: EP Kind code of ref document: A1 |
|
| WWP | Wipo information: published in national office |
Ref document number: 18839795 Country of ref document: US |