WO2023074723A1 - Method for detecting kidney dysfunction diagnostic marker, method for determining nephropathy prognosis, detection kit for kidney dysfunction diagnostic marker, and kidney dysfunction diagnostic marker - Google Patents
Method for detecting kidney dysfunction diagnostic marker, method for determining nephropathy prognosis, detection kit for kidney dysfunction diagnostic marker, and kidney dysfunction diagnostic marker Download PDFInfo
- Publication number
- WO2023074723A1 WO2023074723A1 PCT/JP2022/039851 JP2022039851W WO2023074723A1 WO 2023074723 A1 WO2023074723 A1 WO 2023074723A1 JP 2022039851 W JP2022039851 W JP 2022039851W WO 2023074723 A1 WO2023074723 A1 WO 2023074723A1
- Authority
- WO
- WIPO (PCT)
- Prior art keywords
- muc1
- mgam
- diagnostic marker
- urinary
- renal
- Prior art date
Links
Images


Classifications
-
- G—PHYSICS
- G01—MEASURING; TESTING
- G01N—INVESTIGATING OR ANALYSING MATERIALS BY DETERMINING THEIR CHEMICAL OR PHYSICAL PROPERTIES
- G01N33/00—Investigating or analysing materials by specific methods not covered by groups G01N1/00 - G01N31/00
- G01N33/48—Biological material, e.g. blood, urine; Haemocytometers
- G01N33/50—Chemical analysis of biological material, e.g. blood, urine; Testing involving biospecific ligand binding methods; Immunological testing
- G01N33/68—Chemical analysis of biological material, e.g. blood, urine; Testing involving biospecific ligand binding methods; Immunological testing involving proteins, peptides or amino acids
Definitions
- the present invention relates to a method for detecting a diagnostic marker for renal dysfunction, a method for determining renal prognosis, a detection kit for a diagnostic marker for renal dysfunction, and a diagnostic marker for renal dysfunction.
- CKD chronic kidney disease
- CAKUT congenital anomalies of the kidney and urinary tract
- Extracellular vesicles are particles that are naturally released from cells separated by lipid bilayers.
- Urinary EVs (uEVs) or urinary exosomes contain specific proteins from cells of all parts of the nephron.
- uEVs can be a resource of urinary biomarkers that reflect molecular expression changes in renal physiologic and pathological conditions.
- uEV-based studies of biomarkers for various diseases such as acute kidney injury, glomerular disease, renal tubular disorder, polycystic kidney disease, and kidney transplant have been reported (see, for example, Non-Patent Documents 1 and 2).
- Urinary extracellular vesicles A position paper by the Urine Task Force of the International Society for Extracellular Vesicles. Erdbrugger U, et al., J Extracell Vesicles. 2093. Epub 2021 May 21.
- the present invention has been made in view of the above circumstances, and includes a method for detecting renal dysfunction diagnostic markers capable of diagnosing renal dysfunction with high accuracy and non-invasively, a method for determining renal prognosis, and a renal dysfunction diagnostic marker.
- a detection kit and a diagnostic marker for renal dysfunction are provided.
- the present invention includes the following aspects.
- a method for detecting a renal dysfunction diagnostic marker comprising measuring the expression level of MUC1 and/or MGAM in urinary extracellular vesicles derived from a subject.
- [4] A method for determining renal prognosis, wherein the ratio of the expression level of MGAM and the expression level of MUC1 in urinary extracellular vesicles derived from a subject is calculated, and the ratio is a threshold value or more A method for determining that the prognosis is poor.
- a kit for detecting a diagnostic marker for renal dysfunction comprising an anti-MUC1 antibody and/or an anti-MGAM antibody.
- the kit of [6] further comprising an affinity substance for urinary extracellular vesicles.
- the affinity substance is Tim4.
- a marker for diagnosing renal dysfunction comprising MUC1 and/or MGAM in urinary extracellular vesicles derived from a subject.
- the marker of [9] wherein the urinary extracellular vesicles are phosphatidylserine-positive.
- the detection method of the renal dysfunction diagnostic marker which can diagnose renal dysfunction highly accurately and noninvasively, the renal prognosis determination method, the detection kit of a renal dysfunction diagnostic marker, and a renal dysfunction diagnostic marker are provided. can.
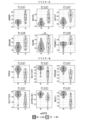
- FIG. 4 shows a scheme of uEV isolation from urine samples using Tim4 affinity beads.
- Urine samples were centrifuged at 1,200 ⁇ g for 20 min at 4° C. to remove cell debris and urine salts, and then at 10,000 ⁇ g for 30 min at 4° C. to detect large EVs such as apoptotic bodies. removed.
- Streptavidin magnetic beads coupled with biotinylated Tim4 were added to the supernatant and the mixture was rotated at 20-25°C for 1 hour. The beads were washed three times with wash buffer and bound uEVs were eluted with elution buffer. It is a negative Tein transmission electron microscope image of uEV. Scale bar indicates 200 nm.
- Nanoparticle tracking analysis of uEVs isolated from healthy controls Venn diagram of total protein detected in uEVs isolated from healthy controls. Bar graphs representing the abundance of common classical exosome markers (CD63, CD9) and classical microvesicle markers (Annexin A1) and ARRDC1-mediated microvesicle markers (TSG101) in healthy controls. The y-axis represents the log10 relative abundance.
- KEGG/Wiki pathway analysis results of 1,298 common proteins contained in uEV from healthy controls (g: Profiler). The top 5 terms with the lowest adjusted P-values were extracted. Kidney cell explorer visualization of the relative abundance in nephron fractions of the top 50 molecules in uEV from healthy controls and immunofluorescence images of 5 of the 50 molecules in human kidney specimens.
- Glutathione hydrolase 1 proenzyme (GGT1), phosphoglycerate kinase 1 (PGK1), uromodulin (UMOD), annexin A11 (ANXA11), and keratin 14 (KRT14) regulate proximal, Henle's loop, and distal tubules, respectively. , collecting ducts, and deep medullary pelvic epithelium.
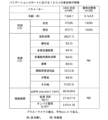
- the numbers above the figure represent each nephron segment. 1 podocyte; 2 apical cortex; 3 proximal tubules; 4 Henle's loops; 5 distal tubules; Scale bar represents 200 ⁇ m. Table showing baseline characteristics of Discovery cohort participants.
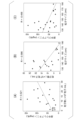
- FIG. 3 is a correlation plot of particle count and urinary creatinine;
- B Particle size versus particle correlation plot.
- C Correlation plot of particle size and urinary creatinine. Correlation coefficients are expressed as Pearson's R.
- A Density plot showing particle size distribution in healthy controls and CKD patients. Dotted lines indicate the average size of particles in each group.
- B Boxplot comparing particle counts between healthy control and CKD patient samples.
- C Boxplot comparing mean particle size between healthy control and CKD patient samples.
- D Boxplot comparing peak size densities between healthy control and CKD patient samples. Data were compared using a two-tailed Welch's t-test.
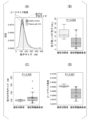
- FIG. 1 shows the selection process of candidate molecules for ELISA.
- MGAM was the only transmembrane protein among 35 molecules that were elevated in bilateral hypoplastic kidney or CKD uEV.
- MUC1 was particularly suitable for evaluation by Tim4-ELISA.
- Standard curves for MUC1, MGAM, and exosome markers (CD9 and CD63) are obtained by plotting absorbance at 450 nm (y-axis) against values of standard concentration (x-axis).
- R2 is the correlation coefficient of the standard curve.
- A Schematic of sandwich ELISA using Tim4.
- B Immunostaining image showing expression of MGAM, MUC1, and CD9 in nephron segments.
- FIG. 10 is a graph comparing MUC1 and MGAM levels (absorbance at 450 nm) measured by customized ELISA in samples from healthy controls and CKD patients.
- G1 indicates CKD patients with eGFR ⁇ 90 and G2-5 indicates CKD patients with eGFR ⁇ 90 mL/min/1.73 m 2 .
- A ROC curve for distinguishing patients with reduced renal function (eGFR ⁇ 60) from healthy controls by logistic regression.
- B ROC curve for distinguishing patients with reduced renal function (eGFR ⁇ 90) from healthy controls by logistic regression.
- C ROC curve for distinguishing CKD patients with normal eGFR ⁇ 90 from healthy controls by logistic regression. Box and beeswarm plots of MGAM/MUC1 assay values (MGAM expression divided by MUC1 expression) in CKD patients and healthy controls with each renal function in the discovery and validation cohorts.
- FIG. 10 is a graph examining the expression of exosome markers (CD9 and CD63) in uEVs of the validation cohort.
- FIG. 10 is a graph examining the correlation between urinary albumin and ELISA expression levels of MGAM, MUC1, CD9, and CD63.
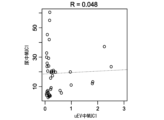
- FIG. 10 is a graph examining the correlation between uEV and urinary MUC1 expression levels.
- FIG. Correlation plots using 40 randomly selected cases from the validation cohort are shown. The correlation coefficient is expressed as Pearson's R. Values on the x-axis indicate absorbance at 450 nm by ELISA, and values on the y-axis represent urinary concentrations of MUC1 (U/mL).
- ⁇ Diagnostic marker for renal dysfunction ⁇ This embodiment provides a renal dysfunction diagnostic marker comprising MUC1 and/or MGAM in subject-derived urinary extracellular vesicles.
- Diseases that can be tested as renal dysfunction include chronic kidney disease, congenital renal and urinary tract abnormalities, hypoplastic kidney, dysplastic kidney, renal tubular dysgenesis, hydronephrosis, single kidney, and polycystic dysplastic kidney. , nephron aplasia, ciliopathy, autosomal recessive polycystic kidney disease, autosomal dominant polycystic kidney disease, renal scar, vesicoureteral reflux disease, megaureter, fused kidney, horseshoe kidney, and the like.
- the present inventors comprehensively analyzed proteins in uEVs isolated from patients with hypoplastic kidney, and discovered markers for diagnosing renal dysfunction.
- Subjects are not particularly limited, and include pediatric renal disease patients, adult renal disease patients, and the like.
- MUC1 (Mucin1) is a type I transmembrane glycoprotein belonging to the family of mucin proteins, a protein consisting of an extracellular domain, a transmembrane domain and a short cytoplasmic domain. The expression level was decreased in uEV derived from patients with hypoplastic kidney.
- MGAM (Maltase-Glucoamylase) is an ⁇ -glucosidase digestive enzyme and a transmembrane protein. The expression level was increased in uEV derived from patients with hypoplastic kidney.
- the urinary extracellular vesicles are preferably phosphatidylserine-positive, and the renal dysfunction diagnostic marker of the present embodiment preferably further includes CD9.
- CD9 is a cell surface glycoprotein found on the surface of exosomes. MGAM; MUC1 and MGAM; MUC1 and CD9; MGAM and CD9; MUC1, MGAM and CD9; The greater the number of marker molecules, the more accurate the diagnosis.
- kits for detecting a diagnostic marker for renal dysfunction comprising an anti-MUC1 antibody and/or an anti-MGAM antibody.
- Antibodies are not limited as long as they recognize antigens, and include monoclonal antibodies, polyclonal antibodies, multispecific antibodies (eg, bispecific antibodies), antibody fragments, and the like.
- the kit of this embodiment preferably further contains a substance with an affinity for urinary extracellular vesicles.
- Substances with affinity for urinary extracellular vesicles include antibodies against molecules expressed on urinary extracellular vesicle membranes such as CD9, and phospholipid affinity substances. Phosphatidylserine affinity substances are preferred, and Tim4 is more preferred.
- the kit of this embodiment preferably further contains a solid phase or carrier bound to a substance with an affinity for urinary extracellular vesicles.
- the solid phase include glass substrates, silicon substrates, plastic substrates, metal substrates, etc. Plastic substrates used for ELISA and the like are preferred.
- Carriers include beads of silicon, titanium dioxide, aluminum oxide, glass, polystyrene, cellulose, polyamides, and the like.
- the kit of this embodiment preferably contains a plastic substrate on which Tim4 is immobilized and an antibody against MUC1 and/or MGAM.
- a method for using the kit of the present embodiment urinary extracellular vesicles of a subject are captured on a Tim4-immobilized plastic substrate, and then labeled antibodies against MUC1 and/or MGAM are used to extract urinary extracellular vesicles.
- a method for detecting MUC1 and/or MGAM expressed on the vesicle outer surface is included.
- Substances used for labeling antibodies against MUC1 and/or MGAM include labeling enzymes such as horseradish peroxidase and alkaline phosphatase.
- the present embodiment provides a method for detecting a diagnostic marker for renal dysfunction, comprising measuring the expression levels of MUC1 and/or MGAM in urinary extracellular vesicles derived from a subject.
- MUC1 protein expression in the specimen If the amount is less than the control expression level of the poor prognosis control, it can be predicted that the subject has impaired renal function.
- the MGAM protein expression level in urinary extracellular vesicles derived from the subject and the control expression level of a control subject with a known poor prognosis were compared to compare both expression levels, and MGAM protein expression in the sample If the amount is greater than the control expression level in poor prognosis controls, it can be predicted that the subject has impaired renal function.
- the urinary extracellular vesicles are preferably positive for phosphatidylserine, and the method for detecting a marker for diagnosing renal dysfunction of the present embodiment further comprises measuring the expression level of CD9 in the urinary extracellular vesicles. is preferred. Furthermore, the accuracy of diagnosis is improved by measuring the expression level of CD9.
- This embodiment is a method for determining renal prognosis, in which the ratio of the expression level of MGAM and the expression level of MUC1 in urinary extracellular vesicles derived from a subject is calculated. Provided is a determination method for determining that a patient has a poor prognosis in some cases.
- the average eGFR at onset of patients with MGAM/MUC1 of 0.35 or more was reduced to It was confirmed that the eGFR decreased significantly in some patients, lower than the group.
- the urinary extracellular vesicles are preferably phosphatidylserine positive.
- the protein composition of uEVs separated from control samples was analyzed using liquid chromatography-tandem mass spectrometry (LC-MS/MS). Purified uEVs were individually analyzed using an LC-MS/MS system.
- a subsequent Sequest database search identified 1,298 non-redundant proteins in all three control samples (see Figure 5). This list included most non-tissue specific EV proteins (category 1a) and EV-recovered cytosolic proteins (category 2).
- common exosome markers CD63 and CD9
- ANXA1 classical microvesicle markers
- ARMM ARRDC1-mediated microvesicle
- uEVs from all patients with hypoplastic kidney contained marker proteins for classical exosomes (CD63 and CD9), classical microvesicles (ANXA1), and ARMM (TSG101) (see Figure 10). .).
- Multidimensional scaling (MDS) analysis using the expression levels of these 135 proteins in uEV differentiated between healthy controls and patients with hypoplastic kidneys see Figure 12).
- the mean eGFR for patients in cluster 1 was 99.2 mL/min/1.73 m 2 and the mean eGFR for patients in cluster 2 was significantly reduced to 46.0 mL/min/1.73 m 2 .
- the quantities are shown in FIG. MDS analysis using quantitative proteomic data showed that the uEV proteome could distinguish patients with renal impairment (see Figure 16). This result suggests that the expression of these proteins may be used to screen urine from patients with impaired renal function.
- MUC1 is a transmembrane glycoprotein whose expression is restricted to the apical surface of distal tubules and collecting ducts.
- MGAM which is an ⁇ -glucosidase, is expressed only in kidney proximal tubular cells (see FIG. 22(B)).
- CD9 and CD63 are markers of these small EVs ( See Figure 21).
- CD9 is mainly expressed on the basement membrane side of distal tubules and collecting ducts (see Figure 22B).
- MUC1 concentrations were examined by ELISA.
- the sample size required to discriminate renal hypofunction eGFR ⁇ 60 or ⁇ 90 by MUC1 was calculated to be 10.8 or 23.9, respectively.
- Urine samples were collected from 26 controls and 94 pediatric patients with CKD (validation cohort; see Figure 23). Reflecting the etiology of pediatric CKD, patients predominantly suffer from CAKUT and none with diabetes or diabetic kidney disease.
- MUC1, MGAM, CD9, and CD63 levels in uEVs were quantified by ELISA (see Figures 24 and 28).
- the MGAM/MUC1 value yielded an AUC of 0.922 for segregating patients with renal impairment (eGFR ⁇ 90) (see FIG. 27(A)).
- the sensitivity and specificity of MGAM/MUC1 for diagnosing eGFR depression were 88.5% and 87.5%, respectively, based on optimal cut-off values derived from ROC curves. It achieves significantly higher accuracy than urinary creatinine, albumin, or L-FABP, suggesting that the new method of the present application captures changes that cannot be detected by existing urinary biomarkers (see Figure 27 (A)). .
- renal dysfunction can be diagnosed with high precision and non-invasiveness.
Abstract
This method for detecting kidney dysfunction diagnostic marker includes measurement of the expression of MUC1 and/or MGAM in extracellular vesicles in urine derived from a subject.
Description
本発明は、腎機能障害診断マーカーの検出方法、腎予後の判定方法、腎機能障害診断マーカーの検出キット及び腎機能障害診断マーカーに関する。
The present invention relates to a method for detecting a diagnostic marker for renal dysfunction, a method for determining renal prognosis, a detection kit for a diagnostic marker for renal dysfunction, and a diagnostic marker for renal dysfunction.
多様な病態が慢性腎臓病(CKD)の原因となるが、原因に関係なく機能ネフロンの不可逆的な喪失が、その発生と進行の根底にある。最近、小児期のCKDは研究の焦点となっている。これは、罹患率と死亡率の増加をもたらし、小児期を超えて様々な医学的問題を引き起こすためである。成人のCKDとは異なり、先天性腎尿路異常 (CAKUT)や遺伝性疾患を含む非糸球体腎疾患が、小児のCKDのほとんどの症例を占めている。治療的介入と組み合わせた早期発見は、小児および成人のCKD患者の両方に大きな利益をもたらす。
Various pathologies cause chronic kidney disease (CKD), but regardless of the cause, irreversible loss of functional nephrons underlies its development and progression. Recently, childhood CKD has become a focus of research. This is because it leads to increased morbidity and mortality and causes a variety of medical problems beyond childhood. Unlike CKD in adults, non-glomerular kidney disease, including congenital anomalies of the kidney and urinary tract (CAKUT) and genetic disorders, account for most cases of CKD in children. Early detection combined with therapeutic intervention will greatly benefit both pediatric and adult CKD patients.
しかし、血液検査や尿検査では、ネフロン減少の初期段階を見逃す可能性がある。疾患の進行を予測する可能性のある新しい尿バイオマーカーの特定が求められている。
However, blood and urine tests may miss the early stages of nephron depletion. There is a need to identify new urinary biomarkers that may predict disease progression.
細胞外小胞(EV)は、脂質二重層によって区切られた細胞から自然に放出される粒子である。尿中EV(uEV)又は尿中エクソソームは、ネフロンの全ての部分の細胞に由来する特異的タンパク質を含む。uEVは、腎臓の生理学的及び病理学的状態における分子発現変動を反映する尿バイオマーカーのリソースとなり得る。急性腎障害、糸球体疾患、腎尿細管障害、多発性嚢胞腎、移植腎等、様々な疾患のバイオマーカーのuEVベースの研究が報告されている(例えば非特許文献1-2参照。)。
Extracellular vesicles (EVs) are particles that are naturally released from cells separated by lipid bilayers. Urinary EVs (uEVs) or urinary exosomes contain specific proteins from cells of all parts of the nephron. uEVs can be a resource of urinary biomarkers that reflect molecular expression changes in renal physiologic and pathological conditions. uEV-based studies of biomarkers for various diseases such as acute kidney injury, glomerular disease, renal tubular disorder, polycystic kidney disease, and kidney transplant have been reported (see, for example, Non-Patent Documents 1 and 2).
しかしながら、今日まで、機能しているネフロンの量的変化を検出するためのバイオマーカー、又はuEVを使用したバイオマーカーは確立されていない。
However, to date, no biomarkers for detecting quantitative changes in functioning nephrons or biomarkers using uEVs have been established.
本発明は、上記事情に鑑みてなされたものであって、高精度かつ非侵襲的に腎機能障害を診断できる腎機能障害診断マーカーの検出方法、腎予後の判定方法、腎機能障害診断マーカーの検出キット及び腎機能障害診断マーカーを提供する。
The present invention has been made in view of the above circumstances, and includes a method for detecting renal dysfunction diagnostic markers capable of diagnosing renal dysfunction with high accuracy and non-invasively, a method for determining renal prognosis, and a renal dysfunction diagnostic marker. A detection kit and a diagnostic marker for renal dysfunction are provided.
本発明は、以下の態様を含む。
[1]腎機能障害診断マーカーの検出方法であって、被検者由来の尿中細胞外小胞におけるMUC1及び/又はMGAMの発現量を測定することを含む、検出方法。
[2]前記尿中細胞外小胞は、ホスファチジルセリン陽性である、[1]に記載の検出方法。
[3]更に、前記尿中細胞外小胞におけるCD9の発現量を測定することを含む、[1]又は[2]に記載の検出方法。
[4]腎予後の判定方法であって、被検者由来の尿中細胞外小胞におけるMGAMの発現量とMUC1の発現量の発現量の比を計算し、前記比が閾値以上である場合には、予後不良であると判定する、判定方法。
[5]前記尿中細胞外小胞は、ホスファチジルセリン陽性である、[4]に記載の判定方法。
[6]腎機能障害診断マーカーの検出キットであって、抗MUC1抗体及び/又は抗MGAM抗体を含む、キット。
[7]更に、尿中細胞外小胞に対する親和性物質を含む、[6]に記載のキット。
[8]前記親和性物質は、Tim4である、[7]に記載のキット。
[9]腎機能障害診断マーカーであって、被検者由来の尿中細胞外小胞におけるMUC1及び/又はMGAMを含む、マーカー。
[10]前記尿中細胞外小胞は、ホスファチジルセリン陽性である、[9]に記載のマーカー。
[11]更に、被検者由来の尿中細胞外小胞におけるCD9を含む、[9]又は[10]に記載のマーカー。 The present invention includes the following aspects.
[1] A method for detecting a renal dysfunction diagnostic marker, comprising measuring the expression level of MUC1 and/or MGAM in urinary extracellular vesicles derived from a subject.
[2] The detection method according to [1], wherein the urinary extracellular vesicles are phosphatidylserine positive.
[3] The detection method according to [1] or [2], further comprising measuring the expression level of CD9 in the urinary extracellular vesicles.
[4] A method for determining renal prognosis, wherein the ratio of the expression level of MGAM and the expression level of MUC1 in urinary extracellular vesicles derived from a subject is calculated, and the ratio is a threshold value or more A method for determining that the prognosis is poor.
[5] The determination method according to [4], wherein the urinary extracellular vesicles are phosphatidylserine positive.
[6] A kit for detecting a diagnostic marker for renal dysfunction, comprising an anti-MUC1 antibody and/or an anti-MGAM antibody.
[7] The kit of [6], further comprising an affinity substance for urinary extracellular vesicles.
[8] The kit according to [7], wherein the affinity substance is Tim4.
[9] A marker for diagnosing renal dysfunction, comprising MUC1 and/or MGAM in urinary extracellular vesicles derived from a subject.
[10] The marker of [9], wherein the urinary extracellular vesicles are phosphatidylserine-positive.
[11] The marker of [9] or [10], further comprising CD9 in subject-derived urinary extracellular vesicles.
本発明によれば、高精度かつ非侵襲的に腎機能障害を診断できる腎機能障害診断マーカーの検出方法、腎予後の判定方法、腎機能障害診断マーカーの検出キット及び腎機能障害診断マーカーを提供できる。
ADVANTAGE OF THE INVENTION According to this invention, the detection method of the renal dysfunction diagnostic marker which can diagnose renal dysfunction highly accurately and noninvasively, the renal prognosis determination method, the detection kit of a renal dysfunction diagnostic marker, and a renal dysfunction diagnostic marker are provided. can.
≪腎機能障害診断マーカー≫
本実施形態は、腎機能障害診断マーカーであって、被検者由来の尿中細胞外小胞における、MUC1及び/又はMGAMを含む、マーカーを提供する。
腎機能障害として、検査の対象となり得る疾患としては、慢性腎臓病、先天性腎尿路異常、低形成腎、異形成腎、renal tubular dysgenesis、水腎症、単腎、多嚢胞性異形成腎、ネフロン癆、繊毛病、常染色体劣性多発性嚢胞腎、常染色体優性多発性嚢胞腎、腎瘢痕、膀胱尿管逆流症、巨大尿管、癒合腎、馬蹄腎等が挙げられる。
実施例において後述するように、本発明者は、低形成腎患者から分離されたuEV中のタンパク質を網羅的に解析し、腎機能障害診断マーカーを見出した。
被検者としては、特に限定されず、小児腎疾患患者、成人腎疾患患者等が挙げられる。 ≪Diagnostic marker for renal dysfunction≫
This embodiment provides a renal dysfunction diagnostic marker comprising MUC1 and/or MGAM in subject-derived urinary extracellular vesicles.
Diseases that can be tested as renal dysfunction include chronic kidney disease, congenital renal and urinary tract abnormalities, hypoplastic kidney, dysplastic kidney, renal tubular dysgenesis, hydronephrosis, single kidney, and polycystic dysplastic kidney. , nephron aplasia, ciliopathy, autosomal recessive polycystic kidney disease, autosomal dominant polycystic kidney disease, renal scar, vesicoureteral reflux disease, megaureter, fused kidney, horseshoe kidney, and the like.
As will be described later in Examples, the present inventors comprehensively analyzed proteins in uEVs isolated from patients with hypoplastic kidney, and discovered markers for diagnosing renal dysfunction.
Subjects are not particularly limited, and include pediatric renal disease patients, adult renal disease patients, and the like.
MUC1(Mucin1)は、ムチンタンパク質のファミリーに属するI型膜貫通糖タンパク質であり、細胞外ドメイン、膜貫通ドメイン、短い細胞質領域からなるタンパク質である。低形成腎患者由来のuEVで発現量が減少していた。
MGAM(Maltase-Glucoamylase)は、α-グルコシダーゼ消化酵素であり、膜貫通タンパク質である。低形成腎患者由来のuEVで発現量が増加していた。 MUC1 (Mucin1) is a type I transmembrane glycoprotein belonging to the family of mucin proteins, a protein consisting of an extracellular domain, a transmembrane domain and a short cytoplasmic domain. The expression level was decreased in uEV derived from patients with hypoplastic kidney.
MGAM (Maltase-Glucoamylase) is an α-glucosidase digestive enzyme and a transmembrane protein. The expression level was increased in uEV derived from patients with hypoplastic kidney.
前記尿中細胞外小胞は、ホスファチジルセリン陽性であることが好ましく、本実施形態の腎機能障害診断マーカーは、更に、CD9を含むことが好ましい。CD9は、エクソソーム表面に見出される細胞表面糖タンパク質である。
本実施形態の腎機能障害診断マーカーとしては、MUC1;MGAM;MUC1及びMGAM;MUC1及びCD9;MGAM及びCD9;MUC1、MGAM、及びCD9;の組み合わせが挙げられる。マーカー分子の数が多いほど診断の精度が上がる。 The urinary extracellular vesicles are preferably phosphatidylserine-positive, and the renal dysfunction diagnostic marker of the present embodiment preferably further includes CD9. CD9 is a cell surface glycoprotein found on the surface of exosomes.
MGAM; MUC1 and MGAM; MUC1 and CD9; MGAM and CD9; MUC1, MGAM and CD9; The greater the number of marker molecules, the more accurate the diagnosis.
≪腎機能障害診断マーカーの検出キット≫
本実施形態は、腎機能障害診断マーカーの検出キットであって、抗MUC1抗体及び/又は抗MGAM抗を含む、キットを提供する。抗体としては、抗原を認識するものであれば限定されず、モノクローナル抗体、ポリクローナル抗体、多重特異性抗体(例えば、二重特異性抗体)、抗体断片等が挙げられる。 <<Detection kit for diagnostic marker for renal dysfunction>>
This embodiment provides a kit for detecting a diagnostic marker for renal dysfunction, comprising an anti-MUC1 antibody and/or an anti-MGAM antibody. Antibodies are not limited as long as they recognize antigens, and include monoclonal antibodies, polyclonal antibodies, multispecific antibodies (eg, bispecific antibodies), antibody fragments, and the like.
本実施形態のキットは、更に、尿中細胞外小胞に対する親和性物質を含むことが好ましい。尿中細胞外小胞に対する親和性物質としては、CD9等の尿中細胞外小胞膜上に発現する分子に対する抗体、リン脂質親和性物質が挙げられ、ホスファチジルセリン親和性物質が好ましく、Tim4がより好ましい。
The kit of this embodiment preferably further contains a substance with an affinity for urinary extracellular vesicles. Substances with affinity for urinary extracellular vesicles include antibodies against molecules expressed on urinary extracellular vesicle membranes such as CD9, and phospholipid affinity substances. Phosphatidylserine affinity substances are preferred, and Tim4 is more preferred.
本実施形態のキットは、更に、尿中細胞外小胞に対する親和性物質と結合した固相又は担体を含むことが好ましい。固相としては、ガラス基板、シリコン基板、プラスチック基板、金属基板等が挙げられ、ELISA等に用いられるプラスチック基板が好ましい。
担体としては、ケイ素、二酸化チタン、酸化アルミニウム、ガラス、ポリスチレン、セルロース、ポリアミド等のビーズが挙げられる。 The kit of this embodiment preferably further contains a solid phase or carrier bound to a substance with an affinity for urinary extracellular vesicles. Examples of the solid phase include glass substrates, silicon substrates, plastic substrates, metal substrates, etc. Plastic substrates used for ELISA and the like are preferred.
Carriers include beads of silicon, titanium dioxide, aluminum oxide, glass, polystyrene, cellulose, polyamides, and the like.
本実施形態のキットは、Tim4が固定化したプラスチック基板と、MUC1及び/又はMGAMに対する抗体を含むことが好ましい。本実施形態のキットの使用方法としては、被検者の尿中細胞外小胞を、Tim4固定化プラスチック基板上に補足した後、MUC1及び/又はMGAMに対する標識抗体を用いて、尿中細胞外小胞外表面に発現するMUC1及び/又はMGAMを検出する方法が挙げられる。MUC1及び/又はMGAMに対する抗体の標識に用いられる物質としては、標識酵素が挙げられ、ホースラデッシュ・ペルオキシダーゼやアルカリ・フォスファターゼが挙げられる。
The kit of this embodiment preferably contains a plastic substrate on which Tim4 is immobilized and an antibody against MUC1 and/or MGAM. As a method for using the kit of the present embodiment, urinary extracellular vesicles of a subject are captured on a Tim4-immobilized plastic substrate, and then labeled antibodies against MUC1 and/or MGAM are used to extract urinary extracellular vesicles. A method for detecting MUC1 and/or MGAM expressed on the vesicle outer surface is included. Substances used for labeling antibodies against MUC1 and/or MGAM include labeling enzymes such as horseradish peroxidase and alkaline phosphatase.
≪腎機能障害診断マーカーの検出方法≫
本実施形態は、腎機能障害診断マーカーの検出方法であって、被検者由来の尿中細胞外小胞におけるMUC1及び/又はMGAMの発現量を測定することを含む、検出方法を提供する。 ≪Method for detecting renal dysfunction diagnostic marker≫
The present embodiment provides a method for detecting a diagnostic marker for renal dysfunction, comprising measuring the expression levels of MUC1 and/or MGAM in urinary extracellular vesicles derived from a subject.
例えば、被検者由来の尿中細胞外小胞におけるMUC1タンパク質発現量と、予後不良が分かっている対照者の対照発現量とを用いて両発現量を比較して、検体中のMUC1タンパク質発現量が、予後不良対照者の対照発現量より少ない場合、被検者が、腎機能障害を有していると予測できる。
また、被検者由来の尿中細胞外小胞におけるMGAMタンパク質発現量と、予後不良が分かっている対照者の対照発現量とを用いて両発現量を比較して、検体中のMGAMタンパク質発現量が、予後不良対照者の対照発現量より多い場合、被検者が、腎機能障害を有していると予測できる。 For example, comparing both expression levels using the MUC1 protein expression level in urinary extracellular vesicles derived from the subject and the control expression level of a control subject known to have a poor prognosis, MUC1 protein expression in the specimen If the amount is less than the control expression level of the poor prognosis control, it can be predicted that the subject has impaired renal function.
In addition, the MGAM protein expression level in urinary extracellular vesicles derived from the subject and the control expression level of a control subject with a known poor prognosis were compared to compare both expression levels, and MGAM protein expression in the sample If the amount is greater than the control expression level in poor prognosis controls, it can be predicted that the subject has impaired renal function.
前記尿中細胞外小胞は、ホスファチジルセリン陽性であることが好ましく、本実施形態の腎機能障害診断マーカーの検出方法は、更に、前記尿中細胞外小胞におけるCD9の発現量を測定することが好ましい。更にCD9の発現量を測定することで診断の精度が上がる。
The urinary extracellular vesicles are preferably positive for phosphatidylserine, and the method for detecting a marker for diagnosing renal dysfunction of the present embodiment further comprises measuring the expression level of CD9 in the urinary extracellular vesicles. is preferred. Furthermore, the accuracy of diagnosis is improved by measuring the expression level of CD9.
≪腎予後の判定方法≫
本実施形態は、腎予後の判定方法であって、被検者由来の尿中細胞外小胞におけるMGAMの発現量とMUC1の発現量の発現量の比を計算し、前記比が閾値以上である場合には、予後不良であると判定する、判定方法を提供する。 ≪How to determine renal prognosis≫
This embodiment is a method for determining renal prognosis, in which the ratio of the expression level of MGAM and the expression level of MUC1 in urinary extracellular vesicles derived from a subject is calculated. Provided is a determination method for determining that a patient has a poor prognosis in some cases.
実施例において後述するように、MGAM/MUC1の閾値を0.35と設定することにより、MGAM/MUC1が0.35以上の患者の発症時の平均eGFRは、MGAM/MUC1が0.35未満のグループよりも低く、一部の患者ではeGFR が大幅に低下することが確認された。また、前記尿中細胞外小胞は、ホスファチジルセリン陽性であることが好ましい。
As described later in the Examples, by setting the threshold value of MGAM/MUC1 to 0.35, the average eGFR at onset of patients with MGAM/MUC1 of 0.35 or more was reduced to It was confirmed that the eGFR decreased significantly in some patients, lower than the group. Moreover, the urinary extracellular vesicles are preferably phosphatidylserine positive.
以下、実施例により本発明を説明するが、本発明は以下の実施例に限定されるものではない。
The present invention will be described below with reference to examples, but the present invention is not limited to the following examples.
Tim4ビーズを使用して分離されたヒトuEVの概要。
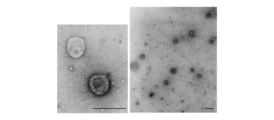
本発明に係るプロトコールは、図1に示される。uEVを分離する方法に関して、最も一般的に使用される技術である分画超遠心法には、いくつかの制限がある。精製プロセス中にEVに損傷を与える可能性があるため、技術的専門知識を必要とする。エクソソームマーカーを用いるアフィニティー精製方法についても問題がある。uEVの多くは、CD63又はCD9を発現していない。これは、これらの分子を用いる方法は、尿から精製された小胞に偏りが生じることにつながる。ここで、発明者は、Tim4ベースの精製システムを採用した(図2参照。)。Tim4の細胞外IgV様ドメインは、エクソソームやマイクロベジクルを含むEVの表面でホスファチジルセリンに結合する。結合はCa2+依存性であるため、Ca2+キレート剤を添加することにより、無傷のEVをTim4結合ビーズから簡単に解放できる。透過型電子顕微鏡によって明らかにされたuEVの外観は、典型的な受け皿のような形状と一致した(図3参照。)。
懸濁液中のuEVの数とサイズ分布は、ナノ粒子追跡分析(NTA)によって分析した。コントロールサンプルから分離されたuEVの平均数(±SD)は、19.19 (±7.19)×109粒子/mLであった。uEVの平均サイズ (±SD)は、137.9(± 2.5)nmで、ピークは117.47 nm (±1.0)であった(図4参照。)。 Overview of human uEVs isolated using Tim4 beads.
A protocol according to the invention is shown in FIG. Differential ultracentrifugation, the most commonly used technique for isolating uEVs, has several limitations. Requires technical expertise as EVs may be damaged during the purification process. There are also problems with affinity purification methods that use exosome markers. Most uEVs do not express CD63 or CD9. This leads to a bias in vesicles purified from urine for methods using these molecules. Here, the inventors employed a Tim4-based purification system (see Figure 2). The extracellular IgV-like domain of Tim4 binds phosphatidylserine on the surface of EVs, including exosomes and microvesicles. Since binding is Ca 2+ -dependent, intact EVs can be easily released from Tim4-bound beads by adding a Ca 2+ chelator. The appearance of uEVs revealed by transmission electron microscopy was consistent with a typical saucer-like shape (see Figure 3).
The number and size distribution of uEVs in suspension were analyzed by nanoparticle tracking analysis (NTA). The mean number (±SD) of uEVs isolated from control samples was 19.19 (±7.19)×10 9 particles/mL. The average size (±SD) of uEVs was 137.9 (±2.5) nm with a peak at 117.47 nm (±1.0) (see Figure 4).
コントロールサンプルから分離されたuEVのタンパク質組成は、液体クロマトグラフィー-タンデム質量分析法(LC-MS/MS)を使用して分析した。精製されたuEVは、LC-MS/MSシステムを使用して個別に分析した。続くSequestデータベース検索により、3つのコントロールサンプル全てにおいて、1, 298の非冗長タンパク質が特定された(図5参照。)。
このリストには、ほとんどの非組織特異的EVタンパク質(カテゴリー1a)及びEVで回収されたサイトゾルタンパク質(カテゴリー2)が含まれていた。予想どおり、一般的なエクソソームマーカー(CD63及びCD9)、古典的マイクロベジクルのマーカー(ANXA1)、及びARRDC1介在性マイクロベジクル(ARMM)のマーカー(TSG101))が、3つのサンプル全てで検出された(図6参照。)。
uEVサンプルに豊富に含まれるタンパク質において、Kyoto Encyclopedia of Genes and Genomes(KEGG)とWikipathwaysの分析により、リソソーム、代謝経路、エンドサイトーシス、及び近位尿細管輸送を含むuEVプロテオームに富むいくつかの経路が明らかとなった(図7参照。)精製された小胞の細胞起源の不均一性は、ネフロンの様々な細胞における遺伝子発現パターンを視覚化する腎細胞エクスプローラー、及びヒト腎臓標本の免疫蛍光法によって示された(図8参照。)。 The protein composition of uEVs separated from control samples was analyzed using liquid chromatography-tandem mass spectrometry (LC-MS/MS). Purified uEVs were individually analyzed using an LC-MS/MS system. A subsequent Sequest database search identified 1,298 non-redundant proteins in all three control samples (see Figure 5).
This list included most non-tissue specific EV proteins (category 1a) and EV-recovered cytosolic proteins (category 2). As expected, common exosome markers (CD63 and CD9), classical microvesicle markers (ANXA1), and ARRDC1-mediated microvesicle (ARMM) markers (TSG101) were detected in all three samples. (See Figure 6).
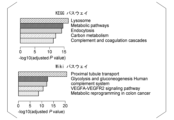
Analysis of the Kyoto Encyclopedia of Genes and Genomes (KEGG) and Wikipathways for proteins abundant in uEV samples identified several pathways enriched in the uEV proteome, including lysosomes, metabolic pathways, endocytosis, and proximal tubular transport. (see Figure 7). (see FIG. 8).
このリストには、ほとんどの非組織特異的EVタンパク質(カテゴリー1a)及びEVで回収されたサイトゾルタンパク質(カテゴリー2)が含まれていた。予想どおり、一般的なエクソソームマーカー(CD63及びCD9)、古典的マイクロベジクルのマーカー(ANXA1)、及びARRDC1介在性マイクロベジクル(ARMM)のマーカー(TSG101))が、3つのサンプル全てで検出された(図6参照。)。
uEVサンプルに豊富に含まれるタンパク質において、Kyoto Encyclopedia of Genes and Genomes(KEGG)とWikipathwaysの分析により、リソソーム、代謝経路、エンドサイトーシス、及び近位尿細管輸送を含むuEVプロテオームに富むいくつかの経路が明らかとなった(図7参照。)精製された小胞の細胞起源の不均一性は、ネフロンの様々な細胞における遺伝子発現パターンを視覚化する腎細胞エクスプローラー、及びヒト腎臓標本の免疫蛍光法によって示された(図8参照。)。 The protein composition of uEVs separated from control samples was analyzed using liquid chromatography-tandem mass spectrometry (LC-MS/MS). Purified uEVs were individually analyzed using an LC-MS/MS system. A subsequent Sequest database search identified 1,298 non-redundant proteins in all three control samples (see Figure 5).
This list included most non-tissue specific EV proteins (category 1a) and EV-recovered cytosolic proteins (category 2). As expected, common exosome markers (CD63 and CD9), classical microvesicle markers (ANXA1), and ARRDC1-mediated microvesicle (ARMM) markers (TSG101) were detected in all three samples. (See Figure 6).
Analysis of the Kyoto Encyclopedia of Genes and Genomes (KEGG) and Wikipathways for proteins abundant in uEV samples identified several pathways enriched in the uEV proteome, including lysosomes, metabolic pathways, endocytosis, and proximal tubular transport. (see Figure 7). (see FIG. 8).
腎低形成におけるuEVの変化
次に、発明者は、両側性低形成腎の患者から分離されたuEVに注目した。低形成腎は、ネフロンの数が減少した先天的に小さな腎臓を特徴とする。後天性疾患に続発する腎瘢痕又は腎萎縮は除外された。
患者の特徴を図9に示す。各uEVサンプルにおける総タンパク質量で正規化した後、低形成腎の患者から単離したuEVのタンパク質組成物を、コントロールサンプルから単離したuEVのものと比較した。総タンパク質量は、EVの相対排泄率を計算する際の正規化変数として一般的に使用される。
低形成腎の全ての患者からのuEVには、古典的なエクソソーム(CD63及びCD9)、古典的なマイクロベジクル(ANXA1)、及びARMM(TSG101)のマーカータンパク質が含まれていた(図10参照。)。経験的ベイジアン統計と組み合わせたprotein-wise linearモデルによるエンリッチメント解析を適用して、低形成腎の患者と健常対照者サンプルを最もよく区別するタンパク質を特定した。その結果、合計135個の識別タンパク質が明らかになり、そのうち35個と100個のタンパク質が低形成腎でそれぞれ増加及び減少していた(図11参照。)。uEVにおけるこれらの135個のタンパク質の発現レベルを使用した多次元尺度構成法(MDS)分析により、健常対照者と低形成腎の患者が区別された(図12参照。)。遺伝子オントロジー分析により、腎低形成で発現レベルが上昇するタンパク質が、いくつかの免疫介在経路に関連していることが明らかになり(図13参照。)、CKD患者の腎臓の慢性炎症の可能性が示唆された。一方、腎低形成で発現レベルが低下したタンパク質は、塩化物イオンの恒常性や一価の無機陰イオンの恒常性など、尿細管での電解質移動に関連していた(図13参照。)。 Changes in uEVs in Renal Hypoplasia Next, the inventors focused on uEVs isolated from patients with bilateral hypoplastic kidneys. Hypoplastic kidneys are characterized by congenitally small kidneys with a reduced number of nephrons. Renal scarring or renal atrophy secondary to acquired disease was excluded.
Patient characteristics are shown in FIG. After normalization by the total protein amount in each uEV sample, the protein composition of uEVs isolated from patients with hypoplastic kidney was compared to that of uEVs isolated from control samples. Total protein content is commonly used as a normalizing variable in calculating the relative excretion rate of EVs.
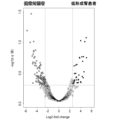
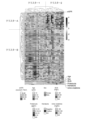
uEVs from all patients with hypoplastic kidney contained marker proteins for classical exosomes (CD63 and CD9), classical microvesicles (ANXA1), and ARMM (TSG101) (see Figure 10). .). Enrichment analysis with a protein-wise linear model combined with empirical Bayesian statistics was applied to identify proteins that best discriminated between hypoplastic kidney patients and healthy control samples. As a result, a total of 135 identified proteins were revealed, of which 35 and 100 proteins were increased and decreased in hypoplastic kidney, respectively (see Figure 11). Multidimensional scaling (MDS) analysis using the expression levels of these 135 proteins in uEV differentiated between healthy controls and patients with hypoplastic kidneys (see Figure 12). Gene ontology analysis revealed that proteins whose expression levels are elevated in renal hypoplasia are associated with several immune-mediated pathways (see Figure 13), suggesting chronic inflammation in the kidneys of CKD patients. was suggested. On the other hand, proteins whose expression levels were decreased in renal hypoplasia were related to electrolyte transport in renal tubules, such as chloride ion homeostasis and monovalent inorganic anion homeostasis (see FIG. 13).
次に、発明者は、両側性低形成腎の患者から分離されたuEVに注目した。低形成腎は、ネフロンの数が減少した先天的に小さな腎臓を特徴とする。後天性疾患に続発する腎瘢痕又は腎萎縮は除外された。
患者の特徴を図9に示す。各uEVサンプルにおける総タンパク質量で正規化した後、低形成腎の患者から単離したuEVのタンパク質組成物を、コントロールサンプルから単離したuEVのものと比較した。総タンパク質量は、EVの相対排泄率を計算する際の正規化変数として一般的に使用される。
低形成腎の全ての患者からのuEVには、古典的なエクソソーム(CD63及びCD9)、古典的なマイクロベジクル(ANXA1)、及びARMM(TSG101)のマーカータンパク質が含まれていた(図10参照。)。経験的ベイジアン統計と組み合わせたprotein-wise linearモデルによるエンリッチメント解析を適用して、低形成腎の患者と健常対照者サンプルを最もよく区別するタンパク質を特定した。その結果、合計135個の識別タンパク質が明らかになり、そのうち35個と100個のタンパク質が低形成腎でそれぞれ増加及び減少していた(図11参照。)。uEVにおけるこれらの135個のタンパク質の発現レベルを使用した多次元尺度構成法(MDS)分析により、健常対照者と低形成腎の患者が区別された(図12参照。)。遺伝子オントロジー分析により、腎低形成で発現レベルが上昇するタンパク質が、いくつかの免疫介在経路に関連していることが明らかになり(図13参照。)、CKD患者の腎臓の慢性炎症の可能性が示唆された。一方、腎低形成で発現レベルが低下したタンパク質は、塩化物イオンの恒常性や一価の無機陰イオンの恒常性など、尿細管での電解質移動に関連していた(図13参照。)。 Changes in uEVs in Renal Hypoplasia Next, the inventors focused on uEVs isolated from patients with bilateral hypoplastic kidneys. Hypoplastic kidneys are characterized by congenitally small kidneys with a reduced number of nephrons. Renal scarring or renal atrophy secondary to acquired disease was excluded.
Patient characteristics are shown in FIG. After normalization by the total protein amount in each uEV sample, the protein composition of uEVs isolated from patients with hypoplastic kidney was compared to that of uEVs isolated from control samples. Total protein content is commonly used as a normalizing variable in calculating the relative excretion rate of EVs.
uEVs from all patients with hypoplastic kidney contained marker proteins for classical exosomes (CD63 and CD9), classical microvesicles (ANXA1), and ARMM (TSG101) (see Figure 10). .). Enrichment analysis with a protein-wise linear model combined with empirical Bayesian statistics was applied to identify proteins that best discriminated between hypoplastic kidney patients and healthy control samples. As a result, a total of 135 identified proteins were revealed, of which 35 and 100 proteins were increased and decreased in hypoplastic kidney, respectively (see Figure 11). Multidimensional scaling (MDS) analysis using the expression levels of these 135 proteins in uEV differentiated between healthy controls and patients with hypoplastic kidneys (see Figure 12). Gene ontology analysis revealed that proteins whose expression levels are elevated in renal hypoplasia are associated with several immune-mediated pathways (see Figure 13), suggesting chronic inflammation in the kidneys of CKD patients. was suggested. On the other hand, proteins whose expression levels were decreased in renal hypoplasia were related to electrolyte transport in renal tubules, such as chloride ion homeostasis and monovalent inorganic anion homeostasis (see FIG. 13).
CKD患者におけるuEVの発現シグネチャと特徴
次に、腎及び尿路の先天異常(膀胱尿管逆流、単腎、又は代償性対側腎肥大を伴う片側低形成腎)又は繊毛病(ネフロン癆又は多発性嚢胞腎)による様々な腎機能を呈するCKD患者からのサンプルを分析した(図9参照)。これらのデータを、コントロール及び両側性低形成腎からのuEVのデータと組み合わせて解析した。コントロールと両側性低形成腎を区別する135のタンパク質の定量的発現データを使用して、30個のuEVサンプルの教師なしコンセンサスクラスタリングを実行した(図14参照。)。この解析によりこれらのuEVサンプルが2つの主要なクラスター(クラスター1及び2)に分類されていることが明らかになった(図14参照。)。クラスター1の患者の平均eGFRは、99.2 mL/min/1.73m2であり、クラスター2の患者の平均eGFRは大幅に減少し、46.0mL/min/1.73m2であった。eGFRが90mL/min/1.73m2以上の患者(N)及びeGFRが90mL/min/1.73m2未満の患者 (D)のLC-MS/MS分析によって評価された代表的なタンパク質の存在量を図15に示す。定量的プロテオームデータを使用したMDS分析は、uEVプロテオームが腎機能の低下した患者を区別できることを示した(図16参照。)。この結果は、これらのタンパク質の発現が、腎機能が低下した患者の尿のスクリーニングに使用できる可能性があることを示唆する。 Expression signatures and features of uEV in CKD patients Next, renal and urinary tract congenital anomalies (vesicoureteral reflux, single kidney, or unilateral hypoplastic kidney with compensated contralateral renal hypertrophy) or ciliopathies (nephronopheles or multiple Samples from CKD patients presenting with varying renal function due to cystic kidney disease (cystic kidney disease) were analyzed (see Figure 9). These data were analyzed in combination with uEV data from control and bilateral hypoplastic kidneys. Unsupervised consensus clustering of 30 uEV samples was performed using quantitative expression data for 135 proteins that discriminate between controls and bilateral hypoplastic kidneys (see Figure 14). This analysis revealed that these uEV samples fell into two major clusters (clusters 1 and 2) (see Figure 14). The mean eGFR for patients in cluster 1 was 99.2 mL/min/1.73 m 2 and the mean eGFR for patients in cluster 2 was significantly reduced to 46.0 mL/min/1.73 m 2 . Presence of representative proteins assessed by LC-MS/MS analysis in patients with eGFR ≧90 mL/min/1.73 m 2 (N) and eGFR <90 mL/min/1.73 m 2 (D) The quantities are shown in FIG. MDS analysis using quantitative proteomic data showed that the uEV proteome could distinguish patients with renal impairment (see Figure 16). This result suggests that the expression of these proteins may be used to screen urine from patients with impaired renal function.
次に、腎及び尿路の先天異常(膀胱尿管逆流、単腎、又は代償性対側腎肥大を伴う片側低形成腎)又は繊毛病(ネフロン癆又は多発性嚢胞腎)による様々な腎機能を呈するCKD患者からのサンプルを分析した(図9参照)。これらのデータを、コントロール及び両側性低形成腎からのuEVのデータと組み合わせて解析した。コントロールと両側性低形成腎を区別する135のタンパク質の定量的発現データを使用して、30個のuEVサンプルの教師なしコンセンサスクラスタリングを実行した(図14参照。)。この解析によりこれらのuEVサンプルが2つの主要なクラスター(クラスター1及び2)に分類されていることが明らかになった(図14参照。)。クラスター1の患者の平均eGFRは、99.2 mL/min/1.73m2であり、クラスター2の患者の平均eGFRは大幅に減少し、46.0mL/min/1.73m2であった。eGFRが90mL/min/1.73m2以上の患者(N)及びeGFRが90mL/min/1.73m2未満の患者 (D)のLC-MS/MS分析によって評価された代表的なタンパク質の存在量を図15に示す。定量的プロテオームデータを使用したMDS分析は、uEVプロテオームが腎機能の低下した患者を区別できることを示した(図16参照。)。この結果は、これらのタンパク質の発現が、腎機能が低下した患者の尿のスクリーニングに使用できる可能性があることを示唆する。 Expression signatures and features of uEV in CKD patients Next, renal and urinary tract congenital anomalies (vesicoureteral reflux, single kidney, or unilateral hypoplastic kidney with compensated contralateral renal hypertrophy) or ciliopathies (nephronopheles or multiple Samples from CKD patients presenting with varying renal function due to cystic kidney disease (cystic kidney disease) were analyzed (see Figure 9). These data were analyzed in combination with uEV data from control and bilateral hypoplastic kidneys. Unsupervised consensus clustering of 30 uEV samples was performed using quantitative expression data for 135 proteins that discriminate between controls and bilateral hypoplastic kidneys (see Figure 14). This analysis revealed that these uEV samples fell into two major clusters (
CKD患者におけるuEVの特徴
次に、uEVの物理的特性がCKDで変化するかどうかを調べた。NTAは、検討に必要なサンプル量が利用可能な20のサンプルで実行された。粒子数は尿クレアチニンと正の相関があり(図17(A)参照。)、uEVの平均サイズと負の相関がある(図17(B)及び (C)参照。)。粒子の数とCKD患者及びコントロールからのuEVの平均サイズは統計的に異ならなかったが、ピークサイズはコントロールよりもCKD患者で有意に低かった(P=0.007)(図18(A)-(D)参照。)。
uEVの形態が尿クレアチニンによって変化するかどうかを調べた。尿クレアチニンが低いサンプル(uCr:<50mg/dL)では、クレアチニンが高いサンプル(uCr:≧50mg/dL)よりも大きな小胞(150-1000 nm)の比率が顕著であった(図19参照。)。 Characterization of uEVs in CKD Patients We next investigated whether the physical properties of uEVs were altered in CKD. NTA was performed on 20 samples for which the sample quantity required for the study was available. The number of particles is positively correlated with urinary creatinine (see FIG. 17(A)) and negatively correlated with the average size of uEVs (see FIGS. 17(B) and (C)). Although the number of particles and the mean size of uEVs from CKD patients and controls were not statistically different, the peak size was significantly lower in CKD patients than controls (P=0.007) (Fig. 18(A)- (D).).
We investigated whether the morphology of uEVs is altered by urinary creatinine. Low urinary creatinine samples (uCr <50 mg/dL) had a higher proportion of large vesicles (150-1000 nm) than high creatinine samples (uCr >50 mg/dL) (see Figure 19). ).
uEVシグネチャの検出のためのELISAプラットフォームの構築
uEVシグネチャがCKDに関連付けられているという概念実証のために、Tim4 をEV捕捉物質として使用し、ビオチン化抗体を検出抗体として使用するELISA プラットフォームを確立することを目指した。システムは、簡単な手順でuEVの候補バイオマーカーのタンパク質含有量を定量化する。両側低形成腎又はCKDのuEVで発現が上昇する分子の中で、MGAMは細胞外領域に対する抗体が利用可能な唯一の膜貫通タンパク質であった(図15参照。)。CKDで発現が低下する分子のリストを絞り込むために、次の基準を使用した:腎細胞の細胞表面に局在し、細胞外領域に対する抗体が利用可能であり、正常な尿のプロテオームにおいて、そのシグナルが腎細胞で安定して検出される膜タンパク質。5つの分子(MUC1、PVR、PKD2、PROM1、及びTHY1) が基準を満たした(図15参照。)。最後に、市販の抗体を使用して、Tim4精製uEVでの発現を評価できるかどうかを調べた。この分析により、最終的にMUC1とMGAMの定量システムの構築に成功した(図20及び21参照。)。
MUC1は膜貫通糖タンパク質であり、その発現は遠位尿細管と集合管の頂端面に限られている。α-グルコシダーゼであるMGAMは、腎臓の近位尿細管細胞でのみ発現している(図22(B)参照。)。更に、CKD患者の減少した粒子のサイズは、古典的または非古典的なエクソソームのサイズに対応するため(図18(A)参照。)、これらの小さなEVのマーカーとしてCD9及びCD63も含めた(図21参照。)。CD9は、主に遠位尿細管及び集合管の基底膜側に発現する(図22B参照。)。 Construction of an ELISA Platform for Detection of uEV Signatures For a proof-of-concept that uEV signatures are associated with CKD, we establish an ELISA platform using Tim4 as an EV capture agent and a biotinylated antibody as a detection antibody. I aimed to The system quantifies the protein content of uEV candidate biomarkers in a simple procedure. Among the molecules up-regulated in bilateral hypoplastic kidney or CKD uEVs, MGAM was the only transmembrane protein for which antibodies against the extracellular region were available (see Figure 15). To narrow down the list of molecules that are under-expressed in CKD, we used the following criteria: localized to the cell surface of renal cells, antibodies to the extracellular domain are available, and in the normal urinary proteome, Membrane protein whose signal is stably detected in renal cells. Five molecules (MUC1, PVR, PKD2, PROM1 and THY1) met the criteria (see Figure 15). Finally, we investigated whether a commercially available antibody could be used to assess expression in Tim4-purified uEVs. Through this analysis, we finally succeeded in constructing a quantification system for MUC1 and MGAM (see FIGS. 20 and 21).
MUC1 is a transmembrane glycoprotein whose expression is restricted to the apical surface of distal tubules and collecting ducts. MGAM, which is an α-glucosidase, is expressed only in kidney proximal tubular cells (see FIG. 22(B)). Furthermore, since the reduced particle size of CKD patients corresponds to the size of classical or non-classical exosomes (see FIG. 18(A)), we also included CD9 and CD63 as markers of these small EVs ( See Figure 21). CD9 is mainly expressed on the basement membrane side of distal tubules and collecting ducts (see Figure 22B).
CKDの検出のためのuEVの有用性
ディスカバリーコホートを使用して、ELISAによりMUC1濃度を調べた。
MUC1による腎機能低下eGFR<60又は<90の識別に必要なサンプルサイズは、それぞれ10.8又は23.9と計算された。26人のコントロールとCKDの94人の小児患者から尿サンプルを収集した(バリデーションコホート;図23参照。)。小児CKDの病因を反映して、患者は主にCAKUTを患い、糖尿病や糖尿病性腎疾患の患者はいない。ELISAにより、uEVのMUC1、MGAM、CD9、及びCD63レベルを定量化した(図24及び図28参照。)。uEVにおけるMUC1、MGAM、CD9、及びCD63の発現レベルは、尿アルブミンと相関していなかった(図29参照。)。
受信者動作特性(ROC)曲線分析を実行して、腎機能が低下した患者を特定する際の識別性能を評価した。uEVのMUC1レベルを使用した単変量解析では、eGFR<60(図25(A)参照。)又は<90mL/min/1.73m2 (図25(B)参照。)の患者を識別するための高い診断性能が示された。
AUC値は、MUC1とMGAM を使用した二変量解析でさらに増加した。MUC1、MGAM、及びCD9を使用した三変量解析では、最高のAUC値1.000(eGFR<60)(図25(A)参照。)及び 0.953(eGFR<90)(図25(B)参照。)を達成した。また、この方法でeGFRが正常(eGFR≧90)のCKD患者と健常対照者を区別できるかどうかも調べた。二変量又は三変量解析のAUC値は、0.75を超えた(図25(C)参照。)。これは、eGFRが正常なCKD患者であっても、uEV シグネチャが腎臓の変化を検出できることを示唆している。
また、複合多変量解析の代わりに、MGAMの発現値をMUC1の発現値で割った値 (MGAM/MUC1)が、腎機能低下の指標として使用できるかどうかも調査した。MGAM/MUC1値は、ディスカバリー及びバリデーションコホートで腎機能が低下するにつれて増加した(図26参照。)。MGAM/MUC1値は、腎機能が低下した患者 (eGFR<90)を分離するために0.922のAUCをもたらした(図27(A)参照。)。eGFR低下の診断に対するMGAM/MUC1の感度と特異度は、ROC曲線から導き出された最適なカットオフ値に基づいて、それぞれ88.5%と87.5%であった。尿クレアチニン、アルブミン、又はL-FABPよりも大幅に高い精度を実現し、本願の新しい方法が既存の尿バイオマーカーでは検出できない変化を捉えることを示唆している(図27(A)参照。)。 Utility of uEVs for Detection of CKD Using the discovery cohort, MUC1 concentrations were examined by ELISA.
The sample size required to discriminate renal hypofunction eGFR<60 or <90 by MUC1 was calculated to be 10.8 or 23.9, respectively. Urine samples were collected from 26 controls and 94 pediatric patients with CKD (validation cohort; see Figure 23). Reflecting the etiology of pediatric CKD, patients predominantly suffer from CAKUT and none with diabetes or diabetic kidney disease. MUC1, MGAM, CD9, and CD63 levels in uEVs were quantified by ELISA (see Figures 24 and 28). Expression levels of MUC1, MGAM, CD9, and CD63 in uEVs did not correlate with urinary albumin (see Figure 29).
A Receiver Operating Characteristic (ROC) curve analysis was performed to assess discriminatory performance in identifying patients with impaired renal function. In univariate analysis using uEV MUC1 levels, eGFR<60 (see FIG. 25 (A)) or High diagnostic performance was shown.
AUC values were further increased in bivariate analysis using MUC1 and MGAM. Trivariate analysis using MUC1, MGAM, and CD9 showed highest AUC values of 1.000 (eGFR<60) (see FIG. 25(A)) and 0.953 (eGFR<90) (FIG. 25(B)). ) was achieved. We also investigated whether this method could distinguish between CKD patients with normal eGFR (eGFR≧90) and healthy controls. AUC values for bivariate or trivariate analysis exceeded 0.75 (see Figure 25(C)). This suggests that the uEV signature can detect renal changes even in CKD patients with normal eGFR.
It was also investigated whether the value obtained by dividing the expression value of MGAM by the expression value of MUC1 (MGAM/MUC1) could be used as an index of renal function deterioration instead of the combined multivariate analysis. MGAM/MUC1 values increased with decreasing renal function in the discovery and validation cohorts (see Figure 26). The MGAM/MUC1 value yielded an AUC of 0.922 for segregating patients with renal impairment (eGFR<90) (see FIG. 27(A)). The sensitivity and specificity of MGAM/MUC1 for diagnosing eGFR depression were 88.5% and 87.5%, respectively, based on optimal cut-off values derived from ROC curves. It achieves significantly higher accuracy than urinary creatinine, albumin, or L-FABP, suggesting that the new method of the present application captures changes that cannot be detected by existing urinary biomarkers (see Figure 27 (A)). .
最後に、MGAM/MUC1と腎予後との関連を分析した。ディスカバリー及びバリデーションコホートの患者のうち、最初の分析から6か月以上経過した追跡データが35人の患者で利用可能であった。初期分析のMGAM/MUC1値に従って、これらの患者は2つのグループに分類された。しきい値(0.35)は、健常対照者のMGAM/MUC1値の最大値(0.330)を含むように設定された。初期分析からフォローアップ分析までの平均期間は25.8(±14.4)か月であった。MGAM/MUC1が0.35未満の患者 (<0.35;6例)では、発症時の平均eGFRは、86.7(±26.7)mL/min/1.73m2であった。このグループでは、eGFRは追跡期間中に大幅に変化しなかった。MGAM/MUC1が0.35以上の患者(≧0.35;29人の患者) の発症時の平均eGFRは、MGAM/MUC1<0.35のグループ(65.4±36.2mL/min/1.73m2)よりも低く、一部の患者ではeGFR が大幅に低下した(図27(B)参照。)。
Finally, the association between MGAM/MUC1 and renal prognosis was analyzed. Of the patients in the discovery and validation cohorts, follow-up data were available for 35 patients more than 6 months after initial analysis. These patients were classified into two groups according to the MGAM/MUC1 values in the initial analysis. A threshold (0.35) was set to include the maximum MGAM/MUC1 value (0.330) in healthy controls. The mean time from initial analysis to follow-up analysis was 25.8 (±14.4) months. In patients with MGAM/MUC1 <0.35 (<0.35; 6 cases), mean eGFR at presentation was 86.7 (±26.7) mL/min/1.73 m 2 . In this group, eGFR did not change significantly during the follow-up period. Mean eGFR at presentation in patients with MGAM/MUC1 ≥ 0.35 (≥0.35; 29 patients) was 65.4 ± 36.2 mL/min/l 0.73 m 2 ), and eGFR was significantly reduced in some patients (see FIG. 27(B)).
MUC1の尿中濃度は、腎疾患と潜在的に関連していることが報告されている。高カルシウム尿性腎結石症の患者では、尿中MUC1のレベルが大幅に低下するとされる。更に、腎尿細管上皮から放出される尿中MUC1フラグメントは、腎機能障害に関連するバイオマーカーとして報告されている。そこで、尿中とuEV中のMUC1濃度の相関関係を調べた。図30に示すように、これら2つの値の間に相関は見つからなかった。この結果は、uEVにおけるMUC1の変化が、可溶性MUC1フラグメントの尿中濃度とは無関係に、腎臓組織の変化を捕捉することを示唆している。
It has been reported that the urinary concentration of MUC1 is potentially associated with renal disease. Patients with hypercalciuric nephrolithiasis are said to have significantly reduced levels of urinary MUC1. Furthermore, urinary MUC1 fragments released from renal tubular epithelium have been reported as biomarkers associated with renal dysfunction. Therefore, the correlation between MUC1 concentrations in urine and uEV was investigated. No correlation was found between these two values, as shown in FIG. This result suggests that changes in MUC1 in uEV capture changes in kidney tissue, independent of urinary concentrations of soluble MUC1 fragments.
本実施形態によれば、高精度かつ非侵襲的に腎機能障害を診断できる。
According to this embodiment, renal dysfunction can be diagnosed with high precision and non-invasiveness.
Claims (11)
- 腎機能障害診断マーカーの検出方法であって、被検者由来の尿中細胞外小胞におけるMUC1及び/又はMGAMの発現量を測定することを含む、検出方法。 A method for detecting a marker for diagnosing renal dysfunction, comprising measuring the expression level of MUC1 and/or MGAM in urinary extracellular vesicles derived from a subject.
- 前記尿中細胞外小胞は、ホスファチジルセリン陽性である、請求項1に記載の検出方法。 The detection method according to claim 1, wherein the urinary extracellular vesicles are phosphatidylserine-positive.
- 更に、前記尿中細胞外小胞におけるCD9の発現量を測定することを含む、請求項1又は2に記載の検出方法。 The detection method according to claim 1 or 2, further comprising measuring the expression level of CD9 in the urinary extracellular vesicles.
- 腎予後の判定方法であって、被検者由来の尿中細胞外小胞におけるMGAMの発現量とMUC1の発現量の発現量の比を計算し、前記比が閾値以上である場合には、予後不良であると判定する、判定方法。 A method for determining renal prognosis, wherein the ratio of the expression level of MGAM and the expression level of MUC1 in urinary extracellular vesicles derived from a subject is calculated, and when the ratio is a threshold value or more, A determination method for determining that the prognosis is poor.
- 前記尿中細胞外小胞は、ホスファチジルセリン陽性である、請求項4に記載の判定方法。 The determination method according to claim 4, wherein the urinary extracellular vesicles are phosphatidylserine positive.
- 腎機能障害診断マーカーの検出キットであって、抗MUC1抗体及び/又は抗MGAM抗体を含む、キット。 A kit for detecting renal dysfunction diagnostic markers, comprising an anti-MUC1 antibody and/or an anti-MGAM antibody.
- 更に、尿中細胞外小胞に対する親和性物質を含む、請求項6に記載のキット。 The kit according to claim 6, further comprising an affinity substance for urinary extracellular vesicles.
- 前記親和性物質は、Tim4である、請求項7に記載のキット。 The kit according to claim 7, wherein the affinity substance is Tim4.
- 腎機能障害診断マーカーであって、被検者由来の尿中細胞外小胞におけるMUC1及び/又はMGAMを含む、マーカー。 A marker that is a diagnostic marker for renal dysfunction and contains MUC1 and/or MGAM in subject-derived urinary extracellular vesicles.
- 前記尿中細胞外小胞は、ホスファチジルセリン陽性である、請求項9に記載のマーカー。 The marker according to claim 9, wherein the urinary extracellular vesicles are phosphatidylserine positive.
- 更に、被検者由来の尿中細胞外小胞におけるCD9を含む、請求項9又は10に記載のマーカー。 The marker according to claim 9 or 10, further comprising CD9 in urinary extracellular vesicles derived from the subject.
Applications Claiming Priority (2)
| Application Number | Priority Date | Filing Date | Title |
|---|---|---|---|
| US202163272499P | 2021-10-27 | 2021-10-27 | |
| US63/272,499 | 2021-10-27 |
Publications (1)
| Publication Number | Publication Date |
|---|---|
| WO2023074723A1 true WO2023074723A1 (en) | 2023-05-04 |
Family
ID=86157933
Family Applications (1)
| Application Number | Title | Priority Date | Filing Date |
|---|---|---|---|
| PCT/JP2022/039851 WO2023074723A1 (en) | 2021-10-27 | 2022-10-26 | Method for detecting kidney dysfunction diagnostic marker, method for determining nephropathy prognosis, detection kit for kidney dysfunction diagnostic marker, and kidney dysfunction diagnostic marker |
Country Status (1)
| Country | Link |
|---|---|
| WO (1) | WO2023074723A1 (en) |
Citations (4)
| Publication number | Priority date | Publication date | Assignee | Title |
|---|---|---|---|---|
| US20150252423A1 (en) * | 2012-08-10 | 2015-09-10 | The Broad Institute, Inc. | Methods of diagnosing and treating medullary cystic kidney disease |
| JP2018191636A (en) * | 2017-05-12 | 2018-12-06 | 国立大学法人広島大学 | Cancer diagnosis device |
| WO2021106312A1 (en) * | 2019-11-27 | 2021-06-03 | 国立大学法人岡山大学 | Extracellular vesicles derived from living body and containing oncolytic virus |
| US20210169827A1 (en) * | 2019-06-21 | 2021-06-10 | The Broad Institute, Inc. | Agents for reversing toxic proteinopathies |
-
2022
- 2022-10-26 WO PCT/JP2022/039851 patent/WO2023074723A1/en unknown
Patent Citations (4)
| Publication number | Priority date | Publication date | Assignee | Title |
|---|---|---|---|---|
| US20150252423A1 (en) * | 2012-08-10 | 2015-09-10 | The Broad Institute, Inc. | Methods of diagnosing and treating medullary cystic kidney disease |
| JP2018191636A (en) * | 2017-05-12 | 2018-12-06 | 国立大学法人広島大学 | Cancer diagnosis device |
| US20210169827A1 (en) * | 2019-06-21 | 2021-06-10 | The Broad Institute, Inc. | Agents for reversing toxic proteinopathies |
| WO2021106312A1 (en) * | 2019-11-27 | 2021-06-03 | 国立大学法人岡山大学 | Extracellular vesicles derived from living body and containing oncolytic virus |
Non-Patent Citations (4)
| Title |
|---|
| AWDISHU LINDA, TSUNODA SHIRLEY, PEARLMAN MICHELLE, KOKOY-MONDRAGON CHANTHEL, GHASSEMIAN MAJID, NAVIAUX ROBERT K., PATTON HEATHER M: "Identification of Maltase Glucoamylase as a Biomarker of Acute Kidney Injury in Patients with Cirrhosis", CRITICAL CARE RESEARCH AND PRACTICE, vol. 2019, 16 April 2019 (2019-04-16), pages 1 - 8, XP093062051, ISSN: 2090-1305, DOI: 10.1155/2019/5912804 * |
| BOURDERIOUX, M. ET AL.: "IDENTIFICATION OF URINARY EXOSOMAL PROTEINS BY MASS SPECTROMETRY", NEPHROLOGY DIALYSIS TRANSPLANTATION, vol. 27, no. suppl. 2, 2012, pages ii76, XP009545337 * |
| STAUBACH SIMON, WENZEL ANDREA, BECK BODO B., RINSCHEN MARKUS M., MÜLLER STEFAN, HANISCH FRANZ-GEORG: "Autosomal Tubulointerstitial Kidney Disease-MUC1 Type: Differential Proteomics Suggests that Mutated MUC1 (insC) Affects Vesicular Transport in Renal Epithelial Cells", PROTEOMICS, vol. 18, no. 7, 1 April 2018 (2018-04-01), DE , pages 1700456, XP093062055, ISSN: 1615-9853, DOI: 10.1002/pmic.201700456 * |
| YAMAMOTO SATOKO, KAIMORI JUN-YA, YOSHIMURA TAKUJI, NAMBA TOMOKO, IMAI ATSUKO, KOBAYASHI KAORI, IMAMURA RYOICHI, ICHIMARU NAOTSUGU,: "Analysis of an ADTKD family with a novel frameshift mutation in MUC1 reveals characteristic features of mutant MUC1 protein", NEPHROLOGY DIALYSIS TRANSPLANTATION, vol. 32, no. 12, 1 December 2017 (2017-12-01), GB , pages 2010 - 2017, XP093062053, ISSN: 0931-0509, DOI: 10.1093/ndt/gfx083 * |
Similar Documents
| Publication | Publication Date | Title |
|---|---|---|
| WO2009090882A1 (en) | Diagnosis method for non-alcoholic fatty liver disease | |
| AU2013210776A1 (en) | Biomarkers for gastric cancer and uses thereof | |
| WO2021255900A1 (en) | Method for testing aggravation risk of person infected with novel coronavirus, test kit therefor, companion diagnostic drug and aggravation risk marker thereof | |
| JP2012524883A (en) | WNT1 as a kidney injury biomarker | |
| Goligorsky et al. | Diagnostic potential of urine proteome: a broken mirror of renal diseases | |
| US20130040849A1 (en) | Method and kit for cancer diagnosis | |
| US20130210667A1 (en) | Biomarkers for Predicting Kidney and Glomerular Pathologies | |
| Urrego et al. | Utility of urinary transferrin and ceruloplasmin in patients with systemic lupus erythematosus for differentiating patients with lupus nephritis | |
| CN114441760B (en) | Biomarker and kit for liver cancer diagnosis and detection method | |
| Takizawa et al. | Urinary extracellular vesicles signature for diagnosis of kidney disease | |
| JP2024059621A (en) | Compositions and methods for cancer diagnosis and treatment | |
| WO2024067470A1 (en) | Kit for detecting early-stage liver cancer | |
| US20240036050A1 (en) | Methods Of Detecting And Treating Hepatocellular Carcinoma | |
| WO2023074723A1 (en) | Method for detecting kidney dysfunction diagnostic marker, method for determining nephropathy prognosis, detection kit for kidney dysfunction diagnostic marker, and kidney dysfunction diagnostic marker | |
| TWI822802B (en) | Protein biomarkers for nephropathy and applications thereof | |
| US20100047830A1 (en) | Compositions and methods for detecting cancers in a subject | |
| CN116298323B (en) | Biomarker for diagnosing lupus nephritis and application thereof | |
| US20180275135A1 (en) | Biomarker panel to identify steroid resistance in childhood idiopathic nephrotic syndrome | |
| JP6755703B2 (en) | Cancer detection method | |
| EP2895863A1 (en) | New biomarkers for the diagnosis and/or prognosis of clear cell renal cell carcinoma | |
| CN112147329B (en) | Application of ATP citrate lyase as sepsis diagnosis marker | |
| US20240027472A1 (en) | METHODS AND DESIGN OF LUNG HEALTH DIAGNOSTIC (LHDx) TECHNOLOGY FOR DIAGNOSIS AND PROGNOSIS-BASED INTERVENTION OF CHRONIC OBSTRUCTIVE PULMONARY DISORDER (COPD), EMPHYSEMA AND AGE-RELATED LUNG DISEASES | |
| WO2021162030A1 (en) | Metabolite diagnostic biomarker for drug-induced interstitial pneumonia | |
| WO2023277130A1 (en) | Biomarker for detecting tubulointerstitial disorder and use thereof | |
| JP7288428B2 (en) | Use of anti-CD14 antibody useful for presepsin measurement |
Legal Events
| Date | Code | Title | Description |
|---|---|---|---|
| 121 | Ep: the epo has been informed by wipo that ep was designated in this application |
Ref document number: 22887048 Country of ref document: EP Kind code of ref document: A1 |