WO2023054460A1 - プログラム、情報処理装置及び情報処理方法 - Google Patents
プログラム、情報処理装置及び情報処理方法 Download PDFInfo
- Publication number
- WO2023054460A1 WO2023054460A1 PCT/JP2022/036138 JP2022036138W WO2023054460A1 WO 2023054460 A1 WO2023054460 A1 WO 2023054460A1 JP 2022036138 W JP2022036138 W JP 2022036138W WO 2023054460 A1 WO2023054460 A1 WO 2023054460A1
- Authority
- WO
- WIPO (PCT)
- Prior art keywords
- blood vessel
- area ratio
- plaque area
- tomographic images
- histogram
- Prior art date
- Legal status (The legal status is an assumption and is not a legal conclusion. Google has not performed a legal analysis and makes no representation as to the accuracy of the status listed.)
- Ceased
Links
Images




Classifications
-
- A—HUMAN NECESSITIES
- A61—MEDICAL OR VETERINARY SCIENCE; HYGIENE
- A61B—DIAGNOSIS; SURGERY; IDENTIFICATION
- A61B34/00—Computer-aided surgery; Manipulators or robots specially adapted for use in surgery
- A61B34/10—Computer-aided planning, simulation or modelling of surgical operations
-
- A—HUMAN NECESSITIES
- A61—MEDICAL OR VETERINARY SCIENCE; HYGIENE
- A61B—DIAGNOSIS; SURGERY; IDENTIFICATION
- A61B1/00—Instruments for performing medical examinations of the interior of cavities or tubes of the body by visual or photographical inspection, e.g. endoscopes; Illuminating arrangements therefor
-
- A—HUMAN NECESSITIES
- A61—MEDICAL OR VETERINARY SCIENCE; HYGIENE
- A61B—DIAGNOSIS; SURGERY; IDENTIFICATION
- A61B1/00—Instruments for performing medical examinations of the interior of cavities or tubes of the body by visual or photographical inspection, e.g. endoscopes; Illuminating arrangements therefor
- A61B1/04—Instruments for performing medical examinations of the interior of cavities or tubes of the body by visual or photographical inspection, e.g. endoscopes; Illuminating arrangements therefor combined with photographic or television appliances
- A61B1/045—Control thereof
-
- A—HUMAN NECESSITIES
- A61—MEDICAL OR VETERINARY SCIENCE; HYGIENE
- A61B—DIAGNOSIS; SURGERY; IDENTIFICATION
- A61B1/00—Instruments for performing medical examinations of the interior of cavities or tubes of the body by visual or photographical inspection, e.g. endoscopes; Illuminating arrangements therefor
- A61B1/313—Instruments for performing medical examinations of the interior of cavities or tubes of the body by visual or photographical inspection, e.g. endoscopes; Illuminating arrangements therefor for introducing through surgical openings, e.g. laparoscopes
-
- A—HUMAN NECESSITIES
- A61—MEDICAL OR VETERINARY SCIENCE; HYGIENE
- A61B—DIAGNOSIS; SURGERY; IDENTIFICATION
- A61B5/00—Measuring for diagnostic purposes; Identification of persons
- A61B5/0059—Measuring for diagnostic purposes; Identification of persons using light, e.g. diagnosis by transillumination, diascopy, fluorescence
- A61B5/0062—Arrangements for scanning
- A61B5/0066—Optical coherence imaging
-
- A—HUMAN NECESSITIES
- A61—MEDICAL OR VETERINARY SCIENCE; HYGIENE
- A61B—DIAGNOSIS; SURGERY; IDENTIFICATION
- A61B5/00—Measuring for diagnostic purposes; Identification of persons
- A61B5/0059—Measuring for diagnostic purposes; Identification of persons using light, e.g. diagnosis by transillumination, diascopy, fluorescence
- A61B5/0082—Measuring for diagnostic purposes; Identification of persons using light, e.g. diagnosis by transillumination, diascopy, fluorescence adapted for particular medical purposes
- A61B5/0084—Measuring for diagnostic purposes; Identification of persons using light, e.g. diagnosis by transillumination, diascopy, fluorescence adapted for particular medical purposes for introduction into the body, e.g. by catheters
-
- A—HUMAN NECESSITIES
- A61—MEDICAL OR VETERINARY SCIENCE; HYGIENE
- A61B—DIAGNOSIS; SURGERY; IDENTIFICATION
- A61B5/00—Measuring for diagnostic purposes; Identification of persons
- A61B5/02—Detecting, measuring or recording for evaluating the cardiovascular system, e.g. pulse, heart rate, blood pressure or blood flow
- A61B5/02007—Evaluating blood vessel condition, e.g. elasticity, compliance
-
- A—HUMAN NECESSITIES
- A61—MEDICAL OR VETERINARY SCIENCE; HYGIENE
- A61B—DIAGNOSIS; SURGERY; IDENTIFICATION
- A61B8/00—Diagnosis using ultrasonic, sonic or infrasonic waves
- A61B8/08—Clinical applications
- A61B8/0833—Clinical applications involving detecting or locating foreign bodies or organic structures
- A61B8/085—Clinical applications involving detecting or locating foreign bodies or organic structures for locating body or organic structures, e.g. tumours, calculi, blood vessels, nodules
-
- A—HUMAN NECESSITIES
- A61—MEDICAL OR VETERINARY SCIENCE; HYGIENE
- A61B—DIAGNOSIS; SURGERY; IDENTIFICATION
- A61B8/00—Diagnosis using ultrasonic, sonic or infrasonic waves
- A61B8/08—Clinical applications
- A61B8/0891—Clinical applications for diagnosis of blood vessels
-
- A—HUMAN NECESSITIES
- A61—MEDICAL OR VETERINARY SCIENCE; HYGIENE
- A61B—DIAGNOSIS; SURGERY; IDENTIFICATION
- A61B8/00—Diagnosis using ultrasonic, sonic or infrasonic waves
- A61B8/12—Diagnosis using ultrasonic, sonic or infrasonic waves in body cavities or body tracts, e.g. by using catheters
-
- A—HUMAN NECESSITIES
- A61—MEDICAL OR VETERINARY SCIENCE; HYGIENE
- A61B—DIAGNOSIS; SURGERY; IDENTIFICATION
- A61B8/00—Diagnosis using ultrasonic, sonic or infrasonic waves
- A61B8/52—Devices using data or image processing specially adapted for diagnosis using ultrasonic, sonic or infrasonic waves
- A61B8/5215—Devices using data or image processing specially adapted for diagnosis using ultrasonic, sonic or infrasonic waves involving processing of medical diagnostic data
- A61B8/5223—Devices using data or image processing specially adapted for diagnosis using ultrasonic, sonic or infrasonic waves involving processing of medical diagnostic data for extracting a diagnostic or physiological parameter from medical diagnostic data
-
- G—PHYSICS
- G06—COMPUTING OR CALCULATING; COUNTING
- G06T—IMAGE DATA PROCESSING OR GENERATION, IN GENERAL
- G06T7/00—Image analysis
- G06T7/0002—Inspection of images, e.g. flaw detection
- G06T7/0012—Biomedical image inspection
-
- G—PHYSICS
- G16—INFORMATION AND COMMUNICATION TECHNOLOGY [ICT] SPECIALLY ADAPTED FOR SPECIFIC APPLICATION FIELDS
- G16H—HEALTHCARE INFORMATICS, i.e. INFORMATION AND COMMUNICATION TECHNOLOGY [ICT] SPECIALLY ADAPTED FOR THE HANDLING OR PROCESSING OF MEDICAL OR HEALTHCARE DATA
- G16H30/00—ICT specially adapted for the handling or processing of medical images
- G16H30/40—ICT specially adapted for the handling or processing of medical images for processing medical images, e.g. editing
-
- G—PHYSICS
- G16—INFORMATION AND COMMUNICATION TECHNOLOGY [ICT] SPECIALLY ADAPTED FOR SPECIFIC APPLICATION FIELDS
- G16H—HEALTHCARE INFORMATICS, i.e. INFORMATION AND COMMUNICATION TECHNOLOGY [ICT] SPECIALLY ADAPTED FOR THE HANDLING OR PROCESSING OF MEDICAL OR HEALTHCARE DATA
- G16H50/00—ICT specially adapted for medical diagnosis, medical simulation or medical data mining; ICT specially adapted for detecting, monitoring or modelling epidemics or pandemics
- G16H50/20—ICT specially adapted for medical diagnosis, medical simulation or medical data mining; ICT specially adapted for detecting, monitoring or modelling epidemics or pandemics for computer-aided diagnosis, e.g. based on medical expert systems
-
- A—HUMAN NECESSITIES
- A61—MEDICAL OR VETERINARY SCIENCE; HYGIENE
- A61B—DIAGNOSIS; SURGERY; IDENTIFICATION
- A61B34/00—Computer-aided surgery; Manipulators or robots specially adapted for use in surgery
- A61B34/10—Computer-aided planning, simulation or modelling of surgical operations
- A61B2034/107—Visualisation of planned trajectories or target regions
-
- A—HUMAN NECESSITIES
- A61—MEDICAL OR VETERINARY SCIENCE; HYGIENE
- A61B—DIAGNOSIS; SURGERY; IDENTIFICATION
- A61B8/00—Diagnosis using ultrasonic, sonic or infrasonic waves
- A61B8/44—Constructional features of the ultrasonic, sonic or infrasonic diagnostic device
- A61B8/4405—Device being mounted on a trolley
-
- A—HUMAN NECESSITIES
- A61—MEDICAL OR VETERINARY SCIENCE; HYGIENE
- A61M—DEVICES FOR INTRODUCING MEDIA INTO, OR ONTO, THE BODY; DEVICES FOR TRANSDUCING BODY MEDIA OR FOR TAKING MEDIA FROM THE BODY; DEVICES FOR PRODUCING OR ENDING SLEEP OR STUPOR
- A61M25/00—Catheters; Hollow probes
- A61M25/01—Introducing, guiding, advancing, emplacing or holding catheters
- A61M25/0105—Steering means as part of the catheter or advancing means; Markers for positioning
- A61M25/0113—Mechanical advancing means, e.g. catheter dispensers
-
- G—PHYSICS
- G06—COMPUTING OR CALCULATING; COUNTING
- G06T—IMAGE DATA PROCESSING OR GENERATION, IN GENERAL
- G06T2207/00—Indexing scheme for image analysis or image enhancement
- G06T2207/10—Image acquisition modality
- G06T2207/10072—Tomographic images
- G06T2207/10101—Optical tomography; Optical coherence tomography [OCT]
-
- G—PHYSICS
- G06—COMPUTING OR CALCULATING; COUNTING
- G06T—IMAGE DATA PROCESSING OR GENERATION, IN GENERAL
- G06T2207/00—Indexing scheme for image analysis or image enhancement
- G06T2207/10—Image acquisition modality
- G06T2207/10132—Ultrasound image
-
- G—PHYSICS
- G06—COMPUTING OR CALCULATING; COUNTING
- G06T—IMAGE DATA PROCESSING OR GENERATION, IN GENERAL
- G06T2207/00—Indexing scheme for image analysis or image enhancement
- G06T2207/20—Special algorithmic details
- G06T2207/20081—Training; Learning
-
- G—PHYSICS
- G06—COMPUTING OR CALCULATING; COUNTING
- G06T—IMAGE DATA PROCESSING OR GENERATION, IN GENERAL
- G06T2207/00—Indexing scheme for image analysis or image enhancement
- G06T2207/30—Subject of image; Context of image processing
- G06T2207/30004—Biomedical image processing
- G06T2207/30096—Tumor; Lesion
-
- G—PHYSICS
- G06—COMPUTING OR CALCULATING; COUNTING
- G06T—IMAGE DATA PROCESSING OR GENERATION, IN GENERAL
- G06T2207/00—Indexing scheme for image analysis or image enhancement
- G06T2207/30—Subject of image; Context of image processing
- G06T2207/30004—Biomedical image processing
- G06T2207/30101—Blood vessel; Artery; Vein; Vascular
Definitions
- the present invention relates to a program, an information processing device, and an information processing method.
- Patent Literature 1 discloses a medical image processing apparatus capable of obtaining spatial information in which blood vessel information is drawn with high accuracy from noninvasively obtained spatial information.
- Patent Document 1 has a problem that it cannot support the determination of the stent placement position.
- One aspect is to provide a program etc. that can assist in determining the position to place the stent.
- a program acquires a plurality of tomographic images of a blood vessel generated using a diagnostic imaging catheter inserted into the blood vessel, and learns to output information about the blood vessel when the tomographic image of the blood vessel is input.
- the acquired tomographic image of each blood vessel is input to the learning model, information about the blood vessel corresponding to the tomographic image of each blood vessel is output, and based on the information about the blood vessel corresponding to the output tomographic image of each blood vessel.
- a histogram of the plaque area ratio in the blood vessel is generated, the stent length or the lesion length is obtained, and the plaque area ratio threshold value is calculated based on the relationship between the generated histogram and the obtained stent length or lesion length.
- the computer executes a process of outputting the calculated threshold value of the plaque area ratio on a graph showing the relationship between the major axis position and the plaque area ratio.
- FIG. 4 is an explanatory diagram for explaining a blood vessel information output model
- FIG. 4 is an explanatory diagram showing an example of a graph showing the relationship between the average diameter of blood vessels and the long-axis position in a tomographic image of blood vessels
- FIG. 4 is an explanatory diagram showing an example of a graph showing the relationship between the plaque area ratio and the major axis position in a tomographic image of a blood vessel
- FIG. 4 is an explanatory diagram showing an example of a histogram of plaque area ratios
- FIG. 4 is an explanatory diagram showing an example of a histogram of plaque area ratios
- FIG. 4 is an explanatory diagram showing an example of a histogram of plaque area ratios
- FIG. 4 is an explanatory diagram showing an example of a histogram of plaque area ratios
- FIG. 4 is an explanatory diagram showing an example of a histogram of plaque area ratios
- FIG. 4 is an explanatory diagram showing an example of a histogram of
- FIG. 4 is an explanatory diagram showing an example of a histogram of plaque area ratios
- FIG. 10 is an explanatory diagram illustrating a process of deriving a function for obtaining a plaque area ratio threshold
- FIG. 10 is an explanatory diagram illustrating a process of deriving a function for obtaining a plaque area ratio threshold
- FIG. 4 is an explanatory diagram showing an example of a screen displaying a plaque area ratio threshold value on a graph.
- 4 is a flow chart showing a processing procedure for outputting a plaque area ratio threshold.
- FIG. 10 is a flow chart showing the procedure of a subroutine for acquiring information about blood vessels;
- FIG. 10 is a flow chart showing the procedure of a subroutine for generating a histogram of plaque area ratios;
- FIG. FIG. 10 is a flow chart showing the procedure of a subroutine for deriving a function for obtaining a plaque area ratio threshold;
- FIG. FIG. 10 is an explanatory diagram showing an example of a graph showing the relationship between the plaque area ratio and the major axis position in Embodiment 2;
- FIG. 10 is a flow chart showing a processing procedure for generating a histogram of plaque area ratios for each lesion area;
- FIG. FIG. 10 is a flow chart showing a processing procedure for generating a histogram of plaque area ratios for each lesion area;
- FIG. FIG. 10 is a flow chart showing a processing procedure for generating a histogram of plaque area ratios for each lesion area;
- FIG. 4 is an explanatory diagram for explaining the process of generating a histogram of plaque area ratios corresponding to a target region;
- FIG. 4 is an explanatory diagram for explaining the process of generating a histogram of plaque area ratios corresponding to a target region;
- Embodiment 1 relates to an aspect of outputting a plaque burden threshold in a blood vessel based on a tomographic image of the blood vessel that is generated using a diagnostic imaging catheter inserted into the blood vessel.
- a plaque burden threshold is determined based on a tomographic image of the blood vessel that is generated using a diagnostic imaging catheter inserted into the blood vessel.
- FIG. 1 is an explanatory diagram showing an overview of the catheter system 10.
- FIG. A catheter system 10 of this embodiment includes an information processing device 1 , a diagnostic imaging catheter 2 , and an MDU (Motor Drive Unit) 3 .
- the diagnostic imaging catheter 2 is connected to the information processing device 1 via the MDU 3 .
- the diagnostic imaging catheter 2 is for IVUS (Intravascular Ultrasound) used for generating an ultrasonic tomographic image from the inside of a blood vessel, that is, an imaging diagnostic catheter for generating an ultrasonic tomographic image. It may be a catheter or the like for optical tomographic image generation, such as for OCT (Optical Coherence Tomography) or OFDI (Optical Frequency Domain Imaging) for generating a tomographic image. In the following, for the sake of brevity, the diagnostic imaging catheter 2 will be read as the catheter 2 .
- IVUS Intravascular Ultrasound
- OCT Optical Coherence Tomography
- OFDI Optical Frequency Domain Imaging
- a display device 4 and an input device 5 are connected to the information processing device 1 .
- the input device 5 is, for example, an input device such as a keyboard, mouse, trackball, or microphone.
- the display device 4 is a liquid crystal display, an organic EL (electroluminescence) display, or the like, and displays images, information, and the like output from the information processing device 1 .
- the display device 4 and the input device 5 may be laminated integrally to form a touch panel.
- the input device 5 and the information processing device 1 may be configured integrally.
- the computer 1 acquires a plurality of tomographic images of the blood vessel generated using the catheter 2 inserted into the blood vessel.
- the computer 1 inputs the acquired tomographic images of each blood vessel to a blood vessel information output model 171, which will be described later, and outputs blood vessel information corresponding to each blood vessel tomographic image.
- the computer 1 generates a histogram of the plaque area ratio in the blood vessel based on the blood vessel information corresponding to the output tomographic image of each blood vessel.
- Computer 1 obtains the stent length or lesion length.
- the computer 1 calculates a plaque area ratio threshold based on the relationship between the generated histogram and the acquired stent length or lesion length.
- the computer 1 outputs the calculated plaque area ratio threshold on a graph showing the relationship between the major axis position and the plaque area ratio.
- FIG. 2 is an explanatory diagram illustrating the configuration of the catheter system 10.
- the catheter system 10 has the information processing device 1, the catheter 2 and the MDU3.
- the information processing device 1 is a dedicated ultrasonic diagnostic device, or a personal computer, tablet, smartphone, or the like having the function of an ultrasonic diagnostic device.
- the information processing device 1 is an X-ray angiography device, an X-ray CT (Computed Tomography) device, an MRI (Magnetic Resonance Imaging) device, a PET (Positron Emission Tomography) device, or an ultra It is connected to various image diagnostic devices 6 such as an ultrasonic diagnostic device.
- the information processing apparatus 1 is replaced with the computer 1 below.
- the computer 1 includes a control section 11, a storage section 12, a communication section 13, a catheter control section 14, a display section 15, an input section 16, a large capacity storage section 17 and a reading section 18. Each configuration is connected by a bus B.
- the control unit 11 includes an arithmetic processing unit such as a CPU (Central Processing Unit), an MPU (Micro-Processing Unit), a GPU (Graphics Processing Unit), and a control program 1P (information processing program, program product) stored in the storage unit 12. ) to perform various information processing, control processing, and the like related to the computer 1 .
- arithmetic processing unit such as a CPU (Central Processing Unit), an MPU (Micro-Processing Unit), a GPU (Graphics Processing Unit), and a control program 1P (information processing program, program product) stored in the storage unit 12.
- FIG. 2 illustrates the controller 11 as a single processor, it may be a multiprocessor.
- the storage unit 12 includes memory elements such as RAM (Random Access Memory) and ROM (Read Only Memory), and stores the control program 1P or data necessary for the control unit 11 to execute processing.
- the storage unit 12 also temporarily stores data and the like necessary for the control unit 11 to perform arithmetic processing.
- the communication unit 13 is an interface that performs communication between the computer 1 and the network.
- the catheter control unit 14 controls the MDU 3 and generates images based on sensor signals. Note that the control unit 11 may implement the function of the catheter control unit 14 .
- the display unit 15 is an interface that connects the display device 4 and the bus.
- the input unit 16 is an interface that connects the input device 5 and a bus.
- the large-capacity storage unit 17 includes recording media such as HDD (Hard disk drive) and SSD (Solid State Drive).
- a blood vessel information output model 171 is stored in the large-capacity storage unit 17 .
- the blood vessel information output model 171 is an estimator that outputs (estimates) blood vessel information based on a tomographic image of the blood vessel, and is a learned model generated by machine learning.
- the storage unit 12 and the large-capacity storage unit 17 may be configured as an integrated storage device in this embodiment. Also, the large-capacity storage unit 17 may be composed of a plurality of storage devices. Furthermore, the large-capacity storage unit 17 may be an external storage device connected to the computer 1 .
- the reading unit 18 reads a portable storage medium 1a including CD (Compact Disc)-ROM or DVD (Digital Versatile Disc)-ROM.
- the control unit 11 may read the control program 1P from the portable storage medium 1a via the reading unit 18 and store it in the large-capacity storage unit 17 .
- the control unit 11 may download the control program 1P from another computer via the network N or the like and store it in the large-capacity storage unit 17 .
- the control unit 11 may read the control program 1P from the semiconductor memory 1b.
- the MDU3 rotates the sensor and shaft inside the catheter 2.
- Catheter control 14 produces one image per revolution of the sensor.
- the generated image is a transverse layer image centered on the probe portion of the catheter 2 and substantially perpendicular to the probe portion.
- the MDU 3 can be moved forward and backward while rotating the sensor and shaft inside the catheter 2 .
- the pullback operation of rotating the sensor while pulling it toward the MDU 3 side at a constant speed causes the catheter control unit 14 to continuously generate a plurality of cross-layer images substantially perpendicular to the catheter 2 at predetermined intervals.
- the computer 1 uses a blood vessel information output model 171, which will be described later, to perform segmentation processing on the tomographic image of blood vessels.
- FIG. 3 is an explanatory diagram for explaining the blood vessel information output model 171.
- the blood vessel information output model 171 is used as a program module that is part of artificial intelligence software.
- the blood vessel information output model 171 is an estimator that has already constructed a neural network that receives a blood vessel tomographic image as an input and outputs a classification result obtained by classifying regions in the blood vessel tomographic image.
- the blood vessel information output model 171 is realized using a segmentation network such as U-Net (Convolutional Networks for Biomedical Image Segmentation).
- the blood vessel information output model 171 includes a region extraction section 71 and an output section 72 .
- the area extraction unit 71 includes multiple encoder layers and multiple decoder layers connected behind them. Each encoder layer includes a pooling layer and a convolutional layer. Semantic segmentation assigns a label to each pixel that constitutes the input tomographic image of the blood vessel. That is, when a tomographic image of a blood vessel is input to the region extracting unit 71, the region extracting unit 71 classifies each pixel into a lumen region, a media region, a side branch region, and other regions, respectively. Give.
- the output unit 72 outputs a classification result obtained by classifying the lumen region, the media region, the side branch region, and other regions in which each pixel of the tomographic image of the blood vessel is labeled.
- the blood vessel information output model 171 may be configured by a SegNet model, an FCN (Fully Convolutional Network) model, or the like.
- the blood vessel information output model 171 is not limited to the segmentation network described above, RCNN (Regions with Convolutional Neural Network), Fast RCNN, Fast RCNN, SSD (Single Shot Multibook Detector), YOLO (You Only Look Once), SVM ( Support Vector Machine), Bayesian Networks, Transformer Networks, Regression Trees or Random Forests.
- RCNN Regions with Convolutional Neural Network
- Fast RCNN Fast RCNN
- SSD Single Shot Multibook Detector
- YOLO You Only Look Once
- SVM Support Vector Machine
- Bayesian Networks Bayesian Networks
- Transformer Networks Regression Trees or Random Forests.
- the computer 1 acquires information about blood vessels based on the classification results output from the blood vessel information output model 171 .
- Information about vessels includes mean lumen diameter, mean vessel diameter, area, side branch location or plaque area percentage.
- the computer 1 inputs the tomographic image of the blood vessel to the blood vessel information output model 171, and the lumen region, the media region, the side branch region, and the region of the side branch, each pixel of the tomographic image of the blood vessel is labeled. Output the results of classifying other regions.
- the computer 1 calculates the lumen area based on the number of pixels (the number of pixels) in the lumen region output from the blood vessel information output model 171 .
- the computer 1 calculates the blood vessel area based on the number of pixels of the media region and the lumen region output from the blood vessel information output model 171 .
- the computer 1 calculates the plaque area ratio corresponding to the tomographic image of the blood vessel based on the calculated lumen area and blood vessel area using the above equation (1).
- the computer 1 calculates the average lumen diameter and the average blood vessel diameter based on the calculated lumen area and blood vessel area.
- the computer 1 acquires the position (coordinates, for example) of the side branch based on the area of the side branch output from the blood vessel information output model 171 .
- a blood vessel information output model 171 may be constructed that directly outputs information on the blood vessel corresponding to the tomographic image of the blood vessel.
- the computer 1 acquires a plurality of tomographic images of the blood vessel generated using the catheter 2 inserted into the blood vessel.
- the computer 1 inputs the acquired tomographic images of the blood vessels to the blood vessel information output model 171 which has been learned to output information about the blood vessels when the tomographic images of the blood vessels are input, and outputs the tomographic images of the blood vessels. Outputs information about the corresponding vessel.
- the computer 1 acquires multiple tomographic images of blood vessels.
- the computer 1 inputs the acquired tomographic images of each blood vessel to the blood vessel information output model 171, and labels each pixel of the tomographic image of each blood vessel. and output the classification result of classifying other regions. Based on the output classification results, the computer 1 acquires information (average lumen diameter, average vessel diameter, area, side branch position, plaque area ratio, etc.) on the blood vessel corresponding to the tomographic image of each blood vessel.
- the computer 1 generates a histogram of the plaque area ratio in the blood vessel based on the acquired information on the blood vessel.
- a histogram is a chart showing the plaque area ratio in a blood vessel as the number of tomographic images (frequency) of the blood vessel for each predetermined plaque area ratio class width (section size).
- the horizontal axis of the histogram represents the plaque area ratio, and the vertical axis represents the number of tomograms.
- the class width is, for example, 10% increments, 5% increments, or 1% increments.
- FIG. 4 is an explanatory diagram showing an example of a graph showing the relationship between the average diameter of a blood vessel and the long axis position in a tomographic image of the blood vessel.
- the computer 1 acquires multiple tomographic images of blood vessels.
- the computer 1 inputs the obtained tomographic images of the blood vessels to the blood vessel information output model 171, and outputs the blood vessel information corresponding to the tomographic images of the respective blood vessels.
- the computer 1 acquires the average lumen diameter and the average blood vessel diameter corresponding to the tomographic image of each blood vessel from the output blood vessel information.
- the computer 1 generates a graph 91 showing the relationship between the mean diameter of the blood vessel and the long axis position based on the obtained mean lumen diameter and mean blood vessel diameter.
- the computer 1 outputs the generated graph 91 to the display device 4 .
- the display device 4 displays a graph 91 output from the computer 1. As shown, the horizontal axis of the graph 91 indicates the long axis position, and the unit is millimeters (mm). The vertical axis of graph 91 indicates the average diameter of blood vessels (average lumen diameter and average blood vessel diameter), and the unit is millimeters (mm). A polygonal line 11 a indicating the average blood vessel diameter and a polygonal line 11 b indicating the average lumen diameter are displayed on the graph 91 .
- FIG. 4 illustrates an example of a line graph, it is not limited to this, and may be a bar graph or the like.
- the graph 91 is illustrated to explain the relationship between the average diameter of the blood vessel and the long axis position, but the generation of the graph 91 is not essential.
- FIG. 5 is an explanatory diagram showing an example of a graph showing the relationship between plaque area ratio and major axis position in a tomographic image of a blood vessel.
- the computer 1 acquires the plaque area ratio corresponding to the tomographic image of each blood vessel from the blood vessel information output from the blood vessel information output model 171 . Based on the obtained plaque area ratio, the computer 1 generates a graph 92 showing the relationship between the plaque area ratio and the major axis position.
- the computer 1 outputs the generated graph 92 to the display device 4.
- the display device 4 displays the graph 92 output from the computer 1.
- FIG. As shown, the horizontal axis of graph 92 indicates the longitudinal position in millimeters (mm).
- the vertical axis of the graph 92 indicates the plaque area ratio (%).
- the computer 1 generates a histogram (FIGS. 6A, 6B, and 6C) of the plaque area ratio in each blood vessel based on the plaque area ratio corresponding to the tomographic image of each blood vessel.
- FIG. 6A, 6B, and 6C are explanatory diagrams showing examples of histograms of plaque area ratios.
- FIG. 6A is an explanatory diagram showing an example of a histogram generated with the first class width.
- FIG. 6B is an explanatory diagram showing an example of a histogram generated with the second class width.
- FIG. 6C is an explanatory diagram showing an example of a histogram generated with the third class width.
- the first class range is in 10% increments
- the second class range is in 5% increments
- the third class range is in 1% increments.
- the computer 1 acquires the scale of the plaque area ratio. For example, when the class range of plaque area ratio is stored in advance in the storage unit 12 or the large-capacity storage unit 17 , the computer 1 acquires the class range from the storage unit 12 or the large-capacity storage unit 17 . Alternatively, the computer 1 may accept an input of the class range by the operator or the like.
- the computer 1 generates a histogram of the plaque area ratio based on the plaque area ratio according to the acquired class width.
- the computer 1 outputs the generated histogram of the plaque area ratio to the display device 4 .
- the display device 4 displays the histogram of the plaque area ratio output from the computer 1 .
- the horizontal axis of the histogram indicates the plaque area ratio (%).
- the vertical axis of the histogram indicates the number of tomographic images of the blood vessel for each class width of the predetermined plaque area ratio, and the unit is one sheet.
- the class width can be automatically changed for the generated histogram of the plaque area ratio.
- the computer 1 adds the number of tomograms (frequency) in order from the right class of the histogram.
- the computer 1 calculates the stent length based on the added number of tomographic images. For example, when 30 tomographic images are acquired in a section of 1 mm in the longitudinal direction, 990 tomographic images are acquired in a section of 33 mm in the longitudinal direction.
- Computer 1 determines whether two or more stent lengths are included in the same class. Stent lengths include, for example, 9 mm, 12 mm, 15 mm, 18 mm, 21 mm, 24 mm, 28 mm, 33 mm or 38 mm. The stent length may be determined according to the manufacturer of the stent specified by the user.
- the computer 1 determines that two or more stent lengths (for example, 21 mm and 24 mm) are included in the same class, it changes the class width to a class width representing a finer section. For example, the computer 1 changes from a class range of 10% increments to a class range of 5% increments. Note that the lesion length may be used instead of the stent length for the class width change processing described above.
- the computer 1 regenerates the histogram of the plaque area ratio based on the plaque area ratio according to the changed class width.
- FIGS. 7A and 7B are explanatory diagrams explaining the process of deriving a function for obtaining the plaque area ratio threshold.
- the function for obtaining the plaque area ratio threshold is a function representing the relationship between the stent length and the plaque area ratio threshold.
- FIG. 7A is an explanatory diagram illustrating sample point calculation processing based on the class width. Note that FIG. 7A illustrates an example in which the class width is in increments of 10%.
- the computer 1 calculates sample points for generating a regression curve representing the relationship between the stent length and the plaque area ratio threshold. Sample points are generated based on the histogram of plaque area percentage (FIG. 6A). Specifically, the computer 1 sequentially adds the number of tomographic images to the class width of the plaque area ratio from the right class. The computer 1 calculates the long axis position based on the added number of tomographic images. The computer 1 calculates the value of the plaque area ratio corresponding to the calculated long axis position as a sample point.
- the computer 1 adds the number of tomographic images corresponding to the class width of "0.7 to 0.8" based on the plaque area ratio histogram shown in FIG. 6A.
- the number of tomographic images added is 50 sheets.
- the computer 1 calculates the long axis position based on the added number of tomographic images. For example, when 30 tomographic images are acquired in a section of 1 mm in the longitudinal direction, the added 50 tomographic images are calculated to be approximately 1.67 mm in the longitudinal direction.
- the computer 1 calculates the value of the plaque area ratio corresponding to the calculated long axis position of 1.67 mm as a sample point. As shown, sample points 12a are displayed on the graph.
- the computer 1 adds the number of tomograms corresponding to the class width of "0.6 to 0.7".
- the number of tomographic images added is 820 sheets.
- the computer 1 calculates the long axis position based on the added number of tomographic images. For example, when 30 tomographic images are acquired in a section of 1 mm in the longitudinal direction, the added 820 tomographic images are calculated to be approximately 27.33 mm in the longitudinal direction.
- the computer 1 calculates the value of the plaque area ratio corresponding to the calculated long axis position of 27.33 mm as a sample point. As shown, sample points 12b are displayed on the graph.
- FIG. 7A illustrates an example in which the class width is in increments of 10%, but the same can be applied to other class widths. The more the class width is increased, the more sample points are calculated, so it is possible to generate a highly accurate regression curve. Note that the regression curve will be described with reference to FIG. 7B.
- FIG. 7B is an explanatory diagram for explaining the process of creating a regression curve using sample points.
- the computer 1 generates a regression curve approximated using, for example, the least-squares method, by determining the correlation between the stent length and the plaque area ratio threshold using the calculated sample points as a point sequence. do.
- the generated regression curve 12c is displayed on the graph.
- a function representing the regression curve can be used to determine the plaque area percentage threshold.
- the computer 1 calculates the plaque area ratio threshold when the stent length is input to the above-described formula (2).
- the computer 1 outputs the calculated plaque area ratio threshold to the display device 4 .
- FIG. 7A and FIG. 7B describe the process of calculating the threshold value of the plaque area ratio with respect to the stent length, but it can be similarly applied to the process of calculating the threshold value with respect to the lesion length.
- FIG. 8 is an explanatory diagram showing an example of a screen that displays the plaque area ratio threshold on a graph.
- the computer 1 calculates the plaque area ratio threshold using the formula (2) described above.
- the computer 1 outputs the calculated threshold value of the plaque area ratio on the graph 92 and outputs the graph 92 including the threshold value of the plaque area ratio to the display device 4 .
- display device 4 displays graph 92 output from computer 1 .
- a discrimination line 13 a indicating the threshold value of the plaque area ratio is displayed on the graph 92 .
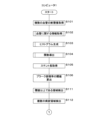
- FIG. 9 is a flow chart showing the processing procedure when outputting the plaque area ratio threshold.
- the controller 11 of the computer 1 acquires a plurality of tomographic images of the blood vessel generated using the catheter 2 inserted into the blood vessel from the catheter controller 14 (step S101).
- the control unit 11 uses the blood vessel information output model 171 to execute a subroutine of processing for acquiring information about blood vessels (step S102).
- the control unit 11 executes a subroutine for processing to generate a histogram of plaque area ratios (step S103).
- the control unit 11 executes a subroutine for deriving a function for obtaining a threshold value of the plaque area ratio (step S104). Subroutines for acquisition processing of blood vessel information, histogram generation processing, and function derivation processing will be described later.
- the control unit 11 acquires the stent length (step S105). For example, if the stent length is stored in the storage unit 12 or the large-capacity storage unit 17 in advance, the control unit 11 may acquire the stored stent length from the storage unit 12 or the large-capacity storage unit 17 . Alternatively, the control unit 11 may receive an input of the stent length by the operator or the like from the input device 5 via the input unit 16 . Note that the control unit 11 may acquire the lesion length instead of the stent length.
- the control unit 11 substitutes the acquired stent length (or lesion length) into the derived function to calculate the plaque area ratio threshold (step S106).
- the control unit 11 outputs the calculated threshold value of the plaque area ratio to the display device 4 via the display unit 15 (step S107). The control unit 11 terminates the process.
- FIG. 10 is a flowchart showing the procedure of a subroutine for acquiring information about blood vessels.
- the control unit 11 acquires a tomographic image of one blood vessel from a plurality of tomographic images of blood vessels acquired in the process of step S101 (FIG. 9) (step S01).
- the control unit 11 inputs the acquired tomographic image of the blood vessel to the blood vessel information output model 171 (step S02), and displays the luminal region, the medial region, and the side branch of which each pixel of the tomographic image of the blood vessel is labeled.
- a classification result obtained by classifying the area and other areas is output (step S03).
- the control unit 11 acquires information about blood vessels based on the output classification results (step S04).
- Information about vessels includes mean lumen diameter, mean vessel diameter, area (lumen area and vessel area), location of side branches or percent plaque area.
- control unit 11 calculates the lumen area based on the number of pixels in the lumen area output from the blood vessel information output model 171 .
- the control unit 11 calculates the blood vessel area based on the number of pixels of the media region and the lumen region output from the blood vessel information output model 171 .
- the control unit 11 calculates the plaque area ratio corresponding to the tomographic image of the blood vessel based on the calculated lumen area and blood vessel area using the above-described formula (1).
- the control unit 11 determines whether or not the tomographic image of the blood vessel is the last tomographic image among a plurality of tomographic images of blood vessels (step S05). When the control unit 11 determines that the tomographic image of the blood vessel is the last tomographic image (YES in step S05), it outputs information about the blood vessel corresponding to each tomographic image of the blood vessel (step S06). The control unit 11 terminates the subroutine of the blood vessel information acquisition process and returns. When the control unit 11 determines that the tomographic image of the blood vessel is not the last tomographic image (NO in step S05), the process returns to step S01.
- FIG. 11 is a flowchart showing the processing procedure of a subroutine for processing to generate a histogram of plaque area ratios.
- the control unit 11 of the computer 1 acquires the plaque area ratio corresponding to the tomographic image of each blood vessel from the blood vessel information output from the blood vessel information output model 171 (step S11).
- the control unit 11 acquires the plaque area ratio class range (for example, in increments of 10%) stored in advance in the storage unit 12 (step S12). Note that the control unit 11 may receive, from the input device 5 via the input unit 16, the setting of the class range input by the operator or the like.
- the control unit 11 generates a histogram of the plaque area ratio based on the acquired plaque area ratio according to the acquired class width (step S13).
- the control unit 11 adds the number of tomograms in order from the right class of the histogram (step S14).
- the controller 11 calculates the stent length based on the added number of tomographic images (step S15). For example, if 1 mm corresponds to 30 tomographic images, 990 tomographic images corresponds to approximately 33 mm.
- the control unit 11 determines whether two or more stent lengths (eg, 21 mm and 24 mm) are included in the same class (step S16). If the control unit 11 determines that two or more stent lengths are not included in the same class (NO in step S16), it ends the subroutine of the histogram generation processing and returns.
- two or more stent lengths eg, 21 mm and 24 mm
- the control unit 11 When determining that two or more stent lengths are included in the same class (YES in step S16), the control unit 11 changes the class range to a class range representing a finer section (step S17). .
- the control unit 11 may change the class width in increments of 10% to the class width in increments of 5%.
- the control unit 11 returns to the process of step S13, and regenerates the histogram of the plaque area ratio based on the plaque area ratio according to the changed class width.
- FIG. 12 is a flowchart showing the processing procedure of a subroutine for deriving a function for obtaining a plaque area ratio threshold.
- the control unit 11 calculates sample points for generating a regression curve representing the relationship between the stent length and the plaque area ratio threshold (step S21). Specifically, the control unit 11 sequentially adds the number of tomographic images to the class width of the plaque area ratio from the right class.
- the computer 1 calculates the long axis position based on the added number of tomographic images.
- the computer 1 calculates plaque area ratio values corresponding to the calculated major axis positions on the graph as sample points.
- the control unit 11 obtains the correlation between the stent length and the plaque area ratio threshold using the calculated plurality of sample points as a point sequence, thereby deriving a function representing a regression curve approximated using, for example, the least squares method. (Step S22). The control unit 11 terminates the function derivation processing subroutine and returns.
- Embodiment 2 relates to a form of detecting a lesion area based on a plaque area ratio threshold in a blood vessel.
- description is abbreviate
- FIG. 13 is an explanatory diagram showing an example of a graph showing the relationship between the plaque area ratio and the major axis position in Embodiment 2.
- FIG. 13 the same code
- the computer 1 outputs a plaque area ratio threshold value for a plurality of blood vessels based on the tomographic images of the blood vessels. Note that the process of outputting the threshold value of the plaque area ratio is the same as that of the first embodiment, so the description thereof is omitted.
- the computer 1 detects the lesion area based on the output plaque area ratio threshold. Specifically, the computer 1 detects regions where the plaque area ratio is greater than or equal to the threshold value. The computer 1 detects a plurality of lesion areas from the detected area based on a predetermined distance for each lesion area.
- the predetermined distance for each lesion area is, for example, 3 mm.
- the computer 1 determines whether or not the distance (difference) between the values of the plaque area ratio is equal to or less than a predetermined distance with respect to the regions where the plaque area ratio is equal to or greater than the threshold value. When the computer 1 determines that the distance between plaque area ratio values is equal to or less than a predetermined distance, the computer 1 detects the same lesion area. When the computer 1 determines that the distance between the plaque area ratio values exceeds a predetermined distance, it detects it as a different lesion area. In this manner, a plurality of lesion areas can be detected based on the predetermined distance for each lesion area.
- the computer 1 outputs the plaque area ratio threshold and multiple lesion areas on the graph 92 .
- the computer 1 outputs a plurality of lesion areas on the graph 92 so as to distinguish each lesion area in a display mode such as color or pattern.
- Computer 1 outputs graph 92 to display device 4 .
- the display device 4 displays the graph 92 output from the computer 1.
- FIG. As shown in the figure, a discrimination line 13a indicating a plaque area ratio threshold and a plurality of lesion regions 13b are displayed on a graph 92.
- placement positions at both ends of the stent can be determined based on the detected lesion area.
- the computer 1 determines placement positions at both ends of the stent based on the plaque area ratio. Plaque-free and normal sites are desirable for the placement locations (landing zones) at both ends of the stent. It may be a part with the smallest area ratio or the like.
- the computer 1 outputs the determined indwelling positions of both ends of the stent on a graph 92 and outputs the graph 92 to the display device 4 .
- the display device 4 displays the graph 92 output from the computer 1.
- FIG. As shown, a stent distal end 13c representing the distal end of the stent and a stent proximal end 13d representing the proximal end of the stent are displayed on graph 92.
- FIGS. 14 and 15 are flowcharts showing processing procedures for generating a histogram of plaque area ratios for each lesion area.
- symbol is attached
- the control unit 11 of the computer 1 After executing the processing of step S106, the control unit 11 of the computer 1 detects regions where the plaque area ratio is equal to or greater than the threshold (step S111). It should be noted that the control unit 11 may use a preset plaque area ratio threshold without executing the processes of steps S101 to S106.
- the control unit 11 detects a plurality of lesion areas based on a predetermined distance (for example, 2 mm) for each lesion area (step S112). Specifically, the control unit 11 determines whether or not the distance (difference) between the plaque area ratio values for the detected area is equal to or less than a predetermined distance. When the control unit 11 determines that the distance between the plaque area ratio values is equal to or less than a predetermined distance, the control unit 11 detects the same lesion area. When the control unit 11 determines that the distance between the values of the plaque area ratio exceeds a predetermined distance, the control unit 11 detects it as a different lesion area.
- a predetermined distance for example, 2 mm
- the control unit 11 acquires one lesion area from among the plurality of detected lesion areas (step S113).
- the control unit 11 executes a subroutine of processing for generating a histogram of plaque area ratios for the acquired lesion area (step S114).
- the control unit 11 executes a subroutine for deriving a function for obtaining a plaque area ratio threshold for the acquired lesion area (step S115).
- the control unit 11 acquires the stent length from the storage unit 12 (step S116). Note that the control unit 11 may acquire the lesion length instead of the stent length.
- the control unit 11 substitutes the acquired stent length (or lesion length) into the derived function to calculate the plaque area ratio threshold (step S117).
- the control unit 11 determines whether or not the lesion area is the last lesion area from among the plurality of detected lesion areas (step S118). When the control unit 11 determines that the lesion area is the last lesion area (YES in step S118), the control unit 11 outputs the histogram of the plaque area ratio generated for each lesion area to the display device 4 via the display unit 15. (step S119). The control unit 11 terminates the process. When the control unit 11 determines that the lesion area is not the last lesion area (NO in step S118), the control unit 11 returns to the process of step S113 and acquires the lesion area next to the lesion area.
- Embodiment 3 relates to a mode of generating a histogram of plaque area ratios corresponding to a target region set (designated) by an operator or the like. Note that the description of the contents overlapping those of the first and second embodiments will be omitted.
- FIG. 16A and 16B are explanatory diagrams illustrating the process of generating a histogram of plaque area ratios corresponding to target regions.
- FIG. 16A is an explanatory diagram showing an example of a graph showing the relationship between plaque area ratio and major axis position. Note that the same reference numerals are assigned to the contents that overlap with those in FIG. 13, and the description thereof is omitted.
- FIG. 16A includes an area setting field 14a.
- the area setting field 14a is a field for receiving the setting of the target area for generating the histogram.
- the computer 1 When the computer 1 receives a setting operation in the area setting field 14a, it acquires the set target area. The computer 1 generates a histogram of plaque area percentages corresponding to the acquired target regions. Note that the histogram generation processing is the same as that of the first embodiment, so the description is omitted. The computer 1 outputs the generated histogram of the plaque area ratio to the display device 4 . The display device 4 displays the histogram of the plaque area ratio output from the computer 1 .
- FIG. 16B is an explanatory diagram showing an example of a histogram of plaque area ratios.
- the histogram shown in FIG. 16B is generated based on the target area set by the area setting field 14a in FIG. 16A. Note that the histogram is the same as in FIGS. 6A, 6B, and 6C, so the description is omitted.
- the computer 1 When a plurality of target regions are set in the region setting field 14a, the computer 1 generates a histogram of plaque area ratios for each target region.
Landscapes
- Health & Medical Sciences (AREA)
- Life Sciences & Earth Sciences (AREA)
- Engineering & Computer Science (AREA)
- Medical Informatics (AREA)
- Public Health (AREA)
- General Health & Medical Sciences (AREA)
- Surgery (AREA)
- Biomedical Technology (AREA)
- Pathology (AREA)
- Veterinary Medicine (AREA)
- Nuclear Medicine, Radiotherapy & Molecular Imaging (AREA)
- Heart & Thoracic Surgery (AREA)
- Molecular Biology (AREA)
- Physics & Mathematics (AREA)
- Animal Behavior & Ethology (AREA)
- Biophysics (AREA)
- Radiology & Medical Imaging (AREA)
- Computer Vision & Pattern Recognition (AREA)
- Vascular Medicine (AREA)
- Primary Health Care (AREA)
- Physiology (AREA)
- Epidemiology (AREA)
- Optics & Photonics (AREA)
- Quality & Reliability (AREA)
- Robotics (AREA)
- Databases & Information Systems (AREA)
- General Physics & Mathematics (AREA)
- Theoretical Computer Science (AREA)
- Data Mining & Analysis (AREA)
- Cardiology (AREA)
- Apparatus For Radiation Diagnosis (AREA)
- Ultra Sonic Daignosis Equipment (AREA)
Priority Applications (2)
| Application Number | Priority Date | Filing Date | Title |
|---|---|---|---|
| JP2023551594A JP7849374B2 (ja) | 2021-09-30 | 2022-09-28 | プログラム、情報処理装置及び情報処理方法 |
| US18/622,532 US12530772B2 (en) | 2021-09-30 | 2024-03-29 | Medical image processing apparatus and method |
Applications Claiming Priority (2)
| Application Number | Priority Date | Filing Date | Title |
|---|---|---|---|
| JP2021-161698 | 2021-09-30 | ||
| JP2021161698 | 2021-09-30 |
Related Child Applications (1)
| Application Number | Title | Priority Date | Filing Date |
|---|---|---|---|
| US18/622,532 Continuation US12530772B2 (en) | 2021-09-30 | 2024-03-29 | Medical image processing apparatus and method |
Publications (1)
| Publication Number | Publication Date |
|---|---|
| WO2023054460A1 true WO2023054460A1 (ja) | 2023-04-06 |
Family
ID=85782831
Family Applications (1)
| Application Number | Title | Priority Date | Filing Date |
|---|---|---|---|
| PCT/JP2022/036138 Ceased WO2023054460A1 (ja) | 2021-09-30 | 2022-09-28 | プログラム、情報処理装置及び情報処理方法 |
Country Status (3)
| Country | Link |
|---|---|
| US (1) | US12530772B2 (https=) |
| JP (1) | JP7849374B2 (https=) |
| WO (1) | WO2023054460A1 (https=) |
Cited By (1)
| Publication number | Priority date | Publication date | Assignee | Title |
|---|---|---|---|---|
| WO2025070350A1 (ja) * | 2023-09-25 | 2025-04-03 | テルモ株式会社 | 情報処理方法、プログラム及び情報処理装置 |
Families Citing this family (1)
| Publication number | Priority date | Publication date | Assignee | Title |
|---|---|---|---|---|
| CN121335671A (zh) * | 2023-03-30 | 2026-01-13 | 波士顿科学国际有限公司 | 用于血管内斑块负荷指示的图形用户界面 |
Citations (4)
| Publication number | Priority date | Publication date | Assignee | Title |
|---|---|---|---|---|
| JP2008512171A (ja) * | 2004-09-09 | 2008-04-24 | メディガイド リミテッド | 内腔内の選択された位置へ医療用デバイスを移送するための方法およびシステム |
| JP2020503909A (ja) * | 2016-09-28 | 2020-02-06 | ライトラボ・イメージング・インコーポレーテッド | ステント計画システム及び血管表現を使用する方法 |
| KR20210016860A (ko) * | 2019-08-05 | 2021-02-17 | 재단법인 아산사회복지재단 | 초음파 영상 기반의 기계 학습을 통한 관상동맥 병변 진단 시스템 및 이의 진단 방법 |
| JP2021517034A (ja) * | 2018-03-15 | 2021-07-15 | コーニンクレッカ フィリップス エヌ ヴェKoninklijke Philips N.V. | 管腔内病巣評価及び処置計画のための解剖学的標識の決定及び可視化 |
Family Cites Families (1)
| Publication number | Priority date | Publication date | Assignee | Title |
|---|---|---|---|---|
| JP7164423B2 (ja) | 2018-12-12 | 2022-11-01 | キヤノンメディカルシステムズ株式会社 | 医用画像処理装置、x線ct装置及び医用画像処理方法 |
-
2022
- 2022-09-28 JP JP2023551594A patent/JP7849374B2/ja active Active
- 2022-09-28 WO PCT/JP2022/036138 patent/WO2023054460A1/ja not_active Ceased
-
2024
- 2024-03-29 US US18/622,532 patent/US12530772B2/en active Active
Patent Citations (4)
| Publication number | Priority date | Publication date | Assignee | Title |
|---|---|---|---|---|
| JP2008512171A (ja) * | 2004-09-09 | 2008-04-24 | メディガイド リミテッド | 内腔内の選択された位置へ医療用デバイスを移送するための方法およびシステム |
| JP2020503909A (ja) * | 2016-09-28 | 2020-02-06 | ライトラボ・イメージング・インコーポレーテッド | ステント計画システム及び血管表現を使用する方法 |
| JP2021517034A (ja) * | 2018-03-15 | 2021-07-15 | コーニンクレッカ フィリップス エヌ ヴェKoninklijke Philips N.V. | 管腔内病巣評価及び処置計画のための解剖学的標識の決定及び可視化 |
| KR20210016860A (ko) * | 2019-08-05 | 2021-02-17 | 재단법인 아산사회복지재단 | 초음파 영상 기반의 기계 학습을 통한 관상동맥 병변 진단 시스템 및 이의 진단 방법 |
Cited By (1)
| Publication number | Priority date | Publication date | Assignee | Title |
|---|---|---|---|---|
| WO2025070350A1 (ja) * | 2023-09-25 | 2025-04-03 | テルモ株式会社 | 情報処理方法、プログラム及び情報処理装置 |
Also Published As
| Publication number | Publication date |
|---|---|
| US12530772B2 (en) | 2026-01-20 |
| JPWO2023054460A1 (https=) | 2023-04-06 |
| JP7849374B2 (ja) | 2026-04-21 |
| US20240242352A1 (en) | 2024-07-18 |
Similar Documents
| Publication | Publication Date | Title |
|---|---|---|
| CN107787201B (zh) | 血管内成像系统界面和阴影检测方法 | |
| JP7801065B2 (ja) | コンピュータプログラム、情報処理方法及び情報処理装置 | |
| US12530772B2 (en) | Medical image processing apparatus and method | |
| NL2030789B1 (en) | method and device for associating sets of cardiovascular data | |
| WO2023152022A1 (en) | Identifying angiographic images for vessel assessment | |
| JP7536861B2 (ja) | プログラム、情報処理方法、情報処理装置及びモデル生成方法 | |
| JP7803869B2 (ja) | プログラム、情報処理装置及び情報処理方法 | |
| JP7536862B2 (ja) | プログラム、情報処理方法、情報処理装置及びモデル生成方法 | |
| JP2021104337A (ja) | 内腔に沿った管腔内デバイスの管腔内経路の推定 | |
| US12518382B2 (en) | Medical system, method for processing medical image, and medical image processing apparatus | |
| US20240005459A1 (en) | Program, image processing method, and image processing device | |
| JP7843748B2 (ja) | プログラム、情報処理方法及び情報処理装置 | |
| JP2023112551A (ja) | プログラム、情報処理方法、情報処理装置及びカテーテルシステム | |
| JP7667134B2 (ja) | プログラム、情報処理方法、情報処理装置及びモデル生成方法 | |
| WO2022268624A1 (en) | Intraluminal device data quality metric | |
| JP7801064B2 (ja) | コンピュータプログラム、情報処理方法及び情報処理装置 | |
| JP7813276B2 (ja) | コンピュータプログラム、情報処理方法及び情報処理装置 | |
| JP7597626B2 (ja) | プログラム、画像処理方法、画像処理装置及びモデル生成方法 | |
| US20250221624A1 (en) | Image diagnostic system, image diagnostic method, and storage medium | |
| US20250248664A1 (en) | Image diagnostic system and method | |
| WO2025205753A1 (ja) | 情報処理方法、情報処理装置及びプログラム | |
| EP4712863A1 (en) | System, method and computer-accessible medium for providing automated image path registration | |
| WO2024071054A1 (ja) | 画像処理装置、画像表示システム、画像表示方法、及び画像処理プログラム | |
| JP2024050046A (ja) | コンピュータプログラム、情報処理方法及び情報処理装置 | |
| WO2023100838A1 (ja) | コンピュータプログラム、情報処理装置、情報処理方法及び学習モデル生成方法 |
Legal Events
| Date | Code | Title | Description |
|---|---|---|---|
| 121 | Ep: the epo has been informed by wipo that ep was designated in this application |
Ref document number: 22876326 Country of ref document: EP Kind code of ref document: A1 |
|
| WWE | Wipo information: entry into national phase |
Ref document number: 2023551594 Country of ref document: JP |
|
| NENP | Non-entry into the national phase |
Ref country code: DE |
|
| 122 | Ep: pct application non-entry in european phase |
Ref document number: 22876326 Country of ref document: EP Kind code of ref document: A1 |