WO2023038022A1 - 測定システム、測定システムの異常判定方法、及び、測定システムの異常判定プログラム - Google Patents
測定システム、測定システムの異常判定方法、及び、測定システムの異常判定プログラム Download PDFInfo
- Publication number
- WO2023038022A1 WO2023038022A1 PCT/JP2022/033404 JP2022033404W WO2023038022A1 WO 2023038022 A1 WO2023038022 A1 WO 2023038022A1 JP 2022033404 W JP2022033404 W JP 2022033404W WO 2023038022 A1 WO2023038022 A1 WO 2023038022A1
- Authority
- WO
- WIPO (PCT)
- Prior art keywords
- sensor
- measured
- value
- machine learning
- measurement system
- Prior art date
- Legal status (The legal status is an assumption and is not a legal conclusion. Google has not performed a legal analysis and makes no representation as to the accuracy of the status listed.)
- Ceased
Links
Images





Classifications
-
- G—PHYSICS
- G01—MEASURING; TESTING
- G01N—INVESTIGATING OR ANALYSING MATERIALS BY DETERMINING THEIR CHEMICAL OR PHYSICAL PROPERTIES
- G01N27/00—Investigating or analysing materials by the use of electric, electrochemical, or magnetic means
- G01N27/26—Investigating or analysing materials by the use of electric, electrochemical, or magnetic means by investigating electrochemical variables; by using electrolysis or electrophoresis
-
- G—PHYSICS
- G01—MEASURING; TESTING
- G01N—INVESTIGATING OR ANALYSING MATERIALS BY DETERMINING THEIR CHEMICAL OR PHYSICAL PROPERTIES
- G01N33/00—Investigating or analysing materials by specific methods not covered by groups G01N1/00 - G01N31/00
- G01N33/18—Water
-
- G—PHYSICS
- G06—COMPUTING OR CALCULATING; COUNTING
- G06N—COMPUTING ARRANGEMENTS BASED ON SPECIFIC COMPUTATIONAL MODELS
- G06N20/00—Machine learning
Definitions
- the present invention relates to a measurement system for measuring sample properties such as water quality, an abnormality determination method for the measurement system, and an abnormality determination program for the measurement system.
- the output value of the sensor may deviate from the value that should be output due to contamination of the sensor or malfunction of parts that affect the output value of the sensor. may have been lost.
- machine learning In recent years, it has also been considered to use machine learning to automatically make maintenance decisions for measurement systems.
- machine learning supervised learning is performed using combinations of past sensor output values and measured values obtained from the output values as teacher data (learning data set). Then, a method of determining the necessity of maintenance by comparing the predicted value obtained by this machine learning and the actual measured value is conceivable.
- the predicted values estimated by the machine learning model may differ greatly from the actual measurements. be. Then, even if the measurement system does not require maintenance, it is determined that the measurement system requires maintenance.
- the present invention has been made to solve the above problems, and in a measurement system utilizing machine learning, it is possible to determine the necessity of maintenance of measuring equipment or the necessity of re-learning a machine learning model. is the main subject.
- the measuring system uses a measuring device having at least a first sensor and a second sensor, and a machine learning model that learns the relationship between the measured value of the first sensor and the measured value of the second sensor, A predicted value estimating unit that estimates the predicted value of the second sensor from the measured value of the first sensor, and the predicted value of the second sensor and the measured value of the second sensor are compared, and the machine learning model or the and an abnormality determination unit that determines which of the measuring devices has an abnormality.
- the machine learning model is used to estimate the predicted value of the second sensor from the measured value of the first sensor, and the estimated predicted value of the second sensor and the measured value of the second sensor By comparing the values, it is determined whether the machine learning model or the measuring device has an abnormality, so the need for maintenance of the measuring device can be determined with high accuracy. In addition, when it is determined that the machine learning model is abnormal, it is possible to detect that the tendency of the sample has changed since the machine learning model was created, and to relearn the machine learning model.
- the abnormality determination unit determines whether the difference or ratio between the predicted value of the second sensor and the actual value of the second sensor is within a predetermined allowable range. and if outside the allowable range, determine whether the machine learning model or the measuring device has an anomaly.
- the abnormality determination unit uses a nonparametric density estimation method to determine which of the machine learning model or the measuring device has an abnormality.
- the abnormality determination unit determines an abnormality in an area where the data density of the learning data set for which the machine learning model is created is equal to or higher than a predetermined threshold. If so, it is determined that the machine learning model is abnormal, and if the data density is determined to be abnormal in an area less than the threshold, it is determined that the measuring device or the machine learning model is abnormal It is desirable to In addition, when it is determined that the measuring device or the machine learning model is abnormal in the area below the threshold, if the internal data of the measuring device is analyzed and no abnormality is confirmed, the possibility that the machine learning model is abnormal can be judged to be high.
- the measurement system according to the present invention may further include a machine learning unit that creates the machine learning model using a learning data set composed of the measured values of the first sensor and the measured values of the second sensor. desirable.
- a machine learning unit that creates the machine learning model using a learning data set composed of the measured values of the first sensor and the measured values of the second sensor.
- the machine learning unit re-learns the machine learning model when the abnormality determination unit determines that the machine learning model is abnormal.
- the reliability of the machine learning model can be improved.
- the need for maintenance of the measuring equipment can be determined with even higher accuracy.
- a maintenance signal prompting the user to perform maintenance on the measuring device when the abnormality determining unit determines that the measuring device is abnormal.
- Each of the first sensor and the second sensor measures conductivity, resistivity, oxidation-reduction potential (ORP), chemical oxygen demand (COD), turbidity, chromaticity, temperature, pressure, oil film, or It is conceivable that one of the concentrations of the predetermined component contained in the sample is measured.
- the user performs sensor maintenance, which is a series of operations including cleaning the sensor, calibrating the sensor, replacing the sensor, relearning the machine learning model, and changing the maintenance cycle, at regular intervals.
- sensor maintenance is a series of operations including cleaning the sensor, calibrating the sensor, replacing the sensor, relearning the machine learning model, and changing the maintenance cycle, at regular intervals.
- the deterioration tendency which is the deterioration of the sensor over time
- the maintenance period reflecting the deterioration tendency is calculated for the sensor alone.
- the method of calculating the maintenance cycle reflecting the deterioration tendency for each sensor it is necessary to grasp the deterioration tendency of each of a plurality of sensors.
- the deterioration tendencies of a plurality of sensors belonging to the same measurement system may be similar.
- the term "same measurement system” as used herein refers to, for example, a flow path from upstream to downstream in the same tank or water treatment facility with no inflow from other sources. In this case, when the user grasps the deterioration tendency of a certain sensor, it is possible to estimate the deterioration tendency of other sensors based on the deterioration tendency of that sensor.
- the measurement system includes: reference deterioration data indicating the relationship between a state prediction value that predicts the state of the first sensor and time; and a state actual value that actually measures the state of the first sensor and the relationship between time and a deterioration determination unit that determines whether the difference between the measured state value and the predicted state value of the first sensor is within an allowable range, based on the actually measured deterioration data indicating outputting an out-of-allowable-range deterioration signal indicating that the state of the first sensor is out of the allowable range when it is determined that it is out of the allowable range.
- the user perceives an out-of-tolerance degradation signal output by the measurement system indicative of the out-of-tolerance degradation of the first sensor so that the user is informed about other sensors in the measurement system.
- it can be estimated that deterioration outside the allowable range has occurred.
- the user can check the deterioration state of other sensors in the same measurement system even if the maintenance period is not calculated in advance.
- the measurement system calculates first measured deterioration data indicating the relationship between the measured state value of the first sensor and time and second measured deterioration data indicating the relationship between the measured state value of the second sensor and time. and a maintenance cycle calculator that calculates the maintenance cycle of the first sensor and the maintenance cycle of the second sensor based on the first measured deterioration data and the second measured deterioration data. can be considered.
- the measurement system calculates the maintenance cycles of the first sensor and the second sensor based on the first measured deterioration data and the second measured deterioration data. It is possible to change the maintenance cycle of to the one adapted to the actual measured value of the state.
- a specific embodiment of the present invention is one in which the measurement system is used for water quality analysis.
- an abnormality determination method for a measurement system is a measurement system abnormality determination method for measuring a sample using at least a first sensor and a second sensor, wherein the actual measurement value of the first sensor and the second sensor Estimate the predicted value of the second sensor from the measured value of the first sensor using a machine learning model that has learned the relationship between the measured values of the sensors, and the predicted value of the second sensor and the measured value of the second sensor are compared to determine which of the machine learning model and the measuring device has an abnormality.
- an abnormality determination program for a measurement system is an abnormality determination program for a measurement system having at least a first sensor and a second sensor, wherein an actual measurement value of the first sensor and an actual measurement value of the second sensor are A predicted value estimating unit that estimates the predicted value of the second sensor from the measured value of the first sensor using a machine learning model that has learned the relationship, and the predicted value of the second sensor and the measured value of the second sensor. are compared to determine whether the machine learning model or the measuring device has an abnormality.
- the present invention in a measurement system that utilizes machine learning, it is possible to determine the necessity of maintenance of measuring equipment or the necessity of re-learning a machine learning model.
- FIG. 4A is a graph showing learning data sets of sensor A and sensor B
- FIG. 4B is a diagram showing kernel density according to the first embodiment. It is a graph for analysis of sensor A and sensor B of the first embodiment. (a) Analysis graphs of sensor A and sensor B, (b) analysis graphs of sensor A and sensor C, and (c) analysis graphs of sensor B and sensor C.
- FIG. 2nd embodiment shows the functional block of the information processing apparatus of 2nd embodiment. It is a flowchart of the deterioration determination method of 2nd embodiment. It is a graph of the predicted state value and the measured state value with respect to the sensitivity of the first sensor and the second sensor of the second embodiment. It is a correspondence table of state predicted values and state measured values for sensitivities of the first sensor and the second sensor of the second embodiment.
- a measurement system 100 measures one or more measurement items of a liquid sample (sample) such as tap water or sewage in, for example, a water treatment facility.
- a liquid sample such as tap water or sewage in, for example, a water treatment facility.
- the measurement items include, for example, hydrogen ion (H + ), ammonium nitrogen (NH 4 —N), residual chlorine, dissolved oxygen (DO), salinity, fluoride ion, nitrate ion (NO 3 ⁇ ), hydrogen fluoride (HF), potassium hydroxide (KOH), tetramethylammonium hydroxide (TMAH), dissolved ozone, phosphoric acid ( H3PO4 ), citric acid, ammonia ( NH3 ), nitrogen ( N2 ), Concentration of predetermined components such as phosphorus (P) or silica (SiO 2 ), sample conductivity, specific resistance, oxidation-reduction potential (ORP), chemical oxygen demand (COD), turbidity, chromaticity, temperature , pressure, or water quality indicators such as oil film.
- H + hydrogen ion
- NH 4 —N ammonium nitrogen
- DO dissolved oxygen
- salinity fluoride ion, nitrate ion (NO 3 ⁇ )
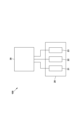
- the measurement system 100 includes, as shown in FIG. 1, a measurement device 20 having at least a first sensor and a second sensor, and an information processing device 30 that processes information output from the measurement device 20. .
- the measuring device 20 measures one or more measurement items, and has a plurality of sensors 21 to 23 corresponding to each measurement item.
- the measuring device 20 has three different sensors 21 to 23, but may have two different sensors or four or more different sensors. It may be a configuration.
- the measuring device 20 may have a plurality of the same sensors and may be provided at different measurement locations.
- the three sensors 21 to 23 are also referred to as the first sensor 21, the second sensor 22 and the third sensor 23 below.
- Each sensor 21 to 23 of the measuring device 20 can be changed as appropriate depending on the purpose of measurement.
- the sensors 21 to 23 of the measuring device 20 are, for example, an oxidation-reduction potential sensor, a pH sensor, a DO sensor, a sludge turbidity sensor (MLSS measuring device), an ammonia concentration sensor, a temperature sensor, and the like.
- the plurality of sensors 21 to 23 of the measuring instrument 20 may be a single measuring device unitized by being held in a single casing, or may be separate measuring devices provided independently of each other. It may be a device. In the case of the separate measuring devices, they may be arranged at different locations such as different aeration tanks of the water treatment facility or different locations of the sample pipes.
- Each output value output from each sensor 21 to 23 of the measuring instrument 20 configured in this manner is processed by the information processing device 30.
- the information processing apparatus 30 includes a CPU 30a, a memory 30b, an input/output interface 30c, an AD converter 30d, input means 30e such as a keyboard, display means 30f such as a display, and communication means for communicating via a network. 30g or the like.
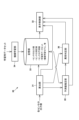
- the information processing device 30 is configured by the CPU 30a and the peripheral devices working together based on a program stored in a predetermined area of the memory, as shown in FIG. It functions as 33.
- the calculation unit 31 calculates the measured value of each measurement item based on the output values of the sensors 21 to 23 of the measuring device 20.
- the measured values of the sensors 21 to 23 calculated by the calculator 31 are sent to the display controller 32 and the memory 33 .
- the display control unit 32 displays the output values or measured values of the sensors 21 to 23 of the measuring device 20 on the display 30f. Specifically, the display control unit 32 displays, for example, a graph in which one axis (horizontal axis) is time and the other axis (vertical axis) is an output value or a measured value on the display 30f. Output values or measurements from 21-23 can be displayed over time. The display control unit 32 can also display a list of measured values such as instantaneous values of the sensors 21 to 23 of the measuring device 20 .
- the storage unit 33 stores the output values or measured values of the sensors 21 to 23 of the measuring device 20 .
- Various data stored in the storage unit 33 can be displayed on the display 30f by the display control unit 32. FIG.
- the information processing device 30 functions as a machine learning section 34, a predicted value estimating section 35, and an abnormality determining section 36, as shown in FIG.
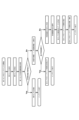
- the functions of the machine learning unit 34, the predicted value estimation unit 35, and the abnormality determination unit 36 will be described below with reference to the flowchart of the abnormality determination method shown in FIG.
- two sensors, the first sensor 21 and the second sensor 22, of the three sensors 21 to 23 will be described. and the third sensor 23 are the same.
- the machine learning unit 34 uses a learning data set including the past measured values of the first sensor 21 and the past measured values of the second sensor 22 to obtain the measured values of the first sensor 21 and the measured values of the second sensor 22. It creates a machine learning model that learns the relationship between values.
- the learning algorithms of the machine learning unit 34 include support vector machines, self-organizing maps, artificial neural networks, decision trees, random forests, k-means, k-nearest neighbors, genetic algorithms, Bayesian networks, or deep learning techniques. is considered to be used.
- the past measured value of the first sensor 21 is the past output value or measured value of the first sensor 21
- the past measured value of the second sensor 22 is the past output value of the second sensor 22 or Measured value.
- the learning data set may be a combination of the past output value of the first sensor 21 and the past output value of the second sensor 22, or the past measurement value of the first sensor 21 and the second sensor 22 past measurement values, or past output values of one sensor and past measurement values of the other sensor.
- the predicted value estimation unit 35 uses the machine learning model created by the machine learning unit 34 to estimate the predicted value of the second sensor 22 from the measured value of the first sensor 21 .
- the predicted value of the second sensor 22 is the output value or measured value of the second sensor 22 that is predicted to be obtained at the same time as the actual measurement value of the first sensor 21 is measured.
- the abnormality determining unit 36 compares the predicted value of the second sensor 22 estimated by the predicted value estimating unit 35 and the actual measurement value obtained by actually measuring the sample by the second sensor 22, and determines the machine learning model or the measuring device 20 It is determined which of the two has an abnormality.
- the abnormality determination unit 36 determines whether the difference or ratio between the predicted value of the second sensor 22 and the measured value of the second sensor 22 is within a predetermined allowable range. , the machine learning model or the measurement device 20 (“Alert Generated” in FIG. 4). Note that the allowable range can be set in advance as a range of ⁇ 10% of the predicted value, for example.
- the abnormality determination unit 36 uses a nonparametric density estimation method to determine which of the machine learning model or the measuring device 20 has an abnormality.
- a nonparametric density estimation method for example, a kernel density estimation method can be used.
- the abnormality determination unit 36 determines that the data density of the learning data set for which the machine learning model is created is a region (kernel density ), it is determined that there is an abnormality in the machine learning model (“inside the kernel density” in FIG. 4).
- the abnormality determination unit 36 determines that there is an abnormality in the machine learning model, it outputs a re-learning signal prompting the user to re-learn the machine learning model.
- the relearning signal is displayed, for example, on a display.
- the machine learning unit 34 re-learns the machine learning model using the updated learning data set (newly accumulated learning data set), and determines an abnormality.
- a threshold value for judging abnormality in the unit 36 is set ("re-learning model ⁇ resetting threshold value" in FIG. 4). It should be noted that each threshold value of the abnormality determination unit 36 may be arbitrarily set by the user.
- the abnormality determination unit 36 determines that the data density is less than the threshold value (outside the kernel density) as abnormal ("outside the kernel density” in FIG. 4). ), the machine learning model or the measuring device 20 is determined to be abnormal. Then, the abnormality determination unit 36 confirms whether or not there is an abnormality in the first sensor 21 or the second sensor 22 (“Confirmation of each sensor” in FIG. 4). If no abnormality is confirmed in the first sensor 21 or the second sensor 22, it is determined that there is an abnormality in the machine learning model, and as described above, a re-learning signal is output to prompt the user to re-learn the machine learning model. do.
- the abnormality determination unit 36 when it is determined that there is an abnormality in the first sensor 21 or the second sensor 22, the abnormality determination unit 36 outputs a maintenance signal prompting the user to perform maintenance of the measuring instrument 20 ("Recommend maintenance” in FIG. 4). ”).
- the abnormality determination unit 36 integrates the difference between the data density and the predicted value and the measured value, compares the integrated value (data density x (predicted value - measured value)) with a predetermined maintenance threshold, Output a maintenance signal.
- the maintenance signal is displayed on a display, for example, and may be a signal indicating that the measuring device 20 is abnormal or a signal indicating the time for maintenance. As a result, the user performs maintenance on the measuring instrument 20 determined to be abnormal ("apparatus maintenance" in FIG. 4).
- an abnormality when an abnormality is detected by the abnormality determination unit 36, the following processing can also be performed.
- two sensor axes horizontal axis is plotted on a graph (hereinafter referred to as an analysis graph) with sensor A and vertical axis sensor B), and data of the two sensors (sensor A and sensor B) included in the learning data set (learning data) can be plotted on an analytical graph.
- the actual output values or measured values (actual measurement data) of the two sensors (sensor A and sensor B) and the data (learning data) of the two sensors (sensor A and sensor B) are displayed on the analysis graph.
- the cause of the deviation of the prediction result For example, when measured data is plotted in an area with little learning data, it can be inferred that the tendency of the sample has changed.
- the actual measurement data of a specific sensor changes it is possible to infer an abnormality of the specific sensor.
- an analysis graph for sensor A and sensor B an analysis graph for sensor A and sensor C
- an analysis graph for sensor B and sensor C are displayed.
- you move the cursor to one of the measured data in one analysis graph and select it you can see the measured data at the same time as the selected measured data in the other two analysis graphs. can be displayed.
- time-series data on an analysis graph with two sensor axes by displaying by day of the week, month, season, etc., It is possible to analyze the influence of the month (busy season, off-season, etc.) and seasonal influence (busy season, off-season, etc.).
- the predicted value of the second sensor 22 is estimated from the measured value of the first sensor 21 using a machine learning model, and the estimated predicted value of the second sensor 22 and the second Since it is determined whether the machine learning model or the measuring device 20 has an abnormality by comparing the measured values of the sensor 22, the necessity of maintenance of the measuring device 20 can be determined with high accuracy. Also, when it is determined that the machine learning model is abnormal, it is possible to detect that the tendency of the sample has changed, and to relearn the machine learning model.
- the measurement system 100 in the second embodiment of the present invention is preferably intended for the same measurement system S, such as a flow path without inflow from other sources from upstream to downstream in the same tank or water treatment facility. is not limited to
- Each sensor 21 to 23 in the measuring device 20 measures measurement items in the same measurement system S.
- the first sensor 21 is preferably a sensor that is not affected by the optical system, such as a pH meter, but is not limited to this. Further, each output value output from each sensor 21 to 23 is processed by the information processing device 30 .
- the information processing device 30 functions as a display control unit 32 and a storage unit 33 as shown in FIG. do.
- the display control unit 32 displays the output values, state values, or signals of the sensors 21 to 23 on the display.
- the state value referred to here is a parameter indicating the state of the sensor, and includes, for example, the sensitivity of the sensor.
- the display control unit 32 can display, on the display 30f, a graph in which one axis (horizontal axis) is time and the other axis (vertical axis) is sensitivity. . Further, the display control unit 32 can display the signals emitted from the sensors 21 to 23 on the display 30f.
- the storage unit 33 stores the output value, state value, or maintenance cycle of each of the sensors 21 to 23, and stores the relationship between the predicted state value, which is the predicted state value obtained by predicting the state of each of the sensors 21 to 23, and time.
- the reference deterioration data D shown is stored.
- ⁇ Deterioration determination function> when the state value of a certain sensor becomes equal to or less than a limit value (for example, 50%), the sensor becomes defective in measurement and needs to be replaced. Therefore, for each of the sensors 21 to 23, a reference maintenance cycle corresponding to the reference deterioration data D is determined, and the user performs maintenance on each sensor for each reference maintenance cycle to determine the deterioration state of each sensor. to confirm. Note that if it is predicted that the state value of the sensor will be equal to or less than the limit value before reaching the reference maintenance cycle, the user replaces the sensor before maintenance.
- a limit value for example, 50%
- the information processing device 30 further has functions as a measured state value calculation unit 301, a deterioration determination unit 302, a measured deterioration data calculation unit 303, and a maintenance cycle calculation unit 304, as shown in FIG.
- the functions of the measured state value calculation unit 301, the deterioration determination unit 302, the measured deterioration data calculation unit 303, and the maintenance period calculation unit 304 will be described below with reference to the flowchart shown in FIG.
- two sensors, the first sensor 21 and the second sensor 22, among the sensors 21 to 23 will be described. The same is true for the two sensors of the third sensor 23 .
- the user starts maintenance of the first sensor 21 at the reference maintenance cycle T1, as shown in FIG.
- the user cleans the first sensor 21 and calibrates the first sensor 21 .
- the output state value is sent to the state actual measurement value calculation section 301 .
- the second sensor 22 and the third sensor 23 are cleaned and calibrated during maintenance.
- the embodiment is not limited to this, and cleaning and calibration of the second sensor 22 and the third sensor 23 may be performed during maintenance of the first sensor 21 .
- the measured state value calculation unit 301 calculates a measured state value Y1a obtained by actually measuring the state of the first sensor 21 based on the output value output from the first sensor 21 . Specifically, when the state value of the first sensor 21 at the time of calibration is output, the measured state value calculator 301 calculates the measured state value Y1a corresponding to the output state value (see FIG. 10). . At this time, if the measured state value Y1a is equal to or less than the limit value, the user replaces the first sensor 21 after calibration, and the maintenance ends. On the other hand, when the state value of the first sensor 21 is larger than the limit value, the user does not replace the first sensor 21, and the obtained state actual measurement value Y1a is sent to and stored in the storage unit 33. , is sent to the deterioration determination unit 302 .
- the deterioration determination unit 302 determines the state of the first sensor 21 by comparing the predicted state value Y1 and the measured state value Y1a of the first sensor 21 . Specifically, as shown in FIG. 10, the deterioration determination unit 302 subtracts the measured state value Y1a calculated by the actual measured value calculation unit 301 from the predicted state value Y1 stored in the storage unit 33, Determine whether the difference (Y1-Y1a) is within the allowable range.
- the allowable range can be set in advance as, for example, a range of ⁇ 10% of the predicted state value Y1.
- the deterioration determination unit 302 determines that the deterioration of the first sensor 21 is within the allowable range. In this case, the user does not change the maintenance cycle of the first sensor 21, and the user estimates that the deterioration of the other sensors is within the allowable range. After that, the user performs calibration or cleaning of each sensor 21 to 23, and finishes the maintenance.
- the deterioration determining unit 302 determines that the deterioration is outside the allowable range, and the deterioration is outside the allowable range of the first sensor 21. output an external degradation signal.
- the out-of-tolerance deterioration signal is displayed on the display 30f of the display control unit 32, for example. Further, the out-of-tolerance deterioration signal is output to the storage unit 33 and the measured deterioration data calculation unit 303 . Then, the user is prompted to check the state value of the second sensor 22 in the same measurement system S by recognizing the out-of-tolerance deterioration signal displayed on the display 30f.
- the state value of the second sensor 22 is output to the measured state value calculation section 301, and the measured state value Y2a of the second sensor 22 is calculated by the measured state value calculation section 301.
- FIG. The calculated state actual measurement value Y2a is sent to the storage unit 33 and the actual measurement deterioration data calculation unit 303 .
- the measured state value Y1a is lower than the predicted state value Y1, but it is not limited to this. In other words, even if the measured state value Y1a is higher than the predicted state value Y1, the deterioration determination unit 302 determines that the deterioration is outside the allowable range. In this case, the measured state value Y1a at the reference maintenance cycle T1 is better than the predicted state value Y1, that is, the actual deterioration speed is slower than the reference deterioration data D1.
- the actually measured deterioration data calculator 303 generates first actually measured deterioration data M1 indicating the relationship between the measured state value of the first sensor 21 and time and second actually measured deterioration data M1 indicating the relationship between the measured state value of the second sensor 22 and time. Calculate M2. Specifically, as shown in FIGS. 9 and 10, when the actually measured deterioration data calculator 303 receives the out-of-tolerance deterioration signal from the deterioration determiner 302, the actually measured state value Y1a corresponding to the first sensor 21 and the Based on the past measured state values of the first sensor 21 stored in the storage unit 33, the first measured deterioration data M1 is calculated. Then, the calculated first measured deterioration data M1 is sent to the storage section 33 and the maintenance cycle calculation section 304 . The calculation of the second actually measured deterioration data M2 for the second sensor 22 is the same as that for the first sensor 21. FIG.
- the maintenance cycle calculation unit 304 calculates the maintenance cycle of the first sensor 21 and the second sensor 22 based on the actually measured deterioration data of the first sensor 21 and the second sensor 22 . Specifically, as shown in FIG. 10, the maintenance cycle calculator 304 calculates a measured maintenance cycle T1a that reaches the same value as the predicted state value Y1 based on the first measured deterioration data M1. Calculation of the measured maintenance period T2a for the second sensor 22 is the same as that for the first sensor 21 .
- the obtained measured maintenance cycles T1a and T2a are sent to the display control unit 32 and the storage unit 33. Then, the user changes the measured maintenance cycles T1a and T2a displayed on the display control unit 32 to new maintenance cycles, and the maintenance ends.
- the user compares the reference maintenance cycles T1 and T2 with the obtained actual maintenance cycles T1a and T2a, and based on their rates of change (T1a/T1, T2a/T2), , it can be estimated that other sensors in the same measurement system S have similar deterioration tendencies representing changes over time in the state values of the same measurement system S.
- the user can calculate, for example, the measured maintenance cycle T3a of the third sensor 23 of the same measurement system S from the change rate (T1a/T1 or T2a/T2) of the maintenance cycle of the first sensor 21 or the second sensor 22. can be estimated.
- the user can estimate the measured maintenance cycles T2a and T3a of the second sensor 22 and the third sensor 23. Specifically, the user multiplies the change rate (T1a/T1) of the maintenance cycle of the first sensor 21 by the reference maintenance cycles T2 and T3 of the second sensor 22 and the third sensor 23, respectively, to obtain the second The measured maintenance periods T2a and T3a of the sensor 22 and the third sensor 23 can be estimated.
- the user can estimate the measured maintenance cycle T3a of the third sensor 23 .
- the user calculates the average value of the two rate of change (T1a/T1 or T2a/T2) and multiplies it by the reference maintenance cycle T3 of the third sensor, so that the third sensor 23 can estimate the measured maintenance cycle T3a.
- the deterioration determination unit 302 calculates the difference (Y1-Y1a) to determine the deterioration state of the first sensor 21.
- the user can determine the difference (Y1-Y1a ) may be calculated to determine the deterioration state of the first sensor 21 .
- the user when the user determines that the deterioration is out of the allowable range, the user outputs the out-of-allowable deterioration signal to the actually measured deterioration data calculation section 303 .
- the deterioration determination unit 302 calculates the difference between the actual measured state value Y1a of the first sensor 21 and the predicted state value Y1, and if the difference is outside the allowable range, Since the out-of-tolerance deterioration signal is output, the user can be urged to check the deterioration state of other sensors in the same measurement system S.
- the maintenance cycle calculation unit 304 calculates the measured maintenance cycle of each sensor based on the measured deterioration data calculated by the measured deterioration data calculation unit 303, maintenance can be performed in accordance with the deterioration state of each sensor 21 to 23 for each maintenance. Can be changed periodically.
- the measurement system 100 may have multiple measurement devices 20 . It is conceivable that the plurality of measuring instruments 20 are arranged at different locations, such as different aeration tanks of the water treatment facility or different locations of the sample piping. Then, the information processing device 30 performs abnormality determination for each measuring device 20 in the same manner as in the above-described embodiment.
- the measurement device is not limited to the case of measuring liquid samples such as those used for water quality analysis as described above, and gas samples such as NOx, SO 2 , CO, CO 2 , O 2 and silica. It can also be applied to things to be measured.
- a part of the functions of the information processing device 30 described in the above embodiment may be provided in a computer or the like separate from the information processing device 30 .
- a cloud server or the like which is separate from the information processing device 30, may have a function as a data storage unit for storing data such as output values output from the sensors 21 to 23.
- FIG. 1 A part of the functions of the information processing device 30 described in the above embodiment may be provided in a computer or the like separate from the information processing device 30 .
- a cloud server or the like which is separate from the information processing device 30, may have a function as a data storage unit for storing data such as output values output from the sensors 21 to 23.
- the information processing device 30 does not have a machine learning unit, and a machine learning model machine-learned by a computer or the like different from the information processing device 30 is transmitted to the information processing device 30 via a communication line and installed. You can do it.
- the present invention in a measurement system that utilizes machine learning, it is possible to determine the necessity of maintenance of measuring equipment or the necessity of re-learning a machine learning model.
- REFERENCE SIGNS LIST 100 Measuring system 20
- Measuring equipment 21 Measuring equipment 21
- First sensor 22 Second sensor 30
- Information processor 31 Calculating unit 32
- Display control unit 33 Storage unit 34
- Machine learning unit 35
- Predicted value estimation unit 36
- Deterioration determination unit 303
- Measured deterioration data calculation unit 304 ⁇ Maintenance cycle calculator
Landscapes
- Chemical & Material Sciences (AREA)
- Life Sciences & Earth Sciences (AREA)
- Health & Medical Sciences (AREA)
- Engineering & Computer Science (AREA)
- Physics & Mathematics (AREA)
- General Physics & Mathematics (AREA)
- Theoretical Computer Science (AREA)
- Analytical Chemistry (AREA)
- Pathology (AREA)
- Immunology (AREA)
- General Health & Medical Sciences (AREA)
- Biochemistry (AREA)
- Software Systems (AREA)
- Evolutionary Computation (AREA)
- Medical Informatics (AREA)
- Artificial Intelligence (AREA)
- Food Science & Technology (AREA)
- Medicinal Chemistry (AREA)
- Data Mining & Analysis (AREA)
- Mathematical Physics (AREA)
- Computer Vision & Pattern Recognition (AREA)
- General Engineering & Computer Science (AREA)
- Computing Systems (AREA)
- Molecular Biology (AREA)
- Chemical Kinetics & Catalysis (AREA)
- Electrochemistry (AREA)
- Testing And Monitoring For Control Systems (AREA)
Priority Applications (2)
| Application Number | Priority Date | Filing Date | Title |
|---|---|---|---|
| JP2023546943A JPWO2023038022A1 (https=) | 2021-09-09 | 2022-09-06 | |
| EP22867344.8A EP4401015A4 (en) | 2021-09-09 | 2022-09-06 | MEASURING SYSTEM, MEASURING SYSTEM ANOMALY DETERMINATION METHOD, AND MEASURING SYSTEM ANOMALY DETERMINATION PROGRAM |
Applications Claiming Priority (4)
| Application Number | Priority Date | Filing Date | Title |
|---|---|---|---|
| JP2021146925 | 2021-09-09 | ||
| JP2021-146925 | 2021-09-09 | ||
| JP2022054985 | 2022-03-30 | ||
| JP2022-054985 | 2022-03-30 |
Publications (1)
| Publication Number | Publication Date |
|---|---|
| WO2023038022A1 true WO2023038022A1 (ja) | 2023-03-16 |
Family
ID=85507654
Family Applications (1)
| Application Number | Title | Priority Date | Filing Date |
|---|---|---|---|
| PCT/JP2022/033404 Ceased WO2023038022A1 (ja) | 2021-09-09 | 2022-09-06 | 測定システム、測定システムの異常判定方法、及び、測定システムの異常判定プログラム |
Country Status (3)
| Country | Link |
|---|---|
| EP (1) | EP4401015A4 (https=) |
| JP (1) | JPWO2023038022A1 (https=) |
| WO (1) | WO2023038022A1 (https=) |
Cited By (2)
| Publication number | Priority date | Publication date | Assignee | Title |
|---|---|---|---|---|
| CN118656759A (zh) * | 2024-08-16 | 2024-09-17 | 深圳安培龙科技股份有限公司 | 基于数据分析的六维力传感器稳定性测试方法 |
| WO2025250393A1 (en) * | 2024-05-30 | 2025-12-04 | Caterpillar Inc. | Equipment profiling and automatic sensor signaling channel failover using machine learning |
Citations (4)
| Publication number | Priority date | Publication date | Assignee | Title |
|---|---|---|---|---|
| JP2015025794A (ja) | 2013-07-29 | 2015-02-05 | 株式会社堀場製作所 | 液体分析装置 |
| WO2019049688A1 (ja) * | 2017-09-06 | 2019-03-14 | 日本電信電話株式会社 | 異常音検知装置、異常モデル学習装置、異常検知装置、異常音検知方法、異常音生成装置、異常データ生成装置、異常音生成方法、およびプログラム |
| JP6795116B1 (ja) * | 2020-06-08 | 2020-12-02 | トヨタ自動車株式会社 | 車両、及びサーバ |
| WO2021112054A1 (ja) * | 2019-12-05 | 2021-06-10 | オムロン株式会社 | センサシステム、マスタユニット、予測装置、及び予測方法 |
Family Cites Families (2)
| Publication number | Priority date | Publication date | Assignee | Title |
|---|---|---|---|---|
| JP6670418B2 (ja) * | 2018-02-26 | 2020-03-18 | 株式会社日立情報通信エンジニアリング | 状態予測装置および状態予測制御方法 |
| US11307570B2 (en) * | 2019-05-31 | 2022-04-19 | Panasonic Intellectual Property Management Co., Ltd. | Machine learning based predictive maintenance of equipment |
-
2022
- 2022-09-06 EP EP22867344.8A patent/EP4401015A4/en active Pending
- 2022-09-06 WO PCT/JP2022/033404 patent/WO2023038022A1/ja not_active Ceased
- 2022-09-06 JP JP2023546943A patent/JPWO2023038022A1/ja active Pending
Patent Citations (4)
| Publication number | Priority date | Publication date | Assignee | Title |
|---|---|---|---|---|
| JP2015025794A (ja) | 2013-07-29 | 2015-02-05 | 株式会社堀場製作所 | 液体分析装置 |
| WO2019049688A1 (ja) * | 2017-09-06 | 2019-03-14 | 日本電信電話株式会社 | 異常音検知装置、異常モデル学習装置、異常検知装置、異常音検知方法、異常音生成装置、異常データ生成装置、異常音生成方法、およびプログラム |
| WO2021112054A1 (ja) * | 2019-12-05 | 2021-06-10 | オムロン株式会社 | センサシステム、マスタユニット、予測装置、及び予測方法 |
| JP6795116B1 (ja) * | 2020-06-08 | 2020-12-02 | トヨタ自動車株式会社 | 車両、及びサーバ |
Non-Patent Citations (2)
| Title |
|---|
| See also references of EP4401015A4 |
| YANAGISAWA, MASAYUKI: "A new phase for utilization of plant data -New ideas and practice methods. Efforts to utilize data in chemical plants and expectations for the future", INSTRUMENTATION CONTROL ENGINEERING, KOGYO GIJUTSU-SHA, TOKYO, JP, vol. 59, no. 7, 30 November 2015 (2015-11-30), JP , pages 9 - 14, XP009544467, ISSN: 0368-5780 * |
Cited By (2)
| Publication number | Priority date | Publication date | Assignee | Title |
|---|---|---|---|---|
| WO2025250393A1 (en) * | 2024-05-30 | 2025-12-04 | Caterpillar Inc. | Equipment profiling and automatic sensor signaling channel failover using machine learning |
| CN118656759A (zh) * | 2024-08-16 | 2024-09-17 | 深圳安培龙科技股份有限公司 | 基于数据分析的六维力传感器稳定性测试方法 |
Also Published As
| Publication number | Publication date |
|---|---|
| EP4401015A4 (en) | 2025-07-30 |
| EP4401015A1 (en) | 2024-07-17 |
| JPWO2023038022A1 (https=) | 2023-03-16 |
Similar Documents
| Publication | Publication Date | Title |
|---|---|---|
| CN113252544B (zh) | 一种炼油装置腐蚀监测系统和方法 | |
| WO2023038022A1 (ja) | 測定システム、測定システムの異常判定方法、及び、測定システムの異常判定プログラム | |
| US20070215556A1 (en) | System for detection and prediction of water nitrification | |
| KR20170127430A (ko) | 센서 오차를 검출, 분류 및/또는 완화하는 방법 및 시스템 | |
| CN113155178A (zh) | 传感器系统和方法 | |
| AU2017291053B2 (en) | Process for monitoring the concentration of bacteria in a water distribution network | |
| Ohmura et al. | Characterizing long-term wear and tear of ion-selective pH sensors | |
| US20170082480A1 (en) | Real-time condition based monitoring (cbm) based ultrasonic meter (usm) accuracy performance detection and notification | |
| CN104870991A (zh) | 用于确定集成在过程容器中的测量变换器的状态的方法和设备 | |
| US10067105B2 (en) | Method for operating a measuring site | |
| US11193920B2 (en) | Method for the automated in-line detection of deviations of an actual state of a fluid from a reference state of the fluid on the basis of statistical methods, in particular for monitoring a drinking water supply | |
| US20170082469A1 (en) | Inline ultrasonic meter (usm) condition based monitoring (cbm)-based adaptation to maintain high accuracy under various flow conditions | |
| JP4378204B2 (ja) | 水質監視システム | |
| US11994488B2 (en) | Method of predictive monitoring of a variable of a medium and of a measurement accuracy of a measurement device measuring this variable | |
| EP3444691B1 (en) | Sensor service prediction | |
| Sankaranarayanan et al. | Missing data estimation and IoT‐based flyby monitoring of a water distribution system: Conceptual and experimental validation | |
| US20230161679A1 (en) | Method of determining application-specific total plausibilities of measured values of at least one measurand measured by a measurement system in a specific application | |
| US11788933B2 (en) | Method for monitoring measured variables measured on a process plant with measuring instruments | |
| JP7637116B2 (ja) | 測定装置、センサ出力監視方法及びセンサ出力監視プログラム | |
| US11560698B2 (en) | State analysis device, state analysis method, and recording medium | |
| US20240200990A1 (en) | Method of measuring measurands of a medium and a measurement system configured to perform this method | |
| US7222049B2 (en) | User-viewable relative diagnostic output | |
| Torrecilla et al. | Chaotic parameters and their role in quantifying noise in the output signals from UV, TGA and DSC apparatus | |
| Bagajewicz | Review of recent results in instrumentation design and upgrade for process plants | |
| Singh et al. | Effect of autocorrelation on the performance of EWMA chart |
Legal Events
| Date | Code | Title | Description |
|---|---|---|---|
| 121 | Ep: the epo has been informed by wipo that ep was designated in this application |
Ref document number: 22867344 Country of ref document: EP Kind code of ref document: A1 |
|
| WWE | Wipo information: entry into national phase |
Ref document number: 2023546943 Country of ref document: JP |
|
| WWE | Wipo information: entry into national phase |
Ref document number: 2022867344 Country of ref document: EP |
|
| NENP | Non-entry into the national phase |
Ref country code: DE |
|
| ENP | Entry into the national phase |
Ref document number: 2022867344 Country of ref document: EP Effective date: 20240409 |