WO2023032437A1 - 造影状態判別装置、造影状態判別方法、及びプログラム - Google Patents
造影状態判別装置、造影状態判別方法、及びプログラム Download PDFInfo
- Publication number
- WO2023032437A1 WO2023032437A1 PCT/JP2022/025287 JP2022025287W WO2023032437A1 WO 2023032437 A1 WO2023032437 A1 WO 2023032437A1 JP 2022025287 W JP2022025287 W JP 2022025287W WO 2023032437 A1 WO2023032437 A1 WO 2023032437A1
- Authority
- WO
- WIPO (PCT)
- Prior art keywords
- contrast
- image
- state determination
- images
- elapsed time
- Prior art date
Links
- 238000000034 method Methods 0.000 title claims abstract description 29
- 238000002347 injection Methods 0.000 claims abstract description 50
- 239000007924 injection Substances 0.000 claims abstract description 50
- 239000002872 contrast media Substances 0.000 claims abstract description 49
- 238000009826 distribution Methods 0.000 claims description 107
- 238000003384 imaging method Methods 0.000 claims description 76
- 238000006243 chemical reaction Methods 0.000 claims description 27
- 210000004185 liver Anatomy 0.000 claims description 12
- 210000003734 kidney Anatomy 0.000 claims description 2
- 230000002708 enhancing effect Effects 0.000 claims 1
- 210000000056 organ Anatomy 0.000 abstract description 5
- 238000012545 processing Methods 0.000 description 81
- 230000006870 function Effects 0.000 description 39
- 238000002591 computed tomography Methods 0.000 description 32
- 238000010586 diagram Methods 0.000 description 31
- 238000004891 communication Methods 0.000 description 27
- 230000010354 integration Effects 0.000 description 25
- 238000012549 training Methods 0.000 description 21
- 238000010801 machine learning Methods 0.000 description 15
- 210000003240 portal vein Anatomy 0.000 description 10
- 238000013527 convolutional neural network Methods 0.000 description 8
- 230000002123 temporal effect Effects 0.000 description 7
- 230000009466 transformation Effects 0.000 description 6
- 230000008569 process Effects 0.000 description 5
- 230000001131 transforming effect Effects 0.000 description 4
- 238000012935 Averaging Methods 0.000 description 3
- 101000798429 Pinus strobus Putative 2-Cys peroxiredoxin BAS1 Proteins 0.000 description 3
- 101001136140 Pinus strobus Putative oxygen-evolving enhancer protein 2 Proteins 0.000 description 3
- 102100028298 Vacuolar protein sorting-associated protein VTA1 homolog Human genes 0.000 description 3
- 101710111280 Vacuolar protein sorting-associated protein VTA1 homolog Proteins 0.000 description 3
- 238000010191 image analysis Methods 0.000 description 3
- 238000002595 magnetic resonance imaging Methods 0.000 description 3
- 238000012986 modification Methods 0.000 description 3
- 230000004048 modification Effects 0.000 description 3
- 238000002600 positron emission tomography Methods 0.000 description 3
- 239000004065 semiconductor Substances 0.000 description 3
- 101100256368 Arabidopsis thaliana SBP3 gene Proteins 0.000 description 2
- 102100039398 C-X-C motif chemokine 2 Human genes 0.000 description 2
- 101000889128 Homo sapiens C-X-C motif chemokine 2 Proteins 0.000 description 2
- 101000692225 Homo sapiens Selenocysteine insertion sequence-binding protein 2 Proteins 0.000 description 2
- 102100026077 Selenocysteine insertion sequence-binding protein 2 Human genes 0.000 description 2
- 238000004364 calculation method Methods 0.000 description 2
- 238000004195 computer-aided diagnosis Methods 0.000 description 2
- 239000003814 drug Substances 0.000 description 2
- 229940079593 drug Drugs 0.000 description 2
- 238000011478 gradient descent method Methods 0.000 description 2
- 230000003287 optical effect Effects 0.000 description 2
- 238000004458 analytical method Methods 0.000 description 1
- 238000013459 approach Methods 0.000 description 1
- 238000003491 array Methods 0.000 description 1
- 210000001367 artery Anatomy 0.000 description 1
- 230000008859 change Effects 0.000 description 1
- 238000013145 classification model Methods 0.000 description 1
- 238000013170 computed tomography imaging Methods 0.000 description 1
- 238000001514 detection method Methods 0.000 description 1
- 201000010099 disease Diseases 0.000 description 1
- 208000037265 diseases, disorders, signs and symptoms Diseases 0.000 description 1
- 238000005401 electroluminescence Methods 0.000 description 1
- 230000029142 excretion Effects 0.000 description 1
- 239000000284 extract Substances 0.000 description 1
- 230000003902 lesion Effects 0.000 description 1
- 239000004973 liquid crystal related substance Substances 0.000 description 1
- 238000013507 mapping Methods 0.000 description 1
- 230000011218 segmentation Effects 0.000 description 1
- 239000007787 solid Substances 0.000 description 1
- 238000007619 statistical method Methods 0.000 description 1
- 238000002604 ultrasonography Methods 0.000 description 1
Images


Classifications
-
- A—HUMAN NECESSITIES
- A61—MEDICAL OR VETERINARY SCIENCE; HYGIENE
- A61B—DIAGNOSIS; SURGERY; IDENTIFICATION
- A61B6/00—Apparatus or devices for radiation diagnosis; Apparatus or devices for radiation diagnosis combined with radiation therapy equipment
- A61B6/02—Arrangements for diagnosis sequentially in different planes; Stereoscopic radiation diagnosis
- A61B6/03—Computed tomography [CT]
Definitions
- the present invention relates to a contrast state determination device, a contrast state determination method, and a program for determining a contrast state from a contrast-enhanced image, and more particularly to a technique for determining a contrast state from a two-dimensional image.
- Dynamic contrast-enhanced CT images taken by CT (computed tomography) examinations using a contrast agent differ greatly in appearance depending on the contrast-enhanced time phase. is necessary.
- DICOM Digital Imaging and COmmunications in Medicine
- tags sometimes contain contrast information, but they do not always contain it, and sometimes they are wrong. Therefore, it is required to grasp the contrast-enhanced time phase from the image.
- Contrast time phase information is required for later processing that depends on the contrast time phase, and high-speed operation is required.
- the technique disclosed in Non-Patent Document 1 has a problem that it takes time because the contrast-enhanced image is processed as it is in 3D (Dimension). Further, the technique disclosed in Patent Document 1 has a problem that the contrast-enhanced time phase cannot be determined when a specific region is not shown in the contrast-enhanced image.
- the present invention has been made in view of such circumstances. It aims at providing a method and a program.
- the contrast state determination device provides a first image containing information of at least a first slice image of a first position of the subject from a first image series captured before or after injection of a contrast agent into the subject. obtaining a second two-dimensional image including information of the two-dimensional image and a second slice image at a second location different from the first location, and obtaining a first indication of an imaging condition from the first two-dimensional image; estimating a value, estimating a second indicator value for the contrast condition from the second two-dimensional image, and determining the contrast condition of the first image series based on at least the first indicator value and the second indicator value.
- the contrast-enhanced state determination device further generates a third two-dimensional image including information of a third slice image at a third position different from the first position and the second position of the subject from the first image series. obtained, and estimating a third index value for the contrast condition from the third two-dimensional image, and determining the contrast condition of the first image series based on the first to third index values.
- the index value is a likelihood of belonging to each imaging state among a plurality of imaging states, and at least one processor derives an index value by integrating the plurality of index values, and calculates a first index value based on the integrated index value. image series to determine the imaging status.
- a first learning model that, when a two-dimensional image based on a series of images taken before or after injection of a contrast medium into a subject is input, outputs a likelihood of belonging to each contrast enhancement state among a plurality of contrast enhancement states. and the at least one processor preferably inputs the plurality of two-dimensional images into the first learning model to estimate the plurality of index values.
- the index value is the elapsed time after injection of the contrast agent into the subject, and at least one processor derives the elapsed time by integrating the plurality of elapsed times that are the plurality of index values, and calculates the integrated elapsed time
- the imaging status of the first image series is determined based on.
- the index value is the elapsed time and the likelihood of the elapsed time after the injection of the contrast agent into the subject, and at least one processor calculates the index value based on the plurality of likelihoods of the plurality of index values. It is preferable to derive an aggregated elapsed time from a plurality of elapsed times and to determine the imaging status of the first image series based on the aggregated elapsed time.
- At least one processor preferably derives the integrated elapsed time based on the product of a plurality of probability distribution models with elapsed time and probability as parameters.
- the elapsed time after the injection of the contrast medium into the subject and the likelihood of the elapsed time are output.
- a conversion table in which the elapsed time after injection of the contrast agent into the subject and the contrast enhancement state are associated with each other, and at least one processor uses a plurality of index values after the injection of the contrast agent into the subject. estimating the elapsed time; determining a plurality of contrast conditions for the first image series based on the plurality of elapsed times and the conversion table; and determining a contrast condition for the first image series based on the plurality of contrast conditions. preferable.
- the two-dimensional image is preferably at least one of a slice image, a MIP (Maximum Intensity Projection) image of a plurality of slice images, and an average image of the plurality of slice images.
- MIP Maximum Intensity Projection
- the first image series are three-dimensional images including the subject's liver, and the contrast-enhanced state includes at least one of non-enhanced, arterial phase, portal vein phase, and equilibrium phase.
- the first image series is a three-dimensional image including the subject's kidney, and the contrast-enhancing state preferably includes at least one of non-enhancement, corticomedullary phase, parenchymal phase, and excretory phase.
- One aspect of the contrast enhancement state determination method for achieving the above object is to extract information on slice images at different positions of the subject from a first image series captured before or after injection of a contrast agent into the subject. obtaining a plurality of two-dimensional images including each of the plurality of two-dimensional images; estimating an index value relating to a contrast-enhanced state from each of the plurality of two-dimensional images; and determining the contrast state of the series.
- One aspect of the program for achieving the above object is a program for causing a computer to execute the above contrast enhancement state determination method.
- a computer-readable non-transitory storage medium in which this program is recorded may also be included in this embodiment.
- the present invention it is possible to determine the contrast-enhanced state at high speed, with high accuracy, and robustness, even if there are organs not included in the image.
- FIG. 1 is a conceptual diagram showing an outline of processing by the contrast enhancement state determination device according to the first embodiment.
- FIG. 2 is a flow chart showing a contrast state determination method by the contrast state determination device.
- FIG. 3 is a block diagram schematically showing an example of the hardware configuration of the imaging state determination apparatus according to the first embodiment;
- FIG. 4 is a functional block diagram showing an overview of processing functions of the contrast enhancement state determination apparatus according to the first embodiment.
- FIG. 5 is a conceptual diagram showing an overview of processing by the contrast enhancement state determination device according to the second embodiment.
- FIG. 6 is a functional block diagram showing an overview of the processing functions of the contrast enhancement state determination device according to the second embodiment.
- FIG. 7 is a conceptual diagram showing an overview of processing by the contrast enhancement state determination device according to the third embodiment.
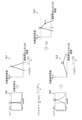
- FIG. 8 is an explanatory diagram showing an example of processing in the number-of-seconds distribution estimation unit.
- FIG. 9 is a graph of a function used for variable transformation in Equation (2).
- FIG. 10 is a graph of the number-of-seconds distribution estimated by the parameters estimated by the number-of-seconds distribution estimator.
- FIG. 11 is an explanatory diagram of an example of processing in the integrating unit and the maximum point specifying unit.
- FIG. 12 is a schematic illustration of an example of a machine learning method for generating a regression model applied to the seconds distribution estimator.
- FIG. 13 is an explanatory diagram of a loss function used during training.
- FIG. 14 is a functional block diagram showing an overview of the processing functions of the imaging state determination device 10 according to the third embodiment.
- FIG. 15 is an explanatory diagram showing an example of processing in the second distribution estimating unit of the imaging state determination apparatus according to the fourth embodiment.
- FIG. 16 is a graph of the number-of-seconds distribution estimated by the parameters estimated by the number-of-seconds distribution estimator.
- FIG. 17 is an explanatory diagram showing an example of processing in the integration unit and the maximum point specifying unit of the contrast enhancement state determination apparatus according to the fourth embodiment.
- FIG. 18 is an explanatory diagram schematically showing an example of a machine learning method for generating a regression model applied to the number-of-seconds distribution estimator in the fourth embodiment.
- FIG. 19 is an explanatory diagram showing Modified Example 1 of data used for input to the contrast enhancement state determination device.
- FIG. 20 is an explanatory diagram showing Modified Example 2 of data used for input to the contrast enhancement state determination device.
- FIG. 21 is a block diagram showing a configuration example of a medical information system to which the imaging state determination device is applied.
- FIG. 1 is a conceptual diagram showing an outline of processing by the contrast enhancement state determination device 10 according to the first embodiment.
- the contrast enhancement state determination device 10 for estimating the contrast enhancement state (contrast enhancement time phase) of an image series based on a plurality of slice images of the same image series contrast-enhanced using a CT (Computed Tomography) device will be described. do.
- CT Computerputed Tomography
- a plurality of slice images in the same series are used as inputs to estimate the contrast-enhanced state by image analysis.
- “By image analysis” means by processing based on pixel values that constitute image data.
- the imaging state of liver imaging includes at least one of non-imaging, arterial phase (early arterial phase/late arterial phase), portal vein phase, and equilibrium phase.
- the imaging state of renal imaging includes at least one of non-imaging, corticomedullary phase, parenchymal phase, and excretion phase.
- the contrast enhancement state determination device 10 can be realized using computer hardware and software. As shown in FIG. 1 , the contrast enhancement state determination device 10 includes a time phase estimation section 30 and an integration section 32 .
- a plurality of slice images are input to the contrast enhancement state determination device 10 .
- the plurality of slice images are images sampled at equal intervals from the 3D CT data of the same image series taken before or after the injection of the contrast agent into the patient SB (an example of the “subject”).
- the contrast enhancement state determination device 10 has three images IM1, IM2, and IM3 at different positions SBP1, SBP2, and SBP3 of the patient SB (an example of "a plurality of slice images", An example of "a plurality of two-dimensional images" is input.
- the slice image may also be called a tomographic image.
- a slice image may be understood as a substantially two-dimensional image (cross-sectional image).
- the time phase estimating unit 30 estimates an index value (an example of an “index value relating to contrast-enhanced state”) that is the likelihood that an image series of input images belongs to each contrast-enhanced time phase among a plurality of contrast-enhanced time phases. .
- the numerical range of the probability of belonging to each contrast-enhanced time phase output from the time phase estimation unit 30 may be “0% to 100%”.
- three phase estimating units 30 are illustrated in order to show the flow of processing when three different images IM1, IM2, and IM3 are input.
- the temporal estimator 30 used is the same (single) processor.
- the phase estimation unit 30 includes a learned model 30A (an example of a "first learning model") trained by machine learning.
- the trained model 30A determines whether the image series of the input two-dimensional image belongs to each contrast-enhanced time phase among a plurality of contrast-enhanced time phases. It is a multi-class classification model that outputs likelihood.
- the trained model 30A is configured using, for example, a convolutional neural network (CNN).
- CNN convolutional neural network
- the trained model 30A is trained by a known method using pairs of two-dimensional images based on a series of images taken before or after injection of a contrast agent into the subject and the contrast-enhanced time phases of the series of images as learning data. there is
- the temporal estimation unit 30 inputs the input two-dimensional images to the trained model 30A and estimates the index value of each image.
- the temporal phase estimating unit 30 determines that the index value of the image IM1 has a probability of 10% belonging to the arterial phase among the plurality of imaging states, and a probability of belonging to the portal vein phase of 50%. , and outputs an estimation result PS1 with a probability of belonging to the equilibrium phase of 40%. Further, the temporal phase estimating unit 30 determines that the index values of the image IM2 are 5% for the probability of belonging to the arterial phase, 80% for the probability of belonging to the portal phase, and 15% for the probability of belonging to the equilibrium phase. is output as the estimation result PS2. In addition, the temporal phase estimating unit 30 determines that the index values of the image IM3 are 30% likely to belong to the arterial phase, 35% likely to belong to the portal vein phase, and 35% likely to belong to the equilibrium phase. is output as the estimation result PS3.
- the integration unit 32 derives an index value by integrating a plurality of input index values, and determines the contrast enhancement state of the image series.
- the integrating unit 32 may integrate the plurality of index values by using the maximum value, may integrate the plurality of index values by majority rule, or may integrate the plurality of index values by probabilistic sum.
- the index value integrated by the integration unit 32 is output as the final estimation result.
- the integration unit 32 integrates the estimation result PS1, the estimation result PS2, and the estimation result PS3, and outputs the portal vein phase as the final estimation result.
- ⁇ Description of medical images used for input In the DICOM (Digital Imaging and COmmunications in Medicine) standard that defines the format and communication protocol of medical images, a unit called a study ID, which is an identification code (ID) for specifying the type of examination, , the series ID is defined.
- DICOM Digital Imaging and COmmunications in Medicine
- CT imaging of a range including the liver is performed a plurality of times (here, four times) at different imaging timings as described below.
- CT data is three-dimensional data composed of a plurality of continuous slice images (tomographic images), and is an aggregate of a plurality of slice images (continuous slices) that constitute the three-dimensional data.
- a set of images) is called an “image series”.
- CT data is an example of a "three-dimensional image" in this disclosure.
- “study 1” is given as a study ID for a specific patient's liver contrast imaging examination
- “series 1” is given as the series ID of CT data obtained by imaging before contrast medium injection
- “series 1” is given as a series ID for CT data obtained by imaging before "Series 2" for CT data obtained by imaging 35 seconds after injection
- "Series 3" for CT data obtained by imaging 70 seconds after injection of contrast agent, 180 seconds after injection of contrast injection
- a unique ID is assigned to each series, such as "series 4", to the CT data obtained by imaging. Therefore, CT data can be identified by a combination of study ID and series ID.
- CT data can be identified by a combination of study ID and series ID.
- the correspondence relationship between the series ID and the imaging timing elapsed time after injection of the contrast medium
- the three-dimensional CT data has a large data size, it may be difficult to use the CT data as it is as input data to perform processing for determining the contrast enhancement state.
- FIG. 2 is a flow chart showing each step of the contrast state determination method by the contrast state determination device 10. As shown in FIG. Here, an example of determining the contrast-enhanced state of a series of liver contrast-enhanced images will be described.
- step S1 the contrast state determining apparatus 10 selects a position SBP1 of the patient SB (a "first An image IM1 (an example of a 'first slice image', an example of a 'first two-dimensional image') is acquired at a position).
- step S2 the phase estimating unit 30 inputs the image IM1 acquired in step S1 to the learned model 30A to estimate the first index value regarding the contrast enhancement state.
- the time phase estimating unit 30 uses the probability of non-contrast enhancement (likelihood of non-enhancement), the probability of arterial phase (likelihood of artery phase), the probability of portal vein phase (likelihood of portal vein phase) as the first index value. , and the probability of being in the equilibrium phase (likelihood of equilibrium phase) are obtained and output as the estimation result PS1.
- step S3 the contrast-enhanced state determination apparatus 10 extracts an image IM2 (an example of a “second slice image”, a “second (an example of a two-dimensional image of ).
- the contrast enhancement state determination device 10 acquires the image IM3, and the phase estimation unit 30 outputs an estimation result PS3 as an index value related to the contrast enhancement state from the image IM3.
- step S5 the integration unit 32 determines the contrast enhancement state of the image series based on the estimation results PS1 to PS3, and outputs the determined contrast enhancement state as the final estimation result.
- the contrast time phase is determined based on a plurality of two-dimensional images, so the contrast time phase is determined based on one two-dimensional image. It is more accurate and robust than the case. Also, the inference is faster than when determining the contrast-enhanced time phase based on the three-dimensional image. Furthermore, since the estimation is not performed based on a specific region, estimation is possible even if there are organs not shown in the image.
- the contrast-enhanced condition determining apparatus 10 determines the contrast-enhanced time phase based on the three images IM1, IM2, and IM3, but may determine the contrast-enhanced time phase based on two images.
- the contrast-enhanced time phase may be determined based on more than one image. The smaller the number of images, the faster the processing, and the larger the number of images, the higher the precision and robustness of the determination result.
- FIG. 3 is a block diagram schematically showing an example of the hardware configuration of the imaging state determination device 10 according to the first embodiment.
- the imaging state determination apparatus 10 can be implemented by a computer system configured using one or several computers. Here, an example in which one computer executes a program to realize various functions of the imaging state determination apparatus 10 will be described.
- the form of the computer functioning as the imaging state determination apparatus 10 is not particularly limited, and may be a server computer, a workstation, a personal computer, a tablet terminal, or the like.
- the imaging state determination device 10 includes a processor 102 , a non-transitory tangible computer-readable medium 104 , a communication interface 106 , an input/output interface 108 and a bus 110 .
- the processor 102 includes a CPU (Central Processing Unit). Processor 102 may include a GPU (Graphics Processing Unit). Processor 102 is coupled to computer-readable media 104 , communication interface 106 , and input/output interface 108 via bus 110 . The processor 102 reads various programs and data stored in the computer-readable medium 104 and executes various processes.
- CPU Central Processing Unit
- GPU Graphics Processing Unit
- the computer-readable medium 104 includes, for example, a memory 104A that is a main storage device and a storage 104B that is an auxiliary storage device.
- the storage 104B is configured using, for example, a hard disk drive (HDD) device, a solid state drive (SSD) device, an optical disk, a magneto-optical disk, or a semiconductor memory, or an appropriate combination thereof. .
- HDD hard disk drive
- SSD solid state drive
- Various programs, data, and the like are stored in the storage 104B.
- Computer-readable medium 104 is an example of a "storage device" in this disclosure.
- the memory 104A is used as a work area for the processor 102, and is used as a storage unit that temporarily stores programs and various data read from the storage 104B.
- a program stored in the storage 104B is loaded into the memory 104A, and the processor 102 executes the instructions of the program, whereby the processor 102 functions as means for performing various processes defined by the program.
- the memory 104A stores an imaging state determination program 130 executed by the processor 102, various data, and the like.
- the contrast enhancement state determination program 130 includes a trained model 30A (see FIG. 1) trained by machine learning, and causes the processor 102 to execute the processes described with reference to FIGS.
- the communication interface 106 performs wired or wireless communication processing with an external device, and exchanges information with the external device.
- the imaging state determination device 10 is connected to a communication line (not shown) via a communication interface 106 .
- the communication line may be a local area network or a wide area network.
- the communication interface 106 can serve as a data acquisition unit that receives input of data such as images.
- the imaging state determination device 10 may further include an input device 114 and a display device 116 .
- Input device 114 and display device 116 are connected to bus 110 via input/output interface 108 .
- Input device 114 may be, for example, a keyboard, mouse, multi-touch panel, or other pointing device, voice input device, or any suitable combination thereof.
- the display device 116 is an output interface that displays various information.
- the display device 116 may be, for example, a liquid crystal display, an organic electro-luminescence (OEL) display, a projector, or an appropriate combination thereof.
- OEL organic electro-luminescence
- FIG. 4 is a functional block diagram showing an overview of the processing functions of the imaging state determination device 10 according to the first embodiment.
- the processor 102 of the contrast state determination device 10 functions as the data acquisition unit 12, the phase estimation unit 30, the integration unit 32, and the output unit 19 by executing the contrast state determination program 130 stored in the memory 104A.
- the data acquisition unit 12 accepts input of data to be processed.
- the data acquisition unit 12 acquires an image IMi, which is a slice image sampled from CT data.
- the data acquisition unit 12 may perform processing for cutting out slice images from CT data at regular intervals, or may acquire slice images sampled in advance by a processing unit (not shown) or the like.
- the image IMi captured via the data acquisition unit 12 is input to the phase estimation unit 30 .
- the output unit 19 is an output interface for displaying the contrast enhancement state estimated by the integration unit 32 and providing it to other processing units.
- the output unit 19 may include a processing unit such as processing for generating data for display and/or data conversion processing for transmitting data to the outside.
- the contrast time phase estimated by the contrast state determination device 10 may be displayed on a display device (not shown) or the like.
- the contrast enhancement state determination device 10 may be incorporated in a medical image processing device for processing medical images acquired in medical institutions such as hospitals. Further, the processing functions of the imaging state determination apparatus 10 may be provided as a cloud service.
- the method of contrast-enhanced state determination processing executed by the processor 102 is an example of the “contrast-enhanced state determination method” in the present disclosure.
- the probability of belonging to each contrast phase out of a plurality of contrast phases is used as the index value related to the contrast enhancement state.
- An example using the elapsed time after the time will be described.
- the hardware configuration of the imaging state determination device 10 according to the second embodiment may be the same as that of the first embodiment. Regarding the second embodiment, points different from the first embodiment will be described.
- FIG. 5 is a conceptual diagram showing an outline of processing by the contrast enhancement state determination device 10 according to the second embodiment.
- FIG. 6 is a functional block diagram showing an overview of the processing functions of the imaging state determination device 10 according to the second embodiment.
- a plurality of slice images sampled at equal intervals from three-dimensional CT data of a patient whose liver has been contrast-enhanced using a CT apparatus is used as an input, and from the image series of the input plurality of slice images, a contrast agent is injected.
- An example of the contrast enhancement state determination device 10 that estimates the number of seconds and determines the contrast enhancement state based on the estimated number of seconds will be described.
- the term "seconds" in this specification includes the number of seconds indicating the elapsed time from the injection of the contrast medium, unless explicitly stated otherwise.
- the contrast-enhanced state determination apparatus 10 receives an input of an image IM, and estimates the number of seconds as the elapsed time from the injection of the contrast agent in the image series of the images IM. , an integrating unit 36 for deriving an integrated elapsed time from a plurality of input elapsed times, and a discriminating unit 38 for discriminating a contrast-enhanced time phase from the derived elapsed time.
- the contrast-enhanced time phase determined by the determination unit 38 is output from the output unit 19 as a final result.
- Unit 34 is the same (single) processing unit.
- Seconds estimator 34 estimates the number of seconds from contrast agent injection of the image series of the input images.
- the number-of-seconds estimation unit 34 includes a learned model 34A trained by machine learning.
- the trained model 34A When the trained model 34A is input with a two-dimensional image based on a contrast-enhanced three-dimensional image, it outputs the number of seconds from the injection of the contrast agent in the image series of the input two-dimensional image.
- the trained model 34A is constructed using, for example, a convolutional neural network.
- the trained model 34A acquires pairs of two-dimensional images based on a series of images taken before or after injection of a contrast agent into the subject and the number of seconds from the injection of the contrast agent in the image series as learning data by a known method. being learned.
- the number-of-seconds estimator 34 inputs the input two-dimensional image to the trained model 34A and estimates the elapsed time after injection of the contrast agent in the image series of the two-dimensional image.
- the number-of-seconds estimating unit 34 outputs an estimation result PS11 (an example of the "first elapsed time") of 70 seconds as the index value of the image IM1, and as the index value of the image IM2,
- An estimation result PS12 (an example of the “second elapsed time”) of 75 seconds is output, and an estimation result PS13 of 80 seconds is output as the index value of the image IM3.
- the integration unit 36 integrates a plurality of input estimation results using any statistical method, and estimates the number of seconds from the injection of the contrast agent in the image series.
- the integration unit 36 may integrate the estimation results by, for example, simple averaging, may integrate the estimation results by weighted averaging, or select one of a plurality of estimation results and integrate the estimation results. You may In the example shown in FIG. 5, the integration unit 36 integrates the estimation result PS11, the estimation result PS12, and the estimation result PS13, and outputs 72 seconds as the final estimation result PS14.
- the determination unit 38 determines the contrast enhancement state from the value of the number of seconds integrated by the integration unit 36 .
- the determination unit 38 includes a conversion table 38A.
- Conversion table 38A may be stored on computer readable medium 104 .
- the conversion table 38A associates the elapsed time from the start of injection of the contrast medium with the contrast time phase. For example, in the case of liver contrast imaging, the conversion table 38A is associated with the arterial phase for less than 50 seconds from the start of injection of the contrast agent, the portal vein phase for 50 seconds to less than 120 seconds, and the equilibrium phase for 120 seconds or longer. .
- the determination unit 38 determines the contrast enhancement state using the conversion table 38A. In the example shown in FIG. 5, the final estimation result PS14 is 72 seconds, so the contrast enhancement state is determined to be the portal vein phase.
- the determination unit 38 determines the contrast enhancement state of the image series of images IM1 (an example of a “first contrast enhancement state”), the contrast enhancement state of the image series of images IM2 (an example of a “second contrast enhancement state”), and The contrast enhancement state of the image series IM3 is determined, and the determined contrast enhancement state of the image series IM1, the determined contrast enhancement state of the image series IM2, and the contrast enhancement state of the image series IM3 are integrated in the integration unit 36. A final imaging state may be determined.
- ⁇ Third embodiment>> an example will be described in which the probability distribution of the elapsed time after injection of the contrast agent is used as the index value for the contrast enhancement state.
- the hardware configuration of the imaging state determination apparatus 10 according to the third embodiment may be the same as that of the first embodiment.
- FIG. 7 is a conceptual diagram showing an outline of processing by the contrast state determination device 10 according to the third embodiment.
- the contrast enhancement state determination device 10 that estimates the distribution of the number of seconds after contrast agent injection based on a plurality of input slice images and determines the contrast enhancement state based on the estimated distribution of the number of seconds will be described.
- the imaging state determination apparatus 10 includes a seconds distribution estimating unit 14 that receives an input of an image IM and estimates a probability distribution of seconds (hereinafter referred to as “seconds distribution”);
- a maximum It includes a point specifying unit 18 and a discriminating unit 38 that discriminates the contrast-enhanced time phase by associating the specified number of seconds with the contrast-enhanced time phase.
- the contrast-enhanced time phase converted by the determination unit 38 is output as a final result.
- FIG. 7 shows three seconds distribution estimating units 14 in order to show the flow of processing when three different images IM are input.
- the distribution estimator 14 is the same (single) processor.
- the function of formula (2) is an example of a mapping that converts the likelihood score value Ob to a value b in the positive region.
- Parameter ⁇ is an example of a “first parameter” in the present disclosure.
- Parameter b is an example of a "second parameter" in the present disclosure.
- the Laplace distribution is applied as the probability distribution model of the number-of-seconds distribution.
- Laplacian distribution is represented by the function of the following equation (3).
- the reason for converting the likelihood score value Ob to a positive value b is related to applying the Laplace distribution as a probability distribution model for the number of seconds distribution. This is because if the parameter b is a negative value (b ⁇ 0), the Laplace distribution does not hold as a probability distribution, so it is necessary to ensure that the parameter b is a positive value (b>0). .
- FIG. 10 shows an example of a graph of the number-of-seconds distribution estimated by the parameters ⁇ and b estimated by the number-of-seconds distribution estimation unit 14 .
- the position indicated by the dashed line GT in the drawing corresponds to the correct number of seconds (correct number of seconds).
- Estimating a set of the estimated value Oa and the probability score Ob from the input image IM substantially corresponds to estimating the number-of-seconds distribution.
- the estimated value Oa of the number of seconds is an example of a "random variable" in this disclosure.
- FIG. 11 is an explanatory diagram showing an example of processing in the integrating section 16 and the maximum point specifying section 18.
- FIG. 11 To simplify the explanation, an example of integrating two distributions of seconds estimated by the distribution of seconds estimating unit 14 is shown here, but the same applies to the case of integrating three or more distributions of seconds.
- Graph GL1 in FIG. 11 is an example of logarithmic probability density logP1 obtained by taking the logarithm of probability distribution P1.
- a graph GD2 shown in the lower left of FIG. 11 is a distribution of seconds (probability distribution P2 ) is an example.
- the parameter ⁇ 2 is an example of the "second elapsed time”
- the parameter b2 is an example of the "second likelihood of the second elapsed time”
- the probability distribution P2 is an example of the "second probability distribution model”.
- parameters ⁇ 1 and ⁇ 2 are examples of "multiple elapsed times”
- parameters b1 and b2 are examples of “multiple likelihoods”
- probability distributions P1 and P2 are examples of "multiple probability distribution models”.
- a graph GL2 in FIG. 11 is an example of the logarithmic probability density obtained by taking the logarithm of the probability distribution P2.
- the graph GLS shown on the far right in FIG. 11 is an example of the joint logarithmic probability density that integrates the logarithmic probability density logP1 and the logarithmic probability density logP2.
- the distribution shown in graph GLS is an example of "integrated distribution" in the present disclosure.
- the target function of argmin shown on the right side of the equal sign in the second row of Equation (4) corresponds to the loss function during training in machine learning, which will be described later.
- the right side of the equal sign described in the third row corresponds to the weighted median formula.
- the parameter bi corresponding to the weight for integration dynamically changes according to the output of the regression estimator 22 .
- the integrated distribution takes the form of a weighted median.
- a highly accurate estimated value can be obtained by suppressing the influence of the outlier.
- FIG. 12 is a schematic explanatory diagram of an example of a machine learning method for generating a regression model applied to the number-of-seconds distribution estimator 14.
- Training data used for machine learning includes an image TIM as input data and correct data (teacher signal t) corresponding to the input.
- the image TIM may be a slice image that constitutes an image series of three-dimensional CT data
- the teacher signal t is a value that indicates the number of seconds (ground truth) from the injection of the contrast medium when the series to which the slice image belongs is captured. It's okay.
- a plurality of training data are generated by linking the corresponding teacher signal t.
- "Binding” may also be referred to as correspondence or association.
- "Training” is synonymous with "learning.”
- the same teacher signal t may be associated with slices of the same image series. That is, the teacher signal t may be associated with each image series.
- each slice is associated with a corresponding teacher signal t to generate multiple training data.
- a set of training data thus generated is used as a training data set.
- the learning model 20 (an example of the "second learning model") is configured using CNN.
- the learning model 20 is used in combination with the variable conversion section 24 .
- the variable conversion unit 24 may be integrally incorporated into the learning model 20 .
- the learning model 20 When the image TIM read from the training data set is input to the learning model 20, the learning model 20 outputs the estimated value Oa of the number of seconds and the likelihood score Ob.
- the estimated value Oa and the score value Ob are variable-transformed into the parameter ⁇ and the parameter b of the probability distribution model by the variable transformation unit 24 .
- the loss function L used during training is defined by the following equation (5).
- the subscript i is an index that identifies each slice.
- FIG. 13 is an explanatory diagram of the loss function used during training.
- the loss function is a negative log-likelihood, which directly optimizes the formula used for regression estimation by learning. Learning maximizes the log-likelihood of the teacher signal t in seconds.
- a graph for the parameter ⁇ of the loss function shown in Equation (5) is the graph GR ⁇ in FIG.
- the graph GR ⁇ has a stable slope with respect to the parameter ⁇ .
- the graph for the parameter b of the loss function shown in Equation (5) is the graph GRb in FIG.
- Graph GRb has an unstable slope with respect to parameter b. In regions where the value of b is small, 1/b is dominant, and in regions where the value of b is large, logb is dominant.
- the function used for variable transformation of the parameter b is a function that asymptotically approaches -1/x when x ⁇ - ⁇ and exp(x) when x ⁇ . can be canceled.
- the machine learning method of the learning model 20 described with reference to FIGS. 12 and 13 is an example of the "learned model generation method" in the present disclosure.
- FIG. 14 is a functional block diagram showing an overview of the processing functions of the imaging state determination device 10 according to the third embodiment.
- the processor 102 of the contrast state determination apparatus 10 executes the contrast state determination program 130 stored in the memory 104A to obtain the data acquisition unit 12, the seconds distribution estimation unit 14, the integration unit 16, the maximum point identification unit 18, the determination It functions as a unit 38 and an output unit 19 .
- the data acquisition unit 12 accepts input of data to be processed.
- the data acquisition unit 12 acquires an image IMi, which is a slice image sampled from CT data.
- n may be an integer of 2 or more.
- the data acquisition unit 12 may perform processing for cutting out slice images from CT data at regular intervals, or may acquire slice images sampled in advance by a processing unit (not shown) or the like.
- the image IMi captured via the data acquisition unit 12 is input to the regression estimation unit 22 of the seconds distribution estimation unit 14 .
- the regression estimator 22 outputs a set of an estimated value Oa of the number of seconds and a score value Ob indicating the likelihood of the estimated value Oa from each of the input images IMi.
- the estimated value Oa output from the regression estimating unit 22 is converted into the parameter ⁇ i of the probability distribution model in the variable transforming unit 24, and the likelihood score Ob output from the regression estimating unit 22 is converted to probability in the variable transforming unit 24. It is converted into parameters bi of the distribution model. These two parameters ⁇ i, bi estimate the probability distribution Pi of the seconds.
- the integration unit 16 performs processing to integrate multiple probability distributions Pi obtained by inputting multiple images IMi.
- the logarithm of the probability distribution Pi is taken in the logarithmic conversion unit 26 and converted into the logarithmic probability density logPi, and the integrated distribution is obtained by calculating the sum of the logarithmic probability densities logPi in the integrated distribution generation unit 28. .
- the maximum point identifying unit 18 identifies the value of the number of seconds (maximum point) with the maximum probability from the integrated distribution, and outputs the value of the identified number of seconds. Note that the maximum point identification unit 18 may be configured to be incorporated in the integration unit 16 .
- the discriminating unit 38 discriminates the contrast enhancement state from the value of the number of seconds specified by the maximum point specifying unit 18 .
- the determination unit 38 includes a conversion table 38A. Conversion table 38A is stored on computer readable medium 104 .
- the conversion table 38A associates the elapsed time from the start of injection of the contrast medium with the contrast time phase. For example, in the case of liver contrast imaging, the conversion table 38A is associated with the arterial phase for less than 50 seconds from the start of injection of the contrast agent, the portal vein phase for 50 seconds to less than 120 seconds, and the equilibrium phase for 120 seconds or longer. .
- the determination unit 38 determines the contrast enhancement state using the conversion table 38A.
- the number of seconds output from images that are not suitable for estimation may deteriorate the result.
- the estimation is less susceptible to the outliers and becomes robust.
- FIG. 15 is an explanatory diagram showing Example 2 of processing in the number-of-seconds distribution estimating unit 14 of the imaging state determination apparatus 10 according to the fourth embodiment. Instead of the processing described with reference to FIG. 8, the processing of FIG. 15 is applied.
- variable conversion unit 24 in the fourth embodiment converts the likelihood score value Ob into the parameter ⁇ 2 using the following equation (7) instead of equation (2).
- ⁇ 2 1/log(1+exp( ⁇ Ob)) (7)
- ⁇ 2 plays the role of certainty. ⁇ 2 corresponds to variance and ⁇ to standard deviation.
- the Gaussian distribution is represented by the function of the following formula (8).
- the reason for converting the score value Ob into a positive value ( ⁇ 2 ) is the same as in the third embodiment. This is because if the parameter ⁇ 2 is a negative value, the Gaussian distribution does not hold as a probability distribution, so it is necessary to ensure that the parameter ⁇ 2 is a positive value ( ⁇ 2 >0).
- FIG. 16 shows an example of a graph of the number-of-seconds distribution estimated by the parameters ⁇ and ⁇ 2 estimated by the number-of-seconds distribution estimator 14 .
- FIG. 17 is an explanatory diagram showing an example of processing in the integrating section 16 and the maximum point identifying section 18 of the contrast state determination apparatus 10 according to the fourth embodiment. Here, an example of integrating two number-of-seconds distributions estimated by the number-of-seconds distribution estimating unit 14 is shown.
- a graph GL1g in FIG. 17 is an example of the logarithmic probability density logP1 obtained by taking the logarithm of the probability distribution P1.
- a graph GD2g shown in the lower left of FIG. 17 is an example of the number of seconds distribution (probability distribution P2) represented by the parameters ⁇ 2 and ⁇ 2 2 estimated by the number of seconds distribution estimation unit 14 .
- a graph GL2g in FIG. 17 is an example of the logarithmic probability density obtained by taking the logarithm of the probability distribution P2.
- the rightmost graph GLSg in FIG. 17 is an example of the joint logarithmic probability density that integrates the logarithmic probability density logP1 and the logarithmic probability density logP2.
- the maximum point identifying unit 18 identifies the value x that maximizes the logarithmic probability from the integrated joint logarithmic probability density.
- the processing in the maximum point identification unit 18 can be represented by the following equation (9).
- the target function of argmin shown on the right side of the equal sign in the second row of Equation (9) corresponds to the loss function during training in machine learning, which will be described later. Also, the right side of the equal sign described in the third row corresponds to the weighted average formula.
- the input value (maximum point) x that maximizes the logarithmic probability is selected as the final estimation result (final result).
- FIG. 18 is an explanatory diagram schematically showing an example of a machine learning method for generating a regression model applied to the number-of-seconds distribution estimator 14 in the fourth embodiment. Training data used for learning may be the same as in the third embodiment. Regarding FIG. 18, points different from FIG. 12 will be described.
- the error backpropagation method is applied using the loss sum represented by Equation (11), and the learning model 20 is trained using the stochastic gradient descent method in the same way as in normal CNN learning.
- the learning model 20 is trained using multiple training data comprising multiple image series, the parameters of the learning model 20 are optimized to obtain a trained model.
- the learned model thus obtained is applied to the number-of-seconds distribution estimation unit 14 .
- images IM1, IM2, and IM3 which are slice images (tomographic images) obtained by extracting slices from three-dimensional CT data at equal intervals, are used as inputs.
- the image to be displayed is not limited to this.
- a two-dimensional image IM11 (an example of a “first two-dimensional image”) including information of an image IM1 (an example of a “first slice image”)
- an image IM2 (an example of a “second slice image”)
- a two-dimensional image IM12 (an example of a "second two-dimensional image") including information of a "slice image”
- a two-dimensional image IM13 including information of an image IM3.
- the two-dimensional image may be a tomographic image TGimg itself, a MIP (Maximum Intensity Projection) image MIPimg configured at regular intervals, or an average image AVEimg generated from a plurality of slice images.
- Inputs to the phase estimation unit 30, the number-of-seconds estimation unit 34, and the number-of-seconds distribution estimation unit 14 may be a combination of multiple types of data elements. For example, as shown in FIG. 20, at least one of slice images, MIP images, and average images, which are partial images of the same series of CT data, can be used as an input, and a combination of these image types can be used. It may be input to the phase estimator 30 , the number of seconds estimator 34 , and the number of seconds distribution estimator 14 . For example, the combination of the average image and the MIP image may be input to the seconds distribution estimation unit 14 to estimate the seconds distribution. MIP images and average images are examples of generated images generated from partial images of three-dimensional CT data.
- FIG. 21 is a block diagram showing a configuration example of a medical information system 200 including a medical image processing device 220.
- the contrast enhancement state determination device 10 described as the first to fourth embodiments is incorporated in a medical image processing device 220, for example.
- a medical information system 200 is a computer network built in a medical institution such as a hospital.
- the medical information system 200 includes a modality 230 that captures medical images, a DICOM server 240, a medical image processing device 220, an electronic chart system 244, and a viewer terminal 246. These elements are connected via a communication line 248. Connected.
- Communication line 248 may be a local communication line within a medical institution. Also, part of the communication line 248 may be a wide area communication line.
- the modality 230 include a CT device 231, an MRI (Magnetic Resonance Imaging) device 232, an ultrasonic diagnostic device 233, a PET (Positron Emission Tomography) device 234, an X-ray diagnostic device 235, an X-ray fluoroscopic diagnostic device 236, and An endoscope device 237 and the like are included.
- CT device 231 an MRI (Magnetic Resonance Imaging) device 232, an ultrasonic diagnostic device 233, a PET (Positron Emission Tomography) device 234, an X-ray diagnostic device 235, an X-ray fluoroscopic diagnostic device 236, and An endoscope device 237 and the like are included.
- the types of modalities 230 connected to the communication line 248 can be combined in various ways for each medical institution.
- the DICOM server 240 is a server that operates according to the DICOM specifications.
- the DICOM server 240 is a computer that stores and manages various data including images captured using the modality 230, and has a large-capacity external storage device and a database management program.
- the DICOM server 240 communicates with other devices via a communication line 248 to transmit and receive various data including image data.
- the DICOM server 240 receives image data generated by the modality 230 and other various data via a communication line 248, and stores and manages them in a recording medium such as a large-capacity external storage device.
- the storage format of image data and communication between devices via the communication line 248 are based on the DICOM protocol.
- the medical image processing apparatus 220 can acquire data from the DICOM server 240 or the like via the communication line 248.
- the medical image processing apparatus 220 performs image analysis and various other processes on medical images captured by the modality 230 .
- the medical image processing device 220 performs, for example, processing for recognizing a lesion area from an image, processing for identifying a classification such as a disease name, or segmentation processing for recognizing a region such as an organ. It may be configured to perform analysis processing such as various computer aided diagnosis (Computer Aided Diagnosis, Computer Aided Detection: CAD).
- the medical image processing device 220 can also send processing results to the DICOM server 240 and the viewer terminal 246 . Note that the processing functions of the medical image processing apparatus 220 may be installed in the DICOM server 240 or the viewer terminal 246 .
- Various data stored in the database of the DICOM server 240 and various information including the processing results generated by the medical image processing apparatus 220 can be displayed on the viewer terminal 246.
- the viewer terminal 246 is a terminal for viewing images called a PACSCS (Picture Archiving and Communication Systems) viewer or a DICOM viewer.
- a plurality of viewer terminals 246 can be connected to the communication line 248 .
- the form of the viewer terminal 246 is not particularly limited, and may be a personal computer, a workstation, a tablet terminal, or the like.
- a program that causes a computer to implement the processing functions of the imaging state determination apparatus 10 is recorded on a computer-readable medium that is a non-temporary information storage medium such as an optical disk, magnetic disk, semiconductor memory, or other tangible object, and through this information storage medium. It is possible to provide a program.
- part or all of the processing functions in the imaging state determination apparatus 10 may be realized by cloud computing, and may be provided as a Sass (Software as a Service) service.
- Sass Software as a Service
- processors include CPUs, which are general-purpose processors that run programs and function as various processing units, GPUs, which are processors specialized for image processing, and FPGAs (Field Programmable Gate Arrays).
- PLD Programmable Logic Device
- ASIC Application Specific Integrated Circuit
- a single processing unit may be composed of one of these various processors, or may be composed of two or more processors of the same type or different types.
- one processing unit may be configured by a plurality of FPGAs, a combination of CPU and FPGA, or a combination of CPU and GPU.
- a plurality of processing units may be configured by one processor.
- configuring a plurality of processing units in a single processor first, as represented by computers such as clients and servers, a single processor is configured by combining one or more CPUs and software. There is a form in which a processor functions as multiple processing units.
- SoC System On Chip
- the various processing units are configured using one or more of the above various processors as a hardware structure.
- the hardware structure of these various processors is, more specifically, an electrical circuit that combines circuit elements such as semiconductor elements.
- Contrast state determination device 10
- Data acquisition unit 14
- Second distribution estimation unit 16
- Integration unit 18
- Maximum point identification unit 19
- Output unit 20
- Learning model 22
- Regression estimation unit 24
- Variable conversion unit 26
- Logarithmic conversion unit 24
- Variable conversion unit 26
- Logarithmic conversion unit 28
- Integrated distribution generation unit 30
- Temporal estimation Unit 30A Trained model
- Integration unit 34
- Number of seconds estimation unit 34A Trained model
- Integration unit 38
- Discrimination unit 38
- Conversion table 102
- Processor 104
- Computer-readable medium 104
- Memory 104B
- Communication interface 108
- Input/output interface 110
- Bus 114
- Input device 116
- Display Apparatus 130
- Contrast state determination program 200
- Medical information system 220
- Medical image processing apparatus 230
- Modality 21
- CT apparatus 232
- MRI apparatus 233
- Ultrasound diagnostic apparatus 234
- PET apparatus 235
Landscapes
- Health & Medical Sciences (AREA)
- Life Sciences & Earth Sciences (AREA)
- Medical Informatics (AREA)
- Engineering & Computer Science (AREA)
- Radiology & Medical Imaging (AREA)
- Biomedical Technology (AREA)
- Biophysics (AREA)
- Nuclear Medicine, Radiotherapy & Molecular Imaging (AREA)
- Optics & Photonics (AREA)
- Pathology (AREA)
- Physics & Mathematics (AREA)
- High Energy & Nuclear Physics (AREA)
- Heart & Thoracic Surgery (AREA)
- Molecular Biology (AREA)
- Surgery (AREA)
- Animal Behavior & Ethology (AREA)
- General Health & Medical Sciences (AREA)
- Public Health (AREA)
- Veterinary Medicine (AREA)
- Apparatus For Radiation Diagnosis (AREA)
Abstract
高速に、高精度に、かつロバストに、画像内に含まれない臓器があっても造影状態を判別する造影状態判別装置、造影状態判別方法、及びプログラムを提供する。被検体への造影剤の注入前又は注入後に撮影された第1の画像シリーズから被検体のそれぞれ異なる位置のスライス画像の情報をそれぞれ含む複数の2次元画像を取得し、複数の2次元画像の各2次元画像から造影状態に関する指標値をそれぞれ推定し、それぞれ複数の指標値に基づいて第1の画像シリーズの造影状態を判別する。
Description
本発明は造影撮影された画像から造影状態を判別する造影状態判別装置、造影状態判別方法、及びプログラムに係り、特に2次元画像から造影状態を判別する技術に関する。
造影剤を用いたCT(Computed Tomography)検査によって撮影されたダイナミック造影CT画像は、造影時相により見え方が大きく異なり、造影時相を正しく把握することは血管抽出などの造影に依存する処理に必要である。DICOM(Digital Imaging and COmmunications in Medicine)タグに造影情報が含まれることもあるが、必ずしも含まれているわけではない上に、間違えている場合もある。そのため、画像から造影時相を把握することが求められる。
特許文献1には、肝臓の造影の有無を判別する技術が開示されている。また、造影には複数のフェーズ(例えば、造影前・動脈相・門脈相・平衡相)があり、非特許文献1には、それらを画像から自動判別する技術も開示されている。
Automatic Contrast Phase Estimation in CT Volumes, Michal Sofka, Dijia Wu, Michael S¨uhling, David Liu, Christian Tietjen, Grzegorz Soza, and S. Kevin Zhou <URL:https://link.springer.com/content/pdf/10.1007%2F978-3-642-23626-6_21.pdf>
造影時相の情報は、後段の造影時相に依存する別の処理に必要となり、高速に動作することが求められる。しかしながら、非特許文献1に開示された技術は、造影画像を3D(Dimension)のまま処理しているため時間がかかってしまうという問題点があった。また、特許文献1に開示された技術は、造影画像に特定の領域が映っていない場合に造影時相を判定することができないという問題点があった。
本発明はこのような事情に鑑みてなされたもので、高速に、高精度に、かつロバストに、画像内に含まれない臓器があっても造影状態を判別する造影状態判別装置、造影状態判別方法、及びプログラムを提供することを目的とする。
上記目的を達成するための造影状態判別装置の一の態様は、少なくとも1つのプロセッサと、少なくとも1つのプロセッサに実行させるための命令を記憶する少なくとも1つのメモリと、を備え、少なくとも1つのプロセッサは、被検体への造影剤の注入前又は注入後に撮影された第1の画像シリーズから被検体のそれぞれ異なる位置のスライス画像の情報をそれぞれ含む複数の2次元画像を取得し、複数の2次元画像の各2次元画像から造影状態に関する指標値をそれぞれ推定し、それぞれ推定した複数の指標値に基づいて第1の画像シリーズの造影状態を判別する造影状態判別装置である。
すなわち、造影状態判別装置は、被検体への造影剤の注入前又は注入後に撮影された第1の画像シリーズから少なくとも被検体の第1の位置の第1のスライス画像の情報を含む第1の2次元画像、及び第1の位置とは異なる第2の位置の第2のスライス画像の情報を含む第2の2次元画像を取得し、第1の2次元画像から造影状態に関する第1の指標値を推定し、第2の2次元画像から造影状態に関する第2の指標値を推定し、少なくとも第1の指標値及び第2の指標値に基づいて第1の画像シリーズの造影状態を判別する。造影状態判別装置は、さらに、第1の画像シリーズから被検体の第1の位置及び第2の位置とは異なる第3の位置の第3のスライス画像の情報を含む第3の2次元画像を取得し、第3の2次元画像から造影状態に関する第3の指標値を推定し、第1~第3の指標値に基づいて第1の画像シリーズの造影状態を判別することも可能である。
本態様によれば、被検体のそれぞれ異なる複数の位置の2次元画像からそれぞれ推定した指標値に基づいて画像シリーズの造影状態を判別するようにしたので、高速に、高精度に、かつロバストに、画像内に含まれない臓器があっても造影状態を判別することができる。
指標値は、複数の造影状態のうちの各造影状態にそれぞれ属する確からしさであり、少なくとも1つのプロセッサは、複数の指標値を統合した指標値を導出し、統合した指標値に基づいて第1の画像シリーズの造影状態を判別することが好ましい。
被検体への造影剤の注入前又は注入後に撮影された画像シリーズに基づく2次元画像が入力されると複数の造影状態のうちの各造影状態にそれぞれ属する確からしさを出力する第1の学習モデルを備え、少なくとも1つのプロセッサは、複数の2次元画像を第1の学習モデルに入力して複数の指標値を推定することが好ましい。
指標値は、被検体に造影剤を注入してからの経過時間であり、少なくとも1つのプロセッサは、複数の指標値である複数の経過時間を統合した経過時間を導出し、統合した経過時間に基づいて第1の画像シリーズの造影状態を判別することが好ましい。
指標値は、被検体に造影剤を注入してからの経過時間及び経過時間の確からしさであり、少なくとも1つのプロセッサは、複数の指標値である複数の確からしさに基づいて複数の指標値である複数の経過時間を統合した経過時間を導出し、統合した経過時間に基づいて第1の画像シリーズの造影状態を判別することが好ましい。
少なくとも1つのプロセッサは、経過時間及び確からしさをそれぞれパラメータとした複数の確率分布モデルの積に基づいて統合した経過時間を導出することが好ましい。
被検体への造影剤の注入前又は注入後に撮影された画像シリーズに基づく2次元画像が入力されると被検体に造影剤を注入してからの経過時間及び経過時間の確からしさを出力する第2の学習モデルを備え、少なくとも1つのプロセッサは、複数の2次元画像を第2の学習モデルに入力して複数の経過時間及び複数の確からしさを推定することが好ましい。
被検体に造影剤を注入してからの経過時間及び造影状態が対応付けられた変換テーブルを備え、少なくとも1つのプロセッサは、統合した経過時間及び変換テーブルに基づいて第1の画像シリーズの造影状態を判別することが好ましい。
被検体に造影剤を注入してからの経過時間及び造影状態が対応付けられた変換テーブルを備え、少なくとも1つのプロセッサは、複数の指標値として被検体に造影剤を注入してからの複数の経過時間を推定し、複数の経過時間及び変換テーブルに基づいて第1の画像シリーズの複数の造影状態を判別し、複数の造影状態に基づいて第1の画像シリーズの造影状態を判別することが好ましい。
2次元画像は、スライス画像、複数のスライス画像のMIP(Maximum Intensity Projection)画像、及び複数のスライス画像の平均画像のうちの少なくとも1つであることが好ましい。
第1の画像シリーズは、被検体の肝臓を含む3次元画像であり、造影状態は、非造影、動脈相、門脈相、及び平衡相のうちの少なくとも1つを含むことが好ましい。
第1の画像シリーズは、被検体の腎臓を含む3次元画像であり、造影状態は、非造影、皮髄相、実質相、及び排泄相のうちの少なくとも1つを含むことが好ましい。
上記目的を達成するための造影状態判別方法の一の態様は、被検体への造影剤の注入前又は注入後に撮影された第1の画像シリーズから被検体のそれぞれ異なる位置のスライス画像の情報をそれぞれ含む複数の2次元画像を取得する工程と、複数の2次元画像の各2次元画像から造影状態に関する指標値をそれぞれ推定する工程と、それぞれ推定した複数の指標値に基づいて第1の画像シリーズの造影状態を判別する工程と、を備える造影状態判別方法である。
上記目的を達成するためのプログラムの一の態様は、上記の造影状態判別方法をコンピュータに実行させるためのプログラムである。このプログラムが記録された、コンピュータが読み取り可能な非一時的記憶媒体も本態様に含んでよい。
本発明によれば、高速に、高精度に、かつロバストに、画像内に含まれない臓器があっても造影状態を判別することができる。
以下、添付図面に従って本発明の好ましい実施形態について詳説する。
《第1実施形態に係る造影状態判別装置10の概要》
図1は、第1実施形態に係る造影状態判別装置10による処理の概要を示す概念図である。ここでは、CT(Computed Tomography)装置を用いて造影撮影された同一の画像シリーズの複数のスライス画像に基づき、画像シリーズの造影状態(造影時相)を推定する造影状態判別装置10の例を説明する。第1実施形態では、同じシリーズ内の複数のスライス画像を入力に用いて、画像解析により造影状態の推定が行われる。「画像解析により」とは、画像データを構成する画素値に基づく処理により、という意味である。
図1は、第1実施形態に係る造影状態判別装置10による処理の概要を示す概念図である。ここでは、CT(Computed Tomography)装置を用いて造影撮影された同一の画像シリーズの複数のスライス画像に基づき、画像シリーズの造影状態(造影時相)を推定する造影状態判別装置10の例を説明する。第1実施形態では、同じシリーズ内の複数のスライス画像を入力に用いて、画像解析により造影状態の推定が行われる。「画像解析により」とは、画像データを構成する画素値に基づく処理により、という意味である。
なお、肝臓造影撮影の造影状態は、非造影、動脈相(早期動脈相/後期動脈相)、門脈相、及び平衡相のうちの少なくとも1つを含む。また、腎臓造影撮影の造影状態は、非造影、皮髄相、実質相、及び排泄相のうちの少なくとも1つを含む。ここでは、肝臓造影撮影された画像シリーズの造影状態を判別する例を説明する。
造影状態判別装置10は、コンピュータのハードウェアとソフトウェアとを用いて実現できる。図1に示すように、造影状態判別装置10は、時相推定部30と、統合部32とを含む。
造影状態判別装置10には、複数のスライス画像が入力される。複数のスライス画像は、患者SB(「被検体」の一例)への造影剤の注入前又は注入後に撮影された同一の画像シリーズの3次元CTデータから等間隔にサンプリングされた画像である。図1に示す例では、造影状態判別装置10には、患者SBのそれぞれ異なる位置SBP1、位置SBP2、及び位置SBP3の3枚の画像IM1、IM2、及びIM3(「複数のスライス画像」の一例、「複数の2次元画像」の一例)が入力されている。なお、スライス画像は、断層画像と言い換えてもよい。スライス画像は実質的に2次元画像(断面画像)として理解してよい。
時相推定部30は、入力された画像の画像シリーズが複数の造影時相のうちの各造影時相にそれぞれ属する確からしさである指標値(「造影状態に関する指標値」の一例)を推定する。時相推定部30から出力される各造影時相に属する確からしさの数値範囲は、「0%~100%」であってよい。図1では、3枚の異なる画像IM1、IM2、及びIM3が入力される場合の処理の流れを示すために、3つの時相推定部30が図示されているが、各画像IM1~IM3が入力される時相推定部30は同じ(単一の)処理部である。
時相推定部30は、機械学習によって訓練された学習済みモデル30A(「第1の学習モデル」の一例)を含む。学習済みモデル30Aは、造影撮影された3次元画像に基づく2次元画像が入力されると、入力された2次元画像の画像シリーズが複数の造影時相のうちの各造影時相にそれぞれ属する確からしさを出力する多クラス分類モデルである。学習済みモデル30Aは、例えば、畳み込みニューラルネットワーク(Convolutional neural network:CNN)を用いて構成される。学習済みモデル30Aは、被検体への造影剤の注入前又は注入後に撮影された画像シリーズに基づく2次元画像とその画像シリーズの造影時相とのペアを学習データとして周知の方法で学習されている。時相推定部30は、入力された2次元画像を学習済みモデル30Aに入力して各画像の指標値を推定する。
図1に示す例では、時相推定部30は、画像IM1の指標値として、複数の造影状態のうちの動脈相に属する確からしさが10%であり、門脈相に属する確からしさが50%であり、平衡相に属する確からしさが40%である推定結果PS1を出力している。また、時相推定部30は、画像IM2の指標値として、動脈相に属する確からしさが5%であり、門脈相に属する確からしさが80%であり、平衡相に属する確からしさが15%である推定結果PS2を出力している。また、時相推定部30は、画像IM3の指標値として、動脈相に属する確からしさが30%であり、門脈相に属する確からしさが35%であり、平衡相に属する確からしさが35%である推定結果PS3を出力している。
統合部32は、入力された複数の指標値を統合した指標値を導出し、画像シリーズの造影状態を判別する。統合部32は、最大値によって複数の指標値を統合してもよいし、多数決によって複数の指標値を統合してもよいし、確率和によって複数の指標値を統合してもよい。統合部32により統合された指標値が、最終的な推定結果として出力される。図1に示す例では、統合部32は、推定結果PS1、推定結果PS2、及び推定結果PS3を統合し、最終的な推定結果として門脈相を出力している。
《入力に用いられる医療画像の説明》
医療画像のフォーマットと通信プロトコルとを定義したDICOM(Digital Imaging and COmmunications in Medicine)の規格においては、検査種を特定するための識別符号(identification:ID)であるスタディ(Study)IDという単位の中に、シリーズIDが定義されている。
医療画像のフォーマットと通信プロトコルとを定義したDICOM(Digital Imaging and COmmunications in Medicine)の規格においては、検査種を特定するための識別符号(identification:ID)であるスタディ(Study)IDという単位の中に、シリーズIDが定義されている。
例えば、ある患者の肝臓造影撮影では、下記のように撮影タイミングを変えて、複数回(ここでは4回)、肝臓を含む範囲のCT撮影が行われる。
[1回目の撮影]造影剤注入前
[2回目の撮影]造影剤注入後35秒経過時
[3回目の撮影]造影剤注入後70秒経過時
[4回目の撮影]造影剤注入後180秒経過時
[1回目の撮影]造影剤注入前
[2回目の撮影]造影剤注入後35秒経過時
[3回目の撮影]造影剤注入後70秒経過時
[4回目の撮影]造影剤注入後180秒経過時
これら4回の撮影によって、4種のCTデータが得られる。ここでいう「CTデータ」は、連続する複数枚のスライス画像(断層画像)から構成される3次元データであり、3次元データを構成している複数枚のスライス画像の集合体(連続するスライス画像のまとまり)を「画像シリーズ(Series)」という。CTデータは本開示における「3次元画像」の一例である。
上記の4回の撮影を含む一連の撮影により得られた4種のCTデータには、それぞれ同じスタディIDと、それぞれ別々のシリーズIDとが付与される。
例えば、ある特定の患者の肝臓造影撮影という検査についてのスタディIDとして「スタディ1」が付与され、造影剤注入前の撮影により得られたCTデータのシリーズIDとして「シリーズ1」、造影剤注入後35秒経過時の撮影により得られたCTデータには「シリーズ2」、造影剤注入後70秒経過時の撮影により得られたCTデータには「シリーズ3」、造影剤注入後180秒経過時の撮影により得られたCTデータには「シリーズ4」というように、シリーズごとに固有のIDが付与される。したがって、スタディIDとシリーズIDとの組み合わせにより、CTデータを識別することができる。その一方で、実際のCTデータにおいては、シリーズIDと、撮影タイミング(造影剤注入後経過時間)との対応関係が明確に把握されていない場合がある。
また、3次元のCTデータはデータのサイズが大きいため、CTデータをそのまま入力データとして用いて、造影状態を判別する処理を行うことは困難な場合がある。
《造影状態判別方法》
図2は、造影状態判別装置10による造影状態判別方法の各工程を示すフローチャートである。ここでは、肝臓造影撮影された画像シリーズの造影状態を判別する例を説明する。
図2は、造影状態判別装置10による造影状態判別方法の各工程を示すフローチャートである。ここでは、肝臓造影撮影された画像シリーズの造影状態を判別する例を説明する。
ステップS1では、造影状態判別装置10は、患者SBへの造影剤の注入前又は注入後に撮影された画像シリーズ(「第1の画像シリーズ」の一例)から患者SBの位置SBP1(「第1の位置」の一例)の画像IM1(「第1のスライス画像」の一例、「第1の2次元画像」の一例)を取得する。
ステップS2では、時相推定部30は、ステップS1で取得した画像IM1を学習済みモデル30Aに入力して造影状態に関する第1の指標値を推定する。ここでは、時相推定部30は、第1の指標値として非造影である確率(非造影らしさ)、動脈相である確率(動脈相らしさ)、門脈相である確率(門脈相らしさ)、及び平衡相である確率(平衡相らしさ)をそれぞれ求め、推定結果PS1として出力する。
ステップS3では、造影状態判別装置10は、画像IM1と同じ画像シリーズから患者SBの位置SBP2(「第2の位置」の一例)の画像IM2(「第2のスライス画像」の一例、「第2の2次元画像」の一例)を取得する。
ステップS4では、時相推定部30は、ステップS3で取得した画像IM2を学習済みモデル30Aに入力して造影状態に関する第2の指標値を推定する。ここでは、時相推定部30は、第2の指標値として非造影である確率、動脈相である確率、門脈相である確率、及び平衡相である確率をそれぞれ求め、推定結果PS2として出力する。
同様に、造影状態判別装置10は画像IM3を取得し、時相推定部30は画像IM3から造影状態に関する指標値として推定結果PS3を出力する。
ステップS5では、統合部32は、推定結果PS1~PS3に基づいて画像シリーズの造影状態を判別し、判別した造影状態を最終的な推定結果として出力する。
以上のように、造影状態判別装置10による造影状態判別方法によれば、複数の2次元画像に基づいて造影時相を判別するので、1枚の2次元画像に基づいて造影時相を判別する場合よりも精度が高く、ロバストである。また、3次元画像に基づいて造影時相を判別する場合よりも推論が速い。さらに、特定の領域をもとに推定を行っているわけではないので、画像に写っていない臓器があっても推定が可能である。
ここでは、造影状態判別装置10は、3枚の画像IM1、IM2、及びIM3に基づいて造影時相を判別したが、2枚の画像に基づいて造影時相を判別してもよいし、4枚以上の画像に基づいて造影時相を判別してもよい。画像が相対的に少ない方が処理が相対的に高速となり、画像が相対的に多い方が判別結果が相対的に高精度に、かつロバストになる。
《ハードウェア構成の例》
図3は、第1実施形態に係る造影状態判別装置10のハードウェア構成の例を概略的に示すブロック図である。造影状態判別装置10は、1台又は数台のコンピュータを用いて構成されるコンピュータシステムによって実現することができる。ここでは、1台のコンピュータがプログラムを実行することにより、造影状態判別装置10の各種機能を実現する例を述べる。なお、造影状態判別装置10として機能するコンピュータの形態は特に限定されず、サーバコンピュータであってもよいし、ワークステーションであってもよく、パーソナルコンピュータあるいはタブレット端末などであってもよい。
図3は、第1実施形態に係る造影状態判別装置10のハードウェア構成の例を概略的に示すブロック図である。造影状態判別装置10は、1台又は数台のコンピュータを用いて構成されるコンピュータシステムによって実現することができる。ここでは、1台のコンピュータがプログラムを実行することにより、造影状態判別装置10の各種機能を実現する例を述べる。なお、造影状態判別装置10として機能するコンピュータの形態は特に限定されず、サーバコンピュータであってもよいし、ワークステーションであってもよく、パーソナルコンピュータあるいはタブレット端末などであってもよい。
造影状態判別装置10は、プロセッサ102と、非一時的な有体物であるコンピュータ可読媒体104と、通信インターフェース106と、入出力インターフェース108とバス110とを含む。
プロセッサ102は、CPU(Central Processing Unit)を含む。プロセッサ102はGPU(Graphics Processing Unit)を含んでもよい。プロセッサ102は、バス110を介してコンピュータ可読媒体104、通信インターフェース106、及び入出力インターフェース108と接続される。プロセッサ102は、コンピュータ可読媒体104に記憶された各種のプログラム、及びデータ等を読み出し、各種の処理を実行する。
コンピュータ可読媒体104は、例えば、主記憶装置であるメモリ104A、及び補助記憶装置であるストレージ104Bを含む。ストレージ104Bは、例えば、ハードディスク(Hard Disk Drive:HDD)装置、ソリッドステートドライブ(Solid State Drive:SSD)装置、光ディスク、光磁気ディスク、もしくは半導体メモリ、又はこれらの適宜の組み合わせを用いて構成される。ストレージ104Bには、各種プログラム、及びデータ等が記憶される。コンピュータ可読媒体104は本開示における「記憶装置」の一例である。
メモリ104Aは、プロセッサ102の作業領域として使用され、ストレージ104Bから読み出されたプログラム、及び各種のデータを一時的に記憶する記憶部として用いられる。ストレージ104Bに記憶されているプログラムがメモリ104Aにロードされ、プログラムの命令をプロセッサ102が実行することにより、プロセッサ102は、プログラムで規定される各種の処理を行う手段として機能する。メモリ104Aには、プロセッサ102によって実行される造影状態判別プログラム130、及び各種のデータ等が記憶される。造影状態判別プログラム130は、機械学習によって訓練された学習済みモデル30A(図1参照)を含み、図1及び図2で説明した処理をプロセッサ102に実行させる。
通信インターフェース106は、有線又は無線により外部装置との通信処理を行い、外部装置との間で情報のやり取りを行う。造影状態判別装置10は通信インターフェース106を介して図示せぬ通信回線に接続される。通信回線は、ローカルエリアネットワークであってもよいし、ワイドエリアネットワークであってもよい。通信インターフェース106は、画像等のデータの入力を受け付けるデータ取得部の役割を担うことができる。
造影状態判別装置10は、さらに、入力装置114、及び表示装置116を含んでもよい。入力装置114、及び表示装置116は入出力インターフェース108を介してバス110に接続される。入力装置114は、例えば、キーボード、マウス、マルチタッチパネル、もしくはその他のポインティングデバイス、もしくは、音声入力装置、又はこれらの適宜の組み合わせであってよい。
表示装置116は、各種の情報が表示される出力インターフェースである。表示装置116は、例えば、液晶ディスプレイ、有機EL(organic electro-luminescence:OEL)ディスプレイ、もしくは、プロジェクタ、又はこれらの適宜の組み合わせであってよい。
《造影状態判別装置10の機能的構成》
図4は、第1実施形態に係る造影状態判別装置10の処理機能の概要を示す機能ブロック図である。造影状態判別装置10のプロセッサ102は、メモリ104Aに記憶された造影状態判別プログラム130を実行することにより、データ取得部12、時相推定部30、統合部32、及び出力部19として機能する。
図4は、第1実施形態に係る造影状態判別装置10の処理機能の概要を示す機能ブロック図である。造影状態判別装置10のプロセッサ102は、メモリ104Aに記憶された造影状態判別プログラム130を実行することにより、データ取得部12、時相推定部30、統合部32、及び出力部19として機能する。
データ取得部12は、処理対象のデータの入力を受け付ける。図4の例では、データ取得部12は、CTデータからサンプリングされたスライス画像である画像IMiを取得する。添字iは、複数の画像を識別するインデックス番号を表しており、図4では、i=1からnまでの異なるn枚の画像が入力され得ることを表している。nは2以上の整数であってよい。データ取得部12は、CTデータから等間隔にスライス画像を切り出す処理を実行してもよいし、不図示の処理部などによって予めサンプリングされたスライス画像を取得してもよい。
データ取得部12を介して取り込まれた画像IMiは、時相推定部30に入力される。
出力部19は、統合部32によって推定された造影状態を表示させたり、他の処理部に提供したりするための出力インターフェースである。出力部19は表示用のデータを生成する処理、及び/又は外部へのデータ送信等のためのデータ変換処理などの処理部を含んでもよい。造影状態判別装置10によって推定された造影時相は、不図示の表示装置などに表示させてもよい。
造影状態判別装置10は、例えば、病院などの医療機関において取得される医療画像を処理するための医療画像処理装置に組み込まれてもよい。また、造影状態判別装置10の処理機能は、クラウドサービスとして提供されてもよい。プロセッサ102が実行する造影状態判別の処理の方法は本開示における「造影状態判別方法」の一例である。
《第2実施形態》
第1実施形態では、造影状態に関する指標値として複数の造影時相のうちの各造影時相にそれぞれ属する確からしさを用いたが、第2実施形態では、造影状態に関する指標値として造影剤を注入してからの経過時間を用いる例を説明する。
第1実施形態では、造影状態に関する指標値として複数の造影時相のうちの各造影時相にそれぞれ属する確からしさを用いたが、第2実施形態では、造影状態に関する指標値として造影剤を注入してからの経過時間を用いる例を説明する。
第2実施形態に係る造影状態判別装置10のハードウェア構成は、第1実施形態と同様であってよい。第2実施形態について、第1実施形態と異なる点を説明する。
図5は、第2実施形態に係る造影状態判別装置10による処理の概要を示す概念図である。また、図6は、第2実施形態に係る造影状態判別装置10の処理機能の概要を示す機能ブロック図である。
ここでは、CT装置を用いて肝臓造影撮影された患者の3次元CTデータから等間隔にサンプリングされた複数のスライス画像を入力として用い、入力された複数のスライス画像の画像シリーズの造影剤注入からの秒数を推定し、推定した秒数に基づき造影状態を判別する造影状態判別装置10の例を説明する。以後、本明細書における「秒数」とは、明示的な記載がない限り、造影剤注入からの経過時間を示す秒数の意味を含む。
図5、及び図6に示すように、造影状態判別装置10は、画像IMの入力を受け付けて、画像IMの画像シリーズの造影剤注入からの経過時間として秒数を推定する秒数推定部34と、入力された複数の経過時間から統合した経過時間を導出する統合部36と、導出された経過時間から造影時相を判別する判別部38とを含む。判別部38により判別された造影時相が最終結果として出力部19から出力される。
なお、図5では、3枚の異なる画像IMが入力される場合の処理の流れを示すために、3つの秒数推定部34が図示されているが、各画像IMが入力される秒数推定部34は同じ(単一の)処理部である。
造影状態判別装置10に入力される複数のスライス画像は、第1実施形態と同様である。秒数推定部34は、入力された画像の画像シリーズの造影剤注入からの秒数を推定する。
秒数推定部34は、機械学習によって訓練された学習済みモデル34Aを含む。学習済みモデル34Aは、造影撮影された3次元画像に基づく2次元画像が入力されると、入力された2次元画像の画像シリーズの造影剤注入からの秒数を出力する。学習済みモデル34Aは、例えば、畳み込みニューラルネットワークを用いて構成される。学習済みモデル34Aは、被検体への造影剤の注入前又は注入後に撮影された画像シリーズに基づく2次元画像と画像シリーズの造影剤注入からの秒数とのペアを学習データとして周知の方法で学習されている。秒数推定部34は、入力された2次元画像を学習済みモデル34Aに入力して2次元画像の画像シリーズの造影剤を注入してからの経過時間を推定する。
図5に示す例では、秒数推定部34は、画像IM1の指標値として、70秒である推定結果PS11(「第1の経過時間」の一例)を出力し、画像IM2の指標値として、75秒である推定結果PS12(「第2の経過時間」の一例)を出力し、画像IM3の指標値として、80秒である推定結果PS13を出力している。
統合部36は、入力された複数の推定結果を任意の統計手法を用いて統合し、画像シリーズの造影剤注入からの秒数を推定する。統合部36は、例えば単純平均によって推定結果を統合してもよいし、重み付け平均によって推定結果を統合してもよし、複数の推定結果のうちのいずれか1つを選択して推定結果を統合してもよい。図5に示す例では、統合部36は、推定結果PS11、推定結果PS12、及び推定結果PS13を統合し、最終的な推定結果PS14として72秒を出力している。
判別部38は、統合部36が統合した秒数の値から造影状態を判別する。判別部38は、変換テーブル38Aを含む。変換テーブル38Aは、コンピュータ可読媒体104に記憶されていてもよい。変換テーブル38Aは、造影剤の注入開始からの経過時間及び造影時相が対応付けられている。例えば、肝臓造影撮影の場合、変換テーブル38Aには、造影剤注入開始から50秒未満は動脈相、50秒以上120秒未満は門脈相、120秒以上は平衡相がそれぞれ対応付けられている。判別部38は、変換テーブル38Aを用いて造影状態を判別する。図5に示す例では、最終的な推定結果PS14は72秒であるため、造影状態は門脈相と判別される。
ここでは、画像IM1、画像IM2、及びIM3からそれぞれ推定された経過時間を統合部36において統合し、統合された経過時間から判別部38において最終的な造影状態を判別したが、秒数推定部34において画像IM1の画像シリーズの経過時間(「第1の経過時間」の一例)、画像IM2の画像シリーズの経過時間(「第2の経過時間」の一例)、画像IM3の画像シリーズの経過時間をそれぞれ推定し、判別部38において画像IM1の画像シリーズの造影状態(「第1の造影状態」の一例)、画像IM2の画像シリーズの造影状態(「第2の造影状態」の一例)、及びIM3の画像シリーズの造影状態をそれぞれ判別し、判別された画像IM1の画像シリーズの造影状態、画像IM2の画像シリーズの造影状態、及びIM3の画像シリーズの造影状態を統合部36において統合することで最終的な造影状態を判別してもよい。
《第3実施形態》
第3実施形態では、造影状態に関する指標値として造影剤を注入してからの経過時間の確率分布を用いる例を説明する。第3実施形態に係る造影状態判別装置10のハードウェア構成は、第1実施形態と同様であってよい。
第3実施形態では、造影状態に関する指標値として造影剤を注入してからの経過時間の確率分布を用いる例を説明する。第3実施形態に係る造影状態判別装置10のハードウェア構成は、第1実施形態と同様であってよい。
図7は、第3実施形態に係る造影状態判別装置10による処理の概要を示す概念図である。ここでは、入力された複数のスライス画像に基づき造影剤注入からの秒数の分布を推定し、推定した秒数の分布に基づき造影状態を判別する造影状態判別装置10の例を説明する。
図7に示すように、造影状態判別装置10は、画像IMの入力を受け付けて、秒数の確率分布(以下、「秒数分布」という。)を推定する秒数分布推定部14と、複数の入力から推定した複数の秒数分布PDを統合する統合部16と、統合処理により得られた新たな分布(以下、「統合分布」という。)から確率が最大となる秒数を特定する最大点特定部18と、特定された秒数を造影時相に対応させて造影時相を判別する判別部38とを含む。判別部38により変換された造影時相が最終結果として出力される。
なお、図7では、3枚の異なる画像IMが入力される場合の処理の流れを示すために、3つの秒数分布推定部14が図示されているが、各画像IMが入力される秒数分布推定部14は同じ(単一の)処理部である。
図8は、秒数分布推定部14における処理の例1を示す説明図である。秒数分布推定部14は、回帰推定部22と、変数変換部24とを含む。回帰推定部22は、画像IMの入力を受けて、秒数の推定値Oaと、推定値Oaの確からしさ(確信度)を示すスコア値Obとを出力するように、機械学習によって訓練された学習済みモデルを含む。回帰推定部22に適用される回帰モデルとしての学習済みモデルは、例えば、畳み込みニューラルネットワークを用いて構成される。回帰推定部22から出力される秒数の推定値Oaの数値範囲は「-∞<Oa<∞」であってよく、確からしさのスコア値Obの数値範囲は「-∞<Ob<∞」であってよい。なお、回帰モデルは、CNNに限らず、各種の機械学習モデルを適用し得る。
変数変換部24は、秒数の推定値Oaと、その確からしさのスコア値Obとのそれぞれを次式(1)、(2)に従って変数変換し、確率分布モデルのパラメータμ及びbを生成する。
μ=Oa (1)
b=1/log(1+exp(-Ob)) (2)
μ=Oa (1)
b=1/log(1+exp(-Ob)) (2)
式(2)の関数は、確からしさのスコア値Obを正の領域の値bへ変換する写像の一例である。図9は、式(2)の変数変換に用いられる関数y=1/log(1+exp(-x))のグラフである。パラメータμは本開示における「第1のパラメータ」の一例である。パラメータbは本開示における「第2のパラメータ」の一例である。
第3実施形態では、秒数分布の確率分布モデルとしてラプラス分布が適用される。ラプラス分布は、次式(3)の関数で表される。

確からしさのスコア値Obを正の値bに変換する理由は、秒数分布の確率分布モデルとしてラプラス分布を適用することに関係している。仮に、パラメータbが負の値(b<0)であると、ラプラス分布が確率分布として成り立たないため、パラメータbが正の値(b>0)であることを保証する必要があるからである。
図10は、秒数分布推定部14によって推定されたパラメータμ及びbにより推定される秒数分布のグラフの例を示す。なお、図中の破線GTで示す位置は、正しい秒数(正解の秒数)に対応している。入力された画像IMから推定値Oaとその確からしさのスコア値Obとの組を推定することは、実質的に秒数分布を推定することに相当する。秒数の推定値Oaは本開示における「確率変数」の一例である。
図11は、統合部16と最大点特定部18における処理の例を示す説明図である。ここでは説明を簡単にするために、秒数分布推定部14によって推定された2つの秒数分布を統合する例を示すが、3つ以上の秒数分布を統合する場合も同様である。
図11中の左上に示すグラフGD1は、画像IM1(図11中不図示)の入力に対して秒数分布推定部14によって推定されたパラメータμ1及びb1により表される秒数分布(確率分布P1)の例である。パラメータμ1は「第1の経過時間」の一例であり、パラメータb1は「第1の経過時間の第1の確からしさ」の一例であり、確率分布P1は「第1の確率分布モデル」の一例である。統合部16は、推定された秒数分布の対数を取り、対数確率密度に変換し、複数の対数確率密度の和をとって統合する。これは、同秒数での確率の積を求めることに対応している。
図11中のグラフGL1は、確率分布P1の対数を取ることで得られる対数確率密度logP1の例である。図11中の左下に示すグラフGD2は、画像IM2(図11中不図示)の入力に対して秒数分布推定部14によって推定されたパラメータμ2及びb2により表される秒数分布(確率分布P2)の例である。パラメータμ2は「第2の経過時間」の一例であり、パラメータb2は「第2の経過時間の第2の確からしさ」の一例であり、確率分布P2は「第2の確率分布モデル」の一例である。また、パラメータμ1及びμ2は「複数の経過時間」の一例であり、パラメータb1及びb2は「複数の確からしさ」の一例であり、確率分布P1及びP2は「複数の確率分布モデル」の一例である。図11中のグラフGL2は、確率分布P2の対数を取ることで得られる対数確率密度の例である。
図11中の最右に示すグラフGLSは、対数確率密度logP1と対数確率密度logP2とを統合した同時対数確率密度の例であり、「第1の確率分布モデル及び第2の確率分布モデルの積」の一例である。グラフGLSに示す分布は本開示における「統合分布」の一例である。
最大点特定部18は、統合した対数確率密度から対数確率が最大になるパラメータμの値xを特定する。最大点特定部18における処理は、次の式(4)で表すことができる。

式(4)の2段目に記載された等号の右辺に示されたarg minの対象関数(Σ以降の部分)は、後述の機械学習における訓練時のロス関数に相当している。また、3段目に記載された等号の右辺は重み付きメジアンの式に相当している。統合の際の重みに相当するパラメータbiは、回帰推定部22の出力に応じて動的に変化する。
図11のグラフGLSに示す統合された対数確率密度の場合、同時対数確率が最大になる入力値(最大点)はμ1であり、μ1が最終的な推定結果(最終結果)として選択される。なお、μ1は、入力された複数のスライス画像のうちの画像IM1での推定結果である。図11では、秒数分布から対数確率密度に変換して演算を行っているが、要するに、異なる複数の入力から推定される複数の秒数分布(確率分布)の同時確率を考え、同時確率が最大になる値を最終結果として導き出す処理を行っている。
確率分布モデルとしてラプラス分布を採用することにより、統合分布(同時確率分布)が重み付きメジアンの形になるため、複数の推定結果の一部がアーチファクトなどによって大きく外れた値となった場合に、その外れ値の影響を抑制して精度の高い推定値を得ることができる。
《機械学習方法の例1》
図12は、秒数分布推定部14に適用される回帰モデルを生成するための機械学習方法の例を概略的に説明図である。機械学習に用いる訓練データは、入力用のデータとしての画像TIMと、その入力に対応する正解のデータ(教師信号t)とを含む。画像TIMは、3次元CTデータの画像シリーズを構成するスライス画像であってよく、教師信号tはスライス画像が属するシリーズを撮影した際の造影剤注入からの秒数(グラウンドトゥルース)を示す値であってよい。
図12は、秒数分布推定部14に適用される回帰モデルを生成するための機械学習方法の例を概略的に説明図である。機械学習に用いる訓練データは、入力用のデータとしての画像TIMと、その入力に対応する正解のデータ(教師信号t)とを含む。画像TIMは、3次元CTデータの画像シリーズを構成するスライス画像であってよく、教師信号tはスライス画像が属するシリーズを撮影した際の造影剤注入からの秒数(グラウンドトゥルース)を示す値であってよい。
例えば、画像シリーズの全てのスライスについて、それぞれ対応する教師信号tが紐付けされて複数の訓練データが生成される。「紐付け」は、対応付け、あるいは関連付けと言い換えてもよい。「訓練」は「学習」と同義である。同じ画像シリーズのスライスに対しては、同じ教師信号tが紐付けされてよい。つまり、画像シリーズの単位で教師信号tが紐付けされてもよい。複数の画像シリーズについて同様に、それぞれのスライスに、対応する教師信号tが紐付けされて、複数の訓練データが生成される。こうして生成された複数の訓練データの集合が訓練データセットとして用いられる。
学習モデル20(「第2の学習モデル」の一例)は、CNNを用いて構成される。学習モデル20は、変数変換部24と組み合わせて使用される。なお、変数変換部24は学習モデル20に一体的に組み込まれていてもよい。
訓練データセットから読み出された画像TIMが学習モデル20に入力されると、学習モデル20から秒数の推定値Oaと、その確からしさのスコア値Obとが出力される。推定値Oaとスコア値Obとは変数変換部24により、確率分布モデルのパラメータμとパラメータbとに変数変換される。
訓練時に使用するロス関数Lは次式(5)で定義される。

図12の下段に示すように、同じ画像シリーズの全てのスライスについて、ロス(損失)の和を取ると、次式(6)となる。

添字のiは各スライスを識別するインデックスである。式(6)で表されるロスの和を用いて誤差逆伝播法を適用し、通常のCNNの学習と同様に、確率的勾配降下法を使って学習モデル20を訓練する(学習モデル20のパラメータを更新する)。式(6)によって計算されるロスの和は本開示における「ロス関数の計算結果」の一例である。複数の画像シリーズを含む複数の訓練データを用いて学習モデル20の訓練を行うことにより、学習モデル20のパラメータが適性化され、学習済みモデルが得られる。こうして得られた学習済みモデルが秒数分布推定部14の回帰モデルとして適用される。
図13は、訓練時に使用するロス関数の説明図である。ロス関数は負の対数尤度となっており、回帰推定に使う式を学習によって直接最適化するものとなっている。学習により教師信号tの秒数での対数尤度を最大化する。式(5)に示すロス関数のパラメータμについてのグラフは、図13中のグラフGRμとなる。グラフGRμはパラメータμに対する勾配が安定している。
一方で、式(5)に示すロス関数のパラメータbについてのグラフは、図13中のグラフGRbとなる。グラフGRbはパラメータbに対する勾配が不安定である。bの値が小さい領域では1/bが支配的であり、bの値が大きい領域ではlogbが支配的となる。
勾配が不安定なグラフGRbは、パラメータbをb=1/softplus(-Ob)などの関数を用いて変数変換することにより、グラフGRObに変換される。ソフトプラス(softplus)関数は、softplus(x)=log(1+exp(x))で定義される。パラメータbの変数変換に用いる関数は、x→-∞において-1/xに漸近し、x→∞においてexp(x)に漸近する関数であり、このような関数を用いて勾配の不安定性を打ち消すことができる。
図12、及び図13を用いて説明した学習モデル20の機械学習方法は、本開示における「学習済みモデルの生成方法」の一例である。
《造影状態判別装置10の機能的構成》
図14は、第3実施形態に係る造影状態判別装置10の処理機能の概要を示す機能ブロック図である。造影状態判別装置10のプロセッサ102は、メモリ104Aに記憶された造影状態判別プログラム130を実行することにより、データ取得部12、秒数分布推定部14、統合部16、最大点特定部18、判別部38、及び出力部19として機能する。
図14は、第3実施形態に係る造影状態判別装置10の処理機能の概要を示す機能ブロック図である。造影状態判別装置10のプロセッサ102は、メモリ104Aに記憶された造影状態判別プログラム130を実行することにより、データ取得部12、秒数分布推定部14、統合部16、最大点特定部18、判別部38、及び出力部19として機能する。
データ取得部12は、処理対象のデータの入力を受け付ける。図14の例では、データ取得部12は、CTデータからサンプリングされたスライス画像である画像IMiを取得する。添字iは、複数の画像を識別するインデックス番号を表しており、図14では、i=1からnまでの異なるn枚の画像が入力され得ることを表している。nは2以上の整数であってよい。データ取得部12は、CTデータから等間隔にスライス画像を切り出す処理を実行してもよいし、不図示の処理部などによって予めサンプリングされたスライス画像を取得してもよい。
データ取得部12を介して取り込まれた画像IMiは、秒数分布推定部14の回帰推定部22に入力される。回帰推定部22は、入力された画像IMiのそれぞれから秒数の推定値Oaとその確からしさを示すスコア値Obとの組を出力する。
回帰推定部22から出力された推定値Oaは、変数変換部24において確率分布モデルのパラメータμiに変換され、回帰推定部22から出力された確からしさのスコア値Obは、変数変換部24において確率分布モデルのパラメータbiに変換される。これら2つのパラメータμi、biにより、秒数の確率分布Piが推定される。
同じシリーズ内の複数の画像IMi(i=1~n)を入力することにより、画像IMiごとに推定値Oaとスコア値Obとの組が推定され、パラメータμi、biの組に変換されて、秒数の確率分布Piが推定される。各画像IMiから推定される複数組の推定値Oaとスコア値Obとは本開示における「複数組の推定結果」の一例である。
統合部16は、複数の画像IMiの入力により得られた複数の確率分布Piを統合する処理を行う。図14では、対数変換部26において、確率分布Piの対数を取り、対数確率密度logPiに変換し、統合分布生成部28にて、対数確率密度logPiの総和を計算することにより、統合分布を得る。
最大点特定部18は、統合分布から確率が最大となる秒数の値(最大点)を特定し、特定した秒数の値を出力する。なお、最大点特定部18は統合部16の中に組み込まれた構成であってもよい。
判別部38は、最大点特定部18が特定した秒数の値から造影状態を判別する。判別部38は、変換テーブル38Aを含む。変換テーブル38Aは、コンピュータ可読媒体104に記憶されている。変換テーブル38Aは、造影剤の注入開始からの経過時間と造影時相とが対応付けられている。例えば、肝臓造影撮影の場合、変換テーブル38Aには、造影剤注入開始から50秒未満は動脈相、50秒以上120秒未満は門脈相、120秒以上は平衡相がそれぞれ対応付けられている。判別部38は、変換テーブル38Aを用いて造影状態を判別する。
複数の画像から秒数を推定し、その平均を最終結果とすると、推定に適さない画像から出力された秒数で結果が悪化する場合があった。第3実施形態によれば、秒数とともに確信度を出して確信度に応じた重みづけを行うことで、推定の外れ値の影響を受け難く、ロバストになる。
《第4実施形態》
第3実施形態では秒数分布の確率分布モデルとしてラプラス分布を用いたが、これに限らず、他の確率分布モデルを適用してもよい。第4実施形態では、ラプラス分布の代わりに、ガウス分布を用いる例を説明する。第4実施形態では、秒数分布推定部14と統合部16と最大点特定部18とのそれぞれの処理部における処理内容が第3実施形態と異なる。
第3実施形態では秒数分布の確率分布モデルとしてラプラス分布を用いたが、これに限らず、他の確率分布モデルを適用してもよい。第4実施形態では、ラプラス分布の代わりに、ガウス分布を用いる例を説明する。第4実施形態では、秒数分布推定部14と統合部16と最大点特定部18とのそれぞれの処理部における処理内容が第3実施形態と異なる。
図15は、第4実施形態に係る造影状態判別装置10の秒数分布推定部14における処理の例2を示す説明図である。図8で説明した処理の代わりに、図15の処理が適用される。
第4実施形態における変数変換部24は、確からしさのスコア値Obを、式(2)の代わりに、次式(7)を用いてパラメータσ2に変換する。
σ2=1/log(1+exp(-Ob)) (7)
σ2=1/log(1+exp(-Ob)) (7)
σ2は確からしさの役割を果たす。σ2は分散、σは標準偏差に相当する。
ガウス分布は、次式(8)の関数で表される。

スコア値Obを正の値(σ2)に変換する理由は、第3実施形態と同様である。パラメータσ2が負の値であると、ガウス分布が確率分布として成り立たないため、パラメータσ2が正の値(σ2>0)であることを保証する必要があるからである。
図16は、秒数分布推定部14によって推定されたパラメータμ及びσ2により推定される秒数分布のグラフの例を示す。
図17は、第4実施形態に係る造影状態判別装置10の統合部16と最大点特定部18とにおける処理の例を示す説明図である。ここでは、秒数分布推定部14によって推定された2つの秒数分布を統合する例を示す。
図17中の左上に示すグラフGD1gは、図15の秒数分布推定部14によって推定されたパラメータμ1及びσ2
1により表される秒数分布(確率分布P1)の例である。統合部16は、推定された秒数分布の対数を取り、対数確率密度に変換し、複数の対数確率密度の和をとって統合する。これは、同秒数での確率の積を求めることに対応している。
図17中のグラフGL1gは、確率分布P1の対数を取ることで得られる対数確率密度logP1の例である。図17中の左下に示すグラフGD2gは、秒数分布推定部14によって推定されたパラメータμ2及びσ2
2により表される秒数分布(確率分布P2)の例である。図17中のグラフGL2gは、確率分布P2の対数を取ることで得られる対数確率密度の例である。
図17中の最右に示すグラフGLSgは、対数確率密度logP1と対数確率密度logP2とを統合した同時対数確率密度の例である。
最大点特定部18は、統合した同時対数確率密度から対数確率が最大になる値xを特定する。最大点特定部18における処理は、次式(9)で表すことができる。

式(9)の2段目に記載された等号の右辺に示されたarg minの対象関数(Σ以降の部分)は、後述の機械学習における訓練時のロス関数に相当している。また、3段目に記載された等号の右辺は重み付き平均の式に相当している。
図17のグラフGLSgに示す統合された対数確率密度の場合、対数確率が最大になる入力値(最大点)xが最終的な推定結果(最終結果)として選択される。
《機械学習方法の例2》
図18は、第4実施形態における秒数分布推定部14に適用される回帰モデルを生成するための機械学習方法の例を概略的に示す説明図である。学習に用いる訓練データは、第3実施形態と同様であってよい。図18について、図12と異なる点を説明する。
図18は、第4実施形態における秒数分布推定部14に適用される回帰モデルを生成するための機械学習方法の例を概略的に示す説明図である。学習に用いる訓練データは、第3実施形態と同様であってよい。図18について、図12と異なる点を説明する。
訓練データセットから読み出された画像TIMが学習モデル20に入力されると、学習モデル20から秒数の推定値Oaと、その確からしさのスコア値Obとが出力される。推定値Oaと確からしさのスコア値Obとは変数変換部24により、確率分布モデルのパラメータμとσ2とに変数変換される。
訓練時のロス関数Lは次式(10)で定義される。

図15の下段に示すように、同じ画像シリーズの全てのスライスについて、ロス(損失)の和を取ると、次式(11)となる。

式(11)で表されるロスの和を用いて誤差逆伝播法を適用し、通常のCNNの学習と同様に、確率的勾配降下法を使って、学習モデル20を訓練する。複数の画像シリーズを含む複数の訓練データを用いて学習モデル20の訓練を行うことにより、学習モデル20のパラメータが適性化され、学習済みモデルが得られる。こうして得られた学習済みモデルが秒数分布推定部14に適用される。
《変形例1》
第1実施形態~第4実施形態では、3次元のCTデータからスライスを等間隔に切り出したスライス画像(断層画像)である画像IM1、IM2、及びIM3を入力に用いたが、処理の対象とする画像はこれに限らない。例えば、図19に示すように、画像IM1(「第1のスライス画像」の一例)の情報を含む2次元画像IM11(「第1の2次元画像」の一例)、画像IM2(「第2のスライス画像」の一例)の情報を含む2次元画像IM12(「第2の2次元画像」の一例)、及び画像IM3の情報を含む2次元画像IM13であればよい。2次元画像は、断層画像TGimgそのものでもよいし、等間隔に構成されたMIP(Maximum Intensity Projection)画像MIPimg、あるいは複数のスライス画像から生成される平均画像AVEimgなどであってもよい。
第1実施形態~第4実施形態では、3次元のCTデータからスライスを等間隔に切り出したスライス画像(断層画像)である画像IM1、IM2、及びIM3を入力に用いたが、処理の対象とする画像はこれに限らない。例えば、図19に示すように、画像IM1(「第1のスライス画像」の一例)の情報を含む2次元画像IM11(「第1の2次元画像」の一例)、画像IM2(「第2のスライス画像」の一例)の情報を含む2次元画像IM12(「第2の2次元画像」の一例)、及び画像IM3の情報を含む2次元画像IM13であればよい。2次元画像は、断層画像TGimgそのものでもよいし、等間隔に構成されたMIP(Maximum Intensity Projection)画像MIPimg、あるいは複数のスライス画像から生成される平均画像AVEimgなどであってもよい。
《変形例2》
時相推定部30、秒数推定部34、及び秒数分布推定部14への入力は、複数種のデータ要素の組み合わせであってもよい。例えば、図20に示すように、同一シリーズのCTデータの部分画像であるスライス画像、MIP画像、及び平均画像のうち少なくとも1種類以上を入力として用いることができ、これら複数の画像種の組み合わせを時相推定部30、秒数推定部34、及び秒数分布推定部14に入力してもよい。例えば、平均画像とMIP画像との組み合わせを秒数分布推定部14に入力して秒数分布を推定してもよい。MIP画像、及び平均画像は、3次元のCTデータの部分画像から生成される生成画像の一例である。
時相推定部30、秒数推定部34、及び秒数分布推定部14への入力は、複数種のデータ要素の組み合わせであってもよい。例えば、図20に示すように、同一シリーズのCTデータの部分画像であるスライス画像、MIP画像、及び平均画像のうち少なくとも1種類以上を入力として用いることができ、これら複数の画像種の組み合わせを時相推定部30、秒数推定部34、及び秒数分布推定部14に入力してもよい。例えば、平均画像とMIP画像との組み合わせを秒数分布推定部14に入力して秒数分布を推定してもよい。MIP画像、及び平均画像は、3次元のCTデータの部分画像から生成される生成画像の一例である。
《医療情報システムの構成例》
図21は、医療画像処理装置220を含む医療情報システム200の構成例を示すブロック図である。第1実施形態~第4実施形態として説明した造影状態判別装置10は、例えば、医療画像処理装置220に組み込まれる。医療情報システム200は、病院などの医療機関に構築されるコンピュータネットワークである。医療情報システム200は、医療画像を撮影するモダリティ230と、DICOMサーバ240と、医療画像処理装置220と、電子カルテシステム244と、ビューワ端末246とを含み、これらの要素は通信回線248を介して接続される。通信回線248は、医療機関内の構内通信回線であってよい。また通信回線248の一部は、広域通信回線であってもよい。
図21は、医療画像処理装置220を含む医療情報システム200の構成例を示すブロック図である。第1実施形態~第4実施形態として説明した造影状態判別装置10は、例えば、医療画像処理装置220に組み込まれる。医療情報システム200は、病院などの医療機関に構築されるコンピュータネットワークである。医療情報システム200は、医療画像を撮影するモダリティ230と、DICOMサーバ240と、医療画像処理装置220と、電子カルテシステム244と、ビューワ端末246とを含み、これらの要素は通信回線248を介して接続される。通信回線248は、医療機関内の構内通信回線であってよい。また通信回線248の一部は、広域通信回線であってもよい。
モダリティ230の具体例としては、CT装置231、MRI(Magnetic Resonance Imaging)装置232、超音波診断装置233、PET(Positron Emission Tomography)装置234、X線診断装置235、X線透視診断装置236、及び内視鏡装置237等が挙げられる。通信回線248に接続されるモダリティ230の種類は、医療機関ごとに様々な組み合わせがありうる。
DICOMサーバ240は、DICOMの仕様にて動作するサーバである。DICOMサーバ240は、モダリティ230を用いて撮影された画像を含む各種データを保存、及び管理するコンピュータであり、大容量外部記憶装置、及びデータベース管理用プログラムを備えている。DICOMサーバ240は、通信回線248を介して他の装置と通信を行い、画像データを含む各種データを送受信する。DICOMサーバ240は、モダリティ230によって生成された画像データその他の含む各種データを通信回線248経由で受信し、大容量外部記憶装置等の記録媒体に保存して管理する。なお、画像データの格納形式、及び通信回線248経由での各装置間の通信は、DICOMのプロトコルに基づいている。
医療画像処理装置220は、通信回線248を介してDICOMサーバ240等からデータを取得することができる。医療画像処理装置220は、モダリティ230により撮影された医療画像について画像解析その他の各種処理を行う。医療画像処理装置220は、造影状態判別装置10の処理機能の他、例えば、画像から病変領域などを認識する処理、病名などの分類を特定する処理、あるいは、臓器等の領域を認識するセグメンテーション処理など、様々なコンピュータ支援診断(Computer Aided Diagnosis, Computer Aided Detection :CAD)等の解析処理を行うように構成されてもよい。また、医療画像処理装置220は、処理結果をDICOMサーバ240、及びビューワ端末246に送ることができる。なお、医療画像処理装置220の処理機能は、DICOMサーバ240に搭載されてもよいし、ビューワ端末246に搭載されてもよい。
DICOMサーバ240のデータベースに保存された各種データ、並びに医療画像処理装置220により生成された処理結果を含む様々な情報は、ビューワ端末246に表示させることができる。
ビューワ端末246は、PACSCS(Picture Archiving and Communication Systems)ビューワ、あるいはDICOMビューワと呼ばれる画像閲覧用の端末である。通信回線248には複数のビューワ端末246が接続され得る。ビューワ端末246の形態は特に限定されず、パーソナルコンピュータであってもよいし、ワークステーションであってもよく、また、タブレット端末などであってもよい。
《コンピュータを動作させるプログラムについて》
造影状態判別装置10における処理機能のコンピュータに実現させるプログラムを、光ディスク、磁気ディスク、もしくは、半導体メモリその他の有体物たる非一時的な情報記憶媒体であるコンピュータ可読媒体に記録し、この情報記憶媒体を通じてプログラムを提供することが可能である。
造影状態判別装置10における処理機能のコンピュータに実現させるプログラムを、光ディスク、磁気ディスク、もしくは、半導体メモリその他の有体物たる非一時的な情報記憶媒体であるコンピュータ可読媒体に記録し、この情報記憶媒体を通じてプログラムを提供することが可能である。
また、このような有体物たる非一時的なコンピュータ可読媒体にプログラムを記憶させて提供する態様に代えて、インターネットなどの電気通信回線を利用してプログラム信号をダウンロードサービスとして提供することも可能である。
さらに、造影状態判別装置10における処理機能の一部又は全部をクラウドコンピューティングによって実現してもよく、また、SasS(Software as a Service)サービスとして提供することも可能である。
《各処理部のハードウェア構成について》
造影状態判別装置10におけるデータ取得部12、秒数分布推定部14、統合部16、最大点特定部18、出力部19、回帰推定部22、変数変換部24、対数変換部26、統合分布生成部28、時相推定部30、及び統合部32などの各種の処理を実行する処理部(processing unit)のハードウェア的な構造は、例えば、次に示すような各種のプロセッサ(processor)である。
造影状態判別装置10におけるデータ取得部12、秒数分布推定部14、統合部16、最大点特定部18、出力部19、回帰推定部22、変数変換部24、対数変換部26、統合分布生成部28、時相推定部30、及び統合部32などの各種の処理を実行する処理部(processing unit)のハードウェア的な構造は、例えば、次に示すような各種のプロセッサ(processor)である。
各種のプロセッサには、プログラムを実行して各種の処理部として機能する汎用的なプロセッサであるCPU、画像処理に特化したプロセッサであるGPU、FPGA(Field Programmable Gate Array)などの製造後に回路構成を変更可能なプロセッサであるプログラマブルロジックデバイス(Programmable Logic Device:PLD)、ASIC(Application Specific Integrated Circuit)などの特定の処理を実行させるために専用に設計された回路構成を有するプロセッサである専用電気回路などが含まれる。
1つの処理部は、これら各種のプロセッサのうちの1つで構成されていてもよいし、同種又は異種の2つ以上のプロセッサで構成されてもよい。例えば、1つの処理部は、複数のFPGA、あるいは、CPUとFPGAの組み合わせ、又はCPUとGPUの組み合わせによって構成されてもよい。また、複数の処理部を1つのプロセッサで構成してもよい。複数の処理部を1つのプロセッサで構成する例としては、第一に、クライアント及びサーバなどのコンピュータに代表されるように、1つ以上のCPUとソフトウェアの組み合わせで1つのプロセッサを構成し、このプロセッサが複数の処理部として機能する形態がある。第二に、システムオンチップ(System On Chip:SoC)などに代表されるように、複数の処理部を含むシステム全体の機能を1つのIC(Integrated Circuit)チップで実現するプロセッサを使用する形態がある。このように、各種の処理部は、ハードウェア的な構造として、上記各種のプロセッサを1つ以上用いて構成される。
さらに、これらの各種のプロセッサのハードウェア的な構造は、より具体的には、半導体素子などの回路素子を組み合わせた電気回路(circuitry)である。
《その他》
本開示は上述した実施形態に限定されるものではなく、本開示の技術的思想の趣旨を逸脱しない範囲で種々の変形が可能である。
本開示は上述した実施形態に限定されるものではなく、本開示の技術的思想の趣旨を逸脱しない範囲で種々の変形が可能である。
10 造影状態判別装置
12 データ取得部
14 秒数分布推定部
16 統合部
18 最大点特定部
19 出力部
20 学習モデル
22 回帰推定部
24 変数変換部
26 対数変換部
28 統合分布生成部
30 時相推定部
30A 学習済みモデル
32 統合部
34 秒数推定部
34A 学習済みモデル
36 統合部
38 判別部
38A 変換テーブル
102 プロセッサ
104 コンピュータ可読媒体
104A メモリ
104B ストレージ
106 通信インターフェース
108 入出力インターフェース
110 バス
114 入力装置
116 表示装置
130 造影状態判別プログラム
200 医療情報システム
220 医療画像処理装置
230 モダリティ
231 CT装置
232 MRI装置
233 超音波診断装置
234 PET装置
235 X線診断装置
236 X線透視診断装置
237 内視鏡装置
240 DICOMサーバ
244 電子カルテシステム
246 ビューワ端末
248 通信回線
GD1 グラフ
GD1g グラフ
GD2 グラフ
GD2g グラフ
GL1 グラフ
GL1g グラフ
GL2 グラフ
GL2g グラフ
GLS グラフ
GLSg グラフ
GRb グラフ
GRμ グラフ
GROb グラフ
IM 画像
IM1、IM2、IM3、IMi、IMn 画像
TIM 画像
IM11、IM12、IM13 2次元画像
Oa 推定値
Ob スコア値
P1、P2、Pi 確率分布
PD 秒数分布
PS1、PS2、PS3、PS11、PS12、PS13、PS14 推定結果
SB 患者
SBP1、SBP2、SBP3 位置
S1~S5 造影状態判別方法のステップ
Claims (15)
- 少なくとも1つのプロセッサと、
前記少なくとも1つのプロセッサに実行させるための命令を記憶する少なくとも1つのメモリと、
を備え、
前記少なくとも1つのプロセッサは、
被検体への造影剤の注入前又は注入後に撮影された第1の画像シリーズから前記被検体のそれぞれ異なる位置のスライス画像の情報をそれぞれ含む複数の2次元画像を取得し、
前記複数の2次元画像の各2次元画像から造影状態に関する指標値をそれぞれ推定し、
前記それぞれ推定した複数の指標値に基づいて前記第1の画像シリーズの造影状態を判別する、
造影状態判別装置。 - 前記指標値は、複数の造影状態のうちの各造影状態にそれぞれ属する確からしさであり、
前記少なくとも1つのプロセッサは、
前記複数の指標値を統合した指標値を導出し、
前記統合した指標値に基づいて前記第1の画像シリーズの造影状態を判別する、
請求項1に記載の造影状態判別装置。 - 被検体への造影剤の注入前又は注入後に撮影された画像シリーズに基づく2次元画像が入力されると複数の造影状態のうちの各造影状態にそれぞれ属する確からしさを出力する第1の学習モデルを備え、
前記少なくとも1つのプロセッサは、
前記複数の2次元画像を前記第1の学習モデルに入力して前記複数の指標値を推定する、
請求項2に記載の造影状態判別装置。 - 前記指標値は、前記被検体に前記造影剤を注入してからの経過時間であり、
前記少なくとも1つのプロセッサは、
前記複数の指標値である複数の経過時間を統合した経過時間を導出し、
前記統合した経過時間に基づいて前記第1の画像シリーズの造影状態を判別する、
請求項1に記載の造影状態判別装置。 - 前記指標値は、前記被検体に前記造影剤を注入してからの経過時間及び前記経過時間の確からしさであり、
前記少なくとも1つのプロセッサは、
前記複数の指標値である複数の確からしさに基づいて前記複数の指標値である複数の経過時間を統合した経過時間を導出し、
前記統合した経過時間に基づいて前記第1の画像シリーズの造影状態を判別する、
請求項1に記載の造影状態判別装置。 - 前記少なくとも1つのプロセッサは、
前記経過時間及び前記確からしさをそれぞれパラメータとした複数の確率分布モデルの積に基づいて前記統合した経過時間を導出する、
請求項5に記載の造影状態判別装置。 - 被検体への造影剤の注入前又は注入後に撮影された画像シリーズに基づく2次元画像が入力されると前記被検体に前記造影剤を注入してからの経過時間及び前記経過時間の確からしさを出力する第2の学習モデルを備え、
前記少なくとも1つのプロセッサは、
前記複数の2次元画像を前記第2の学習モデルに入力して前記複数の経過時間及び前記複数の確からしさを推定する、
請求項5又は6に記載の造影状態判別装置。 - 前記被検体に前記造影剤を注入してからの経過時間及び前記造影状態が対応付けられた変換テーブルを備え、
前記少なくとも1つのプロセッサは、
前記統合した経過時間及び前記変換テーブルに基づいて前記第1の画像シリーズの造影状態を判別する、
請求項4から6のいずれか1項に記載の造影状態判別装置。 - 前記被検体に前記造影剤を注入してからの経過時間及び前記造影状態が対応付けられた変換テーブルを備え、
前記少なくとも1つのプロセッサは、
前記複数の指標値として前記被検体に前記造影剤を注入してからの複数の経過時間を推定し、
前記複数の経過時間及び前記変換テーブルに基づいて前記第1の画像シリーズの複数の造影状態を判別し、
前記複数の造影状態に基づいて前記第1の画像シリーズの造影状態を判別する、
請求項1に記載の造影状態判別装置。 - 前記2次元画像は、前記スライス画像、複数の前記スライス画像のMIP(Maximum Intensity Projection)画像、及び複数の前記スライス画像の平均画像のうちの少なくとも1つである、
請求項1から9のいずれか1項に記載の造影状態判別装置。 - 前記第1の画像シリーズは、前記被検体の肝臓を含む3次元画像であり、
前記造影状態は、非造影、動脈相、門脈相、及び平衡相のうちの少なくとも1つを含む、
請求項1から10のいずれか1項に記載の造影状態判別装置。 - 前記第1の画像シリーズは、前記被検体の腎臓を含む3次元画像であり、
前記造影状態は、非造影、皮髄相、実質相、及び排泄相のうちの少なくとも1つを含む、
請求項1から10のいずれか1項に記載の造影状態判別装置。 - 被検体への造影剤の注入前又は注入後に撮影された第1の画像シリーズから前記被検体のそれぞれ異なる位置のスライス画像の情報をそれぞれ含む複数の2次元画像を取得する工程と、
前記複数の2次元画像の各2次元画像から造影状態に関する指標値をそれぞれ推定する工程と、
前記それぞれ推定した複数の指標値に基づいて前記第1の画像シリーズの造影状態を判別する工程と、
を備える造影状態判別方法。 - 請求項13に記載の造影状態判別方法をコンピュータに実行させるためのプログラム。
- 非一時的かつコンピュータ読取可能な記録媒体であって、請求項14に記載のプログラムが記録された記録媒体。
Priority Applications (1)
| Application Number | Priority Date | Filing Date | Title |
|---|---|---|---|
| JP2023545113A JPWO2023032437A1 (ja) | 2021-08-31 | 2022-06-24 |
Applications Claiming Priority (2)
| Application Number | Priority Date | Filing Date | Title |
|---|---|---|---|
| JP2021-141457 | 2021-08-31 | ||
| JP2021141457 | 2021-08-31 |
Publications (1)
| Publication Number | Publication Date |
|---|---|
| WO2023032437A1 true WO2023032437A1 (ja) | 2023-03-09 |
Family
ID=85412052
Family Applications (1)
| Application Number | Title | Priority Date | Filing Date |
|---|---|---|---|
| PCT/JP2022/025287 WO2023032437A1 (ja) | 2021-08-31 | 2022-06-24 | 造影状態判別装置、造影状態判別方法、及びプログラム |
Country Status (2)
| Country | Link |
|---|---|
| JP (1) | JPWO2023032437A1 (ja) |
| WO (1) | WO2023032437A1 (ja) |
Citations (3)
| Publication number | Priority date | Publication date | Assignee | Title |
|---|---|---|---|---|
| US20110002520A1 (en) * | 2009-07-01 | 2011-01-06 | Siemens Corporation | Method and System for Automatic Contrast Phase Classification |
| JP2017064370A (ja) * | 2015-09-29 | 2017-04-06 | キヤノン株式会社 | 画像処理装置、画像処理装置の制御方法およびプログラム |
| JP2020146455A (ja) * | 2019-03-06 | 2020-09-17 | キヤノンメディカルシステムズ株式会社 | 医用画像処理装置 |
-
2022
- 2022-06-24 JP JP2023545113A patent/JPWO2023032437A1/ja active Pending
- 2022-06-24 WO PCT/JP2022/025287 patent/WO2023032437A1/ja active Application Filing
Patent Citations (3)
| Publication number | Priority date | Publication date | Assignee | Title |
|---|---|---|---|---|
| US20110002520A1 (en) * | 2009-07-01 | 2011-01-06 | Siemens Corporation | Method and System for Automatic Contrast Phase Classification |
| JP2017064370A (ja) * | 2015-09-29 | 2017-04-06 | キヤノン株式会社 | 画像処理装置、画像処理装置の制御方法およびプログラム |
| JP2020146455A (ja) * | 2019-03-06 | 2020-09-17 | キヤノンメディカルシステムズ株式会社 | 医用画像処理装置 |
Non-Patent Citations (2)
| Title |
|---|
| DERCLE LAURENT; MA JINGCHEN; XIE CHUANMIAO; CHEN AI-PING; WANG DELING; LUK LYNDON; REVEL-MOUROZ PAUL; OTAL PHILIPPE; PERON JEAN-MA: "Using a single abdominal computed tomography image to differentiate five contrast-enhancement phases: A machine-learning algorithm for radiomics-based precision medicine", EUROPEAN JOURNAL OF RADIOLOGY., ELSEVIER SCIENCE., NL, vol. 125, 28 January 2020 (2020-01-28), NL , XP086089586, ISSN: 0720-048X, DOI: 10.1016/j.ejrad.2020.108850 * |
| LEE, SEONG-WHAN ; LI, STAN Z: "SAT 2015 18th International Conference, Austin, TX, USA, September 24-27, 2015", vol. 6893 Chap.21, 18 September 2011, SPRINGER , Berlin, Heidelberg , ISBN: 3540745491, article SOFKA MICHAL; WU DIJIA; SüHLING MICHAEL; LIU DAVID; TIETJEN CHRISTIAN; SOZA GRZEGORZ; ZHOU S. KEVIN: "Automatic Contrast Phase Estimation in CT Volumes", pages: 166 - 174, XP047463426, 032548, DOI: 10.1007/978-3-642-23626-6_21 * |
Also Published As
| Publication number | Publication date |
|---|---|
| JPWO2023032437A1 (ja) | 2023-03-09 |
Similar Documents
| Publication | Publication Date | Title |
|---|---|---|
| KR101898575B1 (ko) | 진행성 병변에 대한 미래 상태를 예측하는 방법 및 이를 이용한 장치 | |
| JP2022025095A (ja) | 機械学習を用いた医用イメージングの変換のためのシステムおよび方法 | |
| US11398304B2 (en) | Imaging and reporting combination in medical imaging | |
| JP7374202B2 (ja) | 機械学習システムおよび方法、統合サーバ、プログラムならびに推論モデルの作成方法 | |
| US20190095760A1 (en) | Learning assistance device, method of operating learning assistance device, learning assistance program, learning assistance system, and terminal device | |
| JP2019526869A (ja) | Cadシステム推薦に関する確信レベル指標を提供するためのcadシステムパーソナライゼーションの方法及び手段 | |
| KR102097743B1 (ko) | 인공지능 질환 판독 장치 및 방법 | |
| US20220237898A1 (en) | Machine learning system and method, integration server, information processing apparatus, program, and inference model creation method | |
| KR101919847B1 (ko) | 동일 피사체에 대하여 시간 간격을 두고 촬영된 영상 간에 동일 관심구역을 자동으로 검출하는 방법 및 이를 이용한 장치 | |
| US20220164661A1 (en) | Machine learning system and method, integration server, information processing apparatus, program, and inference model creation method | |
| JP2019115515A (ja) | 画像処理装置、画像処理方法、画像処理システムおよびプログラム | |
| US20180068436A1 (en) | Multiple algorithm lesion segmentation | |
| EP3648057A1 (en) | Determining malignancy of pulmonary nodules using deep learning | |
| WO2023032437A1 (ja) | 造影状態判別装置、造影状態判別方法、及びプログラム | |
| KR102222816B1 (ko) | 진행성 병변의 미래 영상을 생성하는 방법 및 이를 이용한 장치 | |
| JPWO2019208130A1 (ja) | 医療文書作成支援装置、方法およびプログラム、学習済みモデル、並びに学習装置、方法およびプログラム | |
| KR102556646B1 (ko) | 의료 영상 생성 방법 및 장치 | |
| WO2023032436A1 (ja) | 医用画像処理装置、医用画像処理方法及びプログラム | |
| US11244754B2 (en) | Artificial neural network combining sensory signal classification and image generation | |
| WO2021187483A1 (ja) | 文書作成支援装置、方法およびプログラム | |
| WO2023032438A1 (ja) | 回帰推定装置および方法、プログラム並びに学習済みモデルの生成方法 | |
| JP7413011B2 (ja) | 医用情報処理装置 | |
| JP7402248B2 (ja) | 深層神経網モデルの学習に用いられる学習データに基づいて対象データの品質パターンを変換する方法、装置およびプログラム | |
| CN114419375A (zh) | 图像分类方法、训练方法、装置、电子设备以及存储介质 | |
| EP3667674A1 (en) | Method and system for evaluating images of different patients, computer program and electronically readable storage medium |
Legal Events
| Date | Code | Title | Description |
|---|---|---|---|
| 121 | Ep: the epo has been informed by wipo that ep was designated in this application |
Ref document number: 22864025 Country of ref document: EP Kind code of ref document: A1 |
|
| WWE | Wipo information: entry into national phase |
Ref document number: 2023545113 Country of ref document: JP |
|
| NENP | Non-entry into the national phase |
Ref country code: DE |