WO2023008526A1 - 細胞画像解析方法 - Google Patents
細胞画像解析方法 Download PDFInfo
- Publication number
- WO2023008526A1 WO2023008526A1 PCT/JP2022/029117 JP2022029117W WO2023008526A1 WO 2023008526 A1 WO2023008526 A1 WO 2023008526A1 JP 2022029117 W JP2022029117 W JP 2022029117W WO 2023008526 A1 WO2023008526 A1 WO 2023008526A1
- Authority
- WO
- WIPO (PCT)
- Prior art keywords
- cell
- abnormal cell
- image
- area
- abnormal
- Prior art date
- Legal status (The legal status is an assumption and is not a legal conclusion. Google has not performed a legal analysis and makes no representation as to the accuracy of the status listed.)
- Ceased
Links
Images





Classifications
-
- C—CHEMISTRY; METALLURGY
- C12—BIOCHEMISTRY; BEER; SPIRITS; WINE; VINEGAR; MICROBIOLOGY; ENZYMOLOGY; MUTATION OR GENETIC ENGINEERING
- C12M—APPARATUS FOR ENZYMOLOGY OR MICROBIOLOGY; APPARATUS FOR CULTURING MICROORGANISMS FOR PRODUCING BIOMASS, FOR GROWING CELLS OR FOR OBTAINING FERMENTATION OR METABOLIC PRODUCTS, i.e. BIOREACTORS OR FERMENTERS
- C12M1/00—Apparatus for enzymology or microbiology
- C12M1/34—Measuring or testing with condition measuring or sensing means, e.g. colony counters
-
- C—CHEMISTRY; METALLURGY
- C12—BIOCHEMISTRY; BEER; SPIRITS; WINE; VINEGAR; MICROBIOLOGY; ENZYMOLOGY; MUTATION OR GENETIC ENGINEERING
- C12Q—MEASURING OR TESTING PROCESSES INVOLVING ENZYMES, NUCLEIC ACIDS OR MICROORGANISMS; COMPOSITIONS OR TEST PAPERS THEREFOR; PROCESSES OF PREPARING SUCH COMPOSITIONS; CONDITION-RESPONSIVE CONTROL IN MICROBIOLOGICAL OR ENZYMOLOGICAL PROCESSES
- C12Q1/00—Measuring or testing processes involving enzymes, nucleic acids or microorganisms; Compositions therefor; Processes of preparing such compositions
- C12Q1/02—Measuring or testing processes involving enzymes, nucleic acids or microorganisms; Compositions therefor; Processes of preparing such compositions involving viable microorganisms
- C12Q1/04—Determining presence or kind of microorganism; Use of selective media for testing antibiotics or bacteriocides; Compositions containing a chemical indicator therefor
-
- G—PHYSICS
- G06—COMPUTING OR CALCULATING; COUNTING
- G06T—IMAGE DATA PROCESSING OR GENERATION, IN GENERAL
- G06T7/00—Image analysis
Definitions
- This invention relates to a cell image analysis method, and more particularly to a cell analysis method for analyzing cells using a learned model.
- International Publication No. 2019/171546 discloses a cell image analysis method for analyzing a cell image captured by an imaging device.
- the cell image analysis method disclosed in WO2019/171546 classifies normal cell regions and abnormal cell regions using the analysis results of a trained model.
- International Publication No. 2019/171546 discloses a configuration for classifying each pixel of a cell image into a normal cell region and an abnormal cell region by segmentation processing to determine which category each pixel belongs to. is disclosed.
- the index value of each pixel determines whether the pixel is a normal cell area or an abnormal cell area. That is, in each pixel, if the index value indicating normal cells is greater than the index value indicating abnormal cells and the index value indicating background, the pixel is classified as a normal cell region. Also, in each pixel, when the index value indicating the abnormal cell is larger than the index value indicating the normal cell and the index value indicating the background, the pixel is classified as the abnormal cell region. Therefore, even a region classified as a normal cell region may contain abnormal cells.
- the present invention has been made to solve the above-described problems, and one object of the present invention is to provide a cell image analysis method capable of grasping regions suspected of being abnormal cells in a cell image. is to provide
- a cell image analysis method comprises the steps of: obtaining a cell image showing cells; obtaining an index value obtained by analyzing the above, and obtaining an abnormal cell area, which is an area in which a first index value indicating that the cell is an abnormal cell that is not a normal cell is larger than a predetermined criterion value among the index values and identifiably displaying the abnormal cell area.
- the first index value indicating that the cell is an abnormal cell that is not a normal cell is a region larger than a predetermined criterion value.
- a step of obtaining an abnormal cell area is provided.
- a region where the first index value is greater than the predetermined criterion value is acquired as an abnormal cell region, so even when the first index value is smaller than other index values, it can be acquired as an abnormal cell region.
- the step of identifiably displaying the abnormal cell area is included.
- the criterion value is set to be small, the acquired abnormal cell area is displayed in an identifiable manner as an area suspected of being an abnormal cell. can be displayed in As a result, it is possible to provide a cell image analysis method capable of grasping regions suspected of being abnormal cells in a cell image.
- FIG. 1 is a schematic diagram showing the overall configuration of a cell image analysis device according to one embodiment;
- FIG. It is a schematic diagram for explaining a cell image.
- FIG. 4 is a schematic diagram for explaining a method of learning a learning model and a method of analyzing a cell image using a first learned learning model according to one embodiment;
- FIG. 4 is a schematic diagram for explaining a configuration in which an image processing unit according to one embodiment generates a label image based on index values output by a trained model;
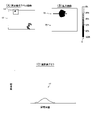
- FIG. 4A to FIG. 4C are schematic diagrams (A) to (C) for explaining an abnormal cell label image, an enlarged view of the abnormal cell label image, and a graph of pixel values.
- FIG. 7A to 7E are schematic diagrams (A) to (E) for explaining abnormal cell label images when the determination reference value is changed.
- FIG. FIG. 4 is a schematic diagram for explaining a configuration in which an image processing unit according to one embodiment acquires a first abnormal cell area and a second abnormal cell area;
- FIG. 4 is a schematic diagram for explaining a cell area and a non-cell area;
- 4A and 4B are schematic diagrams (A) and (B) for explaining a superimposed cell image generated by a superimposed cell image generation unit according to an embodiment;
- FIG. 7A and 7B are schematic diagrams for explaining a superimposed cell image according to a comparative example;
- 4 is a schematic diagram for explaining a configuration in which an image processing unit according to an embodiment selects an abnormal cell region to be displayed in an identifiable manner.
- 4 is a flow chart for explaining processing for displaying a superimposed cell image by the cell image analysis device according to one embodiment.
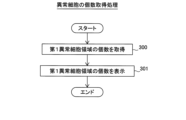
- 4 is a flow chart for explaining a process of acquiring and displaying the number of abnormal cells by the cell image analysis device according to one embodiment.
- 4 is a flow chart for explaining a process of acquiring and displaying the ratio of the area of the first abnormal cell region to the area of the second abnormal cell region by the cell image analysis device according to one embodiment.
- the cell image analysis apparatus 100 includes an image acquisition unit 1, a processor 2, a storage unit 3, a display unit 4, and an input reception unit 5, as shown in FIG.
- the image acquisition unit 1 is configured to acquire a cell image 10.
- the cell image 10 is an image showing cells 90 (see FIG. 2).
- the cell image 10 is an image of cultured cells cultured in a container.
- the image acquiring unit 1 is configured to acquire the cell image 10 from a device for capturing the cell image 10, such as a microscope 7 with an imaging device attached.
- Image acquisition unit 1 includes, for example, an input/output interface.
- the processor 2 is configured to analyze the acquired cell image 10.
- the processor 2 includes a CPU (Central Processing Unit), a ROM (Read Only Memory), a RAM (Random Access Memory), a GPU (Graphics Processing Unit), or an FPGA (Field-Programmable Gate Array) configured for image processing. contains.
- the processor 2 including a CPU as hardware includes, as functional blocks of software (programs), a control unit 2a, an image analysis unit 2b, an image processing unit 2c, and a superimposed cell image generation unit 2d. .
- the processor 2 functions as a control unit 2a, an image analysis unit 2b, an image processing unit 2c, and a superimposed cell image generation unit 2d.
- the control unit 2a, the image analysis unit 2b, the image processing unit 2c, and the superimposed cell image generation unit 2d may be individually configured by hardware by providing a dedicated processor (processing circuit).
- the control unit 2a is configured to control the cell image analysis device 100. Further, the control unit 2 a is configured to perform control to display the superimposed cell image 50 on the display unit 4 . Details of the superimposed cell image 50 will be described later.
- the image analysis unit 2b analyzes whether the cells 90 appearing in the cell image 10 are normal cells or abnormal cells. Specifically, the image analysis unit 2b analyzes the cell 90 shown in the cell image 10 using the trained model 6 that has learned the analysis of the cell 90 (see FIG. 2), and calculates the index value 21 (see FIG. 4). configured to obtain. Details of the index value 21, normal cells, and abnormal cells will be described later.
- the image processing unit 2c acquires the background labeled image 11 (see FIG. 4), the normal cell labeled image 12 (see FIG. 4), and the abnormal cell labeled image 13 (see FIG. 4) based on the index value 21. is configured to The details of the configuration in which the image processing unit 2c acquires each label image will be described later.
- the image processing unit 2c detects an abnormal cell region 91 (Fig. 6A reference).
- the superimposed cell image generation unit 2d is configured to generate a superimposed cell image 50 that allows the abnormal cell region 91 to be identified. The details of the configuration for generating the superimposed cell image 50 by the superimposed cell image generation unit 2d will be described later.
- the storage unit 3 is configured to store the cell image 10, the learned model 6, and the criterion value 20.
- the predetermined criterion values 20 include a first criterion value 20a and a second criterion value 20b lower than the first criterion value 20a. Details of the first criterion value 20a and the second criterion value 20b will be described later. Further, the storage unit 3 is configured to store various programs executed by the processor 2 .
- the storage unit 3 includes, for example, a storage device such as an HDD (Hard Disk Drive) or an SSD (Solid State Drive).
- the display unit 4 is configured to display the superimposed cell image 50 generated by the superimposed cell image generation unit 2d.
- Display unit 4 includes, for example, a display device such as a liquid crystal monitor.
- the input reception unit 5 is configured to be able to receive operation input by the operator.
- Input reception unit 5 includes an input device such as a mouse and a keyboard.
- the cell image 10 is an image showing cultured cells.
- the cell image 10 is an image obtained by photographing a cell 90 having differentiation potential as a cultured cell.
- the cells 90 include iPS cells (induced pluripotent stem cells), ES cells (embryonic stem cells), and the like.
- the image analysis unit 2b (see FIG. 1) is configured to analyze whether the cell 90 appearing in the cell image 10 is an undifferentiated cell or an undifferentiated deviant cell.
- an undifferentiated cell is a cell which has differentiation ability.
- undifferentiated deviant cells are cells that have started to differentiate into specific cells and do not have differentiation potential.
- undifferentiated cells are defined as normal cells.
- undifferentiated deviant cells are defined as abnormal cells.
- the incidence of abnormal cells is sufficiently low. In other words, abnormal cells are rare cells relative to all cultured cells.
- the cell image 10 may include an area (noise area 80) in which noise appears.
- the noise includes scratches on the culture vessel when the cells 90 are cultured.
- FIG. 10 Next, a method for analyzing the cell image 10 by the cell image analysis method according to this embodiment will be described with reference to FIG.
- the cell image analysis apparatus 100 analyzes the cell image 10 to determine whether the cell 90 appearing in the cell image 10 is a normal cell or an abnormal cell.
- the cell image analysis apparatus 100 analyzes the cell image 10 using the learned model 6 to determine whether the cell 90 appearing in the cell image 10 is normal or abnormal.
- the trained model 6 outputs an index value 21 when the cell image 10 is input.
- the index value 21 includes a first probability value 21a indicating the probability that the cell 90 is an abnormal cell, a second probability value 21b indicating the probability that the cell 90 is a normal cell, and a third probability value 21c indicating the probability that the cell 90 is background. and a fourth probability value 21d indicating the probability of being noise.
- the trained model 6 is trained to output the index value 21 for each pixel of the cell image 10 .
- the first probability value 21a is an example of the "first index value" in the claims.
- FIG. 3 is a block diagram showing the flow of image processing according to this embodiment. As shown in FIG. 3 , in this embodiment, the cell image analysis method is roughly divided into an image analysis method 101 and a learned model 6 generation method 102 .
- the method 102 for generating the trained model 6 generates the trained model 6 by making the learning model 6a learn to classify each pixel of the cell image 10 into normal cells, abnormal cells, and background. do. Specifically, the method 102 for generating the trained model 6 generates the trained model 6 by making the learning model 6a learn using the teacher cell image 30 and the teacher label image 31 . That is, the method 102 for generating the learned model 6 uses the cell image 10 as the teacher cell image 30 as input data, and the teacher label image 31 as the labeled image of normal cells and the labeled abnormal cells. The output data are an image, an image with labeled background, and an image with labeled noise. Thus, the method 102 for generating the trained model 6 causes the learning model 6a to learn whether each pixel of the input image is a normal cell, abnormal cell, background, or noise.
- the method 102 for generating the trained model 6 includes a step 102a of inputting the teacher cell image 30 to the learning model 6a, and making the learning model 6a learn to output the teacher label image 31. and step 102b.
- the trained model 6 is, for example, a convolutional neural network (CNN) shown in FIG. 3, or partly includes a convolutional neural network.
- the learned model 6 generated by learning the learning model 6a is stored in the storage unit 3 (FIG. 1) of the cell image analysis device 100.
- FIG. 1 probability value 21a is a probability value that the cell 90 appearing in the teacher cell image 30 is an abnormal cell.
- the second probability value 21b is a probability value that the cell 90 appearing in the teacher cell image 30 is a normal cell.
- the third probability value 21c is a probability value that the pixel of the teacher cell image 30 is the background.
- the trained model 6 uses the index values 21 for the input cell image 10 as a first probability value 21a indicating the probability of being a normal cell, a second probability value 21b indicating the probability of being an abnormal cell, A third probability value 21c indicating the probability of being background and a fourth probability value 21d indicating the probability of being noise are output.
- learning that the area is the noise area 80 learning is performed by using a teacher image in which the operator labels the noise area 80 in advance. This makes it possible to increase the number of classification classes to be discriminated compared to a configuration in which the three classification classes of normal cells, abnormal cells, and background are learned. Therefore, in the three classification classes, an abnormal cell classified in the background may slightly increase in likelihood of being an abnormal cell due to an increase in the noise classification class. As a result, the classification accuracy of the learned model 6 can be improved by suppressing the abnormal cells from being classified as background.
- An image analysis method 101 is an image analysis method for classifying cells 90 appearing in a cell image 10 acquired by the image acquisition unit 1 from a microscope 7 or the like into normal cells and abnormal cells.
- the image analysis method 101 according to the present embodiment includes steps of obtaining a cell image 10, obtaining an index value 21 of each pixel of the cell image 10, obtaining an abnormal cell region 91, and determining the abnormal cell region 91. and identifiably displaying. Detailed processing of each step of the image analysis method 101 will be described later.
- the step of acquiring the cell image 10 is performed by the image acquisition unit 1 as shown in FIG.
- An image acquisition unit 1 acquires a cell image 10 from an image capturing device such as a microscope 7 .
- the image acquisition unit 1 also outputs the acquired cell image 10 to the image analysis unit 2b.
- the step of analyzing the cell image 10 is performed by the image analysis unit 2b.
- the image analysis unit 2b acquires the index value 21 for each pixel of the input cell image 10.
- FIG. The image analysis unit 2b also outputs the acquired index value 21 to the image processing unit 2c.
- the image processing unit 2c acquires the abnormal cell region 91 from the cell image 10 based on the index value 21.
- the image processor 2c outputs the acquired abnormal cell region 91 to the superimposed cell image generator 2d.
- the superimposed cell image generation unit 2d generates a superimposed cell image 50 based on the abnormal cell region 91 and the cell image 10, and causes the display unit 4 to display it.
- the cell image analysis apparatus 100 displays the abnormal cell region 91 in a identifiable manner by displaying the superimposed cell image 50 . Details of the superimposed cell image 50 will be described later.
- the image processor 2c acquires the abnormal cell region 91 based on the index value 21 output by the learning model 6a. Specifically, as shown in FIG. 4, the image processing unit 2c acquires the abnormal cell region 91 by acquiring the labeled image based on the index value 21.
- FIG. 4 Label image acquisition processing
- the image analysis unit 2b acquires the index value 21 by inputting the cell image 10 to the trained model 6.
- the image analysis unit 2b acquires the index value 21 for each pixel of the cell image 10.
- the image processing unit 2c (see FIG. 1) generates a background labeled image 11, a normal cell labeled image 12, an abnormal cell labeled image 13, and a noise region labeled image (see FIG. 1) based on the index value 21 output by the trained model 6. not shown).
- the background label image 11 is an image whose pixel values are the values of the third probability values 21c that indicate the probability of being the background.
- the background label image 11 is an image in which the pixel value increases (blacker) as the value of the third probability value 21c increases, and the pixel value decreases (whiter) as the value of the third probability value 21c decreases. be.
- the darker the hatching the larger the pixel value.
- one hatching indicates that the probability value within a predetermined range is included.
- the black area in the background label image 11 means that the third probability value 21c indicating the probability of being background is greater than 80% and less than or equal to 100%.
- the normal cell label image 12 is an image whose pixel values are the values of the second probability values 21b that indicate the probability of being normal cells.
- the normal cell labeled image 12 is an image in which the pixel value increases (blacker) as the second probability value 21b increases, and the pixel value decreases (whiter) as the second probability value 21b decreases. is. Also, in the hatched portions, the darker the hatching, the larger the pixel value.
- the normal cell labeled image 12 also includes a predetermined range of probability values by adding one hatching as shown in Legend 8 .
- the black region in the normal cell label image 12 means that the first probability value 21a indicating the probability of being normal cells is greater than 80% and less than or equal to 100%.
- the abnormal cell label image 13 is an image in which the value of the first probability value 21a indicating the probability of being an abnormal cell is used as the pixel value. Specifically, the abnormal cell label image 13 is an image in which the pixel value is larger (blacker) as the value of the first probability value 21a is larger, and the pixel value is smaller (whiter) as the value of the first probability value 21a is smaller. is. Also, in the hatched portions, the darker the hatching, the larger the pixel value. It should be noted that the abnormal cell label image 13 also includes a predetermined range of probability values by adding one hatching, as shown in legend 8. FIG. For example, the black region in the abnormal cell label image 13 means that the second probability value 21b indicating the probability of being abnormal cells is greater than 80% and less than or equal to 100%.
- FIG. 5(A) is a schematic diagram showing an abnormal cell label image 13.
- FIG. 5(B) is an enlarged image 15 obtained by enlarging the region 14 of the abnormal cell labeled image 13 of FIG. 5(A).
- FIG. 5C is a graph 17 in which pixel values are plotted along a straight line 16 shown in the enlarged image 15.
- FIG. The graph 17 is a graph in which the vertical axis is the pixel value and the horizontal axis is the pixel position.
- the enlarged image 15 shown in FIG. 5(B) is an enlarged image of the area 14, which is an area with small pixel values, in the abnormal cell labeled image 13. As shown in graph 17 of FIG. 5(C), there is a small pixel value, so there is a possibility that the cell is an abnormal cell, albeit with a low probability.
- FIG. 1 when determining whether each pixel is a normal cell, an abnormal cell, or a background based on the order of magnitude of the index value 21 output by the trained model 6, FIG. There is a possibility that the region 14 of the abnormal cell label image 13 shown in , will not be identified as an abnormal cell. Specifically, when the first probability value 21a of the index values 21 of the same pixel as the region 14 is smaller than the second probability value 21b and the third probability value 21c, the cell is not determined to be an abnormal cell. However, if the first probability value 21a is not 0, there is even a slight possibility that the cell is an abnormal cell. Therefore, in the case of discrimination based on the magnitude of the index value 21, the operator may not be able to grasp the region of the cells 90 shown in the enlarged image 15 as the abnormal cell region 91. FIG.
- the image processing unit 2c is configured to acquire the abnormal cell region 91 based on the determination reference value 20 and the index value 21. Specifically, the image processing unit 2 c acquires the abnormal cell region 91 by performing so-called threshold processing on the index value 21 with the determination reference value 20 . In the present embodiment, the image processing unit 2c determines that the first index value (first probability value 21a), which indicates that the cell 90 is an abnormal cell rather than a normal cell, out of the index values 21 is higher than the predetermined criterion value 20. is configured to acquire an abnormal cell region 91, which is a large region.
- first index value first probability value 21a
- Schematic diagrams shown in FIGS. 6A to 6E are abnormal cell label images 13 when the criterion value 20 is changed.
- the criterion value 20 is set to a value greater than 0%, 10% or more, 20% or more, 30% or more, and 40% It is the abnormal cell label image 13 when changed above.
- the abnormal cell label images 13a to 13e shown in FIGS. 6A to 6E the abnormal cell region 91 is shown as a black region.
- areas other than the abnormal cell area 91 are shown as white areas.
- FIG. 6(A) is a schematic diagram showing an abnormal cell label image 13a when the criterion value 20 is set to a value greater than 0. That is, the abnormal cell labeled image 13a is a labeled image of the abnormal cell region 91 having the first probability value 21a greater than zero.
- FIG. 6(B) is a schematic diagram showing an abnormal cell label image 13b when the criterion value 20 is set to 10% or more. That is, the abnormal cell labeled image 13b is a labeled image of the abnormal cell region 91 with the first probability value 21a of 10% or more.
- the abnormal cell region 91 when the criterion value 20 is greater than 0 is indicated by a dashed line 70.
- the size of the abnormal cell region 91 becomes small.
- FIG. 6(C) is a schematic diagram showing an abnormal cell label image 13c when the criterion value 20 is set to a value of 20% or more. That is, the abnormal cell labeled image 13c is a labeled image of the abnormal cell region 91 having the first probability value 21a of 20% or more. Also in FIG. 6(C), the broken line 70 indicates the abnormal cell region 91 when the criterion value 20 is greater than zero. As shown in FIG. 6C, when the criterion value 20 is 20% or more, the size of the abnormal cell region 91 becomes smaller. Moreover, when comparing the abnormal cell label image 13b shown in FIG. 6B and the abnormal cell label image 13c shown in FIG. The cell area 91 is smaller than the abnormal cell area 91 shown in the abnormal cell label image 13b shown in FIG. 6(B).
- FIG. 6(D) is an abnormal cell label image 13d when the criterion value 20 is set to 30% or more. That is, the abnormal cell labeled image 13d is a labeled image of the abnormal cell region 91 having the first probability value 21a of 30% or more. Also in FIG. 6(D), the broken line 70 indicates the abnormal cell region 91 when the criterion value 20 is greater than zero. As shown in FIG. 6D, when the criterion value 20 is 30% or more, the size of the abnormal cell region 91 becomes smaller. Further, as shown in FIGS. 6B to 6D, as the value of the criterion value 20 increases, the abnormal cell region 91 appearing in the abnormal cell label image 13 becomes smaller.
- FIG. 6(E) is a schematic diagram showing an abnormal cell label image 13e when the criterion value 20 is set to 40% or more. That is, the abnormal cell labeled image 13e is a labeled image of the abnormal cell region 91 having the first probability value 21a of 40% or more. Also in FIG. 6(E), the broken line 70 indicates the abnormal cell region 91 when the criterion value 20 is greater than zero. As shown in FIG. 6(E), when the criterion value 20 is 40% or more, the size of the abnormal cell region 91 becomes smaller. Further, as shown in FIGS. 6B to 6E, as the value of the criterion value 20 increases, the abnormal cell region 91 appearing in the abnormal cell label image 13 becomes smaller.
- the size of the abnormal cell region 91 decreases.
- the smaller the criterion value 20 the larger the number and area of the regions acquired as the abnormal cell regions 91.
- FIG. it is more likely that regions that are not actually abnormal cells will be obtained. In other words, even a region that does not need to be identifiably displayed as the abnormal cell region 91 may be acquired as the abnormal cell region 91 .
- the larger the value of the criterion value 20 the higher the possibility that the cells 90 included in the acquired abnormal cell region 91 are abnormal cells. However, the number and area of the acquired abnormal cell regions 91 are reduced. That is, there is a case where the abnormal cell region 91 is not acquired.
- the image processing unit 2c is configured to acquire the abnormal cell region 91 using a plurality of determination reference values 20. Specifically, the image processing unit 2 c is configured to acquire the abnormal cell region 91 using two determination reference values 20 . In this embodiment, the image processing unit 2c is configured to acquire the abnormal cell region 91 using a first criterion value 20a and a second criterion value 20b lower than the first criterion value 20a. ing.
- the first determination reference value 20a is set to 10% or more
- the second determination reference value 20b is set to a value greater than zero.
- the image processing unit 2c like the abnormal cell region image 13f shown in FIG. to get as Specifically, the image processing unit 2c acquires the abnormal cell region 91 having the first probability value 21a larger than the first determination reference value 20a as the first abnormal cell region 91a. Further, the image processing unit 2c acquires an abnormal cell region 91 whose first index value is greater than the second determination reference value 20b as a second abnormal cell region 91b, such as the abnormal cell region image 13f shown in FIG. . Specifically, the image processing unit 2c acquires the abnormal cell region 91 having the first probability value 21a greater than the second determination reference value 20b as the second abnormal cell region 91b.
- the image processing unit 2c converts the index value 21 of each pixel of the cell region 93, which is the cell 90 shown in the cell image 10, into the first determination reference value 20a and It is determined whether or not it is greater than the second determination reference value 20b.
- the image processing unit 2c is configured to acquire a cell region 93 that is the region of the cells 90 and a region 94 other than the cells 90 based on the normal cell labeled image 12 and the abnormal cell labeled image 13.
- the image processing unit 2c obtains the cell region image 18 by adding the pixel values at the same position in the normal cell labeled image 12 and the abnormal cell labeled image 13, respectively.
- the cell region image 18 shown in FIG. 8 is a binary image in which the cell region 93 has a pixel value of 1 and the region 94 other than the cell 90 has a pixel value of 0.
- the area illustrated in white in the cell area image 18 is the area 94 other than the cell 90 .
- FIG. 9 shows an example in which the superimposed cell image generation unit 2d generates a superimposed cell image 50 shown in FIG. 9(B) from the cell image 10 shown in FIG. 9(A).
- the superimposed cell image generation unit 2d generates a superimposed cell image 50 by superimposing the abnormal cell region 91 on the cell image 10. Specifically, the superimposed cell image generation unit 2d generates a superimposed cell image 50 by superimposing the first abnormal cell region 91a and the second abnormal cell region 91b on the cell image 10.
- FIG. 1 The superimposed cell image generation unit 2d generates a superimposed cell image 50 by superimposing the first abnormal cell region 91a and the second abnormal cell region 91b on the cell image 10.
- the superimposed cell image generation unit 2d generates, as the superimposed cell image 50, an image that allows the abnormal cell region 91 to be identified. Specifically, the superimposed cell image generation unit 2d generates, as the superimposed cell image 50, an image in which the entirety of the first abnormal cell region 91a is displayed in a predetermined color.
- the superimposed cell image generator 2d displays, for example, the entirety of the first abnormal cell region 91a in red. In the example shown in FIG. 9B, the first abnormal cell region 91a is hatched to indicate that the entire first abnormal cell region 91a is displayed in a predetermined color.
- the superimposed cell image generation unit 2d generates, as the superimposed cell image 50, an image in which the frame line 91c surrounding the second abnormal cell region 91b is highlighted.
- the frame line 91c is emphasized by drawing the frame line 91c with a thick line.
- the frame line 91c is the outline of the second abnormal cell region 91b.
- the superimposed cell image generation unit 2d superimposes a thick line (frame line 91c) indicating the outline of the cell region 93 of the cell image 10, and then, in the abnormal cell region 91, the second probability value 21b is divided into two steps to generate a colored image in which each region corresponding to the second probability value 21b is dyed with two colors.
- the superimposed cell image generation unit 2d generates an image in which the normal cell region 92 is displayed in a color different from that of the abnormal cell region 91 as the superimposed cell image 50. That is, the superimposed cell image generation unit 2d displays the normal cell region 92 and the abnormal cell region 91 in different colors, displays the entire first abnormal cell region 91a in a predetermined color, and displays the second abnormal cell region 91a in a predetermined color. An image in which a frame line 91c surrounding 91b is highlighted is generated as a superimposed cell image 50. FIG. Abnormal cell region 91 For example, in this embodiment, the superimposed cell image generation unit 2d displays the normal cell region 92 in blue.
- FIG. 10 (Superimposed cell image by comparative example)
- a superimposed cell image 50 shown in FIG. 10B is obtained from the cell image 10 shown in FIG. 4 shows a comparative example to generate.
- the superimposed cell image 40 according to the comparative example is an image in which the normal cell region 96 and the abnormal cell region 95 are obtained based on the largest index value 21 for each pixel and superimposed on the cell image 10. Specifically, for each pixel, among the first probability value 21a, the second probability value 21b, and the third probability value 21c, the largest probability value is acquired, and the normal cell region 96 and the abnormal cell region 95 are obtained. and get. Therefore, when the first probability value 21a indicating the probability of being an abnormal cell is smaller than the second probability value 21b indicating the probability of being a normal cell and the third probability value 21c indicating the probability of being a background cell, the abnormal cell region It is not displayed as 91.
- the area of the abnormal cell region 95 appearing in the superimposed cell image 40 according to the comparative example is smaller than the area of the abnormal cell region 91 appearing in the superimposed cell image 50 according to the present embodiment. That is, in the superimposed cell image 40 according to the comparative example, it is difficult to grasp the abnormal cell region 95 at a glance.
- the superimposed cell image 50 according to the present embodiment displays more and wider abnormal cell regions 91 . Therefore, the operator can more accurately grasp the abnormal cell region 91 that may be abnormal cells.
- the image processing unit 2c is configured to acquire the number of abnormal cells appearing in the cell image 10.
- FIG. When counting the number of abnormal cells, if adjacent abnormal cells are individually counted, the ratio of abnormal cells to normal cells may become too large. Therefore, in this embodiment, the image processing unit 2c may preferably measure the abnormal cell region 91 as one abnormal cell instead of individually counting abnormal cells. Therefore, in the present embodiment, the image processing unit 2c is configured to obtain the number 60 of the second abnormal cell regions 91b appearing in the cell image 10 as the number of abnormal cells.
- the second abnormal cell region 91b is a region with a low possibility of being abnormal cells
- the first abnormal cell region 91a is a region with a high possibility of being abnormal cells.
- the image processing unit 2c is configured to acquire the ratio 61 of the area of the first abnormal cell region 91a to the area of the second abnormal cell region 91b. Further, the image processing unit 2c is configured to display the obtained ratio 61 of the area of the first abnormal cell region 91a to the area of the second abnormal cell region 91b on the display unit 4.
- the image processing unit 2c acquires the abnormal cell region 91 based on the first criterion value 20a and the second criterion value 20b.
- the image processing unit 2c is configured to select the abnormal cell region 91 to be displayed in an identifiable manner.
- a second abnormal cell region 91b including a first abnormal cell region 91a is shown as shown in the region 19a. Further, the abnormal cell label image 13g shows a second abnormal cell region 91b having an extremely small area, as shown in the region 19b. In addition, as shown in the area 19c, the abnormal cell label image 13g shows a second abnormal cell area 91b that does not include the first abnormal cell area 91a.
- the image processing unit 2c displays the second abnormal cell region 91b having an area equal to or less than a predetermined area among the second abnormal cell regions 91b so as to be distinguishable from the first abnormal cell region 91a. exclude.
- the image processing unit 2c excludes the second abnormal cell region 91b, which does not include the first abnormal cell region 91a inside, from targets to be displayed so as to be distinguishable from the first abnormal cell region 91a. That is, as in the abnormal cell labeled image 13h shown in FIG. 11, the image processing unit 2c converts only the second abnormal cell region 91b, which is larger than a predetermined area and includes the first abnormal cell region 91a inside, to the first abnormal cell region 91b. This area is to be displayed so as to be distinguishable from the cell area 91a.
- FIG. 12 shows an example of displaying a superimposed cell image 50, the number 60 of second abnormal cell regions 91b, and the ratio 61 of the area of the first abnormal cell region 91a to the area of the second abnormal cell region 91b on the display unit 4. It is a schematic diagram showing.
- the image processing unit 2c causes the display unit 4 to display a superimposed cell image 50. Further, the image processing unit 2c causes the display unit 4 to display the number 60 of the second abnormal cell regions 91b. Further, the image processing unit 2c causes the display unit 4 to display the ratio 61 of the area of the first abnormal cell region 91a to the area of the second abnormal cell region 91b. In this embodiment, the image processing unit 2c generates the superimposed cell image 50, the number 60 of the second abnormal cell regions 91b, and the ratio 61 of the area of the first abnormal cell region 91a to the area of the second abnormal cell region 91b. and are displayed side by side.
- the image acquisition unit 1 acquires the cell image 10 in which the cell 90 is captured.
- the image analysis unit 2b acquires the index value 21 obtained by analyzing the cell 90 appearing in the cell image 10 using the trained model 6 that has learned the analysis of the cell 90. Specifically, in step 201, the image analysis unit 2b acquires a first probability value 21a indicating the probability that the cell 90 is an abnormal cell for each pixel of the cell image 10 as the first index value. More specifically, in step 201, the image analysis unit 2b acquires, as the index value 21, a first probability value 21a and a second probability value 21b indicating the probability that the cultured cells are normal cells. In this embodiment, the image analysis unit 2b acquires the index value 21 using the trained model 6 that has learned to determine the state of the cell 90 and whether or not it is the noise region 80. FIG.
- the image processing unit 2c acquires a cell area 93, which is the area of the cells 90, and an area 94 other than the cells 90.
- the image processing unit 2c acquires the abnormal cell area 91 whose first index value is greater than the first determination reference value 20a as the first abnormal cell area 91a. Specifically, the image processing unit 2c acquires the abnormal cell region 91 having the first probability value 21a larger than the first determination reference value 20a as the first abnormal cell region 91a. In step 203, the image processing unit 2c acquires a region in which the first probability value 21a for each pixel of the cell region 93 is greater than the first determination reference value 20a as the first abnormal cell region 91a. In step 203, even when the first probability value 21a is smaller than the second probability value 21b, if the first probability value 21a is larger than the first criterion value 20a, the image processing unit 2c Obtained as the abnormal cell region 91a.
- the image processing unit 2c determines the abnormal cell region, which is a region in which the first index value indicating that the cell 90 is an abnormal cell rather than a normal cell is greater than the predetermined determination reference value 20 among the index values 21. Get 91. Specifically, the image processing unit 2c acquires the abnormal cell region 91 whose first index value is greater than the second determination reference value 20b as the second abnormal cell region 91b. More specifically, the image processing unit 2c acquires the abnormal cell region 91 having the first probability value 21a greater than the second criterion value 20b as the second abnormal cell region 91b.
- the image processing unit 2c acquires a region where the first probability value 21a is greater than 0 as the second abnormal cell region 91b as the second determination reference value 20b. In addition, even when the first probability value 21a is smaller than the second probability value 21b, the image processing unit 2c detects the second abnormal cell region 91b when the first probability value 21a is larger than the second criterion value 20b. to get as Further, the image processing unit 2c acquires a region in which the first probability value 21a for each pixel of the cell region 93 is greater than the second determination reference value 20b as the second abnormal cell region 91b.
- the normal cell area 92 is obtained.
- the image processing unit 2c excludes the second abnormal cell region 91b having an area equal to or less than a predetermined area among the second abnormal cell regions 91b from the targets to be displayed so as to be distinguishable from the first abnormal cell region 91a. do.
- the image processing unit 2c excludes the second abnormal cell region 91b, which does not include the first abnormal cell region 91a, from the objects to be displayed so as to be distinguishable from the first abnormal cell region 91a.
- the superimposed cell image generation unit 2d generates a superimposed cell image 50 based on the cell image 10, the first abnormal cell region 91a, the second abnormal cell region 91b, and the normal cell region 92. Specifically, the superimposed cell image generation unit 2d superimposes the first abnormal cell region 91a, the second abnormal cell region 91b, and the normal cell region 92 on the cell image 10, thereby generating a superimposed cell image. Generate 50.
- the image processing unit 2c displays the superimposed cell image 50 on the display unit 4. That is, the image processing unit 2c displays the superimposed cell image 50 on the display unit 4 so that the abnormal cell region 91 can be identified. Further, the image processing unit 2c displays the superimposed cell image 50 on the display unit 4 so that the first abnormal cell region 91a and the second abnormal cell region 91b can be distinguished. Further, the image processing unit 2c displays the superimposed cell image 50 on the display unit 4 to display the entirety of the first abnormal cell region 91a in a predetermined color, and the frame line 91c surrounding the second abnormal cell region 91b. highlight.
- the image processing unit 2c displays the superimposed cell image 50 on the display unit 4 so that the first abnormal cell region 91a and the second abnormal cell region 91b are superimposed on the cell image 10. .
- the image processing unit 2c displays the superimposed cell image 50 on the display unit 4 so that the cell image 10 is divided into the first abnormal cell region 91a, the second abnormal cell region 91b, and the normal cell region. are superimposed and displayed. After that, the process ends.
- step 203 to step 205 may be performed from any step.
- step 206 and step 207 may be performed from either processing.
- the image processing unit 2c acquires the number 60 of the second abnormal cell regions 91b appearing in the cell image 10.
- the image processing unit 2c displays the acquired number 60 of the second abnormal cell regions 91b. After that, the process ends.
- the image processing unit 2c acquires and displays the ratio 61 of the area of the first abnormal cell region 91a to the area of the second abnormal cell region 91b. It is started when there is an input to
- step 400 the area of the first abnormal cell region 91a is obtained.
- the area of the second abnormal cell region 91b is obtained.
- the image processing unit 2c acquires the ratio 61 of the area of the first abnormal cell region 91a to the area of the second abnormal cell region 91b.
- the image processing unit 2c displays the ratio 61 of the area of the first abnormal cell region 91a to the area of the second abnormal cell region 91b. After that, the process ends.
- the cell image analysis method includes the steps of acquiring the cell image 10 showing the cell 90, and using the learned model 6 that has learned the analysis of the cell 90. a step of obtaining an index value 21 by analyzing 90, and a region in which a first index value indicating that the cell 90 is an abnormal cell that is not a normal cell is larger than a predetermined criterion value 20 in the index value 21. It comprises a step of obtaining an abnormal cell area 91 and a step of displaying the abnormal cell area 91 in an identifiable manner.
- the step of obtaining the abnormal cell region 91 which is the region in which the first index value indicating that the cell 90 is an abnormal cell but not a normal cell is larger than the predetermined criterion value 20 among the index values 21.
- the region where the first index value is greater than the predetermined criterion value 20 is acquired as the abnormal cell region 91. Therefore, even if the first index value is smaller than the other index value 21, the abnormal cell region 91 can be obtained.
- the step of displaying the abnormal cell region 91 in a identifiable manner for example, when the determination reference value 20 is reduced, the acquired abnormal cell region 91 is a region suspected of being an abnormal cell.
- abnormal cell region 91 having even the slightest possibility of being abnormal cells can be visually displayed.
- a cell image analysis method capable of ascertaining areas suspected of being abnormal cells (abnormal cell areas 91) in the cell image 10.
- the predetermined criterion value 20 includes the first criterion value 20a and the second criterion value 20b lower than the first criterion value 20a, and the abnormal cell region
- the step of acquiring 91 includes a step of acquiring an abnormal cell region 91 whose first index value is greater than the first criterion value 20a as the first abnormal cell region 91a, and acquiring an abnormal cell region 91 larger than the second abnormal cell region 91b as a second abnormal cell region 91b; to be identifiable.
- the first abnormal cell region 91a is determined to be abnormal cells by the first determination reference value 20a
- the abnormal cell is determined to be abnormal cells by the second determination reference value 20b smaller than the first determination reference value 20a.
- the operator can grasp the second abnormal cell region 91b.
- the operator can distinguish between the second abnormal cell region 91b, which has even the slightest possibility of being abnormal cells, and the first abnormal cell region 91a, which has a higher possibility of being abnormal cells than the second abnormal cell region 91b. Therefore, the abnormal cell region 91 can be grasped more accurately.
- the first probability value 21a indicating the probability that the cell 90 is an abnormal cell is used as the first index value for each pixel of the cell image 10. and obtaining the first abnormal cell region 91a, the abnormal cell region 91 having the first probability value 21a larger than the first criterion value 20a is obtained as the first abnormal cell region 91a, and the second abnormal cell region 91a is obtained.
- the abnormal cell area 91b the abnormal cell area 91 for which the first probability value 21a is greater than the second criterion value 20b is obtained as the second abnormal cell area 91b. Accordingly, by comparing the first probability value 21a with the first determination reference value 20a and the second determination reference value 20b, it is possible to determine whether the cell 90 is the first abnormal cell region 91a or the second abnormal cell region 91b. can be easily determined.
- the cell image 10 is an image in which cultured cells are captured.
- the first probability value 21a is If it is larger than the first criterion value 20a, it is acquired as the first abnormal cell region 91a, and in the step of acquiring the second abnormal cell region 91b, if the first probability value 21a is smaller than the second probability value 21b However, if the first probability value 21a is greater than the second criterion value 20b, it is acquired as the second abnormal cell region 91b.
- the abnormal cell region 91 can be acquired regardless of the value of the first probability value 21a.
- the first probability value 21a is smaller than the second probability value 21b, it is possible to suppress acquisition of the abnormal cell region 92 as the normal cell region 92, so that the operator can accurately grasp the abnormal cell region 91. can be made
- the region with the first probability value 21a greater than 0 is used as the second criterion value 20b. 91b.
- the first probability value 21a is greater than 0, it can be acquired as the second abnormal cell region 91b.
- the present embodiment further includes the step of acquiring the cell region 93, which is the region of the cells 90, and the region 94 other than the cells 90, from the cell image 10, and the first abnormal cell region 91a.
- the obtaining step a region in which the first probability value 21a for each pixel of the cell region 93 is larger than the first determination reference value 20a is obtained as the first abnormal cell region 91a
- the second abnormal cell region 91b a region in which the first probability value 21a for each pixel of the cell region 93 is larger than the second criterion value 20b is acquired as the second abnormal cell region 91b.
- the entire first abnormal cell region 91a is displayed in a predetermined color, and the second abnormal cell region 91b is surrounded.
- the frame line 91c is highlighted. This makes it possible to easily distinguish between the first abnormal cell region 91a and the second abnormal cell region 91b at a glance.
- the first abnormal cell region 91a and the second abnormal cell region 91b are superimposed on the cell image 10. displayed.
- the first abnormal cell region 91a and the second abnormal cell region 91b can be easily distinguished.
- the operator can easily grasp the first abnormal cell region 91a that is strongly suspected to be abnormal cells and the second abnormal cell region 91b that is weakly suspected to be abnormal cells.
- the cell image 10 is displayed with the first abnormal cell region 91a, the second abnormal cell region 91b, and the normal cell region 91b. is superimposed on the area 92 of . This allows the operator to easily distinguish between normal cells and abnormal cells in the cell image 10 .
- the second abnormal cell regions 91b having an area equal to or less than a predetermined area are displayed so as to be distinguishable from the first abnormal cell regions 91a. further comprising the step of excluding from As a result, the area determined to be the second abnormal cell area 91b although not the abnormal cell because the second determination reference value 20b is low can be excluded from the targets to be identifiably displayed. As a result, it is possible to prevent the operator from recognizing a region other than abnormal cells as the abnormal cell region 91 .
- the step of excluding the second abnormal cell region 91b, which does not include the first abnormal cell region 91a inside, from the object to be displayed so as to be distinguishable from the first abnormal cell region 91a is further performed.
- the second abnormal cell region 91b regions that do not contain abnormal cells can be excluded from objects to be identifiably displayed.
- the step of obtaining the number 60 of the second abnormal cell regions 91b appearing in the cell image 10 and the step of displaying the obtained number 60 of the second abnormal cell regions 91b are performed. Prepare more. As a result, an area with even the slightest possibility of being an abnormal cell can be counted as one abnormal cell. As a result, it is possible to suppress an increase in the number of abnormal cells as compared with the case where abnormal cells are individually counted, so that an increase in the ratio of abnormal cells to normal cells can be suppressed. can.
- the step of acquiring the ratio 61 of the area of the first abnormal cell region 91a to the area of the second abnormal cell region 91b, and displaying the ratio 61 of the area of the cell region 91a Accordingly, when the ratio 61 of the area of the first abnormal cell region 91a to the area of the second abnormal cell region 91b is large, it can be determined that the cells are highly suspected to be abnormal cells. Also, when the ratio 61 of the area of the first abnormal cell region 91a to the area of the second abnormal cell region 91b is low, it can be determined that the suspicion of being an abnormal cell is low. As a result, the operator can grasp the probability (possibility) of being an abnormal cell as a numerical value, and can easily grasp the probability of being an abnormal cell.
- the trained model 6 is further provided with the step of creating the trained model 6, and in the step of acquiring the index value 21, the trained model 6 learned to determine the state of the cell 90 and whether or not it is the noise region 80. is used to obtain the index value 21 .
- the learned model 6 it is possible to prevent the learned model 6 from estimating that the noise region 80 similar to the abnormal cell is the background region, thereby preventing the abnormal cell region 91 from being determined to be the background region.
- the estimation accuracy of the abnormal cell region 91 can be improved.
- the image processing unit 2c uses the first determination reference value 20a and the second determination reference value 20b to acquire the first abnormal cell region 91a and the second abnormal cell region 91b.
- the present invention is not limited to this.
- the image processor 2c may be configured to acquire the abnormal cell region 91 using one criterion value 20. FIG.
- the image processing unit 2c determines whether or not the abnormal cell region 91 is present based on the first probability value 21a and the second probability value 21b has been described.
- the invention is not limited to this.
- the image processor 2c may be configured to determine whether or not it is the abnormal cell region 91 based only on the first probability value 21a.
- the present invention is not limited to this.
- the first criterion value 20a is smaller than the second criterion value 20b, the first criterion value 20a and the second criterion value 20b can be set to arbitrary values.
- the image processing unit 2c determines whether or not each pixel of the cell region 93 is the abnormal cell region 91 is shown, but the present invention is not limited to this.
- the image processing unit 2c may be configured to determine whether or not all the pixels of the cell image 10 are the abnormal cell regions 91 or not.
- the superimposed cell image generation unit 2d displays the entirety of the first abnormal cell region 91a in a predetermined color, and the superimposed cell image in which the frame line 91c surrounding the second abnormal cell region 91b is highlighted. 50 is shown, the present invention is not limited to this.
- the superimposed cell image generation unit 2d may generate the superimposed cell image 50 in any manner as long as the first abnormal cell region 91a and the second abnormal cell region 91b can be distinguished.
- the superimposed cell image generation unit 2d generates an image in which the first abnormal cell region 91a is superimposed on the cell image 10, and an image in which the second abnormal cell region 91b is superimposed on the cell image 10. and may be configured to display those images side by side.
- the superimposed cell image generating unit 2d superimposes the first abnormal cell region 91a, the second abnormal cell region 91b, and the normal cell region 92 on the cell image 10 and displays them.
- the present invention is not limited to this.
- the superimposed cell image generation unit 2d may generate a superimposed cell image 50 in which the first abnormal cell region 91a and the second abnormal cell region 91b are superimposed on the cell image 10, and not necessarily normal cells. region 92 need not overlap.
- the image processing unit 2c excludes the second abnormal cell region 91b having an area equal to or less than a predetermined area from the objects to be displayed so as to be distinguishable from the first abnormal cell region 91a.
- the present invention is not limited to this.
- the image processing unit 2c does not have to exclude the second abnormal cell region 91b having an area equal to or less than a predetermined area from the targets to be displayed so as to be distinguishable from the first abnormal cell region 91a.
- the image processing unit 2c excludes the second abnormal cell region 91b, which does not include the first abnormal cell region 91a, from the objects to be displayed so as to be distinguishable from the first abnormal cell region 91a.
- the present invention is not limited to this.
- the image processing unit 2c does not need to exclude the second abnormal cell region 91b, which does not include the first abnormal cell region 91a, from the targets to be displayed so as to be distinguishable from the first abnormal cell region 91a.
- the image processing unit 2c acquires the number 60 of the second abnormal cell regions 91b appearing in the cell image 10 and displays it on the display unit 4.
- the present invention is not limited to this. Not limited.
- the image processing unit 2c may be configured to obtain the number of first abnormal cell regions 91a appearing in the cell image 10 and display it on the display unit 4. FIG.
- the image processing unit 2c acquires the number 60 of the second abnormal cell regions 91b appearing in the cell image 10 and displays it on the display unit 4.
- the present invention is not limited to this. Not limited.
- the image processing unit 2c does not need to acquire the number 60 of the second abnormal cell regions 91b appearing in the cell image 10.
- the image processing unit 2c acquires the ratio 61 of the area of the first abnormal cell region 91a to the area of the second abnormal cell region 91b, and displays the acquired ratio 61 on the display unit 4.
- the image processor 2c does not need to acquire the ratio 61 of the area of the first abnormal cell region 91a to the area of the second abnormal cell region 91b.
- the image analysis unit 2b uses the trained model 6 generated by learning that the area that is similar to the abnormal cell but is recognized as the background portion is the noise area 80.
- the image analysis unit 2 b may be configured to acquire the index value 21 using a trained model that has not been trained to identify the noise region 80 .
- the image analysis unit 2b calculates the index value 21 using the trained model 6 generated by learning that the region that is similar to the abnormal cell but is recognized as the background portion is the noise region 80. It is preferably arranged to obtain.
- the image analysis unit 2b analyzes whether the cells 90 appearing in the cell image 10 are undifferentiated cells or undifferentiated deviant cells was shown. It is not limited to this.
- the image analysis unit 2b may be configured to analyze cancer cells and cells other than cancer cells. Cells analyzed by the image analysis unit 2b are not limited to undifferentiated cells and undifferentiated deviant cells.
- (Item 1) a step of obtaining a cell image showing cells; a step of obtaining an index value obtained by analyzing the cell appearing in the cell image using a trained model that has learned the analysis of the cell; obtaining an abnormal cell region, which is a region in which a first index value indicating that the cell is an abnormal cell, not a normal cell, is larger than a predetermined criterion value among the index values; and displaying the abnormal cell region in a identifiable manner.
- the predetermined criterion value includes a first criterion value and a second criterion value lower than the first criterion value
- the step of acquiring the abnormal cell area includes acquiring the abnormal cell area in which the first index value is greater than the first criterion value as the first abnormal cell area; obtaining the abnormal cell area larger than the 2 criterion value as a second abnormal cell area;
- the cell image analysis method according to item 1, wherein, in the step of identifiably displaying the abnormal cell area, the first abnormal cell area and the second abnormal cell area are identifiably displayed.
- Step 3 In the step of obtaining the index value, obtaining a first probability value indicating the probability that the cell is the abnormal cell for each pixel of the cell image as the first index value; In the step of obtaining the first abnormal cell area, obtaining the abnormal cell area for which the first probability value is greater than the first criterion value as the first abnormal cell area; The cell image according to item 2, wherein in the step of acquiring the second abnormal cell area, the abnormal cell area having the first probability value greater than the second criterion value is acquired as the second abnormal cell area. analysis method.
- the cell image is an image showing cultured cells, In the step of obtaining the index value, obtaining a second probability value indicating the probability that the cultured cells are the normal cells together with the first probability value as the index value; In the step of obtaining the first abnormal cell region, even if the first probability value is smaller than the second probability value, if the first probability value is larger than the first criterion value, the first Acquired as 1 abnormal cell area, In the step of acquiring the second abnormal cell region, even if the first probability value is smaller than the second probability value, if the first probability value is larger than the second criterion value, the 2.
- the cell image analysis method according to item 3 wherein the cell image is acquired as 2 abnormal cell regions.
- (Item 6) Further comprising the step of acquiring a cell area that is the area of the cell and an area other than the cell in the cell image, In the step of acquiring the first abnormal cell area, acquiring an area in which the first probability value for each pixel in the cell area is greater than the first criterion value as the first abnormal cell area, Items 3 to 5, wherein in the step of obtaining the second abnormal cell region, a region in which the first probability value for each pixel of the cell region is greater than the second criterion value is obtained as the second abnormal cell region.
- the cell image analysis method according to any one of .
- Items 7 to 9 further comprising the step of excluding, among the second abnormal cell regions, the second abnormal cell regions having an area equal to or smaller than a predetermined area from targets to be displayed so as to be distinguishable from the first abnormal cell regions.
- the cell image analysis method according to any one of .
- (Item 14) a step of creating the learned model by also learning that an area similar to the abnormal cell but recognized as a background portion is a noise area when learning to analyze the state of the cell; further prepared, Items 2 to 13, wherein in the step of obtaining the index value, the index value is obtained using the state of the cell and the trained model that has learned to determine whether or not it is in the noise region.
- the cell image analysis method according to any one of .
Landscapes
- Chemical & Material Sciences (AREA)
- Engineering & Computer Science (AREA)
- Health & Medical Sciences (AREA)
- Life Sciences & Earth Sciences (AREA)
- Organic Chemistry (AREA)
- Wood Science & Technology (AREA)
- Bioinformatics & Cheminformatics (AREA)
- Zoology (AREA)
- Biotechnology (AREA)
- Proteomics, Peptides & Aminoacids (AREA)
- Physics & Mathematics (AREA)
- Microbiology (AREA)
- Analytical Chemistry (AREA)
- Biochemistry (AREA)
- General Engineering & Computer Science (AREA)
- General Health & Medical Sciences (AREA)
- Genetics & Genomics (AREA)
- Toxicology (AREA)
- Sustainable Development (AREA)
- Medicinal Chemistry (AREA)
- Biophysics (AREA)
- Biomedical Technology (AREA)
- Immunology (AREA)
- Molecular Biology (AREA)
- Computer Vision & Pattern Recognition (AREA)
- General Physics & Mathematics (AREA)
- Theoretical Computer Science (AREA)
- Investigating Or Analysing Biological Materials (AREA)
Priority Applications (1)
| Application Number | Priority Date | Filing Date | Title |
|---|---|---|---|
| JP2023538619A JP7687406B2 (ja) | 2021-07-29 | 2022-07-28 | 細胞画像解析方法 |
Applications Claiming Priority (2)
| Application Number | Priority Date | Filing Date | Title |
|---|---|---|---|
| JP2021-124762 | 2021-07-29 | ||
| JP2021124762 | 2021-07-29 |
Publications (1)
| Publication Number | Publication Date |
|---|---|
| WO2023008526A1 true WO2023008526A1 (ja) | 2023-02-02 |
Family
ID=85086995
Family Applications (1)
| Application Number | Title | Priority Date | Filing Date |
|---|---|---|---|
| PCT/JP2022/029117 Ceased WO2023008526A1 (ja) | 2021-07-29 | 2022-07-28 | 細胞画像解析方法 |
Country Status (2)
| Country | Link |
|---|---|
| JP (1) | JP7687406B2 (https=) |
| WO (1) | WO2023008526A1 (https=) |
Cited By (1)
| Publication number | Priority date | Publication date | Assignee | Title |
|---|---|---|---|---|
| WO2025005099A1 (ja) * | 2023-06-30 | 2025-01-02 | 株式会社レゾナック | 欠陥検査装置、欠陥検査方法及び欠陥検査プログラム |
Citations (8)
| Publication number | Priority date | Publication date | Assignee | Title |
|---|---|---|---|---|
| JP2017102898A (ja) * | 2015-09-30 | 2017-06-08 | コニカ ミノルタ ラボラトリー ユー.エス.エー.,インコーポレイテッド | 細胞解析を向上させるための方法及びシステム |
| JP2018503906A (ja) * | 2014-12-30 | 2018-02-08 | ベンタナ メディカル システムズ, インコーポレイテッド | イムノスコア計算における共発現解析のためのシステム及び方法 |
| JP2021006037A (ja) * | 2014-09-03 | 2021-01-21 | ヴェンタナ メディカル システムズ, インク. | 免疫スコアを計算するためのシステム及び方法 |
| JP2021503666A (ja) * | 2017-11-16 | 2021-02-12 | グローバル・ライフ・サイエンシズ・ソリューションズ・ユーエスエー・エルエルシー | 単一チャネル全細胞セグメンテーションのためのシステム及び方法 |
| JP2021018531A (ja) * | 2019-07-18 | 2021-02-15 | 富士フイルム株式会社 | 機械学習モデルの運用装置とその作動方法および作動プログラム、並びに機械学習モデルの学習装置とその作動方法および作動プログラム |
| JP2021064115A (ja) * | 2019-10-11 | 2021-04-22 | 株式会社島津製作所 | 細胞画像解析方法及び細胞解析装置 |
| JP2021515240A (ja) * | 2018-04-12 | 2021-06-17 | グーグル エルエルシーGoogle LLC | 定量的バイオマーカデータのオーバレイを有する病理学用拡張現実顕微鏡 |
| JP2021152692A (ja) * | 2020-03-24 | 2021-09-30 | 国立大学法人埼玉大学 | 教師データ生成装置、教師データ生成用プログラム、画像認識装置、及び画像認識用プログラム |
-
2022
- 2022-07-28 WO PCT/JP2022/029117 patent/WO2023008526A1/ja not_active Ceased
- 2022-07-28 JP JP2023538619A patent/JP7687406B2/ja active Active
Patent Citations (8)
| Publication number | Priority date | Publication date | Assignee | Title |
|---|---|---|---|---|
| JP2021006037A (ja) * | 2014-09-03 | 2021-01-21 | ヴェンタナ メディカル システムズ, インク. | 免疫スコアを計算するためのシステム及び方法 |
| JP2018503906A (ja) * | 2014-12-30 | 2018-02-08 | ベンタナ メディカル システムズ, インコーポレイテッド | イムノスコア計算における共発現解析のためのシステム及び方法 |
| JP2017102898A (ja) * | 2015-09-30 | 2017-06-08 | コニカ ミノルタ ラボラトリー ユー.エス.エー.,インコーポレイテッド | 細胞解析を向上させるための方法及びシステム |
| JP2021503666A (ja) * | 2017-11-16 | 2021-02-12 | グローバル・ライフ・サイエンシズ・ソリューションズ・ユーエスエー・エルエルシー | 単一チャネル全細胞セグメンテーションのためのシステム及び方法 |
| JP2021515240A (ja) * | 2018-04-12 | 2021-06-17 | グーグル エルエルシーGoogle LLC | 定量的バイオマーカデータのオーバレイを有する病理学用拡張現実顕微鏡 |
| JP2021018531A (ja) * | 2019-07-18 | 2021-02-15 | 富士フイルム株式会社 | 機械学習モデルの運用装置とその作動方法および作動プログラム、並びに機械学習モデルの学習装置とその作動方法および作動プログラム |
| JP2021064115A (ja) * | 2019-10-11 | 2021-04-22 | 株式会社島津製作所 | 細胞画像解析方法及び細胞解析装置 |
| JP2021152692A (ja) * | 2020-03-24 | 2021-09-30 | 国立大学法人埼玉大学 | 教師データ生成装置、教師データ生成用プログラム、画像認識装置、及び画像認識用プログラム |
Non-Patent Citations (1)
| Title |
|---|
| BOGACHEV MIKHAIL I.; VOLKOV VLADIMIR YU; KOLAEV GLEB; CHERNOVA LILIYA; VISHNYAKOV INNOKENTII; KAYUMOV AIRAT: "Selection and Quantification of Objects in Microscopic Images: from Multi-Criteria to Multi-Threshold Analysis", BIONANOSCIENCE, vol. 9, no. 1, 18 December 2018 (2018-12-18), Boston , pages 59 - 65, XP036751329, ISSN: 2191-1630, DOI: 10.1007/s12668-018-0588-2 * |
Cited By (1)
| Publication number | Priority date | Publication date | Assignee | Title |
|---|---|---|---|---|
| WO2025005099A1 (ja) * | 2023-06-30 | 2025-01-02 | 株式会社レゾナック | 欠陥検査装置、欠陥検査方法及び欠陥検査プログラム |
Also Published As
| Publication number | Publication date |
|---|---|
| JP7687406B2 (ja) | 2025-06-03 |
| JPWO2023008526A1 (https=) | 2023-02-02 |
Similar Documents
| Publication | Publication Date | Title |
|---|---|---|
| JP7428994B2 (ja) | 測定システム | |
| JP7149360B2 (ja) | プレート培地上にストリークされた試料からの自動化された微生物コロニーカウントのための方法及びシステム | |
| CN109791693B (zh) | 用于提供可视化全切片图像分析的数字病理学系统及相关工作流程 | |
| EP3088511B1 (en) | Image processing device, program, information storage medium, and image processing method | |
| WO2021093451A1 (zh) | 病理切片图像的处理方法、装置、系统及存储介质 | |
| US10089518B2 (en) | Graphical user interface for analysis of red blood cells | |
| US10007834B2 (en) | Detection control device, detection system, non-transitory storage medium, and detection control method | |
| EP3859304B1 (en) | Method for generating data for particle analysis, program for generating data for particle analysis, and device for generating data for particle analysis | |
| JP2012026982A (ja) | 検査装置 | |
| US11615520B2 (en) | Information processing apparatus, information processing method of information processing apparatus, and storage medium | |
| JP5718781B2 (ja) | 画像分類装置および画像分類方法 | |
| EP3438987B1 (en) | Tool that analyzes image data and generates and displays a confidence indicator along with a cancer score | |
| US12249129B2 (en) | Machine learning method and information processing apparatus for machine learning | |
| WO2023008526A1 (ja) | 細胞画像解析方法 | |
| JP2019091308A (ja) | 対象物検出器、画像解析装置、対象物検出方法、画像解析方法、プログラム、及び、学習データ | |
| JP7736065B2 (ja) | 細胞画像解析方法 | |
| WO2016092783A1 (en) | Information processing apparatus, method for processing information, discriminator generating apparatus, method for generating discriminator, and program | |
| US12333860B2 (en) | Method for detecting opening and closing of eye, device for detecting opening and closing of eye, and non-transitory computer-readable recording medium recording program for detecting opening and closing of eye | |
| JP7669213B2 (ja) | 画像処理装置、方法及び画像処理システム | |
| WO2023008525A1 (ja) | 細胞画像解析方法 | |
| US20240428412A1 (en) | Cell image analysis system, cell image analysis apparatus and cell image analysis method | |
| JP2013019866A (ja) | 走査電子顕微鏡、欠陥検査システム、および欠陥検査装置 | |
| KR101504248B1 (ko) | 이미지 분석을 이용한 결핵검사 방법 | |
| CN121962119A (zh) | 基于机器视觉的塑料产品缺陷在线检测方法 |
Legal Events
| Date | Code | Title | Description |
|---|---|---|---|
| 121 | Ep: the epo has been informed by wipo that ep was designated in this application |
Ref document number: 22849587 Country of ref document: EP Kind code of ref document: A1 |
|
| WWE | Wipo information: entry into national phase |
Ref document number: 2023538619 Country of ref document: JP |
|
| NENP | Non-entry into the national phase |
Ref country code: DE |
|
| 122 | Ep: pct application non-entry in european phase |
Ref document number: 22849587 Country of ref document: EP Kind code of ref document: A1 |