WO2023008449A1 - Information display method, information display device, and program - Google Patents
Information display method, information display device, and program Download PDFInfo
- Publication number
- WO2023008449A1 WO2023008449A1 PCT/JP2022/028842 JP2022028842W WO2023008449A1 WO 2023008449 A1 WO2023008449 A1 WO 2023008449A1 JP 2022028842 W JP2022028842 W JP 2022028842W WO 2023008449 A1 WO2023008449 A1 WO 2023008449A1
- Authority
- WO
- WIPO (PCT)
- Prior art keywords
- map
- value
- display method
- characteristic
- candidate
- Prior art date
Links
- 238000000034 method Methods 0.000 title claims abstract description 743
- 150000001875 compounds Chemical class 0.000 claims abstract description 748
- 238000012545 processing Methods 0.000 claims description 667
- 239000000203 mixture Substances 0.000 claims description 281
- 238000002474 experimental method Methods 0.000 claims description 147
- 238000000926 separation method Methods 0.000 claims description 24
- 239000011159 matrix material Substances 0.000 claims description 8
- 239000002131 composite material Substances 0.000 claims description 4
- 238000013507 mapping Methods 0.000 claims 2
- 238000011156 evaluation Methods 0.000 description 385
- 238000010586 diagram Methods 0.000 description 163
- 239000000463 material Substances 0.000 description 153
- 230000008859 change Effects 0.000 description 103
- 230000008569 process Effects 0.000 description 100
- 238000010304 firing Methods 0.000 description 73
- 238000004364 calculation method Methods 0.000 description 55
- 230000015654 memory Effects 0.000 description 55
- 238000011161 development Methods 0.000 description 45
- 230000018109 developmental process Effects 0.000 description 45
- 238000003860 storage Methods 0.000 description 39
- 239000013078 crystal Substances 0.000 description 35
- 230000007704 transition Effects 0.000 description 32
- 239000012071 phase Substances 0.000 description 30
- 230000006870 function Effects 0.000 description 26
- 238000010801 machine learning Methods 0.000 description 25
- 239000002994 raw material Substances 0.000 description 24
- 238000012986 modification Methods 0.000 description 23
- 230000004048 modification Effects 0.000 description 23
- 239000000470 constituent Substances 0.000 description 17
- 238000004590 computer program Methods 0.000 description 16
- 239000013598 vector Substances 0.000 description 15
- 229910052774 Proactinium Inorganic materials 0.000 description 14
- 238000004422 calculation algorithm Methods 0.000 description 14
- 229910052745 lead Inorganic materials 0.000 description 14
- 238000005457 optimization Methods 0.000 description 13
- 229910052719 titanium Inorganic materials 0.000 description 13
- 229910052726 zirconium Inorganic materials 0.000 description 13
- 229910052782 aluminium Inorganic materials 0.000 description 12
- 238000004458 analytical method Methods 0.000 description 12
- 238000012512 characterization method Methods 0.000 description 12
- 229910052746 lanthanum Inorganic materials 0.000 description 12
- 239000003086 colorant Substances 0.000 description 10
- 238000007726 management method Methods 0.000 description 10
- 150000004767 nitrides Chemical class 0.000 description 10
- 239000004065 semiconductor Substances 0.000 description 9
- 238000009826 distribution Methods 0.000 description 8
- 230000000694 effects Effects 0.000 description 7
- 238000010587 phase diagram Methods 0.000 description 7
- 238000012800 visualization Methods 0.000 description 7
- 238000005245 sintering Methods 0.000 description 6
- 238000003775 Density Functional Theory Methods 0.000 description 5
- 238000006243 chemical reaction Methods 0.000 description 5
- 230000007423 decrease Effects 0.000 description 5
- 230000006872 improvement Effects 0.000 description 5
- 238000002156 mixing Methods 0.000 description 5
- 238000013528 artificial neural network Methods 0.000 description 4
- 238000005516 engineering process Methods 0.000 description 4
- 229910052733 gallium Inorganic materials 0.000 description 4
- 229910052735 hafnium Inorganic materials 0.000 description 4
- 229910052738 indium Inorganic materials 0.000 description 4
- 238000005259 measurement Methods 0.000 description 4
- 238000003746 solid phase reaction Methods 0.000 description 4
- 229910018068 Li 2 O Inorganic materials 0.000 description 3
- 238000013329 compounding Methods 0.000 description 3
- 238000009792 diffusion process Methods 0.000 description 3
- 239000006185 dispersion Substances 0.000 description 3
- 230000004044 response Effects 0.000 description 3
- 238000012552 review Methods 0.000 description 3
- 230000002194 synthesizing effect Effects 0.000 description 3
- 230000015572 biosynthetic process Effects 0.000 description 2
- 238000004891 communication Methods 0.000 description 2
- 238000005401 electroluminescence Methods 0.000 description 2
- 239000000284 extract Substances 0.000 description 2
- 150000002500 ions Chemical class 0.000 description 2
- 239000003550 marker Substances 0.000 description 2
- 238000000329 molecular dynamics simulation Methods 0.000 description 2
- 238000012827 research and development Methods 0.000 description 2
- 239000007787 solid Substances 0.000 description 2
- 239000000126 substance Substances 0.000 description 2
- 238000003786 synthesis reaction Methods 0.000 description 2
- 238000012935 Averaging Methods 0.000 description 1
- 229910020604 KF—LiF Inorganic materials 0.000 description 1
- HBBGRARXTFLTSG-UHFFFAOYSA-N Lithium ion Chemical compound [Li+] HBBGRARXTFLTSG-UHFFFAOYSA-N 0.000 description 1
- 238000002441 X-ray diffraction Methods 0.000 description 1
- 238000005034 decoration Methods 0.000 description 1
- 230000003247 decreasing effect Effects 0.000 description 1
- 238000000113 differential scanning calorimetry Methods 0.000 description 1
- 230000007613 environmental effect Effects 0.000 description 1
- -1 etc. Substances 0.000 description 1
- 238000007667 floating Methods 0.000 description 1
- 230000012447 hatching Effects 0.000 description 1
- 230000010354 integration Effects 0.000 description 1
- 239000010416 ion conductor Substances 0.000 description 1
- 239000004973 liquid crystal related substance Substances 0.000 description 1
- 229910001416 lithium ion Inorganic materials 0.000 description 1
- 238000004519 manufacturing process Methods 0.000 description 1
- 238000002844 melting Methods 0.000 description 1
- 230000008018 melting Effects 0.000 description 1
- 238000003058 natural language processing Methods 0.000 description 1
- 230000000737 periodic effect Effects 0.000 description 1
- 238000007637 random forest analysis Methods 0.000 description 1
- 238000012216 screening Methods 0.000 description 1
- 239000007784 solid electrolyte Substances 0.000 description 1
- 238000010532 solid phase synthesis reaction Methods 0.000 description 1
- 238000012360 testing method Methods 0.000 description 1
- 230000000007 visual effect Effects 0.000 description 1
Images


Classifications
-
- G—PHYSICS
- G16—INFORMATION AND COMMUNICATION TECHNOLOGY [ICT] SPECIALLY ADAPTED FOR SPECIFIC APPLICATION FIELDS
- G16C—COMPUTATIONAL CHEMISTRY; CHEMOINFORMATICS; COMPUTATIONAL MATERIALS SCIENCE
- G16C20/00—Chemoinformatics, i.e. ICT specially adapted for the handling of physicochemical or structural data of chemical particles, elements, compounds or mixtures
- G16C20/80—Data visualisation
Definitions
- the present disclosure relates to technology for displaying information about compounds.
- Patent Document 1 discloses a method of displaying material properties on a triangular phase diagram when the structure of the composition formula is changed.
- Patent Literature 2 discloses a method of displaying characteristics by arranging a plurality of data represented by pie charts in a matrix.
- Patent Document 3 discloses a method of inputting a huge number of blending ratios of raw materials and outputting a blending ratio having target properties.
- Patent Document 4 discloses a method of two-dimensionally displaying multiple materials by changing markers according to prediction accuracy or material properties.
- Non-Patent Document 1 discloses a method of predicting the thermodynamic stability of perovskite-based materials using a neural network.
- Non-Patent Document 2 discloses a method for predicting the probability value that a compound exhibits high ionic conductivity.
- Non-Patent Document 3 discloses a method for calculating the diffusion coefficient of ions.
- Non-Patent Document 4 discloses a method of optimizing material properties and constructing a phase diagram using Bayesian optimization.
- the present disclosure solves the above problems, and provides an information display method and the like that can appropriately support material development.
- a property prediction value of each of a plurality of compounds is acquired, and a property of the compound is placed at a position corresponding to each configuration of the plurality of compounds. generating a map indicating predicted values, superimposing candidate points indicating respective configurations of one or more candidate compounds on positions on the map corresponding to configurations of the candidate compounds, and An image including the superimposed map is generated and output, and the candidate compound is a candidate compound for the experiment among the plurality of compounds each having the property prediction value indicated on the map.
- these general or specific aspects may be realized in a system, an integrated circuit, or a recording medium such as a computer-readable CD-ROM, an apparatus, system, method, integrated circuit, computer program and Any combination of recording media may be used.
- the recording medium may be a non-temporary recording medium.
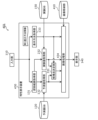
- FIG. 1 is a block diagram showing an example of the configuration of a display system according to Embodiment 1A.
- FIG. 2 is a diagram showing an example of a search range according to Embodiment 1A.
- FIG. 3 is a diagram showing an example of a composition formula represented by a combination of option data according to Embodiment 1A.
- FIG. 4 is a diagram showing an example of a property prediction value of each compound in Embodiment 1A.
- FIG. 5A is a diagram showing an example of a map according to Embodiment 1A.
- FIG. 5B is a diagram showing an example of a map according to Embodiment 1A.
- FIG. 5C is a diagram showing an example of a map according to Embodiment 1A.
- FIG. 5A is a block diagram showing an example of the configuration of a display system according to Embodiment 1A.
- FIG. 2 is a diagram showing an example of a search range according to Embodiment 1A.
- FIG. 6 is a diagram showing another example of the map in Embodiment 1A.
- FIG. 7A is a diagram showing another example of a map according to Embodiment 1A.
- FIG. 7B is a diagram showing another example of a map according to Embodiment 1A.
- FIG. 7C is a diagram showing another example of a map according to Embodiment 1A.
- FIG. 7D is a diagram showing another example of a map according to Embodiment 1A.
- FIG. 8 is a diagram showing another example of a map according to Embodiment 1A.
- FIG. 9A is a diagram showing another example of a map according to Embodiment 1A.
- FIG. 9B is a diagram showing another example of the map in Embodiment 1A.
- FIG. 9A is a diagram showing another example of a map according to Embodiment 1A.
- FIG. 9B is a diagram showing another example of the map in Embodiment 1A.
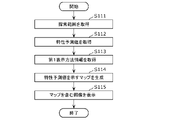
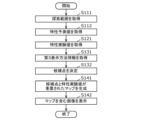
- FIG. 10 is a flowchart showing processing operations of the display system according to Embodiment 1A.
- FIG. 11 is a diagram showing an example of a map in modification 1 of embodiment 1A.
- FIG. 12 is a diagram showing an example of process variables in Modification 2 of Embodiment 1A.
- 13 is a block diagram showing an example of a configuration of a display system according to Embodiment 1B.
- FIG. 14 is a diagram showing an example of experimental data stored in an experimental database according to Embodiment 1B.
- FIG. FIG. 15 is a diagram showing an example of a map according to Embodiment 1B.
- FIG. 16 is a diagram showing another example of the map according to Embodiment 1B.
- FIG. 11 is a diagram showing an example of a map in modification 1 of embodiment 1A.
- FIG. 12 is a diagram showing an example of process variables in Modification 2 of Embodiment 1A.
- 13 is a block diagram showing an example of a configuration of a
- FIG. 17 is a diagram showing another example of a map according to Embodiment 1B.
- FIG. 18 is a diagram showing another example of the map according to Embodiment 1B.
- FIG. 19 is a diagram showing another example of the map according to Embodiment 1B.
- 20A is a diagram showing another example of a map according to Embodiment 1B.
- FIG. 20B is a diagram showing another example of the map in Embodiment 1B.
- FIG. 21 is a diagram showing another example of a map according to Embodiment 1B.
- 22A is a diagram showing another example of a map according to Embodiment 1B.
- FIG. 22B is a diagram showing another example of the map in Embodiment 1B.
- FIG. 22A is a diagram showing another example of the map in Embodiment 1B.
- FIG. 22C is a diagram showing another example of the map in Embodiment 1B.
- FIG. 23 is a flowchart showing processing operations of the display system according to Embodiment 1B.
- FIG. 24A is a diagram showing an example of an image map in the modification of Embodiment 1B.
- FIG. 24B is a diagram showing another example of the image map in the modification of Embodiment 1B.
- FIG. 25 is a block diagram showing an example of a configuration of a display system according to Embodiment 2A.
- FIG. FIG. 26 is a diagram showing an example of an image element map on which candidate points are superimposed according to Embodiment 2A.
- FIG. 27 is a diagram showing another example of an image element map on which candidate points are superimposed according to Embodiment 2A.
- FIG. 28 is a diagram showing another example of an image element map on which candidate points are superimposed according to Embodiment 2A.
- FIG. 29 is a diagram showing another example of an image element map on which candidate points are superimposed according to Embodiment 2A.
- FIG. 30 is a diagram showing another example of an image element map on which candidate points are superimposed according to Embodiment 2A.
- FIG. 31 is a diagram showing another example of an image element map on which candidate points are superimposed according to Embodiment 2A.
- FIG. 32 is a diagram showing another example of an image element map on which candidate points are superimposed according to Embodiment 2A.
- 33 is a flowchart showing processing operations of the display system according to Embodiment 2A.
- FIG. 34 is a diagram showing an example of an image map in the modification of Embodiment 2A.
- FIG. 35 is a diagram showing another example of the image map in the modified example of Embodiment 2A.
- FIG. 36 is a diagram showing another example of the image map in the modification of Embodiment 2A.
- 37 is a block diagram showing an example of a configuration of a display system according to Embodiment 2B.
- FIG. FIG. 38 is a diagram showing an example of an image element map on which candidate points and characteristic experimental values are superimposed according to Embodiment 2B.
- FIG. 39 is a diagram showing another example of an image element map on which candidate points and characteristic experimental values are superimposed according to Embodiment 2B.
- FIG. 40 is a diagram showing an example of state transition of an image element map according to Embodiment 2B.
- FIG. 41 is a diagram showing another example of state transition of the image element map in Embodiment 2B.
- 42 is a flowchart showing processing operations of the display system according to Embodiment 2B.
- FIG. 43 is a block diagram showing an example of a configuration of a display system according to a modification of Embodiment 2B.
- FIG. 44 is a diagram showing an example of history of characteristic display images in the modification of Embodiment 2B.
- 45 is a block diagram showing an example of a configuration of a display system according to Embodiment 2C.
- FIG. 46 is a diagram showing an example of candidate point data stored in a candidate point database according to Embodiment 2C.
- FIG. FIG. 47 is a diagram showing an example of an image element map on which candidate points and characteristic experimental values are superimposed according to Embodiment 2C.
- 48 is a flowchart showing processing operations of the display system according to Embodiment 2C.
- FIG. 49 is a block diagram showing an example of a configuration of a display system according to Embodiment 3A.
- FIG. 50 is a diagram showing an example of information stored in an evaluation display database according to Embodiment 3A.
- FIG. 51 is a diagram showing an example of each data stored in an experiment database according to Embodiment 3A.
- FIG. 52 is a diagram showing an example of compound basic data in Embodiment 3A.
- FIG. 53 is a diagram showing an example of compound detailed data in Embodiment 3A.
- FIG. 54 is a diagram showing an example of a map according to Embodiment 3A.
- FIG. 55 is a diagram showing another example of a map according to Embodiment 3A.
- FIG. 56 is a diagram showing a legend of the map in FIG. 55 and the like.
- 57A is a diagram for explaining an example of image transition accompanying a change in calculation method information according to Embodiment 3A.
- FIG. 57B is a diagram for explaining an example of image transition accompanying a change in calculation method information according to Embodiment 3A.
- FIG. 58A is a diagram for explaining an example of image transition accompanying a change in search range information according to Embodiment 3A.
- FIG. 58B is a diagram for explaining an example of image transition accompanying a change in search range information according to Embodiment 3A.
- FIG. 59A is a diagram for explaining an example of image transition accompanying a change in the first display target information according to Embodiment 3A.
- FIG. 59B is a diagram for explaining an example of image transition accompanying a change in the first display target information according to Embodiment 3A.
- FIG. 60A is a diagram for explaining an example of image transition accompanying a change in display range information according to Embodiment 3A.
- FIG. 60B is a diagram for explaining an example of image transition accompanying a change in display range information according to Embodiment 3A.
- FIG. 61A is a diagram for explaining an example of image transition accompanying a change in search range information according to Embodiment 3A.
- FIG. 61B is a diagram for explaining an example of image transition accompanying a change in search range information according to Embodiment 3A.
- FIG. FIG. 62 is a diagram showing an example of image transition accompanying a change in map arrangement information according to Embodiment 3A.
- 63 is a flowchart showing processing operations of the display system according to Embodiment 3A.
- FIG. 64 is a diagram showing an example of the first image in the modification of Embodiment 3A.
- FIG. 64 is a diagram showing an example of the first image in the modification of Embodiment 3A.
- FIG. 65 is a diagram showing another example of the first image in the modification of Embodiment 3A.
- FIG. 66 is a flowchart illustrating a detailed example of generation of the first image by the image processing unit according to the modification of Embodiment 3A;
- FIG. 67 is a block diagram showing an example of a configuration of a display system according to Embodiment 3B.
- FIG. 68 is a diagram showing an example of information stored in an experiment display database according to Embodiment 3B.
- FIG. 69A is a diagram for explaining an example of image transition accompanying a change in the second display target information according to Embodiment 3B.
- FIG. 69B is a diagram for explaining an example of image transition accompanying a change in the second display target information in Embodiment 3B.
- FIG. 70A is a diagram for explaining an example of image transition accompanying a change in display condition information according to Embodiment 3B.
- FIG. 70B is a diagram for explaining an example of image transition accompanying a change in display condition information in Embodiment 3B.
- FIG. 71 is a flowchart showing processing operations of the display system according to Embodiment 3B.
- FIG. 72 is a block diagram showing an example of a configuration of a display system according to Embodiment 3C.
- FIG. 73A is a diagram for explaining an example of image transition accompanying a change in date setting information according to Embodiment 3C.
- FIG. 73B is a diagram for explaining an example of image transition accompanying a change in date setting information according to Embodiment 3C.
- FIG. 74 is a flowchart showing processing operations of the display system according to Embodiment 3C.
- FIG. 75 is a block diagram showing an example of a configuration of a display system according to Embodiment 3D.
- FIG. 76 is a diagram showing an example of information stored in an evaluation display database according to Embodiment 3D.
- FIG. 77 is a diagram showing an example of information stored in an experiment display database according to Embodiment 3D.
- FIG. FIG. 78 is a diagram showing an example of image transition accompanying acquisition of position information in Embodiment 3D.
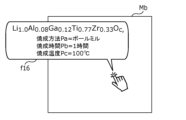
- 79 is a diagram showing an example of a composition image showing a composition formula including coefficients of elements as non-visualized variables, according to Embodiment 3D.
- FIG. 80 is a diagram showing an example of a composition image when process variables are used as non-visualized variables in Embodiment 3D.
- FIG. 81 is a flowchart showing processing operations of the display system in Embodiment 3D.
- Non-Patent Document 1 discloses a method of predicting the thermodynamic stability of perovskite-based materials using a neural network.
- a perovskite-based material is a material represented by a composition formula ABX_3, where A, B, and X are designated as different elements.
- the thermodynamic stability of the composition formula in which a combination of unexplored elements is assigned to each of A, B, and X, or two or more to A (or B, X) It is possible to predict the thermodynamic stability of a composition formula in which the elements are assigned such that the sum of the coefficients is unity. According to this method, the number of labor-intensive experiments can be reduced, and material development can be promoted.
- Non-Patent Document 1 can output a huge number of prediction results, each prediction result is presented individually, so it is difficult to recognize the relationship between each prediction result. is difficult.
- Non-Patent Document 4 discloses a method of optimizing material properties and creating a phase diagram using Bayesian optimization, as described above.
- experimental values are superimposed on a triangular phase diagram together with predicted values as a low melting point composition search or a phase diagram search result in a NaF-KF-LiF system.
- it does not have a function to change the display method.
- Patent Document 1 discloses a method of displaying characteristics on a triangular phase diagram when the structure of the composition formula is changed.
- simply displaying a triangular phase diagram as in Patent Document 1 only presents the properties of the material within the range represented by the compounding ratio of the three elements, that is, the two variables. Therefore, when there are many types of search variables for a compound, it is not possible to display the entire configuration range of the compound to be searched, and it is difficult to recognize the relationship between the properties of the compound.
- Patent Document 2 discloses a method of visualizing characteristics by arranging a plurality of data represented by pie charts in a matrix.
- search variables such as a perovskite-based material
- the entire composition range of the compound to be searched cannot be displayed, and the characteristics of each compound cannot be displayed. It is difficult to recognize the relationship between
- Patent Document 3 discloses a method of inputting a huge number of raw material blending ratios and outputting a blending ratio that has target characteristics.
- Patent Document 3 since the output results are presented locally, it is not possible to display the entire configuration range of the compound to be searched, and it is difficult to recognize the relationship between the properties of the compound. is difficult.
- the marker is changed and displayed according to the compounding ratio, when the composition formula is expressed by multiple variables, there is no disclosure of how to change the marker based on the variables not used for display. It is difficult to grasp the information of variables that are not used in
- Patent Document 4 discloses a method of two-dimensionally displaying multiple materials by changing markers according to prediction accuracy and material properties. However, it only presents the properties of the material within the range represented by the compounding ratio of the three elements, ie, the two variables. Therefore, when there are many types of compound search variables, it is difficult to recognize the overall picture of the properties of the compound. Also, it does not disclose a method of changing the display method according to search variables exceeding two variables. That is, when there are three or more search variables, the predicted values and experimental values cannot be displayed over the entire composition range of the compound to be searched, making it difficult to recognize the relationship between each property of the compound. .
- the property prediction value of each of the plurality of compounds is obtained, and the configuration of each of the plurality of compounds is obtained.
- generating a map indicating the property prediction value of the compound at the position superimposing the candidate points indicating the respective configurations of one or more candidate compounds on the positions on the map corresponding to the configuration of the candidate compound;
- An image including the map on which the above candidate points are superimposed is generated and output, and the candidate compound is regarded as an experiment candidate among the plurality of compounds each having the property prediction value indicated on the map.
- a candidate compound may also be, for example, a compound that is a candidate for testing for properties.
- the information display method in the present disclosure can also be said to be a characteristic display method.
- a map indicating the property prediction value of the compound is acquired at a position corresponding to each configuration of a plurality of compounds, and each configuration of one or more candidate compounds is obtained. outputting an image including the map generated by superimposing the indicated candidate points on the positions on the map corresponding to the configuration of the candidate compound, wherein each of the candidate compounds corresponds to the property prediction indicated on the map; A candidate compound for experimentation of said plurality of compounds having a value. Even with such an information display method, the same effect as described above can be obtained.
- display method information indicating a display method of the candidate points is further obtained, and in superimposing the candidate points, one or more of the candidate points are superimposed on the map according to the display method information.
- the candidate points are superimposed on the map according to the display method indicated by the display method information, so that the candidate points can be displayed in a manner that suits the purpose of the user's material search according to the setting of the display method. can. As a result, the efficiency of searching for materials can be improved.
- the display method information may indicate, as the display method of the candidate points, that the candidate points are superimposed only on a plurality of predetermined positions on the map.
- the display method information indicates an upper limit number of the candidate points to be superimposed on the map as a display method of the candidate points, and in the superimposition of the candidate points, one or more of the Candidate points may be superimposed on the map.
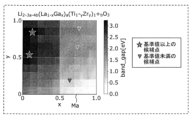
- the display method information indicates a predetermined first minimum separation distance between the plurality of candidate points as a display method of the candidate points.
- a plurality of the candidate points separated by more than the above may be superimposed on the map.
- the display method information may indicate, as the display method of the candidate points, that the order of experiments on the candidate compounds corresponding to each of the one or more candidate points is displayed as an experimental plan.
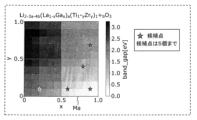
- the display method information includes, among the one or more candidate points, the candidate points having the characteristic prediction value greater than or equal to a reference value indicated at the position on the map where the candidate point is superimposed, and the remaining candidate points.
- the method of displaying the candidate points may be to display the candidate points in a more emphasized manner.
- the reference value may be an average value or median value of predicted property values of the plurality of compounds, or a value specified by a user.
- the user can easily find a candidate point showing a characteristic predicted value equal to or greater than the reference value from one or more candidate points superimposed on the map.
- the efficiency of searching for materials can be improved.
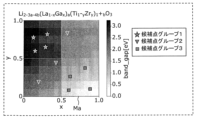
- the display method information classifies each of the one or more candidate points into one of a plurality of groups according to the priority of the candidate point, and is associated with the group.
- the method of displaying the candidate points may be to superimpose a mark of the form of being on the map.
- the priority of a candidate point may be, for example, the property prediction value indicated at that candidate point.
- the user can easily grasp the group to which each candidate point superimposed on the map belongs, that is, the feature of the candidate point belonging to the group, for example, whether the priority is high, medium, or low. .
- the efficiency of searching for materials can be improved.
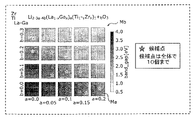
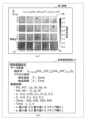
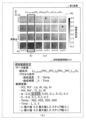
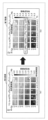
- the map includes a plurality of image element maps arranged in a matrix along each of the first coordinate axis and the second coordinate axis, each of the plurality of image element maps along the third coordinate axis and the fourth coordinate axis.
- the first coordinate axis, the second coordinate axis, the third coordinate axis, and the fourth coordinate axis are used to express the composition of the compound.
- Three variables and a fourth variable are associated with each other, and for each of the plurality of compounds, the value of the first variable and the second identifying an image element map associated with the value of the variable, and determining the value of the third variable and the value of the fourth variable used to represent the composition of the compound on the characterized image element map; The corresponding position may be mapped to the property predictive value of the compound.
- the map can indicate the predicted property values for the configurations of multiple compounds each represented by four variables, and can display the predicted property values of compounds in a wide range in an easy-to-understand manner. As a result, the efficiency of searching for materials can be improved.
- the display method information indicates the number of the candidate points to be superimposed on each of the plurality of image element maps as the display method of the candidate points.
- the number of candidate points indicated by the display method information may be superimposed on each of them.
- the candidate points can be evenly superimposed on the multiple image element maps included in the map.
- the user can easily confirm the widely distributed candidate points on the map.
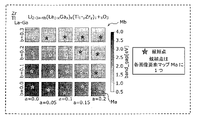
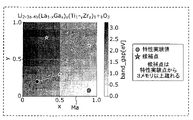
- the characteristic experimental value of each of the one or more compounds that have been experimented is obtained, and the characteristic experimental value of each of the one or more compounds that has been experimented is added to the composition of the compound.
- the image may be superimposed on the corresponding positions on the map, and in generating the image, the image includes the map superimposed with one or more of the candidate points and one or more of the characteristic experimental values.
- the display method information indicates a predetermined second minimum separation distance between the candidate point and the position of the characteristic experimental value as a display method of the candidate point
- superimposing the candidate point includes: The one or more candidate points may be superimposed on the map at a distance equal to or greater than the second minimum separation distance from each position of the one or more characteristic experimental values that have been obtained.
- the acquisition of the characteristic experimental value is repeatedly executed, and when a new characteristic experimental value is acquired, all of the characteristic experimental values superimposed on the map
- the one or more already superimposed candidate points may be updated such that the candidate points are at least the second minimum separation distance from the position of the new characteristic experimental value.
- the characteristic predicted value is obtained, the map is generated, the display method information is obtained, the characteristic experimental value is obtained, the candidate points are superimposed, the characteristic experimental value is superimposed, and After the image generation is repeatedly executed, a plurality of images generated in the repeatedly executed image generation may be read from a recording medium, and a composite image including the plurality of images may be generated and output. .
- one or more candidate points are obtained from a database storing candidate point data indicating the composition of a compound, and the obtained one or more candidate points are added to the map. May be superimposed.
- the candidate points are obtained from a database such as a candidate point database, the candidate points can be superimposed on the map regardless of the property prediction values of each of the multiple compounds. Therefore, it is possible to display on the map the candidate points that are preliminarily important. As a result, the efficiency of searching for materials can be improved.
- one or more of the candidate points are determined based on the property prediction values of each of the plurality of compounds, and the determined one or more of the candidate points are superimposed on the map.
- the candidate points are determined based on the predicted property value of each of the compounds, so that the best property predicted value, such as the maximum property predicted value, the minimum property predicted value, or the property predicted value closest to the target value, is determined. Locations where property prediction values are indicated can be determined as candidate points. Therefore, it is possible to further improve the efficiency of searching for materials.
- a plurality of variables used to express the composition of the compound and, for each of the plurality of variables, a plurality of option data indicating possible values or elements of the variables are acquired. and, in obtaining the predicted characteristic value, for each combination of option data obtained by selecting one option data from the plurality of option data for each of the plurality of variables, a configuration corresponding to the combination is provided.
- a property prediction value for a compound having a compound may be obtained. For example, in obtaining the predicted property value, for each combination, the predicted property value of a compound having a structure corresponding to the combination may be obtained using a predetermined algorithm.
- Each process or operation included in the information display method is executed by an information display device or a computer.
- an information display device or computer includes a processor and a computer-readable non-transitory recording medium.
- the recording medium is, for example, a memory, and stores a program for causing the processor to execute each process or each operation included in the information display method.
- the processor reads the program from the recording medium and executes it. Thereby, each process or each operation included in the information display method is executed.
- each figure is a schematic diagram and is not necessarily strictly illustrated. Moreover, in each figure, the same code
- Embodiments 1, 2 and 3 includes Embodiments 1A and 1B.
- Embodiment 2 includes embodiments 2A, 2B and 2C, and embodiment 3 includes embodiments 3A, 3B, 3C and 3D.
- each embodiment will be described in order.
- the display system displays the property prediction values of each of a plurality of compounds in the form of a map.
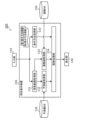
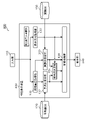
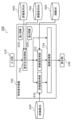
- FIG. 1 is a block diagram showing an example of the configuration of a display system 100 according to this embodiment.
- the input unit 110 receives an input operation by the user and outputs an input signal corresponding to the input operation to the characteristic display device 130 .
- the input unit 110 may be configured as a keyboard, touch sensor, touch pad, mouse, or the like.
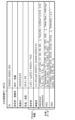
- the predictor database 120 is a recording medium storing predictors, which are computer programs, for example. Specifically, the predictor database 120 stores predictors for predicting characteristic values of a plurality of compounds. The predicted characteristic values are, for example, electrical conductivity, thermal conductivity, bandgap, etc., and are hereinafter also referred to as predicted characteristic values. A predictor is also a computer program based on a predetermined computational algorithm. The predetermined calculation algorithm may be an algorithm obtained by machine learning.
- the predictor database 120 is composed of, for example, non-volatile memory. A predictor outputs a characteristic value of a compound in response to input of data about the compound. The data is, for example, the compositional formula of the compound.
- the predictor may be of any format as long as it can output compound property prediction values.
- the characteristic prediction value output from the predictor may be a value calculated using the predictor described in Non-Patent Document 1 and Non-Patent Document 2, for example.
- Non-Patent Document 1 discloses a technique for predicting the thermodynamic stability of perovskite compounds.
- Non-Patent Document 2 discloses a method for predicting the probability value that a compound exhibits high ionic conductivity. A compound is synonymous with a material.
- the characteristic predicted value output from the predictor may be, for example, a characteristic value calculated by the density functional theory.
- the specification of the crystal structure is necessary for processing the density functional theory.
- the crystal structure may be specified by an input signal from input section 110 .
- the predictor uses the characteristic values of a compound having the same compositional formula as the compound and having a known crystal structure as the compound to be predicted.
- the predictor may be output as a characteristic prediction value of
- the predictor replaces some elements in the compositional formula of the compound to be predicted with other elements to provisionally A typical crystal structure is created, and a compound having the created crystal structure is subjected to density functional theory calculation.
- the predictor may take that crystal structure and perform density functional theory as before.
- the characteristic predicted value output from the predictor may be a characteristic value calculated using a method called Abinitio molecular dynamics (AIMD) described in Non-Patent Document 3, for example.
- AIMD Abinitio molecular dynamics
- Non-Patent Document 3 discloses a method for calculating the diffusion coefficient of ions.
- the characteristic values are not limited to predicted values, and may be experimentally obtained characteristic values such as electrical conductivity and thermal conductivity.
- the predictor database 120 outputs to the predicted value obtaining section 132 a predictor that meets the request of the predicted value obtaining section 132, that is, a predictor that is suitable for predicting the properties of the compound.
- Display unit 140 acquires an image from the property display device 130 and displays the image.
- a display unit 140 is, for example, a liquid crystal display, a plasma display, an organic EL (Electro-Luminescence) display, or the like, but is not limited to these.
- the display unit 140 is, for example, a display unit provided in an information terminal, an information terminal equipped with an electronic experiment notebook, or the like.
- the display unit 140 also includes a synthesis device used to synthesize raw materials or compounds, a reaction device used to react raw materials or compounds, an analysis device used to analyze compounds, and an evaluation device used to evaluate compounds. It may be a display unit provided in a device such as a device.
- the property display device 130 acquires an input signal from the input unit 110 and predicts property values of a plurality of compounds according to the input signal using predictors in the predictor database 120 . Furthermore, the property display device 130 acquires an input signal indicating a display method from the input unit 110 as first display method information, and displays an image showing the predicted property value of each compound as a property prediction value according to the display method. Generate. Then, the property display device 130 outputs the generated image to the display section 140 .
- the characteristic display device 130 includes a search range acquisition section 131 , a predicted value acquisition section 132 , a display method acquisition section 133 and an image processing section 134 .
- the characteristic display device 130 may be composed of a processor such as a central processing unit (CPU) and a memory.
- the processor functions as the characterization device 130, for example by executing a computer program stored in memory.
- the memory may be volatile or nonvolatile, and may be composed of a volatile memory and a nonvolatile memory.
- search range acquisition unit 131 acquires an input signal indicating the compound search range from the input unit 110 . Then, search range obtaining section 131 outputs the input signal to predicted value obtaining section 132 as a search range signal.
- the compound search range is the range of the composition formula, structure, etc. of each compound whose characteristic values are to be predicted.
- the compound to be predicted is a solid electrolyte, and the compositional formula of the compound is represented, for example, by (Equation 1) below.
- the search range acquisition unit 131 acquires each data (that is, option data to be described later) that each of the variables a, b, x, y, M3, M3', M4, and M4' of (Formula 1) can take as a search range. .
- FIG. 2 is a diagram showing an example of a search range.
- the search points included in the search range are represented by one or more data specified in advance (for example, elements Li and O and their coefficients) and one or more range variables, and for each of all range variables A compositional formula is indicated when a value or element is specified. That is, given a value or element for each of all range variables, the data representation presented using those range variables represents one composition or formula of the compound.
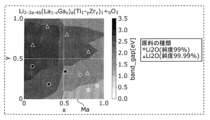
- the data representation is, for example, Li 2-3a-4b (M3 1-x M3′ x ) a (M4 1-y M4′ y ) 1+b O 3 shown in Equation 1 above and FIG.
- a range variable is also called a search variable or simply a variable.
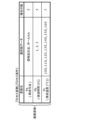
- Range variables include categorical variables, discrete variables, and continuous variables.
- a categorical variable indicates the types of elements that make up the compound.
- categorical variables are variables M3, M3', M4, M4'.
- Each of the variables M3 and M3' can take any one of the four option data "La, Al, Ga, In”.
- Each of the variables M4 and M4' can take any one of the three option data "Ti, Zr, Hf”.
- Li and O are elements fixed in advance and do not correspond to categorical variables.
- a discrete variable represents a numerical value for determining the composition ratio of a compound.
- Numerical values of a plurality of option data that can be taken for discrete variables exist discretely from each other. Also, the number of option data in discrete variables is smaller than in continuous variables.
- the discrete variables are variables a and b for determining the coefficients of the elements, respectively.
- a continuous variable indicates a numerical value for determining the composition ratio of a compound.
- the number of option data in the continuous variable is, for example, larger than that of the discrete variable and the categorical variable, and is suitable for detailed analysis of changes in characteristic values with respect to changes in option data. In addition, it is desirable that the number of option data in the continuous variable is five or more.
- the 11 option data of continuous variables are expressed using a minimum value of 0.0, a maximum value of 1.0, and a step width of 0.1. 0.1, 0.2, 0.3, . . . , 1.0”.
- the continuous variable may be set such that the step width is smaller than 0.1 so that the search data such as the predicted characteristic value changes more continuously. Examples of smaller step sizes are 0.01, 0.001, and so on.
- a continuous variable may be specified by the user.
- the user may specify that each of the search variables x and y should be a continuous variable.
- the minimum and maximum values of the search variables x and y may be specified by the user, and the step widths of the search variables x and y may use values stored in advance in the characteristic display device 130. .
- the ratios of M3 and M3' represented by the continuous variable x have a negative correlation such that changing the ratio of one changes the ratio of the other.
- the ratios of M4 and M4' represented by the continuous variable y have a negative correlation such that changing one ratio changes the other ratio.
- variables M3, M3', M4, M4', a, b, x, and y are expressed as follows using option data.
- a combination is obtained.
- a combination of such option data uniquely expresses a compositional formula, which is a composition of a compound.
- search range described above is a range that includes all combinations of these, and it can be said that the search points described above mean one combination or the composition of a compound.
- a combination of option data that can be taken by each of a plurality of variables is hereinafter also referred to as a combination of a plurality of variables.
- a combination of option data that variables x and y can take is also called a combination of variables x and y.
- search points are generated by changing the values or elements specified for these range variables, various search points are generated, and a set of these represents the search range.
- the predicted value obtaining section 132 obtains the search range signal from the search range obtaining section 131 . Then, the predicted value acquisition unit 132 generates all possible combinations of option data for each of the plurality of variables included in the search range indicated by the search range signal. The compositional formula of the compound is expressed by the combination. Therefore, a plurality of compositional formulas or configurations are generated according to their combination.
- FIG. 3 is a diagram showing an example of a composition formula represented by a combination of option data.
- FIG. 3 shows a plurality of composition formulas to be generated and option data for variables M3, M3', M4, M4', a, b, x, and y used for each of the plurality of composition formulas.
- the coefficient of each element included in the composition formula may be indicated by a subscript, or may be indicated by a normal character similar to the character indicating the element. be.
- the predicted value acquisition unit 132 acquires a predictor from the predictor database 120 and inputs a plurality of generated compositional formulas to the predictor, thereby acquiring property predicted values of compounds having those compositional formulas.
- FIG. 4 is a diagram showing an example of the obtained property prediction values of each compound.
- the predicted value acquiring unit 132 acquires, for each of the plurality of compositional formulas generated from the search range, the property predicted value of the compound having that compositional formula, as shown in FIG. 4 (right end in the figure). For each of the plurality of composition formulas, the predicted value acquisition unit 132 associates the composition formula with the property prediction value acquired for the composition formula, and outputs the result to the image processing unit 134 . Note that the output composition formula may be a combination of a plurality of variables described above.
- Display method acquisition unit 133 acquires an input signal indicating the display method from the input unit 110 as first display method information.
- the display method acquisition unit 133 then outputs the first display method information to the image processing unit 134 .
- the display method indicated by the first display method information is a method of displaying the property prediction value of the compound indicated by each composition formula.
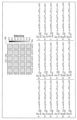
- the image processing unit 134 acquires the compositional formula and property prediction value of each compound from the prediction value acquisition unit 132 for each of the plurality of compounds. Furthermore, the image processing unit 134 acquires first display method information from the display method acquisition unit 133 . Image processing unit 134 generates a map showing property prediction values of a plurality of compounds according to the display method indicated by the first display method information, and displays an image including the map on display unit 140 .
- the image processing unit 134 generates, for example, the map Ma shown in FIG. 5A.
- This map Ma has coordinate axes A1 and A2.
- the coordinate axis A1 is assigned, for example, the continuous variable x
- the coordinate axis A2 is assigned, for example, the continuous variable y.
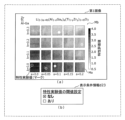
- a cell at each position indicated by each numerical value of the variables x and y in the map Ma is colored according to the predicted property value of the compound containing the respective numerical values of the variables x and y in the composition formula. ing.
- the predicted characteristic value is, for example, a bandgap
- the map Ma is provided with a scale indicating the relationship between the predicted characteristic value and the degree of gradation.
- the display method acquisition unit 133 acquires the first display method information according to the user's input operation on the input unit 110 .
- This first display method information indicates, for example, a variable x assigned to the coordinate axis A1 and a variable y assigned to the coordinate axis A2. Further, the first display method information indicates, as specified option data, option data for variables M3, M3', M4, M4', a and b that are not assigned to the coordinate axes.
- the display method acquisition unit 133 then outputs the first display method information to the image processing unit 134 .
- the image processing unit 134 assigns the variable x to the coordinate axis A1 of the map Ma and assigns the variable y to the coordinate axis A2 of the map Ma according to the first display method information. Further, the image processing unit 134 calculates the property prediction values of the plurality of compounds obtained by the prediction value obtaining unit 132, and extracts each compound whose variables M3, M3′, M4, M4′, a, and b each indicate designated option data. identify the predictive value of the property of Then, the image processing unit 134 assigns the color of the gradation corresponding to the property prediction value of each identified compound to the position on the map Ma indicated by the numerical values of the variables x and y included in the composition formula of the compound. attach to
- the color is black or white, and the larger the property prediction value is, the darker black is attached to the property prediction value on the map Ma.
- a light black color is applied to the map Ma.
- the color may be black or other colors than white.
- the image processing unit 134 may indicate the predicted characteristic value on the map Ma according to the type of color instead of the degree of color density. For example, the image processing unit 134 assigns red to the first largest predicted property value, orange to the second largest predicted property value, yellow to the third largest predicted property value, and yellow to the fourth largest predicted property value.
- a value may be assigned the color white, the 5th highest property prediction value may be assigned a yellow-green color, the 6th highest property prediction value may be assigned light blue, and the 7th highest property prediction value may be assigned a blue color. Then, the image processing unit 134 may add a color assigned to the magnitude of the property prediction value acquired from the prediction value acquisition unit 132 to the map Ma. In this case, the map Ma is displayed like a heat map.
- variables other than the variables x and y that is, variables M3, M3′, M4, M4′, a and b not used for the coordinate axes of the map Ma
- Each shows the same option data. That is, the option data for each of the variables M3, M3', M4, M4', a and b are fixed to the specified option data, and the compound property prediction values corresponding to the respective numerical values of the variables x and y are displayed on the map Ma. Is displayed.
- combinations of option data for variables M3, M3', M4, M4', a and b are fixed.
- Variables used for the coordinate axes of the map Ma may be called variable variables or visualization variables, and variables not used for the coordinate axes of the map Ma, such as variables M3 and M4, are fixed variables. , non-visualized variables, redundant variables, or non-utilized variables.
- the map Ma in this embodiment is also called an image element map Ma.
- the image processing unit 134 may interpolate the property prediction values and display a map Ma showing the interpolated property prediction values on the display unit 140, as shown in FIG. 5B. That is, the image processing unit 134 processes 11 numerical values "0.0, 0.1, 0.2, ..., 10.0" of the variable x and 11 numerical values "0.0, 0 .1, 0.2, .
- the image processing unit 134 may interpolate the property prediction value using, for example, linear interpolation, bilinear interpolation, bicubic interpolation, or the like.
- the numerical range of the continuous variable x assigned to the coordinate axis A1 and the numerical range of the continuous variable y assigned to the coordinate axis A2 are equal. That is, the numerical range of the continuous variables x and y is the range from the minimum value of 0.0 to the maximum value of 1.0. Therefore, the shape of the map Ma shown in FIGS. 5A and 5B is square. However, the shape of the map Ma depends on how the coordinate axes of the map Ma are assigned, and may have other shapes.
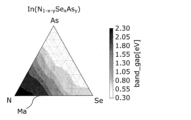
- the shape of the map Ma may be rectangular, or triangular as shown in FIG. 5C.
- a triangular map Ma is displayed showing the property prediction values of a compound having the composition formula of IN(N 1-xy Se x As y ).
- 5A and 5B in the cell at each position indicated by the respective numerical values of the variables x and y in the map Ma, the property prediction value of the compound containing the respective numerical values of the variables x and y in the composition formula It is colored with a degree of gradation according to the
- the characteristic display device 130 in the present embodiment includes the predicted value acquiring section 132, the display method acquiring section 133, and the image processing section .
- the predicted value acquiring unit 132 acquires a property predicted value of each of a plurality of compounds.
- the display method acquisition unit 133 acquires first display method information indicating the display method of the predicted characteristic value.
- the image processing unit 134 generates a map Ma indicating property prediction values of each of the plurality of compounds according to the first display method information. Furthermore, the image processing unit 134 generates and outputs an image including the map Ma.
- the map Ma has coordinate axes respectively indicating at least two variables out of a plurality of variables used to express the composition of the compound. For example, the image described above is output to and displayed on the display unit 140 .
- the first display method information is acquired, and a map Ma showing the property prediction values of each of the plurality of compounds is generated according to the display method indicated by the first display method information.
- the display method indicated by the first display method information is set in accordance with the purpose of searching for new materials, searching for new materials by displaying an image including the generated map Ma, That is, it is possible to appropriately support material development.
- the map Ma has the coordinate axes described above, it is possible to indicate the property prediction values of the compound at positions corresponding to the respective configurations of the plurality of compounds.
- the property prediction values of many compounds to be searched are displayed as a map Ma, the property prediction values can be appropriately visualized, and the user can easily understand the structure of the compound and the property prediction values. Relations can be easily recognized. In other words, the user can easily grasp the overall picture of the characteristic prediction values in the map Ma.
- the search for new materials or new compounds is also called material search.
- the characteristic display device 130 does not have to include the display method acquisition unit 133 .
- the image processing unit 134 outputs an image including the map Ma generated using the acquired property prediction values.
- the map Ma has coordinate axes each indicating at least two variables used to express the composition of the compound, and is a map indicating the property prediction values of each of the plurality of compounds. Even with such a characteristic display device 130, the same effect as described above can be obtained.
- the first display method information indicates at least one of a method of determining a color for indicating the predicted characteristic value and a method of determining a display format for indicating the predicted characteristic value as a method of displaying the predicted characteristic value. good too.
- the color determination method determines the color corresponding to the property prediction value
- the display format determination method determines the color density corresponding to the property prediction value.
- the image processing unit 134 in the present embodiment generates a map Ma indicating the color or the degree of color gradation according to the property prediction value of each compound for each of the plurality of compounds.
- the predicted property value of each compound is indicated by the color or the degree of color gradation according to the predicted property value, so that the user can easily grasp the magnitude of the predicted property value.
- the user can easily grasp the difference in property prediction values between compounds having similar configurations.
- the characteristic display device 130 in the present embodiment includes a search range acquisition section 131.
- the search range acquisition unit 131 acquires a plurality of variables used to express the composition of a compound, and a plurality of option data indicating possible values or elements for each of the plurality of variables. Then, for each combination of option data obtained by selecting one option data from a plurality of option data for each of the plurality of variables, the predicted value acquisition unit 132 selects a compound having a configuration corresponding to the combination. Get the property prediction value of .
- the search range acquiring unit 131 acquires, for each of the above combinations, the property prediction value of the compound having the configuration corresponding to the combination using a predetermined algorithm.
- the predetermined algorithm is a predictor stored in predictor database 120 .
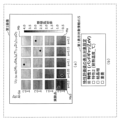
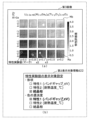
- FIG. 6 is a diagram showing another example of the map Ma.
- the image processing unit 134 may discretize the property prediction values and assign colors to the map Ma with gradation levels corresponding to the discretized property prediction values. For example, the image processing unit 134 discretizes the characteristic prediction values "0.5 to 4.0" at intervals of 0.25. Therefore, if the characteristic predicted value obtained from the predicted value obtaining section 132 is, for example, 0.7, the image processing section 134 replaces the characteristic predicted value with, for example, 0.75.
- the display method acquiring unit 133 acquires an input signal indicating the discretization of characteristic prediction values and their intervals from the input unit 110 as the first display method information, and outputs the first display method information to the image processing unit 134. do.
- the image processing unit 134 discretizes the property predicted value of each compound obtained from the predicted value obtaining unit 132 according to the first display method information.
- the image processing unit 134 in the present embodiment discretizes the property prediction values and generates the map Ma indicating the discretized property prediction values.
- the map Ma is not limited to being colored according to the acquired characteristic prediction value itself, but as shown in FIG.
- the color of degrees may be attached to the map Ma.
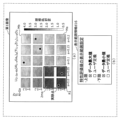
- FIG. 7A to 7D are diagrams showing other examples of the map Ma.
- the image processing unit 134 sets a lower gradation for the property prediction value as the property prediction value is closer to the reference value, and sets a lower gradation for the property prediction value as the property prediction value is farther from the reference value.
- a high degree of gradation may be set for the characteristic predicted value.
- the display method acquisition unit 133 acquires first display method information indicating a reference value from the input unit 110 and outputs the first display method information to the image processing unit 134 .
- the image processing unit 134 sets the gradation for the property prediction value according to the reference value indicated by the first display method information.
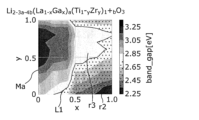
- the reference value is a value within the range of 2.65-2.85 [eV].
- a low gradation means a light color
- a high gradation means a dark color.
- the image processing unit 134 may set the same series of colors for the predicted characteristic values when the predicted characteristic value is larger than the reference value and when the predicted characteristic value is smaller than the reference value. good. For example, as in the example shown in FIG. 7A, property prediction values exceeding 2.85 [ev] are greater than the reference value, and property prediction values less than 2.65 [ev] are smaller than the reference value.
- the region r1 in which the characteristic predicted value exceeding 2.85 [ev] is indicated and the region r2 in which the characteristic predicted value of less than 2.65 [ev] are indicated are of the same system. It can be color.
- the image processing unit 134 sets colors of different systems for the characteristic prediction values when the characteristic prediction value is larger than the reference value and when the characteristic prediction value is smaller than the reference value.
- the region r1 in which the characteristic predicted value exceeding 2.85 [ev] is indicated is indicated by a reddish color, and the characteristic predicted value of less than 2.65 [ev] is indicated.
- the region r2 may be indicated by a blue-based color.
- the image processing unit 134 sets a predetermined white color for an area in which a predicted characteristic value equal to the reference value is indicated.
- the color set for that area is not limited to white, and may be another color such as red.
- the predicted characteristic value may or may not be discretized as in the example of FIG. When the characteristic prediction values are discretized, a plurality of regions in the map Ma are displayed as being separated by contour lines, for example.
- the image processing unit 134 may, as shown in FIG. 7B, hatch a predetermined pattern on the area r2 in which the predicted characteristic value smaller than the reference value is indicated in the map Ma.
- the pattern may be a pattern of stripes, or a pattern of dots, as in the example of FIG. 7B. That is, the image processing section 134 may superimpose a plurality of dots on the region r2. Further, the image processing unit 134 may superimpose only a plurality of dots on the area r2 instead of the color with the degree of gradation according to the predicted characteristic value.
- the image processing unit 134 may superimpose the contour line L1 corresponding to the reference value on the map Ma, as shown in FIG. 7C.
- the contour line L1 is superimposed on the boundary between the region r3 where the property prediction value is within the range of the reference value and the region r2 where the property prediction value is below the range.
- the image processing unit 134 may superimpose the contour lines L1 on the map Ma without superimposing a plurality of dots on the map Ma, or may superimpose only the contour lines L1 on the map Ma. Thereby, the user can easily grasp the area of the characteristic predicted value near the reference value or the area of the characteristic predicted value exceeding the reference value.
- the image processing unit 134 performs a predetermined calculation for a region r4 (striped region in the example of FIG. 7D) in which a property prediction value that does not satisfy the conditions is indicated in the map Ma.
- a certain color or a color with a predetermined gradation may be applied. Its color may be black.
- the image processing unit 134 may hatch a predetermined pattern on the region r4. That is, the image processing unit 134 may superimpose a stripe pattern on the region r2.
- the above condition is, for example, the condition that the predicted characteristic value is equal to or greater than the lower limit value.
- the lower limit is 2.45 [eV] in the example of FIG. 7D.
- the display method acquisition unit 133 acquires the first display method information indicating the condition or the lower limit value from the input unit 110 and outputs the first display method information to the image processing unit 134 .
- the image processing unit 134 generates a map Ma as shown in FIG. 7D, for example, according to the first display method information.
- the region below the lower limit is, for example, a region that does not need to be considered in material search. Therefore, in the example of FIG. 7D, the user can easily comprehend areas that do not need to be considered in the material search.
- the first display method information in the present embodiment indicates at least one of the following (a) to (e) as the display method of the predicted characteristic value.
- (a) is a method of indicating the predicted characteristic value, which is the same as the reference value, on the map Ma using a predetermined color or color density.
- (b) is a method of indicating a characteristic predicted value larger than a reference value in a first system color and indicating a characteristic predicted value smaller than the reference value in a second system color.
- (c) is a boundary between a first region showing the same predicted characteristic value as the reference value and a second region showing a different predicted characteristic value from the reference value on the map Ma. It is a method of superimposing lines.
- (d) shows a third area on the map Ma indicating characteristic predicted values satisfying a predetermined condition, and a fourth area indicating characteristic predicted values not satisfying the predetermined condition on the map Ma.
- This is a method of indicating one of the areas in the area with a predetermined color or color gradation.
- (e) is a method of superimposing a pattern of a plurality of dots or stripes on one of the third area and the fourth area.
- the methods (a) and (b) are the display methods shown in FIGS. 7A to 7C
- the method (c) is the display method shown in FIG. 7C
- the method (d) is the display method shown in FIG.
- the method (e) is the method shown in FIGS. 7B to 7D.
- the boundary line in (c) corresponds to the contour line L1 in FIG. 7C.
- the user can select an area in which a characteristic predicted value equal to the reference value is indicated, an area in which a characteristic predicted value larger or smaller than the reference value is indicated, a boundary between these areas, or a predetermined Areas that satisfy or do not satisfy the conditions can be easily grasped.
- the reference value is indicated by the first display method information.
- the reference value is a value designated by the user through an input operation to the input unit 110 .
- the reference value may be a value determined from the property prediction value.
- the reference value may be the average or median value of all property prediction values shown on the map Ma.
- the reference value in the present embodiment is the average value or median value of the property prediction values of a plurality of compounds, or a value specified by the user.
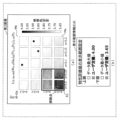
- FIG. 8 is a diagram showing another example of the map Ma.
- the image processing unit 134 may superimpose an arrow indicating the gradient of the property prediction value on the map Ma, as shown in FIG.
- the display method acquisition unit 133 acquires first display method information indicating superimposition of arrows from the input unit 110 and outputs the first display method information to the image processing unit 134 .
- the image processing unit 134 calculates the gradient for the characteristic prediction value at each position on the map Ma according to the first display method information, and superimposes an arrow indicating the gradient on that position.
- the arrow points in the direction of the gradient and has a length proportional to the magnitude of the gradient. As a result, it is possible to easily grasp the magnitude and direction of change in the predicted characteristic value corresponding to each numerical value of the variables x and y.
- the image processing unit 134 in the present embodiment identifies the gradient of the property prediction value shown on the map Ma, and superimposes an arrow indicating the direction and magnitude of the gradient on the map Ma. Accordingly, the user can easily grasp the change of the predicted characteristic value with respect to the variables x and y by looking at the arrows on the map Ma.
- 9A and 9B are diagrams showing other examples of the map Ma.
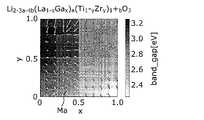
- the image processing unit 134 assigns the best property prediction value among the property prediction values of a plurality of compounds having the same combination of numerical values of the variables x and y to the same combination. It may be indicated at the position on the map Ma to be used.
- the best property prediction value is, for example, the maximum property prediction value.
- the best property prediction value is also called the best value, and may be the smallest property prediction value or the property prediction value that is closest to a predetermined reference value.
- the option data of the variables (M3, M3', M4, M4') included in the respective compositional formulas of the plurality of compounds may be the same or fixed.
- a plurality of compositional formulas are expressed by different combinations of numerical values of the variables (a, b), and the best A property prediction value is determined as the best value.
- the best value (that is, bandgap) at each position on the map Ma exceeds 3.0 [eV].
- the user can adjust the numerical values of the variables a and b regardless of whether the numerical values of the variables x and y are within the numerical range of 0.0 to 1.0. It can be understood that a property prediction value exceeding 3.0 [eV] can be obtained. Therefore, the relationship between the important variables (eg, variables x, y) used for the coordinate axes and the characteristic prediction values is focused on without considering variables (eg, variables a, b) whose values are not so important. The predicted characteristic value can be displayed.
- the image processing unit 134 calculates the average value of the property prediction values of a plurality of compounds having the same combination of numerical values of the variables x and y as map Ma corresponding to the same combination. It may be shown in the upper position.
- the option data of the variables (M3, M3', M4, M4') included in the respective compositional formulas of the plurality of compounds may be the same or fixed.
- a plurality of compositional formulas are expressed by different combinations of numerical values of the variables (a, b), and the average value of the property prediction values of the compound represented by each of the plurality of compositional formulas is calculated. be.
- the image processing unit 134 displays variables a ⁇ ⁇ 0.0, 0.05, 0.1 ⁇ and variables b ⁇ ⁇ 0.0, 0.1, 0.2 ⁇ . , set the numerical ranges of the variables a and b. That is, the image processing unit 134 includes the numerical value and one numerical value before and after the numerical value for each numerical value of the variables a and b indicated by the first display method information in the numerical range.
- a plurality of compositional formulas are expressed by different combinations of numerical values within the respective numerical ranges of the variables a and b, and the average value of the property prediction values of the compound represented by each of the plurality of compositional formulas is Calculated.
- the image processing unit 134 may calculate a differential value, a variance, etc. instead of the average value. Thereby, it is possible to display the predicted characteristic values in consideration of the fluctuation of the predicted characteristic values when the variables a and b are changed, and it is possible to grasp the robustness of the predicted characteristic values.
- the first display method information indicates that the property prediction value is displayed using the unused variable a as a property prediction value display method.
- the property prediction value is displayed using not only the two variables x and y used for the coordinate axes A1 and A2 of the map Ma, but also the unused variable a, thereby appropriately supporting material development. can be done.
- the first display method information in the present embodiment includes, among the plurality of variables, an unused variable a, which is a variable other than the two variables x and y used for the coordinate axes A1 and A2 of the map Ma.
- an unused variable a which is a variable other than the two variables x and y used for the coordinate axes A1 and A2 of the map Ma.
- substituting a first value, a second value, or each numerical value within a predetermined numerical range for the unused variable a is shown as a method of displaying characteristic prediction values.
- a map Ma is generated that indicates property prediction values for each of a plurality of compounds.
- the image processing unit 134 determines the second value so that the property prediction value shown in the map Ma satisfies a predetermined condition.
- a map Ma is generated that indicates the property prediction values of each of the plurality of compounds having the configuration that is expressed using the unused variable a that indicates the second value obtained.
- the image processing unit 134 creates, for each position on the map Ma, two An average value of property prediction values of a plurality of compounds having a configuration expressed using variables x and y is calculated.
- the image processing unit 134 generates, for each position on the map Ma, a map Ma indicating the average value of the characteristic prediction values calculated for that position.
- the non-utilization variable a of each of the plurality of compounds for which the average value of the characteristic prediction values is calculated indicates different numerical values within a predetermined numerical range.
- the non-utilized variable is a variable such as the discrete variable a that is not utilized on the coordinate axes of the map Ma, and is also called an invisible variable. Also, if there is a variable b in addition to the variable a as an unused variable, the first value, the second value, or each numerical value within a predetermined numerical range is substituted for each of the variables a and b. .
- a map Ma shown in FIG. 5A is displayed. That is, in the case of (a) above, the option data of the unused variable such as the discrete variable a is specified or fixed to the first value as the specified option data by the user's input operation to the input unit 110. be. Further, the predetermined condition in the case of (b) above is, for example, the condition under which the predicted characteristic value becomes the above-mentioned best value.
- the user designates the first value as the unused variable, so that the user can arbitrarily select the configuration of the compound having the characteristic predicted value displayed on the map Ma. .
- the map Ma satisfies the conditions required for material search by setting the predetermined conditions to the conditions required for material search, for example, without the user specifying the value of the unused variable. can be easily displayed. As a result, the efficiency of searching for materials can be improved. In other words, it is possible to appropriately support material development.
- the change in the value that the unused variable can take can be reflected in the characteristic predicted value on the map Ma, and the robustness of the characteristic predicted value for the unused variable can be improved. can.
- FIG. 10 is a flow chart showing processing operations of the display system 100 according to the present embodiment.
- Step S111 the search range acquisition unit 131 acquires a search range signal output from the input unit 110 in response to an input operation to the input unit 110 by the user.
- This search range signal is an input signal indicating the search range of a compound as shown in FIG. 2, for example. That is, the search range acquisition unit 131 acquires the search range. Then, search range obtaining section 131 outputs the search range signal to predicted value obtaining section 132 .
- the predicted value acquisition unit 132 acquires the search range signal from the search range acquisition unit 131, and combines the option data of each of the multiple variables according to the search range indicated by the search range signal. For example, all possible combinations within the search range are generated. Then, the predicted value acquisition unit 132 inputs the compositional formulas, ie, the combinations, of the plurality of compounds to the predictors of the predictor database 120, thereby acquiring the property predicted values of those compounds. The predicted value acquisition unit 132 associates the property predicted values of those compounds with the compositional formulas of the compounds and outputs them to the image processing unit 134 .
- the predicted value acquisition unit 132 acquires a predictor from the predictor database 120 and acquires a characteristic predicted value using that predictor.
- the predicted value obtaining unit 132 may obtain predicted property values for each of a plurality of compounds from at least one predictor for predicting property values of compounds stored in the predictor database 120. . Even in this case, appropriate property prediction values can be obtained for each of the plurality of compounds.
- the display method acquisition unit 133 acquires the first display method information output from the input unit 110 according to the input operation to the input unit 110 by the user.
- This first display method information indicates, for example, the method of displaying characteristic prediction values as shown in FIGS. 5A to 9B.
- the display method acquisition unit 133 then outputs the first display method information to the image processing unit 134 .
- Step S114 The image processing unit 134 acquires the property prediction value and composition formula of each compound from the prediction value acquisition unit 132 and acquires the first display method information from the display method acquisition unit 133 . Then, image processing unit 134 generates a map Ma indicating property prediction values of each of the plurality of compounds according to the display method indicated by the first display method information, and displays an image including map Ma on display unit 140. Output.
- Step S115 The display unit 140 acquires an image from the image processing unit 134 and displays the image.
- the property prediction values of the compound, which is the material are displayed, that is, the properties are displayed.
- the coordinate axes of the map Ma use the variables x and y and do not use the variables a and b.
- the image processing unit 134 in this modified example generates a map using not only variables x and y but also variables a and b as coordinate axes.
- FIG. 11 is a diagram showing an example of a map in this modified example.
- the image processing unit 134 generates an image map Mb consisting of an array of a plurality of maps Ma and displays it on the display unit 140, as shown in FIG. In this case, the image processing unit 134 assigns the two variables that have not been assigned to the coordinate axes A1 and A2 of the map Ma to the two coordinate axes A3 and A4 of the image map Mb.
- the variables assigned to the two coordinate axes A3, A4 are, for example, discrete variables a, b.
- map Ma is also called an image element map Ma to distinguish it from the image map Mb.
- image element map Ma and the image map Mb are also simply referred to as maps.
- Discrete variable a has five types of option data: 0.0, 0.05, 0.1, 0.15, and 0.2.
- the continuous variables x, y which have a large number of combinations, are the image elements. It is devised to allocate the discrete variables a and b, which have a small number of combinations, to the coordinate axes of the map Ma and allocate them to the coordinate axes of the array of the image element map Ma.
- Each variable may be assigned arbitrarily by the user, or the image processing unit 134 may calculate the number of combinations and automatically assign each variable.
- the plurality of range variables in the above embodiment includes categorical variables M3, M3', M4, M4', discrete variables a, b, and continuous variables x, y, but also includes other variables. good too.
- the plurality of range variables in this modification includes not only each of the variables described above, but also one or more process variables that indicate conditions used in the process of producing a compound, for example.
- FIG. 12 is a diagram showing an example of process variables in this modified example.
- a process variable is also called a process condition, and includes, for example, a variable Pa that indicates the compound firing method, a variable Pb that indicates the compound firing time, and a variable Pc that indicates the compound firing temperature.
- the variable Pa indicates, for example, the solid phase reaction method, ball mill, etc. as option data.
- the variable Pb indicates, for example, 1 hour, 2 hours, 3 hours, etc. as option data.
- the variable Pc indicates, for example, 100° C., 110° C., 120° C., 130° C., 140° C., 150° C., 160° C., etc. as option data.
- the search range acquisition unit 131 obtains option data that variables M3, M3′, M4, M4′, a, b, x, and y can take, and options that variables Pa, Pb, and Pc can take.
- Get data and The predicted value acquisition unit 132 generates all possible combinations of option data for each of M3, M3', M4, M4', a, b, x, y, Pa, Pb, and Pc.
- the predicted value acquisition unit 132 acquires a predictor from the predictor database 120, and inputs all the generated combinations (that is, compositional formulas and process conditions) into the predictor, thereby Get property predictions.
- compositional formula of the compound, or the compositional formula and process conditions of the compound are hereinafter also referred to as the composition of the compound.
- process variables are not limited to the variables Pa, Pb, and Pc, and may be any variables.
- the image processor 134 may assign one or more of the variables Pa, Pb, and Pc to the coordinate axes of the map Ma or Mb.
- Embodiment 1B As in Embodiment 1A, the display system in the present embodiment displays the predicted property values of each of a plurality of compounds in the form of a map, and superimposes the experimental property values of one or more compounds on the map. do. It should be noted that among the constituent elements in this embodiment, the constituent elements that are the same as those in Embodiment 1A are assigned the same reference numerals as those in Embodiment 1A, and detailed description thereof will be omitted.
- FIG. 13 is a block diagram showing an example of the configuration of display system 200 according to this embodiment.
- a display system 200 shown in FIG. 13 includes an input unit 110 , a predictor database 120 , a characteristic display device 230 , a display unit 140 and an experiment database (DB) 150 .
- the characteristic display device 230 is an example of an information display device.
- the characteristic display device 230 in the present embodiment acquires characteristic experimental values, which are characteristic values of compounds obtained by experiments, from the experimental database 150, generates a map on which the characteristic experimental values are superimposed, and displays the map. Displayed on the display unit 140 .
- Such a characteristic display device 230 includes a search range acquisition section 131 , a predicted value acquisition section 132 , a display method acquisition section 133 , an experimental value acquisition section 232 and an image processing section 234 .
- the characteristic display device 230 may be composed of a processor such as a CPU and a memory, for example. In this case, the processor functions as the characterization device 230, for example by executing a computer program stored in memory.
- the memory may be volatile or nonvolatile, and may be composed of a volatile memory and a nonvolatile memory.
- the experimental database 150 is a recording medium that stores the compositional formula (ie, chemical formula) of a compound, the compound identification information of the compound, and the experimental data representing the characteristic experimental value of the compound.
- this recording medium is, for example, a hard disk drive, a RAM (Random Access Memory), a ROM (Read Only Memory), or a semiconductor memory.
- the recording medium may be volatile or non-volatile. If the search range includes process variables, the experimental data may include experimental process information indicating the process conditions used in the experiment.
- FIG. 14 is a diagram showing an example of experimental data stored in the experimental database 150.
- the experimental data indicates, for each of a plurality of compounds, the compositional formula, compound identification information, and characteristic experimental values of the compound, as in the example of FIG.
- the compound identification information is a so-called ID, and may be information such as a name, a code, or a number that allows the compound to be identified.
- the experimental data includes the compositional formula of the compound " Li1.45La0.045Ti1.1Al0.005O3 ", the ID of the compound " 000001-00001-001 " , and the compound characteristic experimental value (exp.data) "2.349".
- the ID "000001-00001-001" in FIG. 14 is composed of numbers in three layers (000001, 00001, 001). For example, the IDs are registered such that the numbers "000001" to "000005" of the first hierarchy are assigned to five chemical formulas with different composition ranges of the element Zr and the element Ti contained in the compound. By assigning IDs that can classify the compositional formulas of compounds in this way, management of the experiment database 150 by a plurality of users is facilitated.
- the type of characteristic experimental value in FIG. 14 is arbitrarily selected according to the compound. For example, for battery materials, the experimental characteristic value is conductivity, and for thermoelectric conversion materials, the experimental characteristic value is the thermoelectric conversion figure of merit.
- the experimental data may indicate the process conditions and analysis information used to generate the compound.
- Process conditions include, for example, the firing method, firing time, and firing temperature.
- the analysis information indicates, for example, the crystal structure of the compound, the type of raw material, the presence or absence of residual raw materials, and the like.
- the presence or absence of remaining raw materials is information indicating whether or not raw materials used for synthesizing or producing a compound remain after synthesizing or producing the compound.
- the experimental value acquisition unit 232 acquires from the experimental database 150 the configuration and characteristic experimental values of one or more compounds that have been tested.
- a composition may be a compositional formula of a compound, or its compositional formula and process conditions.
- the experimental value acquisition unit 232 acquires the search range from the search range acquisition unit 131, and acquires the characteristic experimental value of the compound having the configuration included in the search range together with the configuration.
- the experimental value acquisition unit 232 outputs the composition and characteristic experimental values of each of the one or more compounds to the image processing unit 234 .
- Display method acquisition unit 133 acquires, from the input unit 110, the first display method information indicating the method of displaying the characteristic predicted values and the second display method information indicating the method of displaying the characteristic experimental values. The display method acquisition unit 133 then outputs the first display method information and the second display method information to the image processing unit 234 .
- the image processing unit 234 acquires the configuration and property prediction values of each of the plurality of compounds from the prediction value acquisition unit 132, and acquires the configuration and property experimental values of each of one or more compounds from the experimental value acquisition unit 232. do. Furthermore, the image processing unit 234 receives first display method information and second display method information from the display method acquisition unit 133 . The image processing unit 234 generates a map showing property prediction values of a plurality of compounds according to the display method indicated by the first display method information. Furthermore, the image processing unit 234 superimposes each characteristic experimental value of one or more compounds on a position on the map corresponding to the configuration of the compound.
- the image processing unit 234 superimposes the characteristic experimental values on the map according to the display method indicated by the second display method information.
- the image processing unit 234 then outputs to the display unit 140 an image including a map on which the characteristic experimental values of the one or more compounds are superimposed.
- the map may be the image element map Ma or the image map Mb.
- Display unit 140 acquires an image from the image processing unit 234 and displays the image, that is, an image including a map on which characteristic experimental values of one or more compounds are superimposed.
- FIG. 15 is a diagram showing an example of a map.
- the image processing unit 234 superimposes the characteristic experimental value as a mark such as a circle on the image element map Ma of Embodiment 1A.
- the color or color gradation of the mark indicates the characteristic experimental value.
- the image processing unit 234 adds a color or color corresponding to the characteristic experimental value of the compound to a position on the image element map Ma, which corresponds to the above-described combination indicating the configuration of the compound generated by the experiment. superimpose a mark having a density of .
- the superimposition of the mark is also called the superimposition of characteristic experimental values.
- An example of the characteristic experimental value in the present disclosure is the bandgap of the compound obtained by experiment, but it is not limited to this.
- the characteristic experimental value deviates from the characteristic predicted value
- the difference between the color or color gradation of the mark of the characteristic experimental value and the surrounding color or color gradation is highlighted. be able to.
- the characteristic experimental value and the characteristic predicted value are almost the same. You can immediately understand visually that there is.
- the property display device 230 in the present embodiment includes an experimental value acquisition unit 232 that acquires the property experimental values of one or more compounds that have been tested. Then, the image processing unit 234 superimposes the characteristic experimental value of each of the one or more compounds that have been tested on the position on the image element map Ma corresponding to the configuration of the compound, and the characteristic experimental value is superimposed. Generate an image containing an image element map Ma.
- the characteristic display device 230 in the present embodiment includes a display method acquisition unit 133 that acquires second display method information indicating the display method of characteristic experimental values. Then, the image processing unit 234 superimposes the characteristic experimental values on the image element map Ma according to the second display method information.
- the characteristic experimental values are superimposed on the image element map Ma in accordance with the display method indicated by the second display method information. Experimental values can be displayed. As a result, it is possible to improve the efficiency of material search, and appropriately support material development.
- FIG. 16 is a diagram showing another example of the map.
- the image processing unit 234 determines (1) the correspondence relationship between the characteristic experimental value and the gradation corresponding to the characteristic experimental value, and (2) the characteristic predicted value and the correspondence to the characteristic predicted value.
- the corresponding relationship with the gradation to be used may be matched. That is, the image processing unit 234 may match the grayscale scale for the characteristic experimental value with the grayscale scale for the characteristic predicted value.
- the property predicted value and the property experimental value are the same, the same gradation is assigned to those values, and the color of the gradation is added to the image element map Ma. As a result, it is possible to easily grasp the degree of similarity between the predicted characteristic value and the experimental characteristic value.
- the predicted characteristic value is displayed on the image element map Ma in the first display mode, which is the color or the degree of color gradation corresponding to the predicted characteristic value.
- the characteristic experimental value is superimposed on the image element map Ma as a mark having a second display mode that is a color or color gradation corresponding to the characteristic experimental value.
- the second display method information indicates that the scale of the second display mode for the characteristic experimental value should match the scale of the first display mode for the predicted characteristic value as the method of displaying the characteristic experimental value.
- the scales of the predicted property values and the experimental property values are the same, so that the predicted property values and the experimental property values can be compared more easily.
- the image processing unit 234 discretizes the characteristic predicted values while matching the grayscale scale for the characteristic experimental values with the grayscale scale for the characteristic predicted values. and the experimental predictions may not be discretized. Characteristic experimental values are often acquired intensively in some areas on the image element map Ma. Moreover, their characteristic experimental values are often similar. Therefore, although the characteristic prediction values are discretized in order to improve visibility, the characteristic experimental values are not discretized, so that minute differences in the characteristic experimental values can be easily read.
- FIG. 17 is a diagram showing another example of the map.
- the image processing unit 234 moves the mark indicating the characteristic experimental value closer to the front side (that is, the front side) as the characteristic experimental value is better. may be placed. That is, the image processing section 234 may determine the order of superimposing the characteristic experimental values.
- the display method acquisition unit 133 acquires second display method information indicating the method of arranging a plurality of marks as the display method of characteristic experimental values from the input unit 110 and outputs the second display method information to the image processing unit 234. do.
- the image processing unit 234 acquires the second display method information from the display method acquisition unit 133, the better the characteristic experimental value is, the more the mark indicating the characteristic experimental value is moved forward (that is, front side).
- a good property experimental value may mean that the property experimental value is large or that the property experimental value is small. It may also mean that it is close to the indicated characteristic predicted value.
- the second display method information indicates the order of overlapping of the marks.
- the prescribed rule is shown as a display method of characteristic experimental values.
- the image processing unit 234 superimposes the marks of the plurality of characteristic experimental values on the image element map Ma according to the rule.
- the rule is that (a) the larger the characteristic experimental value, the closer the mark of the characteristic experimental value is to the front side, and (b) the closer the characteristic experimental value is to the predetermined value, the closer the characteristic experimental value (c) The closer the characteristic experimental value is to the characteristic predicted value shown at the position on the image element map Ma on which the characteristic experimental value is superimposed, the closer the characteristic experimental value mark is to the mark. shall be placed close to the front side.
- marks indicating good property experimental values such as large property experimental values, property experimental values close to predetermined values, and property experimental values close to property predicted values, are obscured by marks indicating other property experimental values and are difficult to see. can be suppressed, and the efficiency of searching for materials can be improved.
- FIG. 18 is a diagram showing another example of the map.
- the experimental value acquisition unit 232 acquires characteristic experimental values of compounds having configurations included in the search range, but acquires all characteristic experimental values indicated in the experimental data regardless of the search range. You may At this time, the composition of the compound corresponding to the characteristic experimental value acquired by the experimental value acquiring section 232 may not match the composition on the image element map Ma.
- the composition formula of the compound corresponding to the characteristic experimental value acquired by the experimental value acquisition unit 232 is the composition formula of nitride, for example, Li 1.45 (La 0.5Ga0.5 ) 0.05 ( Ti0.5Zr0.5 ) 1.1N3 .
- the image processing unit 234 does not superimpose a mark indicating a characteristic experimental value corresponding to such a nitride composition formula on the image element map Ma.
- the process condition of the compound corresponding to the characteristic experimental value acquired by the experimental value acquisition unit 232 is the process condition corresponding to the image element map Ma. may not match.
- a process condition corresponding to the image element map Ma is one combination of process variables used to obtain all property prediction values shown in the image element map Ma. In a specific example, the firing time of "5 hours" for the compound corresponding to the property experimental value is changed to the firing time of "10 hours” for the variable Pb used to obtain all the property prediction values shown in the image element map Ma. It does not match.
- the image processing unit 234 does not superimpose the mark indicating the characteristic experimental value corresponding to the baking time "5 hours” on the image element map Ma corresponding to the baking time "10 hours".
- the image processing unit 234 may superimpose the nitride characteristic experimental values on the map by setting a new variable for indicating the composition formula of the nitride on the map.
- the image processing unit 234 may generate characteristic experimental values satisfying predetermined conditions even if the composition formula and process conditions corresponding to the characteristic experimental values do not match the composition formula and process conditions corresponding to the image element map Ma. It may be superimposed on the image element map Ma.
- the predetermined condition is a condition in which a portion of the composition formula and process conditions corresponding to the characteristic experimental values that do not match the composition formula and process conditions corresponding to the image element map Ma is, for example, a portion designated by the user. There may be.
- the element N in the composition formula of the nitride described above is different from the element O in the composition formula corresponding to the image element map Ma.
- the predetermined condition is that the compositional formula and process conditions corresponding to the characteristic experimental value are within the search range.
- the image processing unit 234 calculates the degree of similarity between the composition formula and process conditions corresponding to the characteristic experimental values and the composition formula and process conditions corresponding to the image element map Ma, and if the degree of similarity is equal to or greater than the threshold, , the characteristic experimental value may be superimposed on the image element map Ma.
- the image processing unit 234 expresses the compositional formula and process conditions corresponding to the characteristic experimental value by a vector, expresses the compositional formula and process conditions corresponding to the image element map Ma by a vector, and expresses the norm of the difference between these vectors as a distance Calculate as The degree of similarity between the composition formula and process conditions corresponding to the property experimental values and the composition formula and process conditions corresponding to the image element map Ma is higher as the distance is shorter, and is lower as the distance is longer. Then, if the distance is equal to or less than the threshold, that is, if the degree of similarity is equal to or greater than the threshold, the image processing unit 234 superimposes the characteristic experimental value on the image element map Ma.
- the vector may include, as elements, respective coefficients of elements shown in the periodic table and respective values of a plurality of process variables. Further, the image processing unit 234 normalizes the distance so that the maximum value of the distance is 1 and the minimum value is 0, determines whether the normalized distance is equal to or less than the threshold, If it is the following, the characteristic experimental value may be superimposed on the image element map Ma.
- the second display method information is displayed in (a) image superimposing the characteristic experimental value on the element map Ma at the position corresponding to the configuration closest to the composition of the compound having the characteristic experimental value, or (b) superimposing the characteristic experimental value on the image element map Ma
- the non-overlapping is shown as a display method of characteristic experimental values.
- the image processing unit 234 performs processing related to superimposing the characteristic experimental values on the image element map Ma according to the second display method information.
- the image processing unit 234 determines whether or not to superimpose the characteristic experimental values acquired by the experimental value acquiring unit 232.
- the experimental value acquiring unit 232 acquires only the characteristic experimental values superimposed on the image element map Ma from among all the characteristic experimental values shown in the experimental data of the experimental database 150, and outputs them to the image processing unit 234. You may In this case, the experimental value obtaining unit 232 determines whether or not the characteristic experimental value indicated in the experimental data is the characteristic experimental value to be superimposed on the image element map Ma, similarly to the above-described determination method by the image processing unit 234. judge. Then, the image processing unit 234 superimposes the characteristic experimental value acquired by the experimental value acquiring unit 232 on the image element map Ma without determining whether or not to superimpose the characteristic experimental value.
- FIG. 19 is a diagram showing another example of the map.
- the image processing unit 234 may determine whether or not to superimpose the characteristic experimental value on the image element map Ma according to the characteristic experimental value itself.
- the display method acquisition unit 133 acquires second display method information indicating the experimental threshold from the input unit 110 and outputs the second display method information to the image processing unit 234 .
- the experimental threshold is, for example, 2.0 [eV].
- the image processing unit 234 changes, for example, the image element map Ma shown in FIG. 19(a) to the image element map Ma shown in FIG. 19(b) according to the second display method information.
- characteristic experimental values in the bandgap range of 0.0 to 0.35 [eV] are superimposed.
- the second display method information indicates property experimental values equal to or greater than a predetermined first threshold among the property experimental values of one or more compounds that have been tested.
- a characteristic experimental value display method of superimposing the characteristic experimental value on the image element map Ma and not superimposing the characteristic experimental value less than the first threshold on the image element map Ma is shown.
- the first threshold is the experimental threshold described above, which is 2.0 [eV] in a specific example.
- the image element map Ma is not superimposed with an unimportant characteristic experimental value that is treated as noise. It is possible to focus only on characteristic experimental values and superimpose the important characteristic experimental values on the image element map Ma. As a result, important characteristic experimental values superimposed on the image element map Ma can be easily seen, and the efficiency of material search can be improved.
- FIG. 20A is a diagram showing another example of a map.
- the image processing unit 234 may emphasize and superimpose characteristic experimental values that satisfy a predetermined condition, as shown in FIG. 20A.
- the predetermined condition is that the characteristic experimental value was obtained by the experiment for the most recent fixed period, that is, the experiment from the current time to the fixed period before.
- the fixed period is, for example, two weeks.
- the predetermined condition is that characteristic experimental values have been obtained by a predetermined number of recent experiments. The nearest predetermined number is 3, for example.
- the display method acquisition unit 133 acquires the second display method information indicating the above-described predetermined condition from the input unit 110 and outputs the second display method information to the image processing unit 234.
- the image processing unit 234 emphasizes the characteristic experimental values that satisfy the predetermined conditions over the characteristic experimental values that do not satisfy the predetermined conditions according to the second display method information. It is superimposed on the map Ma. Specifically, the characteristic experimental values obtained from the experiment for the last two weeks, that is, from the current time to two weeks ago are superimposed on the image element map Ma as highly emphasized marks, and the other characteristic experimental values are marked with small marks. is superimposed on the image element map Ma.
- the latest three characteristic experimental values that is, the three characteristic experimental values obtained from the three most recent experiments are superimposed on the image element map Ma as highly emphasized marks.
- characteristic experimental values obtained from experiments prior to the three experiments are superimposed as small marks on the image element map Ma.
- FIG. 20B is a diagram showing another example of the map.
- the image processing unit 234 may emphasize and superimpose characteristic experimental values that satisfy the condition that they are larger than the reference value. That is, in this case, the predetermined condition is that the characteristic experimental value is greater than the reference value.
- the display method acquisition unit 133 acquires second display method information indicating the reference value from the input unit 110 and outputs the second display method information to the image processing unit 234 .
- the image processing unit 234 emphasizes characteristic experimental values larger than the reference value than characteristic experimental values equal to or smaller than the reference value, as shown in FIG. superimposed on Specifically, characteristic experimental values greater than the reference value are superimposed on the image element map Ma as highly emphasized marks, and characteristic experimental values equal to or lower than the reference value are superimposed on the image element map Ma as small marks.
- the predetermined condition may be that the characteristic experimental value is smaller than the reference value.
- the reference value may also be the reference value used in the examples of FIGS. 7A-7D.
- the image processing unit 234 may emphasize and superimpose the characteristic experimental value that satisfies the condition that the difference from the characteristic predicted value is less than the difference threshold. That is, in this case, the above-described predetermined condition is that the difference between the characteristic experimental value and the characteristic predicted value indicated at the same position on the image element map Ma is less than the difference threshold.
- the difference threshold is, for example, 0.5 [eV].
- the display method acquisition unit 133 acquires second display method information indicating the difference threshold from the input unit 110 and outputs the second display method information to the image processing unit 234 .
- the image processing unit 234 converts characteristic experimental values whose difference from the characteristic predicted value is less than the difference threshold value to characteristic experimental values whose difference is equal to or greater than the difference threshold value, according to the second display method information. , and superimposed on the map Ma.
- the characteristic experimental values whose difference from the characteristic predicted value is less than the difference threshold are superimposed on the image element map Ma as greatly emphasized marks, and the characteristic experimental values whose difference from the characteristic predicted value is equal to or greater than the difference threshold. is superimposed on the image element map Ma as a small mark.
- the predetermined condition may be that the difference between the characteristic experimental value and the characteristic predicted value indicated at the same position on the image element map Ma is equal to or greater than the difference threshold.
- the second display method information is a property experimental value that satisfies a predetermined condition among the property experimental values of one or more compounds that have been tested.
- a method of displaying the characteristic experimental values superimposing them on the image element map Ma in a manner that emphasizes the characteristic experimental values that do not satisfy .
- the image processing unit 234 superimposes the characteristic experimental values satisfying the predetermined condition on the image element map Ma in an emphasized manner according to the second display method information.
- the above-described predetermined conditions are (a) that the characteristic experimental value is a characteristic experimental value acquired from the present to a predetermined period before; ) the characteristic experimental value is one of a predetermined number of most recently obtained characteristic experimental values; (c) the characteristic experimental value is equal to or greater than a predetermined second threshold; or , (d) the difference between the characteristic experimental value and the characteristic predicted value obtained for the compound having the same configuration as the compound having the characteristic experimental value is a predetermined third threshold or more or less than the third threshold;
- the second threshold is the reference value described above
- the third threshold is the difference threshold described above.
- the user can easily visually grasp the new characteristic experimental values.
- the user can easily grasp, for example, an important characteristic experimental value visually. can be easily grasped visually.
- FIG. 21 is a diagram showing another example of the map.
- the image processing unit 234 may superimpose the characteristic experimental value mark on the image element map Ma in a manner corresponding to the unused variable corresponding to the characteristic experimental value.
- the unused variable is associated with the characteristic experimental value of each compound in the experimental data of the experimental database 150, for example.
- An unused variable is, for example, a variable that indicates process conditions, and in a more specific example, it is a firing temperature.
- the unused variable may be a variable that indicates a type of characteristic different from the characteristic experimental value. In other words, it can be said that the unused variables are variables that are not used for the coordinate axes of the image element map Ma.
- the display method acquisition unit 133 acquires from the input unit 110 the second display method information that prompts display according to the unused variables, and outputs the second display method information to the image processing unit 234 .
- the experimental value acquisition unit 232 also outputs the non-utilization variables of the compound to the image processing unit 234 along with the configuration and characteristic experimental value of each compound.
- the image processing unit 234 forms the characteristic experimental value mark in a manner corresponding to the data indicated by the unused variable corresponding to the characteristic experimental value, as shown in FIG. are superimposed on the image element map Ma. If the non-utilization variable is the firing temperature, the data indicated by the non-utilization variable is, for example, 500°C, 750°C, 1000°C, and so on.
- the image processing unit 234 forms a circular mark of the characteristic experimental value of the compound sintered at the sintering temperature of 500° C., and a mark of the characteristic experimental value of the compound sintered at the sintering temperature of 750° C. A triangle is formed, and a mark of a characteristic experimental value of a compound sintered at a sintering temperature of 1000° C. is formed in a square.
- the number of unused variables is one, but it may be two or more.
- the image processing unit 234 selects, from among the 42 mark modes, a mode corresponding to the firing method, firing temperature, and firing time corresponding to the characteristic experimental value, and the mark of the characteristic experimental value is displayed as the selected mark. formed in the specified manner.
- the aspect of the mark may be, for example, the shape, color, size, etc. of the mark, the color, width, etc. of the edge line of the mark, or may be other than these. It should be noted that the greater the number of different mark modes, the lower the visibility or distinguishability of those marks. Therefore, it is preferable that the product in numbers for the unused variables is a finite number whose marks are distinguishable. For example, the number of different mark modes is 2 or more and 15 or less.
- the image processing unit 234 when at least one unused variable is associated with each property experimental value of one or more compounds that have been tested, The product of the numbers in each case of the at least one unused variable is calculated as the number of types in the form of marks. Then, the image processing unit 234 determines that for each of the property experimental values of the one or more compounds that have been experimented, each of at least one unused variable associated with the property experimental value out of the forms of the number of types is A form corresponding to the combination of data shown is selected, and the mark of the selected form is superimposed on the image element map Ma. For example, the at least one unused variable indicates as data the firing temperature, firing time, and firing method used to fire the compound having the characteristic experimental value.
- the user can visually confirm the data of each of the at least one unused variable associated with each characteristic experimental value superimposed and displayed on the image element map Ma from the form of the mark of the characteristic experimental value. can be easily grasped. Therefore, it is possible to improve the efficiency of material search, and appropriately support material development.
- each of the at least one unused variable indicates the process conditions used to generate the compound having the characteristic experimental value or the attribute of the compound having the characteristic experimental value.
- the user can easily visually grasp the process conditions or attributes of the compound having the property experimental value superimposed and displayed on the image element map Ma from the form of the property experimental value mark. .
- the image processing unit 234 calculates a number between 2 and 15 as the number of types of mark forms.
- the number of types of mark forms is 16 or more, it becomes difficult to identify those forms. Therefore, when the number of types is 2 or more and 15 or less, the identifiability of those forms can be enhanced. As a result, the user can more easily grasp the data of each of the at least one unused variable associated with each characteristic experimental value superimposed and displayed on the image element map Ma. Therefore, it is possible to further improve the efficiency of searching for materials.
- the number of firing methods is 2
- FIG. 22A is a diagram showing another example of a map.
- the image processing unit 234 may superimpose the characteristic experimental value mark on the image element map Ma in a manner corresponding to the analysis information corresponding to the characteristic experimental value.
- the analysis information indicates, for example, the crystal structure of the compound, as described above. Types of crystal structures include, for example, crystal phase A and crystal phase B. Also, the analysis information is associated with the characteristic experimental value of each compound in the experimental data of the experimental database 150 .
- the display method acquisition unit 133 acquires from the input unit 110 second display method information for prompting display according to the analysis information, and outputs the second display method information to the image processing unit 234 .
- the experimental value acquisition unit 232 outputs the configuration and characteristic experimental values of each compound as well as the analysis information of the compound to the image processing unit 234 . As shown in FIG.
- the image processing unit 234 forms marks of characteristic experimental values according to the second display method information in a manner corresponding to the analysis information corresponding to the characteristic experimental values, and creates an image element map Ma superimposed on For example, the image processing unit 234 forms a circular mark of the characteristic experimental value of the compound having the crystal structure of the crystalline phase A, and a triangular mark of the characteristic experimental value of the compound having the crystalline phase B crystal structure.
- FIG. 22B is a diagram showing another example of the map.
- the analytical information described above may indicate the type of raw material for synthesizing the compound.
- Types of raw materials include, for example, Li 2 O (99% purity) and Li 2 O (99.99% purity).
- the image processing unit 234 may superimpose the mark of the characteristic experimental value on the image element map Ma in a manner corresponding to the type of raw material corresponding to the characteristic experimental value.
- the image processing unit 234 forms a circular mark of characteristic experimental values of a compound synthesized from the raw material “Li 2 O ( purity 99%)”, A mark of the characteristic experimental value of the synthesized compound is formed in a triangle.
- FIG. 22C is a diagram showing another example of the map.
- the above analysis information may indicate whether or not the raw materials used to synthesize the compound remain.
- the image processing unit 234 may superimpose the mark of the characteristic experimental value on the image element map Ma in a manner according to the presence or absence of the raw material remaining corresponding to the characteristic experimental value.
- the image processing unit 234 forms a circular mark of the characteristic experimental value of the compound for which the raw material remains (that is, the raw material is present), and the characteristic experimental value of the compound that does not have the raw material (that is, the raw material is not present). Form the mark into a triangle.
- the attributes of a compound are (a) the type of crystal phase of the compound, (b) the type of raw material of the compound, or (c) when the compound was produced. It is whether or not the raw material of the compound remained in the process.
- the user can check the type of crystal phase, the type of raw material, or the presence or absence of the remaining raw material of the compound having the characteristic experimental value superimposed on the image element map Ma, in the form of a mark of the characteristic experimental value. can be easily grasped visually.
- FIG. 23 is a flow chart showing the processing operation of the display system 200 in this embodiment.
- the display system 200 executes the processes of steps S111 to S113, like the display system 100 according to the embodiment 1A. Next, the display system 200 executes the processes of steps S121 to S124.
- the experimental value acquisition unit 232 acquires the configuration and characteristic experimental values of each compound from the experimental database 150 and outputs them to the image processing unit 234 .
- the experimental database 150 if the composition and property experimental values of each compound are associated with process conditions, analytical information, etc., the experimental value acquisition unit 232 acquires the process conditions, analytical information, etc. together with the property experimental values. and output to the image processing unit 234 .
- Step S122 The display method acquisition unit 133 acquires the second display method information output from the input unit 110 according to the user's input operation to the input unit 110, as in step S113.
- This second display method information is, for example, information indicating the method of displaying characteristic experimental values as shown in FIGS. 15 to 22C.
- the display method acquisition unit 133 then outputs the second display method information to the image processing unit 234 .
- the image processing unit 234 acquires, from the predicted value acquisition unit 132 , the property prediction value and configuration of each compound for each of the plurality of compounds, and receives the first display method information from the display method acquisition unit 133 . Then, the image processing section 234 generates a map indicating the characteristic predicted values of each of the plurality of compounds according to the first display method information.
- the map may be the image element map Ma or the image map Mb.
- the image processing unit 234 acquires characteristic experimental values and configurations of the one or more compounds from the experimental value acquisition unit 232 and receives second display method information from the display method acquisition unit 133 . Then, the image processing unit 234 superimposes the characteristic experimental values of one or more compounds on the map according to the second display method information. As a result, a map is generated on which characteristic experimental values of one or more compounds are superimposed.
- the image processing unit 234 outputs to the display unit 140 an image including a map on which the characteristic experimental values of the one or more compounds are superimposed.
- Step S124 The display unit 140 acquires an image from the image processing unit 234 and displays the image, that is, an image including a map on which characteristic experimental values of one or more compounds are superimposed.
- the properties of the compound's predicted values and experimental values are displayed.
- the characteristic experimental value is superimposed on the map indicating the characteristic predicted value, so that the user can appropriately recognize the overall image of the characteristic experimental value. Furthermore, the user can easily recognize the relationship between the property predicted value and the property experimental value.
- the characteristic display device 230 performs the processing of steps S114 and S115 instead of steps S121 to S124, as in the characteristic display device 130 of Embodiment 1A. .
- the image processing unit 234 may generate the image map Mb as in Modification 1 of Embodiment 1A, and superimpose the characteristic experimental value on the image map Mb.
- the image map Mb is a map composed of an array of a plurality of image element maps Ma.
- FIGS. 24A and 24B are diagrams showing an example of the image map Mb in this modified example.
- the image processing unit 234 superimposes, on any image element map Ma included in the image map Mb, the characteristic experimental values of the compound having the configuration corresponding to the image element map Ma.
- the configuration and characteristic experimental values of each compound acquired by the experimental value acquisition unit 232 include configuration and characteristic experimental values that do not correspond to any of the image element maps Ma in the image map Mb.
- Each image element map Ma included in this image map Mb corresponds to a combination of option data of discrete variables a and b.
- the compositional formula of the compound “Li 0.77 (La 0.5 Ga 0.5 ) 0.15 (Ti 0.5 Zr 0.5 ) 1.195 O 3 ” and the characteristic experimental values are Acquired by the value acquisition unit 232 .
- the discrete variable b in the compositional formula of the compound is 0.195, the compositional formula does not correspond to any image element map Ma of the image maps Mb.
- the image processing unit 234 in this modified example expresses the composition formula of the compound acquired by the experimental value acquisition unit 232 and the composition formula corresponding to each position on the image map Mb as vectors.
- the composition formula vector acquired by the experimental value acquisition unit 232 is hereinafter referred to as a first vector
- the composition formula vector corresponding to each position on the image map Mb is hereinafter referred to as a second vector.
- These vectors are defined, for example, by six variables (M3, M3', M4, M4', a, b, x, y).
- the image processing unit 234 calculates the norm of the difference between the first vector and the second vector at each position on the image map Mb as the distance. Note that the distance may be a standardized distance as described above.
- the image processing unit 234 places the compound obtained by the experimental value obtaining unit 232 at a position 1700 on the image map Mb corresponding to the shortest distance among the calculated distances.
- the characteristic experimental values of are superimposed. Note that the position 1700 is a position on one image element map Ma included in the image map Mb.
- the image processing unit 234 may superimpose the characteristic experimental value on the position on the image map Mb corresponding to the shortest distance that is equal to or less than the threshold among the calculated distances.
- the threshold is, for example, 0.01.
- the image processing unit 234 may superimpose the characteristic experimental value on the position on the image map Mb corresponding to the distance equal to or less than the threshold among the calculated distances. If there are multiple positions on the image map Mb corresponding to distances equal to or less than the threshold, the image processing unit 234 may superimpose characteristic experimental values on these multiple positions.
- the image processing unit 234 calculates positions 1701 on the image map Mb corresponding to each of the plurality of shortest distances, as shown in FIG. 24B. may be superimposed with characteristic experimental values.
- the compositional formula of the compound “Li 1.475 (La 0.5 Ga 0.5 ) 0.175 (Ti 0.5 Zr 0.5 ) 1.0 O 3 ” and the characteristic experimental value are obtained by the experimental value acquisition unit 232.
- the compositional formula does not correspond to any image element map Ma of the image maps Mb.
- the image processing unit 234 calculates the norm of the difference between the first vector corresponding to the composition formula and the second vector at each position on the image map Mb as the distance. Then, in the example of FIG. 24B, the image processing unit 234 identifies two positions 1701 on the image map Mb corresponding to the shortest distance among the calculated multiple distances. Note that these two positions 1701 are included in two image element maps Ma that are adjacent to each other. The image processing unit 234 superimposes the characteristic experimental values of the compound acquired by the experimental value acquiring unit 232 on the two positions 1701 .
- the distance corresponding to the position 1700 is less than or equal to the above-described threshold "0.01", and the distances corresponding to the two positions 1701 are longer than the threshold. Therefore, when the condition equal to or less than the threshold is applied, that is, when the characteristic experimental value is superimposed on the position on the image map Mb corresponding to the distance equal to or less than the threshold, even if the characteristic experimental value is superimposed on the position 1700 , the two positions 1701 are not superimposed with characteristic experimental values.
- the image map Mb includes a plurality of image element maps Ma arranged in a matrix along each of the first coordinate axis and the second coordinate axis.
- Each of the image element maps Ma has a third coordinate axis and a fourth coordinate axis.
- the image processing unit 234 converts the first coordinate axis, the second coordinate axis, the third coordinate axis, and the fourth coordinate axis to the first, second, third, and fourth variables among the plurality of variables described above. correspond to each.
- the image processing unit 234 associates each of the plurality of compounds with the value of the first variable and the value of the second variable used to express the configuration of the compound among the plurality of image element maps Ma.
- the image processing unit 234 places the compound on the specified image element map Ma at positions corresponding to the values of the third variable and the fourth variable used to express the configuration of the compound.
- Map property predictors are the variables a, b, x and y described above.
- a map such as the image map Mb can indicate the property prediction values for the configurations of a plurality of compounds each represented by four variables, and can display the property prediction values of the compounds in a wide range in an easy-to-understand manner. can. As a result, it is possible to improve the efficiency of material search, and appropriately support material development.
- the image processing unit 234 uses one of the plurality of image element maps Ma for each of one or more compounds that have been tested to represent the configuration of the compound. If there is no image element map Ma associated with the value of the first variable and the value of the second variable to be used, instead of that image element map Ma, the values closest to the values of each of the first and second variables Identify the image element map Ma associated with . Then, the image processing unit 234 adds the characteristics of the compound to positions corresponding to the values of the third variable and the value of the fourth variable used to express the configuration of the compound on the specified image element map Ma. Experimental values are superimposed.
- first and second variables are discrete variables
- the image element map Ma associated with the values closest to those values is identified, and the characteristic experimental values are superimposed on that image element map Ma. Therefore, it is possible to prevent characteristic experimental values from not being displayed in the image element map Ma due to discrete variables.
- the display method of characteristic predicted values can be appropriately set by the first display method information. Further, in Embodiment 1B and its modified example, the display method of characteristic experimental values can be appropriately set by the second display method information.
- the display method acquisition unit 133 acquires the first display method information generated according to the user's input operation to the input unit 110 .
- the user can arbitrarily set the display method of the characteristic prediction value, and convenience can be improved.
- the display method acquisition unit 133 determines the display method of the property prediction values based on the property prediction values of the plurality of compounds acquired by the prediction value acquisition unit 132, thereby obtaining the first display method information. may be obtained.
- the display method acquisition unit 133 obtains a predetermined color or color density for indicating the maximum and minimum values of the property prediction values on the image element map Ma, and obtains the plurality of colors obtained by the prediction value acquisition unit 132. It is determined as a display method of property prediction values that an image element map Ma is generated in association with the maximum and minimum values of the property prediction values of the compound.
- the display method of the property prediction value is determined based on the property prediction value, so that the display suitable for the property prediction value can be performed, and the efficiency of material search can be improved.
- the maximum value of the property prediction values of a plurality of compounds acquired by the prediction value acquisition unit 132 is 3.5, and the minimum value is 0.0.
- the display method acquisition unit 133 assigns the predetermined maximum gradation to the maximum value “3.5” of the property prediction value, and assigns the predetermined minimum gradation to the property prediction value. Assign a minimum value of "0.0".
- the display method acquisition unit 133 determines the relationship between the gray level and the property prediction value as the display method of the property prediction value. As a result, the display method acquisition unit 133 acquires first display method information indicating the display method.
- the predicted value acquisition unit 132 newly acquires property predicted values of a plurality of compounds.
- the maximum value of the property prediction values of the plurality of compounds newly acquired by the prediction value acquisition unit 132 is 1.5, and the minimum value is 1.0.
- the display method acquisition unit 133 assigns the predetermined maximum gradation to the maximum value “1.5” of the property prediction value, and assigns the predetermined minimum gradation to the property prediction value. Assign a minimum value of "1.0". That is, the display method acquisition unit 133 determines such a new relationship between the gradation and the property prediction value as the property prediction value display method.
- the display method acquisition unit 133 acquires the first display method information indicating the new display method.
- the image processing unit 234 generates an image element map Ma indicating the predicted property value according to the first display method information indicating the display method determined based on the predicted property value.
- Embodiment 2A As in Embodiment 1A, the display system according to the present embodiment displays property prediction values of a plurality of compounds in the form of a map, and superimposes one or more candidate points on the map.
- a candidate point is a point that indicates the configuration of a compound candidate (that is, a candidate compound) to be used in future experiments.
- the same components as those in Embodiments 1A and 1B are given the same reference numerals as those in Embodiments 1A and 1B, and detailed descriptions thereof are omitted.
- FIG. 25 is a block diagram showing an example of the configuration of display system 300 in this embodiment.
- a display system 300 shown in FIG. 25 includes an input unit 110 , a predictor database 120 , a characteristic display device 330 , a display unit 140 and an experiment database 150 .
- the characteristic display device 330 is an example of an information display device.
- Characteristic display device 330 in the present embodiment determines a candidate point based on the obtained characteristic predicted value of the compound, or based on the characteristic predicted value and the position of the characteristic experimental value, and displays the candidate point. It is superimposed on the image element map Ma. Note that the position of the characteristic experimental value is the position on the image element map Ma corresponding to the configuration of the experimental compound from which the characteristic experimental value was obtained. Then, the characteristic display device 330 displays on the display unit 140 an image including the image element map Ma on which the candidate points are superimposed.
- Such a characteristic display device 330 includes a search range acquisition unit 131, a predicted value acquisition unit 132, a display method acquisition unit 133, an experimental value acquisition unit 232, a candidate point determination unit 331, and an image processing unit 334. Prepare.
- the characteristic display device 330 may be composed of a processor such as a CPU and a memory, for example.
- the processor functions as the characterization device 330, for example by executing a computer program stored in memory.
- the memory may be volatile or nonvolatile, and may be composed of a volatile memory and a nonvolatile memory.
- the predicted value acquisition unit 132 in the present embodiment associates the composition of each compound with the property prediction value acquired for the composition, and outputs the result to the image processing unit 334.
- the configuration and characteristic prediction values are also output to candidate point determination section 331 .
- the composition of the compound may be the compositional formula of the compound, and when the process conditions for producing the compound are included in the search range, the composition of the compound is the compositional formula of the compound and the process conditions. may Process conditions include, for example, firing method, firing time, firing temperature, and the like.
- the experimental value acquisition unit 232 acquires from the experimental database 150 the configuration and characteristic experimental values of one or more compounds that have been tested. Then, the experimental value obtaining unit 232 outputs the obtained configuration and characteristic experimental values to the candidate point determining unit 331 for each of the one or more tested compounds.
- Display method acquisition unit 133 acquires, from the input unit 110, the third display method information indicating the display method of the candidate points. Display method acquisition section 133 then outputs the third display method information to candidate point determination section 331 and image processing section 334 .
- the candidate point determination unit 331 acquires the composition and property predicted values of the compound from the prediction value acquisition unit 132 , and acquires the composition and property experimental values of the compound from the experimental value acquisition unit 232 . Furthermore, the candidate point determination unit 331 acquires third display method information from the display method acquisition unit 133 . Then, the candidate point determination unit 331 determines one or more positions from all positions on the image element map Ma as candidate points, respectively, according to the third display method information. At this time, the candidate point determination unit 331 determines candidate points based on the characteristic prediction values indicated at each position on the image element map Ma. Alternatively, the candidate point determination unit 331 may determine the characteristic predicted value indicated at each position and the position on the image element map Ma corresponding to each configuration of one or more compounds that have been tested, that is, the position of the characteristic experimental value. Determine candidate points based on
- the candidate point determination unit 331 determines the first position where the characteristic prediction value equal to or greater than the threshold on the image element map Ma is indicated as the candidate point.
- the candidate point determination unit 331 determines the second position where the characteristic prediction value equal to or less than the threshold on the image element map Ma is indicated as the candidate point.
- the candidate point determination unit 331 determines, as a candidate point, a third position where a characteristic prediction value whose difference from the target value is equal to or less than a threshold value is indicated on the image element map Ma.
- the target value may be a value set according to an input operation to the input unit 110 by the user. In that case, the candidate point determination unit 331 acquires the target value from the input unit 110 via the display method acquisition unit 133, and uses the target value to determine the candidate point.
- the candidate point determination unit 331 determines the first position where the characteristic predicted value equal to or greater than the threshold value is indicated as the candidate point.
- the first positions where the top K characteristic prediction values are respectively indicated may be determined as candidate points.
- K is a predetermined integer equal to or greater than 1, and the top K characteristic predicted values are larger than any other characteristic predicted values.
- the candidate point determination unit 331 determines the second position where the characteristic predicted value below the threshold is indicated as the candidate point. Each indicated second position may be determined as a candidate point.
- L is a predetermined integer equal to or greater than 1, and the top L characteristic predicted values are greater than any other characteristic predicted value below the threshold.
- the candidate point determination unit 331 determines, as a candidate point, the third position at which the characteristic predicted value whose difference from the target value is equal to or less than the threshold value is indicated. , the third position at which J characteristics prediction values having the lowest difference from the target value are indicated, respectively, may be determined as candidate points.
- J is a predetermined integer equal to or greater than 1, and the lower J characteristic predicted values have a smaller difference from the target value than any other characteristic predicted value.
- the candidate point determination unit 331 may determine each of two or more first positions that are separated from each other by a predetermined distance or more among the plurality of first positions as candidate points. Similarly, the candidate point determination unit 331 determines two or more positions apart from each other by a predetermined distance or more among the plurality of second positions or the plurality of third positions as candidate points. good too. In addition, when the configurations and characteristic experimental values of two tested compounds have been obtained, the candidate point determination unit 331 selects a position halfway between the positions of the two characteristic experimental values on the image element map Ma. , may be determined as candidate points.
- the candidate point determining section 331 may determine, as a candidate point, a first position that is separated from any characteristic experimental value position by a predetermined distance or more from among the plurality of first positions described above. Similarly, the candidate point determination unit 331 selects a position that is at least a predetermined distance from the position of any of the characteristic experimental values, out of the plurality of second positions or the plurality of third positions, Candidate points may be determined.
- Image processing unit 334 generates image element map Ma, as in Embodiment 1A. Furthermore, the image processing unit 334 acquires the third display method information from the display method acquisition unit 133, and converts one or more candidate points determined by the candidate point determination unit 331 into the image according to the third display method information. It is superimposed on the element map Ma. That is, the image processing unit 334 superimposes a mark indicating each of the one or more candidate points on the image element map Ma. Then, the image processing unit 334 outputs to the display unit 140 an image including the image element map Ma on which the one or more candidate points are superimposed.
- the display unit 140 acquires an image from the image processing unit 334 and displays the image, that is, the image including the image element map Ma on which the one or more candidate points are superimposed.
- FIG. 26 is a diagram showing an example of an image element map Ma on which candidate points are superimposed.
- the image processing unit 334 superimposes the candidate points as marks such as stars on the image element map Ma of the embodiment 1A according to the third display method information. That is, the candidate point determination unit 331 determines one or more candidate points from all positions of the image element map Ma according to the third display method information. Then, the image processing unit 334 superimposes a star-shaped mark on the one or more candidate points.
- the characteristic display device 330 in the present embodiment includes the predicted value acquisition section 132 and the image processing section 334 .
- the predicted value acquiring unit 132 acquires a property predicted value of each of a plurality of compounds.
- the image processing unit 334 generates an image element map Ma that indicates the property prediction values of the compounds at positions corresponding to the respective configurations of the plurality of compounds.
- the image processing unit 334 superimposes the candidate points representing the respective configurations of one or more candidate compounds on the positions on the image element map Ma corresponding to the configurations of the candidate compounds.
- the image processing unit 334 generates and outputs an image including the image element map Ma on which one or more candidate points are superimposed.
- the candidate compounds described above are compounds that are candidates for experimentation among a plurality of compounds each having a property prediction value indicated in the image element map Ma.
- the image described above is output to and displayed on the display unit 140 .
- the characteristic display device 330 does not have to include the predicted value acquisition section 132 .
- the image processing unit 334 generates the image element map Ma, but it may be obtained without generating it.
- the image processing unit 334 acquires the image element map Ma indicating the predicted characteristic value of the compound at the position corresponding to the configuration of each of the plurality of compounds.
- the image processing unit 334 superimposes the candidate points representing the respective configurations of one or more candidate compounds on the positions on the image element map Ma corresponding to the configurations of the candidate compounds. Output an image containing the map Ma.
- the candidate compound is a candidate compound for the experiment among the plurality of compounds each having the property prediction value shown in the image element map Ma. Even with such a characteristic display device 330, the same effect as described above can be obtained.
- the characteristic display device 330 in the present embodiment includes a display method acquisition unit 133 that acquires third display method information indicating the display method of the candidate points.
- the image processing unit 334 superimposes one or more candidate points on the image element map Ma according to the third display method information.
- the candidate points are superimposed on the image element map Ma according to the display method indicated by the third display method information. can be displayed. As a result, the efficiency of searching for materials can be improved.
- the characteristic display device 330 in the present embodiment includes a candidate point determination unit 331 that determines one or more candidate points based on the respective characteristic predicted values of a plurality of compounds.
- the image processing unit 334 superimposes one or more candidate points determined by the candidate point determination unit 331 on the image element map Ma.
- the candidate points are determined based on the predicted property value of each of the compounds, so that the best property predicted value, such as the maximum property predicted value, the minimum property predicted value, or the property predicted value closest to the target value, is determined. Locations where property prediction values are indicated can be determined as candidate points. Therefore, it is possible to further improve the efficiency of searching for materials.
- the characteristic display device 330 includes a search range acquisition unit 131 that acquires a search range.
- This search range acquisition unit 131 acquires a plurality of variables used to express the composition of a compound, and a plurality of option data indicating possible values or elements for each of the plurality of variables.
- the predicted value acquisition unit 132 calculates the characteristics of a compound having a configuration corresponding to the combination. Get the predicted value. That is, the predicted value obtaining unit 132 obtains, for each of the above combinations, the property predicted value of the compound having the configuration corresponding to the combination using a predetermined algorithm.
- FIG. 27 is a diagram showing another example of the image element map Ma on which candidate points are superimposed.
- the candidate point determination unit 331 selects one or more candidates from a plurality of points (hereinafter also referred to as grid points) represented by a combination of variables x and y in the image element map Ma according to the third display method information. points may be determined.
- the image processing unit 334 superimposes a mark on the determined one or more candidate points.
- the candidate point determination unit 331 extracts candidate points corresponding to the composition (that is, compositional formula) of a predetermined compound. Alternatively, it can be said that the candidate point determination unit 331 limits the candidate points to grid points.
- the third display method information indicates that the candidate points are displayed only at a plurality of predetermined positions on the image element map Ma. shown as a method.
- FIG. 28 is a diagram showing another example of the image element map Ma on which candidate points are superimposed.
- the candidate point determining unit 331 determines (n+1) or more temporary candidate points on the image element map Ma, and specifies the priority of these temporary candidate points. Then, the candidate point determination unit 331 determines, as candidate points, the highest n temporary candidate points with the highest priority from the plurality of temporary candidate points.
- a tentative candidate point is, for example, a point at the first, second, or third position described above. Also, for example, when each of the (n+1) or more temporary candidate points is the first position, the priority may be the characteristic prediction value at the first position.
- the priority when each of the (n+1) or more temporary candidate points is the second position, the priority may be the characteristic prediction value at the second position. Further, for example, when each of the (n+1) or more temporary candidate points is the third position, the priority may be the reciprocal of the difference between the characteristic prediction value and the target value at the third position. . Also, the priority may be the shortest distance among the distances from the position of each characteristic experimental value to the tentative candidate point.
- the image processing unit 334 superimposes the determined n or less candidate points on the image element map Ma and displays it on the display unit 140 . This allows the user to easily grasp the candidate points that are promising candidates for the experiment.
- the third display method information indicates the upper limit number of candidate points to be superimposed on the image element map Ma as the candidate point display method.
- the image processing unit 334 superimposes one or more candidate points on the image element map Ma, the number being equal to or less than the upper limit.
- FIG. 29 is a diagram showing another example of the image element map Ma on which candidate points are superimposed.
- the candidate point determination unit 331 determines each candidate point according to the third display method information so that the straight line distance between the candidate points superimposed on the image element map Ma is equal to or greater than a predetermined distance, as shown in FIG.
- the linear distance between candidate points is the linear distance between the locations on the image element map Ma indicated by the respective continuous variables (x, y) of the two candidate points.
- the predetermined distance is, for example, three times the step width (that is, one memory) of each of the continuous variables x and y. That is, it can be said that the predetermined distance is 3 memories. Note that the predetermined distance is also called a first minimum separation distance.
- the candidate point determination unit 331 determines, as the first candidate point, the temporary candidate point with the best property prediction value from among the plurality of temporary candidate points on the image element map Ma.
- the tentative candidate point with the best property prediction value may be the tentative candidate point with the highest priority. For example, if each of the plurality of temporary candidate points is at the first position, the provisional candidate point that indicates the best property prediction value indicates the largest property prediction value among the plurality of provisional candidate points. It is a provisional candidate point.
- the candidate point determination unit 331 deletes the temporary candidate points that are within a predetermined distance from the first candidate point, and selects the remaining one or more temporary candidate points for the first candidate point.
- a tentative candidate point showing a next good property prediction value is determined as the second candidate point.
- the candidate point determination unit 331 determines two or more candidate points by repeatedly performing such processing until all the temporary candidate points are deleted. The straight line distance between these candidate points is greater than or equal to the predetermined distance described above.
- the candidate point determination unit 331 randomly determines two or more temporary candidate points from a plurality of temporary candidate points as candidate points, and sets the distance between the two candidate points in a straight line to be equal to or greater than a predetermined distance.
- One candidate point is moved to a temporary candidate point at a position different from that candidate point. That is, the candidate point determination unit 331 moves one candidate point.
- the candidate point determination unit 331 sequentially moves the candidate points in this manner, thereby setting the linear distance between each of the two or more candidate points to be equal to or greater than the predetermined distance described above.
- the image processing unit 334 superimposes, on the image element map Ma, a plurality of candidate points separated from each other by a predetermined distance or more, which are determined by the candidate point determining unit 331 as described above.
- the third display method information indicates the predetermined first minimum separation distance between a plurality of candidate points as the display method of the candidate points.
- the image processing unit 334 superimposes a plurality of candidate points separated from each other by the first minimum separation distance or more on the image element map Ma.
- the user can easily grasp candidate points where there is a certain difference in the compositional formula (that is, composition) of the compound.
- FIG. 30 is a diagram showing another example of the image element map Ma on which candidate points are superimposed.
- the candidate point determination unit 331 determines a plurality of candidate points and an experimental plan, for example, as shown in FIG. 30, according to the third display method information.
- the experimental plan is information indicating which candidate points should be tested in what order among the plurality of candidate points.
- Candidate point determination section 331 outputs information indicating the plurality of determined candidate points and the experimental plan to image processing section 334 .
- the candidate point determination unit 331 assigns the experiment number "1" to the plan candidate point with the highest priority among the n plan candidate points, and assigns the experiment number "1" to the plan candidate point with the second highest priority. Assign experiment number "2". As a result, an experiment plan is generated that indicates n plan candidate points and the experiment numbers of those plan candidate points.
- the image processing unit 334 acquires information indicating a plurality of candidate points and the experimental plan from the candidate point determination unit 331. Then, the image processing unit 334 superimposes the plurality of candidate points on the image element map Ma. Furthermore, the image processing unit 334 attaches the experiment number of each of the n plan candidate points included in the experiment plan to the image element map Ma, and further adds the plan candidate point of the next experiment number from one plan candidate point to the next experiment number. is superimposed on the image element map Ma. Such superimposition of arrows and the like are performed according to the third display method information.
- the image processing unit 334 assigns experiment numbers (1), (2), (3), (4), and (5) to five planned candidate points among the plurality of candidate points. attached respectively. Then, the image processing unit 334 generates an arrow pointing from the planned candidate point of the experiment number (1) to the planned candidate point of the experiment number (2), and the planned candidate point of the experiment number (3) from the planned candidate point of the experiment number (2). An arrow pointing to a point is superimposed. Furthermore, the image processing unit 334 generates an arrow pointing from the planned candidate point of the experiment number (3) to the planned candidate point of the experiment number (4), and an arrow pointing from the planned candidate point of the experiment number (4) to the planned candidate point of the experiment number (5).
- the image processing unit 334 displays on the display unit 140 an image including the image element map Ma with the experiment numbers and arrows. Therefore, from the plan candidate point of experiment number (1), the plan candidate point of experiment number (2), the plan candidate point of experiment number (3), the plan candidate point of experiment number (4), the plan of experiment number (5) The display unit 140 presents to the user an experiment plan indicating what to experiment with in order of candidate points.
- the third display method information indicates that the order of experiments on candidate compounds corresponding to each of one or more candidate points is displayed as an experiment plan. is shown as a display method.
- the experimental plan is indicated by the experiment number and the arrow, but it is not limited to this, and may be indicated in other aspects.
- FIG. 31 is a diagram showing another example of the image element map Ma on which candidate points are superimposed.
- the candidate point determination unit 331 selects a plurality of candidate points, for example, as shown in FIG. can be classified as
- the reference value is, for example, the average value of property prediction values at each position in the image element map Ma, the median value of the property prediction values, or an arbitrary value, but is not limited to these.
- Candidate point determination section 331 acquires the third display method information regarding the reference value from input section 110 via display method acquisition section 133, and determines the reference value according to the third display method information.
- Candidate point determination section 331 determines whether or not the characteristic prediction value indicated at each candidate point is equal to or greater than the reference value for each of the plurality of candidate points.
- a flag indicating 1, for example, is attached to the point.
- candidate point determining section 331 determines that the predicted characteristic value indicated at the candidate point is less than the reference value, it flags the candidate point as 0, for example.
- candidate point determination section 331 then outputs the plurality of candidate points and flags to image processing section 334 .
- the image processing unit 334 When the image processing unit 334 acquires a plurality of candidate points and flags from the candidate point determination unit 331, the image processing unit 334 selects the candidate points to which the flag indicating 1 is assigned as shown in FIG. 31 according to the third display method information. assign a star-shaped mark, for example. In addition, the image processing unit 334 assigns, for example, an inverted triangle mark to a candidate point to which a flag indicating 0 is added. Then, the image processing unit 334 superimposes a mark in the form assigned to the candidate point on the candidate point on the image element map Ma, and displays an image including the image element map Ma on which the mark is superimposed on the display unit 140. indicate. As a result, the candidate points indicated by the marks of each aspect are superimposed and displayed on the image element map Ma.
- a candidate point showing a characteristic predicted value equal to or greater than the reference value can be highlighted more than a candidate point showing a characteristic predicted value less than the reference value.
- the reference value is an arbitrary value and is equal to, for example, the 10th largest property prediction value in the image element map Ma
- the 10th Candidate points can be highlighted up to and including those with large property prediction values. Contrary to the above example, candidate points indicating characteristic predicted values less than the reference value may be highlighted more than candidate points indicating characteristic predicted values equal to or greater than the reference value.
- the third display method information is characteristic prediction indicated at a position on the image element map Ma on which the candidate point is superimposed, out of one or more candidate points.
- a method of displaying candidate points in which candidate points having a value equal to or greater than a reference value are displayed in a more emphasized manner than the remaining candidate points is shown.
- the reference value is the average value or median value of property prediction values of a plurality of compounds, or a value designated by the user.
- the user can easily find a candidate point indicating a characteristic prediction value equal to or greater than the reference value from one or more candidate points superimposed on the image element map Ma.
- the efficiency of searching for materials can be improved.
- FIG. 32 is a diagram showing another example of the image element map Ma on which candidate points are superimposed.
- the candidate point determination unit 331 may classify a plurality of candidate points into three groups according to the third display method information, as shown in FIG. 32, for example.
- the three groups are Candidate Point Group 1, Candidate Point Group 2, and Candidate Point Group 3. Classification into these groups may be performed by comparing the characteristic prediction value and the reference value, as in the example of FIG. 31 .
- the candidate point determination unit 331 classifies the candidate point into the candidate point group 1 if the characteristic prediction value of the candidate point is equal to or greater than the first reference value.
- Candidate point determination section 331 classifies the candidate point into candidate point group 2 if the characteristic prediction value of the candidate point is less than the first reference value and equal to or greater than the second reference value.
- Candidate point determination section 331 then classifies the candidate point into candidate point group 3 if the characteristic prediction value of the candidate point is less than the second reference value.
- Each of the first reference value and the second reference value is, for example, the average value of the property prediction values at each position in the image element map Ma, the median value of the property prediction values, or an arbitrary value, but is limited to these. not to be Also, the first reference value is a value greater than the second reference value. In a specific example, the first reference value is 2.5 eV and the second reference value is 1.5 eV.
- the above-described priority may be used instead of the characteristic prediction value of the candidate points for classification into each group.
- the priority used in this case may be the characteristic predicted value or the reciprocal of the difference between the characteristic predicted value and the target value.
- the candidate point determination unit 331 classifies the candidate point into the candidate point group 1 if the priority of the candidate point is equal to or higher than the first priority reference value. Further, if the priority of the candidate point is less than the first priority reference value and equal to or higher than the second priority reference value, the candidate point determination unit 331 classifies the candidate point into the candidate point group 2 . Then, candidate point determination section 331 classifies the candidate point into candidate point group 3 if the priority of the candidate point is less than the second priority reference value.
- first priority reference value and the second priority reference value are reference values to be compared with the priority, and the first priority reference value is greater than the second priority reference value.
- first priority reference value and the second priority reference value may hereinafter be collectively referred to as priority reference values.
- the priority reference value is the average value of the priority of each candidate point, the median value of the priority, or an arbitrary value, but is not limited to these.
- the candidate point determination unit 331 After classifying the plurality of candidate points into three groups in this manner, the candidate point determination unit 331 outputs the plurality of candidate points to the image processing unit 334 in association with the group identification information indicating the group to which the candidate points belong. do.
- the image processing unit 334 acquires a plurality of candidate points and group identification information from the candidate point determination unit 331, as shown in FIG. assigns a star-shaped mark, for example. Further, the image processing unit 334 assigns, for example, an inverted triangle mark to the candidate points associated with the group identification information indicating the candidate point group 2 . Furthermore, the image processing unit 334 assigns, for example, a square mark to the candidate points associated with the group identification information indicating the candidate point group 3 . The assignment of these marks is performed according to the third presentation method information.
- the image processing unit 334 superimposes a mark in the form assigned to the candidate point on the candidate point on the image element map Ma, and displays an image including the image element map Ma on which the mark is superimposed on the display unit 140. indicate.
- the candidate points indicated by the marks of each aspect are superimposed and displayed on the image element map Ma.
- the third display method information assigns each of the one or more candidate points to one of a plurality of groups according to the priority of the candidate points.
- a display method of the candidate points is to classify the points into three groups and superimpose the marks of the forms associated with the groups on the image element map Ma.
- the priority of a candidate point may be, for example, the property prediction value indicated at that candidate point.
- the user can easily grasp the group to which each candidate point superimposed on the image element map Ma belongs, that is, the feature of the candidate point belonging to the group, for example, whether the priority is high, medium, or low. be able to.
- FIG. 33 is a flow chart showing the processing operation of the display system 300 in this embodiment.
- the display system 300 executes the processes of steps S111 and S112, like the display system 100 according to Embodiment 1A, and executes step S121, like the display system 200 according to Embodiment 1B. Next, the display system 300 executes the processes of steps S131 to S134.
- Step S131 The display method acquisition unit 133 acquires the third display method information output from the input unit 110 according to the user's input operation to the input unit 110, as in step S113.
- This third display method information is information indicating a display method of candidate points as shown in FIGS. 26 to 32, for example.
- Display method acquisition section 133 then outputs the third display method information to candidate point determination section 331 and image processing section 334 .
- the candidate point determination unit 331 acquires the configuration and property prediction values of each of the plurality of compounds from the prediction value acquisition unit 132, and acquires the configuration and property experimental values of each of one or more compounds from the experimental value acquisition unit 232. . Furthermore, the candidate point determination unit 331 acquires third display method information from the display method acquisition unit 133 . Then, the candidate point determination unit 331, according to the third display method information, based on the configuration and property prediction values of each of the plurality of compounds and the configuration and property experimental values of each of the one or more compounds, Determine one or more candidate points.
- Step S133 The image processing unit 334 acquires, from the predicted value acquiring unit 132, the composition and property predicted value of each compound for each of the plurality of compounds. Furthermore, the image processing section 334 acquires one or more candidate points from the candidate point determination section 331 . Also, the image processing unit 334 acquires third display method information from the display method acquisition unit 133 . Note that the image processing unit 334 may receive the first display method information indicating the display method of the characteristic predicted value from the display method acquisition unit 133, as in Embodiment 1A.
- the image processing unit 334 generates an image element map Ma based on the configurations and property prediction values of each of the acquired compounds. At this time, if the image processing unit 334 receives the first display method information, it may generate the image element map Ma according to the first display method information. Furthermore, the image processing unit 334 superimposes one or more candidate points acquired from the candidate point determination unit 331 on the image element map Ma according to the third display method information. That is, the image processing unit 334 superimposes marks indicating one or more candidate points on the image element map Ma. The image processing unit 334 outputs to the display unit 140 an image including the image element map Ma on which the one or more candidate points are superimposed.
- the display unit 140 acquires the image from the image processing unit 334 and displays the image, that is, the image including the image element map Ma on which one or more candidate points are superimposed.
- the image processing unit 334 may generate the image map Mb as in Modification 1 of Embodiment 1A and superimpose the candidate points on the image map Mb.
- the image map Mb is a map composed of an array of a plurality of maps Ma.
- FIG. 34 is a diagram showing an example of the image map Mb in this modified example.
- the image processing unit 334 superimposes the candidate points on the image map Mb as shown in FIG. 34 according to the third display method information.
- the candidate point determination unit 331 acquires the third display method information indicating the limit number of candidate points from the input unit 110 via the display method acquisition unit 133
- the candidate point determination unit 331 determines the limit number of candidate points.
- the limit number is n (n is an integer equal to or greater than 1, for example 10) for the image map Mb.
- the image processing unit 334 superimposes ten candidate points, for example, on the image map Mb.
- FIG. 35 is a diagram showing another example of the image map Mb in this modified example.
- the candidate point determination unit 331 selects a plurality of candidate points to be superimposed on the image map Mb, for example, as shown in FIG.
- the candidate points may be classified into the above candidate points and the candidate points whose characteristic prediction values are less than the reference value.
- the reference value used for the image map Mb is, for example, the average value of the property prediction values at each position in the image map Mb, the median value of the property prediction values, or an arbitrary value, but is limited to these. not a thing
- the candidate point determination unit 331 determines whether or not the characteristic prediction value indicated at each of the plurality of candidate points superimposed on the image map Mb is equal to or greater than the reference value. If it is determined to be greater than or equal to the value, a flag indicating 1, for example, is attached to the candidate point. On the other hand, when the candidate point determining section 331 determines that the predicted characteristic value indicated at the candidate point is less than the reference value, it flags the candidate point as 0, for example. Candidate point determination section 331 then outputs the plurality of candidate points and flags to image processing section 334 .
- the image processing unit 334 when the image processing unit 334 acquires a plurality of candidate points and flags from the candidate point determination unit 331, as shown in FIG. assign a star-shaped mark, for example.
- the image processing unit 334 assigns, for example, an inverted triangle mark to a candidate point to which a flag indicating 0 is added.
- the image processing unit 334 superimposes a mark of the form assigned to the candidate point on the candidate point on the image map Mb, and displays an image including the image map Mb on which the mark is superimposed on the display unit 140. .
- the candidate points indicated by the marks of each aspect are superimposed and displayed on the image map Mb.
- the candidate point determination unit 331 uses a plurality of reference values to classify the plurality of candidate points into three or more groups according to the comparison result between the reference values and the characteristic prediction value of each candidate point. may Alternatively, as in the example of FIG. 32, the candidate point determining unit 331 uses the above-described priority instead of the characteristic prediction value of the candidate point, and according to the result of comparison between the priority reference value and the priority of each candidate point, A plurality of candidate points may be classified into a plurality of groups. For example, as shown in FIG. 35, when a plurality of candidate points are classified into two groups, the candidate point determination unit 331 associates the plurality of candidate points with group identification information indicating the group to which the candidate points belong, and images the image. Output to the processing unit 334 .
- the image processing unit 334 acquires a plurality of candidate points and group identification information from the candidate point determination unit 331, as shown in FIG. is assigned a star-shaped mark, for example.
- the image processing unit 334 assigns, for example, an inverted triangle mark to candidate points corresponding to group identification information indicating groups whose priority is less than the priority reference value.
- the image processing unit 334 superimposes a mark of the form assigned to the candidate point on the candidate point on the image map Mb, and displays an image including the image map Mb on which the mark is superimposed on the display unit 140. .
- the candidate points indicated by the marks of each aspect are superimposed and displayed on the image map Mb.
- the user can easily grasp the group to which each candidate point superimposed on the image map Mb belongs, that is, the feature of the candidate point corresponding to the group, for example, whether the predicted characteristic value or priority is large or small. be able to.
- FIG. 36 is a diagram showing another example of the image map Mb in this modified example.
- the input unit 110 outputs third display method information indicating the number of candidate points to the display method acquisition unit 133 in response to an input operation to the input unit 110 by the user.
- Display method acquisition section 133 acquires the third display method information and outputs the third display method information to candidate point determination section 331 .
- the candidate point determination unit 331 receives the third display method information from the display method acquisition unit 133, and determines the number of candidate points indicated by the third display method information for each image element map Ma of the image map Mb. . This allows the user to easily confirm the candidate points widely dispersed on the image map Mb.
- the image map Mb includes a plurality of image element maps Ma arranged in a matrix along each of the first coordinate axis and the second coordinate axis.
- Each of the element maps Ma has a third coordinate axis and a fourth coordinate axis.
- Image processing unit 334 converts the first coordinate axis, second coordinate axis, third coordinate axis, and fourth coordinate axis into first, second, third, and fourth variables used to express the composition of the compound. Associate each with a variable. Then, for each of the plurality of compounds, the image processing unit 334 associates the number of first variables and the value of the second variable used to express the configuration of the compound among the plurality of image element maps Ma.
- the image processing unit 334 places the compound on the specified image element map Ma at positions corresponding to the values of the third variable and the value of the fourth variable used to express the configuration of the compound.
- Map property predictors are the variables a, b, x and y described above.
- a map such as the image map Mb can indicate the property prediction values for the configurations of a plurality of compounds each represented by four variables, and can display the property prediction values of the compounds in a wide range in an easy-to-understand manner. can. As a result, the efficiency of searching for materials can be improved.
- the third display method information indicates the number of candidate points superimposed on each of the plurality of image element maps Ma as the candidate point display method.
- the image processing unit 334 superimposes the number of candidate points indicated by the third display method information on each of the plurality of image element maps Ma.
- the candidate points can be evenly superimposed on the plurality of image element maps Ma included in the image map Mb.
- the user can easily confirm candidate points widely dispersed in the image map Mb.
- Embodiment 2B As in Embodiment 2A, the display system according to the present embodiment generates a map indicating the property prediction value of each of a plurality of compounds, superimposes the candidate points on the map, and further adds one or more compounds. Each characteristic experimental value is also superimposed on the map. It should be noted that among the constituent elements in this embodiment, the constituent elements that are the same as those in Embodiment 2A are given the same reference numerals as in Embodiment 2A, and detailed description thereof will be omitted. Also, the map in the present embodiment is the image element map Ma, but may be the image map Mb.
- FIG. 37 is a block diagram showing an example of the configuration of display system 400 in this embodiment.
- the property display device 430 in the present embodiment superimposes not only the candidate points but also the property experimental values of the compound obtained by experiments on the image element map Ma, and the image element map on which the candidate points and the property experimental values are superimposed.
- An image containing Ma is displayed on the display unit 140 .
- Such a characteristic display device 430 includes a search range acquisition unit 131, a predicted value acquisition unit 132, a display method acquisition unit 133, an experimental value acquisition unit 232, a candidate point determination unit 331, and an image processing unit 434.
- the characteristic display device 430 may be composed of a processor such as a CPU and a memory, for example. In this case, the processor functions as the characterization device 430, for example by executing a computer program stored in memory.
- the memory may be volatile or nonvolatile, and may be composed of a volatile memory and a nonvolatile memory.
- the experimental value acquisition unit 232 acquires from the experimental database 150 the configuration and characteristic experimental values of one or more compounds that have been tested. Then, the experimental value acquisition unit 232 outputs the configuration and characteristic experimental values acquired for each of the one or more tested compounds to the candidate point determination unit 331 and also to the image processing unit 434 .
- image processing unit 434 generates the image element map Ma as in the embodiment 2A. Further, as in Embodiment 2A, image processing unit 434 acquires the third display method information from display method acquisition unit 133, and according to the third display method information, the 1 point determined by candidate point determination unit 331 is displayed. One or more candidate points are superimposed on the image element map Ma. Furthermore, the image processing unit 434 acquires from the experimental value acquisition unit 232 the configurations and characteristic experimental values of one or more compounds that have been tested. Then, the image processing unit 434 superimposes the characteristic experimental values of the one or more compounds that have been experimented on the image element map Ma.
- the image processing unit 434 In superimposing the characteristic experimental value of the compound, the image processing unit 434 superimposes the characteristic experimental value of the compound on the position on the image element map Ma corresponding to the configuration of the compound. That is, the image processing unit 434 superimposes a mark indicating the characteristic experimental value on the image element map Ma. Then, the image processing unit 434 outputs to the display unit 140 an image including an image element map Ma on which one or more experimental characteristic values of one or more compounds that have been tested and one or more candidate points are superimposed.
- FIG. 38 is a diagram showing an example of an image element map Ma on which candidate points and characteristic experimental values are superimposed.
- the image processing unit 434 superimposes the candidate points as marks such as stars on the image element map Ma according to the third display method information. That is, the candidate point determination unit 331 determines one or more candidate points from all positions of the image element map Ma, and the image processing unit 434 superimposes a star mark on the one or more candidate points. Further, the image processing unit 434 superimposes the characteristic experimental value of the compound on the image element map Ma as a mark such as a circle. That is, when the image processing unit 434 acquires from the experimental value acquiring unit 232 the configuration and characteristic experimental values of each of one or more compounds that have been tested, the image element map Ma corresponding to the configuration of the compound is obtained. Overlaid on the upper position is a circular mark with color gradation according to the experimental value of the compound's properties.
- the experimental value acquisition unit 232 acquires the characteristic experimental values of one or more compounds that have been tested. Then, the image processing unit 434 superimposes each characteristic experimental value of the one or more compounds that have been tested on the position on the image element map Ma corresponding to the configuration of the compound. The image processing unit 434 generates an image including an image element map Ma on which one or more candidate points and one or more characteristic experimental values are superimposed.
- FIG. 39 is a diagram showing another example of the image element map Ma on which candidate points and characteristic experimental values are superimposed.
- the candidate point determination unit 331 selects, from among the above-described plurality of temporary candidate points that can be candidate points, a position that is at least a predetermined distance away from the position of any characteristic experimental value as a final determined as a candidate point.
- the predetermined distance is, for example, three times the step width (ie, one memory) of each of the continuous variables x and y. That is, it can be said that the predetermined distance is 3 memories. Note that this predetermined distance is also called a second minimum separation distance.
- the image processing unit 434 superimposes one or more candidate points determined as described above by the candidate point determination unit 331 on the image element map Ma according to the third display method information. Furthermore, the image processing unit 434 also superimposes the characteristic experimental value of the compound that has already been tested on the position on the image element map Ma corresponding to the composition of the compound.
- candidate points can be excluded from the position corresponding to the configuration of the compound that has already been tested (that is, the position of the characteristic experimental value) and its surroundings, and an efficient search for candidate points can be performed.
- the third display method information uses the predetermined second minimum separation distance between the candidate point and the position of the characteristic experimental value as the candidate point display method. show.
- the image processing unit 434 separates one or more candidate points from the positions of the one or more characteristic experimental values obtained by the experimental value obtaining unit 232 by a second minimum separation distance or more, and superimposes them on the image element map Ma. .
- FIG. 40 is a diagram showing an example of state transition of the image element map Ma.
- the image processing unit 434 displays the image element map Ma shown in (a) of FIG. A plurality of candidate points are superimposed on the image element map Ma shown in FIG. 40(a), and characteristic experimental values are not superimposed.
- the user conducts an experiment on one candidate point b1 out of a plurality of candidate points in the image element map Ma. Specifically, the user conducts an experiment on a compound having the configuration indicated by candidate point b1.
- the experiment data in the experiment database 150 is updated by this experiment. That is, the composition and property experimental values of the new compound are written into the experimental data.
- the experimental value acquisition unit 232 acquires the configuration and characteristic experimental values of the new compound, and outputs them to the candidate point determination unit 331 and the image processing unit 434 .
- the image processing unit 434 acquires the configuration and characteristic experimental values of the new compound from the experimental value acquisition unit 232, as shown in FIG.
- the characteristic experimental values are superimposed. That is, the display unit 140 displays the image element map Ma in which the new characteristic experimental value is superimposed on the position of the candidate point b1.
- the display method acquisition unit 133 acquires information corresponding to the input operation by the user from the input unit 110 . That is, the display method acquiring unit 133 acquires the third display method information indicating the display method in which only the candidate points separated by the second minimum separation distance or more from the position of the characteristic experimental value are displayed. Then, display method acquisition section 133 outputs the third display method information to candidate point determination section 331 and image processing section 434 . As a result, as in the example of FIG.
- the candidate point determination unit 331 selects the second minimum value from the position of the characteristic experimental value among the plurality of candidate points superimposed on the image element map Ma shown in (b) of FIG. Only the candidate points that are separated by the separation distance or more are left, and the candidate points that are not separated by the second minimum separation distance or more from the position of the characteristic experimental value are deleted. That is, the candidate point determination unit 331 re-determines and updates the candidate points.
- the image processing unit 434 displays on the display unit 140 the image element map Ma in which the one or more candidate points thus re-determined and the characteristic experimental values are superimposed. This allows the user to proceed with the experiment more efficiently.
- the image element map Ma shown in (b) of FIG. may not display the image element map Ma shown in FIG. 40(b). That is, the image element map Ma shown in (a) of FIG. 40 may be displayed, and after the experiment is conducted, the image element map Ma shown in (c) of FIG. 40 may be directly displayed. Further, after the image element map Ma shown in FIG. 40(c) is displayed, when the experiment is repeated and new characteristic experimental values are obtained, the same processing as described above is repeatedly executed.
- the candidate point determining unit 331 determines that, among the plurality of candidate points superimposed on the image element map Ma shown in FIG. Only candidate points are left, and candidate points that are not separated by the second minimum separation distance or more from the position of the new characteristic experimental value are deleted. As a result, a plurality of candidate points superimposed on the image element map Ma shown in (c) of FIG. 40 are updated.
- FIG. 41 is a diagram showing an example of state transition of the image element map Ma.
- the candidate point determination unit 331 determines a plurality of candidate points and an experimental plan as shown in FIG. 41(a).
- the experimental plan is information indicating which candidate points should be tested in which order among the plurality of candidate points.
- Candidate point determination section 331 outputs information indicating the plurality of determined candidate points and the experimental plan to image processing section 434 .
- the image processing unit 434 acquires information indicating a plurality of candidate points and the experimental plan from the candidate point determination unit 331. Then, the image processing unit 434 superimposes the plurality of candidate points on the image element map Ma. Furthermore, the image processing unit 434 attaches the experiment number of each of the n plan candidate points included in the experiment plan to the image element map Ma, and further adds from one plan candidate point to the plan candidate point of the next experiment number. is superimposed on the image element map Ma.
- the user conducts an experiment on a compound (that is, a candidate compound) having the configuration indicated by the planned candidate point of experiment number (1).
- the characteristic experimental value of the compound is obtained, and the experimental data in the experimental database 150 is updated.
- the composition and characteristic experimental values of new compounds obtained by experiments are written in the experimental data.
- the experimental value acquisition unit 232 acquires the configuration and characteristic experimental values of the new compound, and outputs them to the candidate point determination unit 331 and the image processing unit 434 .
- the image processing unit 434 acquires the configuration and characteristic experimental values of the new compound from the experimental value acquisition unit 232, as shown in FIG. That is, the characteristic experimental value is superimposed on the position of the planned candidate point of experiment number (1). That is, instead of the planned candidate point of experiment number (1), the new characteristic experiment value is superimposed on the image element map Ma.
- the candidate point determination unit 331 acquires the configuration and characteristic experimental values of the new compound from the experimental value acquisition unit 232 .
- the candidate point determination unit 331 selects the second candidate point from the position of the characteristic experimental value among the plurality of candidate points superimposed on the image element map Ma shown in (a) of FIG. Retain only candidate points that are separated by at least the minimum separation distance. Then, the candidate point determination unit 331 deletes candidate points that are not separated by the second minimum distance or more from the position of the characteristic experimental value. In other words, the candidate point determination unit 331 re-determines and updates the candidate points, and as shown in FIG.
- Eliminate for example, three candidate points that are not separated from the position by more than a second minimum separation distance.
- the image processing unit 434 generates an image element map Ma on which one or more re-determined candidate points and characteristic experimental values are superimposed, that is, four plans of experiment numbers (2) to (5).
- An image element map Ma in which a plurality of candidate points including candidate points and characteristic experimental values are superimposed is displayed on the display unit 140 .
- the user further conducts an experiment on a compound (that is, a candidate compound) having a configuration indicated by the planned candidate point of experiment number (2), for example.
- a compound that is, a candidate compound
- the characteristic experimental value of the compound is obtained, and the experimental data in the experimental database 150 is updated.
- the experimental value acquisition unit 232 acquires the configuration and characteristic experimental values of the new compound, and outputs them to the candidate point determination unit 331 and the image processing unit 434, as described above.
- the image processing unit 434 acquires the configuration and characteristic experimental values of the new compound from the experimental value acquisition unit 232, as shown in (c) of FIG. That is, the characteristic experimental value is superimposed on the position of the planned candidate point of experiment number (2). That is, instead of the planning candidate point of experiment number (2), a new characteristic experimental value is superimposed on the image element map Ma.
- the predictors in the predictor database 120 may be updated to the latest state according to the update result of the experimental data. For example, if the predictor is a model obtained by supervised machine learning, re-learning is performed on the predictor using the configuration and characteristic experimental values of the compound newly added to the experimental data as the teacher data. be.
- the predicted value acquiring unit 132 acquires the updated predictor from the predictor database 120, and uses the predictor to reacquire the property predicted values corresponding to the configurations of the plurality of compounds.
- the candidate point determination unit 331 acquires the composition and characteristic predicted values of each of the plurality of compounds from the predicted value acquisition unit 132, and based on these, determines one or more candidate points again. As a result, for example, as shown in FIG. 41(c), two new candidate points are added around the planned candidate point of experiment number (5).
- the candidate point determination unit 331, as shown in FIG. Eliminate, for example, two candidate points that are not separated from the location by more than a second minimum separation distance.
- the image processing unit 434 generates an image element map Ma on which the one or more candidate points thus re-determined and the characteristic experimental values are superimposed, that is, the three plans of experiment numbers (3) to (5)
- An image element map Ma in which a plurality of candidate points including candidate points and two characteristic experimental values are superimposed is displayed on the display unit 140 . This allows the user to proceed with the experiment more efficiently.
- the processing by the experimental value acquiring unit 232 is repeatedly executed, and when a new characteristic experimental value is acquired, The image processing unit 434 updates one or more candidate points already superimposed so that all the candidate points superimposed on the image element map Ma are separated from the new characteristic experimental value by the second minimum separation distance or more. .
- FIG. 42 is a flow chart showing the processing operation of the display system 400 in this embodiment.
- the display system 400 in the present embodiment executes the processes of steps S111, S112, S121, S131, and S132 shown in FIG. 33, like the display system 300 in the embodiment 2A. Next, the display system 400 executes the processes of steps S141 and S142.
- Step S141 The image processing unit 434 acquires the composition and property prediction values of each of the plurality of compounds from the prediction value acquisition unit 132 . Furthermore, the image processing unit 434 acquires one or more candidate points from the candidate point determination unit 331 . Furthermore, the image processing unit 434 acquires from the experimental value acquisition unit 232 the configurations and characteristic experimental values of one or more compounds that have been tested. Also, the image processing unit 434 receives third display method information from the display method acquisition unit 133 .
- the image processing unit 434 generates an image element map Ma based on the respective configurations and property prediction values of the plurality of compounds that have been acquired. Furthermore, the image processing unit 434 superimposes one or more candidate points acquired from the candidate point determination unit 331 on the image element map Ma, and obtains one or more characteristic experimental values acquired from the experimental value acquisition unit 232. It is superimposed on the image element map Ma. The candidate points are superimposed according to the third display method information. The image processing unit 434 outputs to the display unit 140 an image including the image element map Ma on which the one or more candidate points and characteristic experimental values are superimposed.
- Step S142 The display unit 140 acquires an image from the image processing unit 434 and displays the image, that is, the image including the image element map Ma on which one or more candidate points and characteristic experimental values are superimposed.
- the characteristics of the compound's predicted values, candidate points, and experimental characteristics are displayed.
- the user can appropriately recognize the overall image of the characteristic experimental values on the image element map Ma while comparing them with the characteristic predicted values and the candidate points.
- the display system in this modification has a function of storing and displaying an image generated by the characteristic display device 430, that is, an image including an image element map Ma on which one or more candidate points and characteristic experimental values are superimposed.
- the constituent elements that are the same as in Embodiment 2B are given the same reference numerals as in Embodiment 2B, and detailed description thereof will be omitted.
- FIG. 43 is a block diagram showing an example of the configuration of the display system 401 in this modified example.
- a display system 401 shown in FIG. 43 includes all the components of the display system 400 in Embodiment 2B and an image storage unit 410 .
- the image storage unit 410 is a recording medium for storing, as a characteristic display image, an image generated by the image processing unit 434 and containing an image element map Ma on which one or more candidate points and characteristic experimental values are superimposed.
- This recording medium is, for example, a hard disk drive, RAM, ROM, or semiconductor memory. Also, the recording medium may be volatile or non-volatile.
- Image processing section 434 in this modified example generates a characteristic display image and stores the generated characteristic display image in image storage section 410, as in the case of Embodiment 2B. At this time, the image processing unit 434 may add date information indicating the date when the characteristic display image was generated to the characteristic display image, and may include information such as the search range used to generate the characteristic display image. It may be added as reference information.
- the image processing unit 434 when the image processing unit 434 receives from the display method acquisition unit 133 the third display method information indicating the display method of the past characteristic display image, the image processing unit 434 displays one or more images from the image storage unit 410 according to the third display method information. Read the characteristic display image. Then, image processing section 434 generates a history list image including the one or more characteristic display images and outputs it to display section 140 .
- FIG. 44 is a diagram showing an example of a history of characteristic display images.
- the input unit 110 receives an input operation by the user, and outputs to the display method acquisition unit 133 the third display method information indicating the search range and period according to the input operation as the display method for the past characteristic display image.
- the period is, for example, from January 2021 to March 2021.
- the display method acquisition unit 133 acquires the third display method information and outputs the third display method information to the image processing unit 434 .
- the image processing unit 434 After acquiring the third display method information from the display method acquisition unit 133 , the image processing unit 434 searches the image storage unit 410 for one or more characteristic display images corresponding to the third display method information. That is, the image processing unit 434 adds reference information indicating the same search range as the search range indicated by the third display method information, and date information indicating a date within the period indicated by the third display method information. is added from the image storage unit 410 .
- the image processing unit 434 arranges the one or more characteristic display images found by the search in the order of the dates of the date information attached to them, thereby generating a history list image, and generating the history list image.
- the image is output to display unit 140 .
- a history list image is displayed on the display unit 140 as shown in FIG. 44, for example.
- the history list image includes a characteristic display image generated on January 20, 2021 shown in FIG. 44(a) and a characteristic display image generated on February 20, 2021 shown in FIG. A display image and a characteristic display image generated on March 20, 2021 shown in FIG. 44(c). These characteristic display images are arranged in descending order of date.
- the user can easily grasp the update status of the characteristic experimental values and candidate points for each month during the period specified by the user's input operation, ie, three months.
- the history list image includes three characteristic display images. may be displayed. Conversely, if there are one or two characteristic display images corresponding to the third display method information, a history list image including one or two characteristic display images may be displayed. Also, if the number of characteristic display images corresponding to the third display method information is equal to or greater than a predetermined number (for example, 100), those characteristic display images may be thinned out. As a result, a history list image containing less than a predetermined number of characteristic display images is displayed. As a result, it is possible to prevent a large number of characteristic display images from being displayed in the history list image, thereby making each characteristic display image easier to see.
- a predetermined number for example, 100
- the image processing unit 434 stores the plurality of images in the image storage unit. 410 to generate a composite image including the plurality of images and output it to the display unit 140 .
- the composite image is the history list image described above.
- the display system according to the present embodiment As in Embodiment 2B, the display system according to the present embodiment generates a map showing property predicted values for each of a plurality of compounds, and superimposes candidate points and property experimental values on the map.
- the characteristic display device according to the present embodiment acquires the candidate points from the database without determining the candidate points from characteristic predicted values or the like.
- the same components as in Embodiments 2A and 2B are assigned the same reference numerals as those in Embodiments 2A and 2B, and detailed descriptions thereof are omitted.
- the map in the present embodiment is the image element map Ma, but may be the image map Mb.
- FIG. 45 is a block diagram showing an example of the configuration of display system 500 in this embodiment.
- a display system 500 shown in FIG. 45 includes an input unit 110 , a predictor database 120 , a characteristic display device 530 , a display unit 140 , an experiment database 150 and a candidate point database (DB) 510 .
- the characteristic display device 530 is an example of an information display device.
- Characteristic display device 530 in the present embodiment includes search range acquisition section 131, predicted value acquisition section 132, display method acquisition section 133, experimental value acquisition section 232, candidate point acquisition section 531, image processing section 534, and and Note that the characteristic display device 530 may be composed of a processor such as a CPU and a memory, for example. In this case, the processor functions as the characterization device 530, for example by executing a computer program stored in memory. Note that the memory may be volatile or nonvolatile, and may be composed of a volatile memory and a nonvolatile memory.
- the predicted value acquiring unit 132 in the present embodiment outputs the composition and property predicted values of each of the plurality of compounds to the image processing unit 534.
- the experimental value acquisition unit 232 in the present embodiment outputs the configuration and characteristic experimental values of one or more compounds to the image processing unit 534 .
- display method acquisition section 133 in the present embodiment outputs the third display method information to image processing section 534 .
- predicted value acquisition section 132 , experimental value acquisition section 232 , and display method acquisition section 133 according to the present embodiment do not output information for determining candidate points to candidate point acquisition section 531 .
- the candidate point acquisition unit 531 acquires the search range signal from the search range acquisition unit 131, for example.
- Candidate point acquisition section 531 searches candidate point database 510 for one or more compounds having a configuration included in the search range indicated by the search range signal.
- the candidate point acquisition unit 531 acquires the configuration of the compound found by the search as a candidate point from the candidate point database 510 and outputs the candidate point to the image processing unit 534 .
- the image processing unit 534 acquires the configuration and property prediction values of each of the plurality of compounds from the prediction value acquisition unit 132, and from the experimental value acquisition unit 232, the configuration and properties of each of the one or more compounds that have been tested. get the value. Also, the image processing unit 534 acquires one or more candidate points from the candidate point acquisition unit 531 and receives the third display method information from the display method acquisition unit 133 . The image processing unit 534 generates an image element map Ma indicating property predicted values of a plurality of compounds, and superimposes property experimental values of one or more tested compounds on the image element map Ma. Furthermore, the image processing unit 534 superimposes one or more candidate points on the image element map Ma according to the third display method information. Then, the image processing unit 534 outputs to the display unit 140 an image including the image element map Ma on which one or more compound characteristic experimental values and one or more candidate points are superimposed.
- the candidate point database 510 stores candidate point data indicating the composition of each of a plurality of compounds.
- FIG. 46 is a diagram showing an example of candidate point data stored in the candidate point database 510.
- the candidate point data indicates, for each of a plurality of compounds, the control number, composition formula, firing method, firing temperature, and firing time of the compound as the composition of the compound.
- the firing method, firing temperature and firing time are process conditions for firing the compound.
- the candidate point data includes the control number "1" for one compound, the composition formula "Li1.45La0.90Ti1.0Ga0.10O3", the firing method "1: solid phase method", the firing temperature “100° C.” and firing time “3 hours” are indicated.
- the candidate point acquisition unit 531 acquires, for example, a search range signal from the search range acquisition unit 131, and acquires the compositional formula of the compound included in the search range indicated by the search range signal as a candidate point from the candidate point data. That is, the candidate point acquisition unit 531 generates all combinations of option data for each of the variables M3, M3', M4, M4', x, y, a, and b included in the search range. Then, for each combination, the candidate point acquisition unit 531 acquires the composition formula having that combination as a candidate point from the candidate point data.
- the candidate point acquisition unit 531 selects all option data for each of the multiple variables including variables Pa, Pb, and Pc. Generate combinations. Then, for each combination, the candidate point acquisition unit 531 acquires the composition formula and process conditions corresponding to the combination as candidate points from the candidate point data. Alternatively, the candidate point acquisition unit 531 may acquire, as candidate points, the composition formulas or the composition formulas and process conditions of all compounds indicated in the candidate point data, regardless of the search range.
- FIG. 47 is a diagram showing an example of an image element map Ma on which candidate points and characteristic experimental values are superimposed.
- the candidate point acquisition unit 531 acquires each configuration of one or more compounds from the candidate point database 510 as candidate points. At this time, the candidate point acquiring unit 531 acquires not only the candidate point but also the management number associated with the configuration (that is, the composition formula, etc.) that is the candidate point.
- Candidate point acquisition section 531 then outputs the candidate point and the management number to image processing section 534 .
- the image processing unit 534 generates an image element map Ma indicating property prediction values of each of a plurality of compounds, as shown in FIG. Then, the image processing unit 534 converts the one or more candidate points acquired by the candidate point acquiring unit 531 and the characteristic experimental values of one or more tested compounds acquired by the experimental value acquiring unit 232 to each other. , is superimposed on the image element map Ma. Further, the image processing unit 534 superimposes the reference image a1 indicating the management number acquired by the candidate point acquisition unit 531 together with each of the one or more candidate points on the image element map Ma in association with the candidate points.
- the reference image may have the form of balloons from candidate points.
- the image processing unit 534 outputs to the display unit 140 an image including the image element map Ma in which the characteristic experimental values of one or more compounds that have been tested, the one or more candidate points, and the reference image a1 are superimposed. do.
- the image element map Ma is displayed on the display unit 140 as shown in FIG.
- the image processing unit 534 may display the process conditions on the display unit 140.
- the user selects one candidate point by performing an input operation on the input unit 110 . More specifically, the user selects a desired candidate point by moving the cursor to the desired candidate point using a mouse or the like included in the input unit 110 and clicking the button of the mouse.
- the display method acquisition unit 133 acquires an input signal corresponding to the input operation from the input unit 110, and notifies the image processing unit 534 of the candidate point selected by the user indicated by the input signal.
- the image processing section 534 displays on the display section 140 a reference image showing the process conditions corresponding to the selected candidate point. For example, the process conditions may be included and displayed in the reference image a1 described above.
- the image processing unit 534 may pre-superimpose a reference image indicating the control number and process conditions for each of the one or more candidate points on the image element map Ma, regardless of the user's input operation. good.
- the image processing unit 534 first displays the image element map Ma that does not include the reference image a1 on the display unit 140, and after the user performs an input operation on the input unit 110, the image element map shown in FIG. Map Ma may be displayed on display unit 140 . That is, after the user's input operation, the reference image a1 indicating the management number for each candidate point is superimposed on the image element map Ma, and an image including the image element map Ma is displayed on the display unit 140.
- the image processing unit 534 when the input operation by the user is an operation of selecting one candidate point, the image processing unit 534 superimposes the reference image a1 on the image element map Ma only for the selected candidate point, An image including the image element map Ma may be displayed on the display unit 140 .
- the candidate point acquisition unit 531 acquires one or more candidate points from the candidate point database 510, and the image processing unit 534 acquires the acquired one or more candidate points. are superimposed on the image element map Ma.
- the candidate point database 510 stores candidate point data indicating the composition of the compound. For example, as shown in FIG. 46, the candidate point database 510 stores candidate point data indicating multiple candidate points (that is, multiple composition formulas).
- the candidate points are obtained from a database such as the candidate point database 510, so that the candidate points are obtained from the image element map Ma regardless of the property prediction values of the plurality of compounds obtained by the prediction value obtaining unit 132. can be superimposed on Therefore, it is possible to display candidate points that are preliminarily important on the image element map Ma. As a result, the efficiency of searching for materials can be improved.
- FIG. 48 is a flow chart showing the processing operation of display system 500 in this embodiment.
- the display system 500 according to the present embodiment executes the processes of steps S111, S112, S121, and S131 shown in FIG. 42, like the display system 400 according to the second embodiment. Furthermore, the display system 500 executes the processes of steps S151, S152 and S153.
- Step S151 Candidate point acquisition section 531 acquires each of one or more candidate points and the management number associated with the candidate point from the candidate point data of candidate point database 510 . Then, the candidate point acquiring section 531 outputs the acquired one or more candidate points and their management numbers to the image processing section 534 .
- the image processing unit 534 acquires the composition and property prediction value of each of the plurality of compounds from the prediction value acquisition unit 132 . Furthermore, the image processing unit 534 acquires one or more candidate points and their management numbers from the candidate point acquiring unit 531 . Further, the image processing unit 534 acquires from the experimental value acquisition unit 232 the configurations and characteristic experimental values of one or more compounds that have been tested. Also, the image processing unit 534 receives third display method information from the display method acquisition unit 133 .
- the image processing unit 534 generates an image element map Ma based on the configurations and property prediction values of each of the acquired compounds. Furthermore, the image processing unit 534 superimposes one or more candidate points acquired from the candidate point acquisition unit 531 on the image element map Ma, and generates a reference image a1 indicating the management numbers corresponding to those candidate points. It is superimposed on the image element map Ma in association with the candidate points. The candidate points are superimposed according to the third display method information. Furthermore, the image processing unit 534 superimposes one or more characteristic experimental values acquired from the experimental value acquiring unit 232 on the image element map Ma. The image processing unit 534 outputs to the display unit 140 an image including the image element map Ma on which the one or more candidate points, the reference image a1, and the characteristic experimental values are superimposed.
- Step S153 The display unit 140 acquires an image from the image processing unit 534 and displays the image, that is, the image element map Ma on which one or more candidate points, the reference image a1 and the characteristic experimental values are superimposed.
- the properties of the compound's predicted value, candidate point, control number, and property experimental value are displayed.
- the user can appropriately recognize the overall image of the property predicted values, property experimental values, and candidate points on the image element map Ma, and can easily grasp the management number associated with the candidate points. .
- the display system displays the characteristic evaluation values of a plurality of compounds in the form of a map instead of the respective characteristic predicted values of the compounds used in the first and second embodiments.
- the property evaluation value is an evaluation value for the property of a compound having a configuration corresponding to each position on the map, and is treated as an experimental index for the property of the compound.
- Such a characteristic evaluation value indicates a value according to the selected calculation method. Therefore, when the calculation method is the same as the calculation method for obtaining the characteristic predicted value in the first and second embodiments, the display system in the present embodiment can perform characteristic evaluation as in the first and second embodiments.
- the property prediction values are displayed in the form of a map as values.
- the display system according to the present embodiment superimposes each configuration of one or more compounds that have been tested on the map as experimental points. Further, the display system according to the present embodiment displays the image including the map as the first image, and changes the first image to the second image when the display method of the characteristic evaluation values is changed.
- FIG. 49 is a block diagram showing an example of the configuration of display system 600 in this embodiment.
- a display system 600 shown in FIG. 49 includes an input section 110 , an evaluator database (DB) 620 , a characteristic display device 630 , a display section 140 , an evaluation display database (DB) 640 and an experiment database 650 .
- the characteristic display device 630 is an example of an information display device.
- the property display device 630 in the present embodiment uses the evaluator database 620 and the evaluation display database 640 to acquire property evaluation values for each of a plurality of compounds. Then, the characteristic display device 630 generates a map showing the obtained characteristic evaluation values. Further, property display device 630 displays the respective experimental points of one or more compounds superimposed on the map on display 140 .
- Such a characteristic display device 630 includes an evaluation value acquisition section 632 , a display method acquisition section 633 , an experimental point acquisition section 635 and an image processing section 634 .
- the characteristic display device 630 may be composed of a processor such as a CPU and a memory, for example. In this case, the processor functions as the characterization device 630, for example by executing a computer program stored in memory.
- the memory may be volatile or nonvolatile, and may be composed of a volatile memory and a nonvolatile memory.
- the map in the present embodiment is the image map Mb, it may be an image element map Ma or a map composed of a plurality of image maps Mb.
- Display method acquisition unit 633 acquires an input signal from the input unit 110, and acquires the first information d10 regarding the display method of the characteristic evaluation value from the evaluation display database 640 according to the input signal. The display method acquisition unit 633 then outputs the first information d10 to the evaluation value acquisition unit 632, the experiment point acquisition unit 635, and the image processing unit 634. FIG. As a result, an image including a map according to the display method indicated by the first information d10 is displayed on the display unit 140 as the first image.
- the display method acquisition unit 633 acquires an input signal indicating a change in the display method from the input unit 110
- the first information d10 is changed according to the input signal
- the changed first information d10 is obtained as an evaluation value. It outputs to the section 632 , the experimental point acquisition section 635 and the image processing section 634 . As a result, an image including the map according to the changed first information d10 is displayed on the display unit 140 as the second image.
- evaluation value acquisition unit 632 acquires the first information d10 from the display method acquisition unit 633. FIG. Then, the evaluation value acquisition unit 632 generates all possible combinations of option data for each of the plurality of variables included in the search range indicated by the first information d10. The composition of the compound (for example, compositional formula) is expressed by the combination. Therefore, multiple configurations are generated according to their combination.
- the evaluation value acquisition unit 632 acquires one or more evaluators from the evaluator database 620 and inputs the generated multiple configurations to each of the one or more evaluators. As a result, the evaluation value obtaining unit 632 obtains, for each structure, a property evaluation value for each of one or more properties of the compound having that structure. At this time, the evaluation value acquiring unit 632 acquires those characteristic evaluation values according to the first information d10 described above.
- the experimental point acquisition unit 635 acquires the first information d10 from the display method acquisition unit 633.
- the experimental point acquiring unit 635 acquires from the experimental database 650 the configuration of each of the one or more compounds that have been experimented corresponding to the search range indicated by the first information d10, and each of the one or more compounds is output to the image processing unit 634 as an experimental point.
- the experimental point acquisition unit 635 may acquire the configurations of all the compounds stored in the experimental database 650 as experimental points, regardless of the search range.
- the image processing unit 634 acquires the characteristic evaluation values of each of the plurality of compounds from the evaluation value acquiring unit 632 and acquires the experimental points of one or more tested compounds from the experimental point acquiring unit 635 . Furthermore, the image processing unit 634 receives the first information d10 from the display method acquisition unit 633 . The image processing unit 634 generates a map showing property evaluation values of a plurality of compounds according to the first information d10, and superimposes one or more experimental points acquired by the experimental point acquiring unit 635 on the map.
- the image processing unit 634 assigns a color with a degree of gradation according to the characteristic evaluation value of each of the plurality of compounds to the map corresponding to the composition of the compound. put in position.
- the color with the gradation corresponding to the characteristic evaluation value may be a color corresponding to the characteristic evaluation value.
- the image processing unit 634 in superimposing the experimental points, superimposes a black circular mark on the position on the map corresponding to the experimental point of each of one or more tested compounds.
- the image processing unit 634 outputs the image including the map on which one or more experimental points are superimposed in this manner to the display unit 140 as the first image or the second image.
- the evaluator database 620 is a recording medium storing at least one evaluator for evaluating characteristic values of compounds.
- This recording medium is, for example, a hard disk drive, RAM, ROM, or semiconductor memory. Also, the recording medium may be volatile or non-volatile.
- An evaluator is a computer program based on a predetermined computational algorithm constructed, for example, by machine learning. This evaluator outputs, as a characteristic evaluation value, an evaluation value of a characteristic value of a compound having the composition (that is, a combination of a plurality of variables) input from the evaluation value acquisition unit 632 .
- the configuration is expressed by a combination of option data that can be taken by each of the multiple variables included in the search range.
- a characteristic evaluation value is an index of an experiment, and an example is a predicted characteristic value obtained by machine learning models such as Least Absolute Shrinkage and Selection Operator (LASSO) regression and Random Forest regression.
- the predicted value corresponds to the characteristic predicted value of the first and second embodiments.
- the characteristic evaluation value may be an output value of an acquisition function in Bayesian optimization.
- the acquisition function is a function for determining the candidate for the next experiment (ie, the candidate for the composition of the compound used in the next experiment, or the candidate compound of Embodiment 2). Examples of such acquisition functions include Expected Improvement (EI), Probability of Improvement (PI), Upper Confidence Bound (UCB), etc., which use the mean of predicted values and the variance of predicted values by Gaussian Process regression.
- one evaluator may output characteristic evaluation values for various compound properties such as electrochemical properties and thermochemical properties.
- the evaluator database 620 stores a plurality of evaluators, and the plurality of evaluators may be selectively used according to the characteristics of the evaluation target.
- the evaluator database 620 stores an evaluator A that outputs characteristic evaluation values for electrochemical properties and an evaluator B that outputs characteristic evaluation values for thermochemical properties.
- the evaluation value acquisition unit 632 acquires the evaluator A, and uses the evaluator A to evaluate the electrochemical properties of each of the plurality of compounds. Get the property value for a property.
- the evaluation value acquiring unit 632 acquires the evaluator B, and uses the evaluator B to determine the thermochemical properties of each of the plurality of compounds. Get a property evaluation value for .
- the evaluator can output a characteristic evaluation value for a compound having a configuration expressed by a combination of multiple variables. can be in the form Such evaluation of characteristic values can also be said to be a search for characteristic values of a compound.
- the evaluation display database 640 is a recording medium that stores information regarding the method of displaying characteristic evaluation values.
- This recording medium is, for example, a hard disk drive, RAM, ROM, or semiconductor memory. Also, the recording medium may be volatile or non-volatile.
- FIG. 50 is a diagram showing an example of information stored in the evaluation display database 640.
- FIG. 50 is a diagram showing an example of information stored in the evaluation display database 640.
- the evaluation display database 640 stores first information d10, which is information regarding the method of displaying characteristic evaluation values.
- This first information d10 includes first color information d11, calculation method information d12, map arrangement information d13, search range information d14, first display target information d15, and display range information d16.
- the first color information d11 indicates, as a color attribute, at least one of the hue, saturation, and brightness of the characteristic evaluation values indicated on the map.
- the calculation method information d12 is information on the calculation method of the characteristic evaluation value, that is, information applied to the evaluator to calculate the characteristic evaluation value.
- the calculation method information d12 may be, for example, information indicating the type of the evaluator used to calculate the characteristic evaluation value, specifically, the type of the machine learning model, or may be parameters used in the evaluator. good. For example, if the evaluator is a neural network, the parameters may be weights or biases used in the neural network, or the like.
- the map arrangement information d13 is information indicating the form of the map generated by the image processing unit 634.
- the map generated by the image processing unit 634 includes a plurality of image element maps Ma having coordinate axes A1 and A2 indicating variables x and y, like the image map Mb shown in FIG. d13 indicates the arrangement method of those image element maps Ma.
- the search range information d14 indicates the search range used for calculating the characteristic evaluation value.
- the first display target information d15 indicates the characteristic of the display target regarding the characteristic evaluation value.
- the display range information d16 indicates the display range of the characteristic evaluation values. Details of each of the above-described information included in the first information d10 will be described later.
- FIG. 51 is a diagram showing an example of each data stored in the experiment database 650. As shown in FIG.
- the experiment database 650 is a recording medium storing compound basic data 651 and one or more compound detailed data 652, respectively, as experimental data.
- This recording medium is, for example, a hard disk drive, RAM, ROM, or semiconductor memory. Also, the recording medium may be volatile or non-volatile.
- the compound basic data 651 indicates basic information for each of one or more compounds that have been tested.
- Each of the one or more detailed compound data 652 indicates detailed information about the compound.
- FIG. 52 is a diagram showing an example of compound basic data 651.
- FIG. 52 is a diagram showing an example of compound basic data 651.
- the compound basic data 651 includes, for each of one or more compounds, an ID that is compound identification information of the compound, a compositional formula of the compound, process conditions of the compound, one or more characteristics of the compound, and the crystalline phase of the compound.
- the compound basic data 651 shown in FIG. 52 includes, for example, the ID of a compound that has been tested “000001-00001-001” and the composition formula of the compound “Li 1.45 La 0.045 Ti 1.1 Al 0.005 O 3 ”, process conditions “firing temperature: 400° C., firing time: 3 hours”, properties of the compound “property 1: 2.349 eV, property 2: 213° C.”, and crystal phase of the compound “cubic-perovskite ”.
- the ID which is the compound identification information, may be the name, code, or number string of the compound, as long as the compound can be identified.
- ID: 000001-00001-001 in FIG. 52 is composed of numbers in three layers (000001, 00001, 001). For example, the IDs are registered so that the numbers "000001" to "000005" of the first hierarchy are assigned to the configurations of five compounds having different composition ranges of the element Zr and the element Ti contained in the compound.
- the above-mentioned property 1 of the compound is, for example, the bandgap, and the above-mentioned property 2 is the heat resistance temperature.
- the properties 1 and 2 and the crystal phase are treated as property experimental values.
- the bandgap, the heat resistance temperature, and the crystal phase are treated as characteristic experimental values. may be broken.
- the electrical conductivity may be treated as a characteristic experimental value
- the thermoelectric conversion figure of merit is treated as a characteristic experimental value.
- FIG. 53 is a diagram showing an example of compound detailed data 652.
- the compound detailed data 652 includes an ID, which is compound identification information of a compound that has been tested, and accompanying information about the compound.
- the accompanying information is so-called metadata, and for example, the name of the researcher or experimenter who conducted the compound experiment, the registration date of the accompanying information, the temperature and humidity when the experiment was conducted, and the process Contains information and measurement data.
- Process information indicates the raw materials used to synthesize or produce the compound and the actual composition of the compound.
- the actual composition is, for example, a composition formula showing a strict composition ratio, such as Li 1.451 La 0.0450 Ti 1.102 Al 0.005 O 3.01 , or a composition ratio with three digits after the decimal point or It is a composition formula showing numerical values up to four digits.
- the process information may also indicate the experimental procedure for the compound, the shape and size of the crucible, the type of equipment used in the experiment, the serial number of that equipment, and the like.
- Measured data are data obtained by instruments to derive experimental values of properties, such as electrical resistance, differential scanning calorimetry (DSC), X-ray diffraction (XRD). -raydiffraction). Note that the measurement data is not limited to these, and may indicate arbitrary data according to the compound.
- the experimental database 650 in the present embodiment stores compound basic data 651 and compound detailed data 652, the compound basic data 651 should be stored at least.
- the compound detailed data 652 is stored in the experiment database 650, so that material development can be supported more appropriately.
- the compound detailed data 652 indicates the name of the researcher or experimenter, registration date, temperature and humidity, etc.
- the credibility of the experimental data can be improved.
- the detailed compound data 652 indicates process information, it is expected that the search for more specific material properties and the value of experimental data will be enhanced.
- the compound detailed data 652 indicates measurement data, raw data of characteristic experimental values can be easily grasped.
- [Specific example of map] 54 and 55 are diagrams showing examples of maps in this embodiment. It should be noted that FIG. 56 shows a legend of the map of FIG. 55 and the like. That is, [A] to [R] in FIG. 55 are composition formulas corresponding to A to R shown in FIG.
- an image map Mb is shown for each combination of option data for four categorical variables (M3, M3', M4, M4').
- This image map Mb is a map showing, for each combination of option data of four variables (x, y, a, b), the characteristic evaluation value of a compound having a configuration represented by that combination.
- the image map Mb consists of an array (or matrix) of a plurality of image element maps Ma.
- the two coordinate axes of the image element map Ma are assigned continuous variables x and y, and the two coordinate axes of the array of the image element map Ma (that is, the image map Mb) are assigned discrete variables a and b. Note that the method of assigning variables is not limited to this.
- the characteristic evaluation values obtained for each combination of all option data included in the search range may be displayed as they are. Further, interpolation of characteristic evaluation values may be performed for combinations other than all combinations included in the search range. Such property evaluation values are indicated by colors or color gradations, as well as property prediction values.
- FIG. 54 shows an image map Mb corresponding to each of two combinations of four categorical variables
- FIG. 55 shows an image map Mb corresponding to each of 18 combinations of four categorical variables.
- the number of image element maps Ma included in the map of the present disclosure is the number of combinations of option data for each of the two discrete variables a and b, and the number of combinations of option data for each of the four categorical variables (i.e. elements). determined by That is, the wider the search range indicated by the search range information d14, the greater the number of image element maps Ma. Therefore, it is important for the user to devise a display that is easy to understand visually.
- the user enters a composition formula “Li 2-3a-4b (M3 1-x M3′ x ) a (M4 1-y M4′ y ) 1+b O 3 ” and process conditions “firing method Pa, firing time Pb , sintering temperature Pc” will be described with reference to FIGS. 54 and 55.
- FIG. 1 Li 2-3a-4b (M3 1-x M3′ x ) a (M4 1-y M4′ y ) 1+b O 3 ” and process conditions “firing method Pa, firing time Pb , sintering temperature Pc” will be described with reference to FIGS. 54 and 55.
- the image processing unit 634 acquires the first information d10 from the evaluation display database 640 via the display method acquisition unit 633, and displays the map in accordance with the form of the map indicated by the map arrangement information d13 included in the first information d10. Generate. Specifically, first, the image processing unit 634 selects four variables a, b, x, and y from continuous variables x and y, discrete variables a and b, and process variables Pa, Pb, and Pc. This is because it is necessary to assign four variables to the four coordinate axes of the two coordinate axes of the image map Mb and the two coordinate axes of the image element map Ma included in the image map Mb.
- the image processing unit 634 assigns continuous variables x and y to the two coordinate axes of the image element map Ma.
- each of the continuous variables x and y can take one of 11 option data indicated by a step width of 0.1 from the minimum value of 0.0 to the maximum value of 1.0. .
- the image element map Ma is square.
- the shape of the image element map Ma depends on the method of assigning the coordinate axes of the image element map Ma, and may be a triangle or other figures.
- the image processing unit 634 assigns the discrete variables a and b to the two coordinate axes of the array of the image element map Ma.
- Discrete variable a has five types of option data: 0.0, 0.05, 0.1, 0.15, and 0.2.
- the image processor 634 may generate a map consisting of 18 image maps Mb, as shown in FIG. 55, and two of the 18 image maps Mb, as shown in FIG.
- a map containing Mb may be generated. Further, the image processing unit 634 may generate one image map Mb as a map, or may generate one image element map Ma as a map. That is, the map in this embodiment may be a set of one or more image maps Mb or a set of one or more image element maps Ma.
- the evaluation value acquisition unit 632 acquires the first information d10 from the evaluation display database 640 via the display method acquisition unit 633, and determines the characteristics based on the search range indicated by the search range information d14 included in the first information d10. Calculate the evaluation value.
- the evaluation value acquisition unit 632 acquires characteristic evaluation values for all combinations of option data for variables x, y, a, b, Pa, Pb, and Pc. Also, the evaluation value acquisition unit 632 uses the calculation method information d12 and the first display target information d15 included in the first information d10 when acquiring the characteristic evaluation value.
- the evaluation value acquiring unit 632 selects one or more from the evaluator database 620 according to the characteristic evaluation value calculation method indicated in the calculation method information d12 and the characteristics of the display target indicated in the first display target information d15. Obtain estimators and use those estimators to obtain property evaluation values.
- the property to be displayed is the bandgap, but is not limited to this.
- the multiple variables included in the search range include visualized variables that are variables used for the coordinate axes of the map and invisible variables that are not used for the coordinate axes of the map.
- the visible variables are the variables x, y, a, b
- the invisible variables are the variables Pa, Pb, Pc.
- 18 image maps Mb shown in FIG. 55 are generated for one combination of option data for each of the invisible variables Pa, Pb, and Pc.
- the non-visualized variables are also called non-utilized variables because they are variables that are not used for the coordinate axes of the map.
- the image processing unit 634 determines one combination of option data for each of the invisible variables Pa, Pb, and Pc, and generates a map showing characteristic evaluation values corresponding to the determined combination of option data.
- the variable Pa which is a non-visualized variable, has two choices of data, "solid phase reaction method” and "ball mill”
- the variable Pb has three choices of 1, 3, and 5.
- the image processing unit 634 may acquire an input signal from the input unit 110 via the display method acquisition unit 633 and determine a combination according to the input signal.
- the evaluation value obtaining unit 632 obtains characteristic evaluation values for all combinations of the plurality of variables, and the image processing unit 634 obtains characteristic evaluation values indicated on the map from these characteristic evaluation values. decide.
- the evaluation value obtaining unit 632 may obtain only the characteristic evaluation values indicated on the map, and the image processing unit 634 may indicate all the characteristic evaluation values obtained by the evaluation value obtaining unit 632 on the map.
- the image processing unit 634 uses the first color information d11 and the display range information d16 included in the first information d10 to generate the map. For example, the image processing unit 634 converts a color, such as a hue indicated by the first color information d11, into a color having a gradation corresponding to the characteristic evaluation value set according to the display range information d16. Label locations on the map that correspond to the composition of the compound that has the characterization value. In addition, the image processing unit 634 displays the data expression of the compound on the upper part of the map, or shows the relationship between the characteristic evaluation value and the color or the degree of color gradation, as a further devised display method that is easy to understand visually. You can also display scales or display the values of range variables.
- the experimental point acquisition unit 635 acquires one or more experimental points from the experimental database 650.
- the experimental point acquisition unit 635 sets the property 1 in the compound basic data 651 of the experimental data.
- the configuration of the associated compound is extracted from its compound basic data 651 .
- the characteristic 1 is, for example, the bandgap.
- the image processing unit 634 determines the position on the map corresponding to the configuration of the compound that is the experimental point, and A black circular mark is superimposed as an experimental point. Note that the superimposition of the marks is also called the superimposition of experimental points.
- the experimental point is the experimental point for the property 1, and the configuration of the compound for which the property 1 is registered in the compound basic data 651 is extracted as the experimental point, but it is limited to this. not something.
- the property display device 630 in the present embodiment generates a map such as the image map Mb shown in FIG. 54 or 55 according to the first information d10. Then, characteristic display device 630 displays an image including the map on display unit 140 as the first image.
- the display method acquisition unit 633 changes the first information d10 according to the input operation to the input unit 110 by the user. Thereby, the characteristic display device 630 changes the map according to the changed first information d10.
- property display device 630 changes the first image to a second image including the changed map, and displays the second image on display unit 140 .
- FIG. 57A and 57B are diagrams showing an example of image transition accompanying a change in calculation method information d12. Specifically, FIG. 57A shows an example of the calculation method information d12 included in the first information d10 and the first image displayed on the display unit 140 according to the calculation method information d12. FIG. 57B shows an example of the post-change calculation method information d12 and the second image displayed on the display unit 140 according to the post-change calculation method information d12.
- the display method acquisition unit 633 acquires the calculation method information d12 shown in (b) of FIG. 57A from the evaluation display database 640.
- the calculation method information d12 indicates a machine learning model, Bayesian optimization (acquisition function), and display as setting items. These setting items are also treated as options.
- the machine learning model setting items indicate, as options, multiple types of machine learning models and multiple setting parameters for the machine learning models of these types.
- the multiple types of machine learning models are LASSO (least absolute shrinkage and selection operator) regression, Support Vector regression, Gradient Boosting regression, and Gaussian Process regression.
- LASSO least absolute shrinkage and selection operator
- Support Vector regression Gradient Boosting regression
- Gaussian Process regression Gaussian Process regression.
- the set parameters for the LASSO regression are 0.01, 0.1, 0, 1, and 10, respectively, numerical values of alpha. Each of these numbers is a choice of configuration parameters.
- grid search is included as an option in the machine learning model settings.
- Grid search optimizes machine learning models and configuration parameters.
- the display setting items for example, show prediction average, prediction variance, and "prediction average + prediction variance” as options. These options are types of characteristic evaluation values. Note that when "predicted mean + predicted variance" is selected, the value of the variance coefficient is stored and managed in floating-point format.
- the machine learning model setting item is selected, and the Gradient Boosting regression is selected. Further, "100” is selected for the first setting parameter "n_estimators” in that Gradient Boosting regression, "3" is selected for the second setting parameter "max_depth”, and “3” is selected for the third setting parameter "max_features" "0.5” is selected. Also, Bayesian optimization is not selected, and predictive average is selected in the display settings.
- the evaluation value acquisition unit 632 acquires such calculation method information d12 from the display method acquisition unit 633. Then, the evaluation value acquisition unit 632 acquires one or more evaluators from the evaluator database 620 according to the calculation method information d12, and uses the one or more evaluators to evaluate the characteristics of each of the plurality of compounds. get the value.
- the property evaluation values acquired here correspond to the property prediction values of the first and second embodiments, for example.
- the image processing unit 634 generates an image map Mb indicating the characteristic evaluation value of each compound obtained in this way, as shown in (a) of FIG. 57A.
- the image processing unit 634 acquires one or more experimental points from the experimental point acquiring unit 635 and superimposes the one or more experimental points on the image map Mb.
- the image processing unit 634 generates a first image including the image map Mb on which one or more experimental points are superimposed, and displays the first image on the display unit 140 .
- the characteristic evaluation value (that is, the prediction average) is larger than other image element maps Ma.
- the user changes the calculation method information d12 of the first information d10 by performing an input operation on the input unit 110. That is, when the display method acquisition unit 633 acquires an input signal indicating a change in the calculation method information d12 from the input unit 110, the display method acquisition unit 633 acquires the calculation method information d12 according to the input signal as shown in (b) of FIG. 57B. change.
- the machine learning model setting item is selected, and Gaussian Process regression is selected.
- 'rbf' is selected for the configuration parameter 'kernel' in the Gaussian Process regression.
- a setting item of Bayesian optimization is selected, and UCB is selected. Note that the dispersion coefficient in UCB is 2.0.
- "predicted mean + predicted variance” is selected as a display setting item.
- the evaluation value acquisition unit 632 acquires the changed calculation method information d12 from the display method acquisition unit 633. Then, the evaluation value acquisition unit 632 acquires one or more evaluators from the evaluator database 620 according to the calculation method information d12, and uses the one or more evaluators to evaluate the characteristics of each of the plurality of compounds. get the value.
- the image processing unit 634 generates an image map Mb indicating the characteristic evaluation values of each compound obtained in this way, as shown in (a) of FIG. 57B. Then, the image processing section 634 generates a second image including the image map Mb on which one or more experimental points are superimposed, and displays the second image on the display section 140 . As a result, the first image is changed to the second image.
- the characteristic evaluation value (that is, the prediction mean+predicted variance) is larger than other image element maps Ma.
- the prediction variance is an index representing the uncertainty of the predicted value of the property, and the variance of the predicted value is large in an area in the image map Mb where the property experimental value is not obtained.
- the characteristic evaluation value (prediction average+prediction variance) of the image element map Ma2 is large.
- the image displayed on the display unit 140 dynamically changes from the first image to the second image.
- material development by a user can be appropriately supported.
- the display unit 140 displays "predicted average + predicted variance" in which the variance is taken into account as the characteristic evaluation value, and at the final stage of material development, the display unit 140 uses only the predicted average as the characteristic evaluation value. 140 can be displayed.
- the property display device 630 in the present embodiment includes a display method acquisition unit 633, an evaluation value acquisition unit 632, and an image processing unit 634.
- the display method acquisition unit 633 acquires the first information d10 for displaying the characteristic evaluation value as a comparison index for comparing a plurality of compounds.
- the evaluation value acquiring unit 632 and the image processing unit 634 acquire characteristic evaluation values of each of the plurality of compounds based on the first information d10, and display the compound at a position corresponding to each configuration of the plurality of compounds. generates an image map Mb indicating the characteristic evaluation values of .
- image processing section 634 generates a first image including the image map Mb and outputs it to display section 140 .
- the image processing unit 634 changes the image map Mb according to the changed first information d10, generates and displays a second image including the changed image map Mb. Output to unit 140 .
- the first image and the second image described above are output to the display unit 140 and displayed.
- the image map Mb corresponding to the content of the change is included in the second image and displayed, so that the characteristic evaluation values of the plurality of compounds are displayed from various viewpoints. can do. As a result, it is possible to improve the efficiency of material search, and appropriately support material development.
- the first information d10 includes a plurality of variables used to express the composition of the compound, and for each of the plurality of variables, the values or elements that the variables can take. and search range information d14 indicating a plurality of option data indicating For each combination of option data obtained by selecting one option data from a plurality of option data for each of the plurality of variables, the evaluation value acquisition unit 632 calculates the characteristics of the compound having the configuration corresponding to the combination. Get the rating value.
- the configuration of the compound is represented by a combination of option data for each of the multiple variables, so the configuration can be clearly defined, and the characteristic evaluation values of each of the multiple compounds can be obtained appropriately. can be done. As a result, it is possible to improve the efficiency of material search, and appropriately support material development.
- the first information d10 includes calculation method information d12 indicating the calculation method of the characteristic evaluation value.
- the evaluation value acquisition unit 632 calculates, for each combination of option data described above, the characteristic evaluation value of the compound having the configuration corresponding to the combination using a predetermined algorithm according to the calculation method indicated by the calculation method information d12. do.
- the display method acquisition unit 633 changes the calculation method indicated by the calculation method information d12.
- the image map Mb corresponding to the content of the change is included in the second image and displayed. It can be displayed from any point of view. As a result, the efficiency of searching for materials can be improved.
- the evaluation value acquisition unit 632 uses a predetermined algorithm according to the calculation method to obtain a configuration corresponding to each combination of option data described above.
- a predicted distribution of the property values predicted for the compound having the properties is calculated, and a property evaluation value for the compound is calculated based on the predicted distribution.
- the prediction distribution is obtained by Gaussian Process regression and the characteristic value is obtained by a Bayesian optimization acquisition function.
- the characteristic evaluation value based on the prediction distribution is calculated, so it is possible to obtain the characteristic evaluation value that includes the prediction average and the prediction variance.
- the user can easily confirm the characteristic evaluation value in which the predicted dispersion is also reflected for each of the plurality of compounds, and can improve the efficiency of the material search.
- the first information d10 includes first color information d11 indicating at least one of hue, saturation, and lightness as the color attribute of the characteristic evaluation value.
- the image processing unit 634 generates an image map Mb that indicates the characteristic evaluation values of each of the plurality of compounds in colors having the color attribute indicated by the first color information d11.
- the image maps Mb of FIGS. 57A and 57B are generated according to the first color information d11.
- the display method acquisition unit 633 changes the color attribute indicated by the first color information d11. For example, the display method acquisition unit 633 changes the color attribute according to the user's input operation to the input unit 110 .
- the color of the characteristic evaluation value shown in the image map Mb is changed to a color having the changed color attribute. Therefore, it is possible to arbitrarily change the color attributes of the characteristic evaluation values shown in the image map Mb, and display the image map Mb that is easy for the user to see in the second image. As a result, the efficiency of searching for materials can be improved.
- FIG. 58A and 58B are diagrams showing an example of image transition accompanying a change in search range information d14.
- FIG. 58A shows part of the search range information d14 included in the first information d10 and an example of the first image displayed on the display unit 140 according to the search range information d14.
- FIG. 58B shows an example of part of the changed search range information d14 and the second image displayed on the display unit 140 according to the changed search range information d14.
- the display method acquisition unit 633 acquires from the evaluation display database 640 the search range information d14 including the setting information of the non-visualization variables shown in (b) of FIG. 58A.
- the invisible variable setting information is information indicating the search range of the invisible variable.
- the non-visualized variables are the process variables shown in FIG. 12, and specifically, the variable Pa indicating the baking method, the variable Pb indicating the baking time, the variable Pc indicating the baking temperature, and the like.
- the setting information of the invisible variables includes option data selected for each of the firing time (ie variable Pb) and firing temperature (ie variable Pc) among those variables. show.
- the multiple option data for the firing temperature variable Pc include 300° C., 400° C., 500° C., and 600° C.
- the multiple option data for the firing time variable Pb are 1 hour, 3 hours and 5 hours.
- the invisible variable setting information indicates the minimum (that is, 300° C.) as option data selected for the firing temperature variable Pc, and is selected for the firing time variable Pb. The minimum (that is, 1 hour) is shown as option data.
- the maximum for the firing temperature variable Pc is the maximum temperature of the four option data (300 ° C., 400 ° C., 500 ° C., and 600 ° C.), that is, 600 ° C., and the average is the average temperature of those four alternative data, ie 450°C.
- the best for the firing temperature variable Pc is the temperature at which, for example, the largest characteristic evaluation value is obtained among the four option data, and the user definition is the temperature specified by the user from those option data.
- the maximum for the firing time variable Pb is the maximum time of the three option data (1 hour, 3 hours, and 5 hours), i.e., 5 hours, and the average is Average time, ie 3 hours.
- the best for the firing time variable Pb is the time at which, for example, the largest characteristic evaluation value is obtained among the three option data, and the user definition is the time specified by the user from those option data.
- the image processing unit 634 generates an image map Mb indicating the characteristic evaluation values of each compound obtained in this way, as shown in (a) of FIG. 58A.
- the image processing unit 634 generates a first image including the image map Mb on which one or more experimental points are superimposed, and displays the first image on the display unit 140 .
- the user changes the setting information of the invisible variable included in the search range information d14 of the first information d10 by performing an input operation on the input unit 110.
- FIG. That is, when the display method acquisition unit 633 acquires an input signal indicating a change in the setting information of the invisible variable from the input unit 110, the setting information of the invisible variable is changed to (b) of FIG. 58B according to the input signal. change as shown.
- the image processing unit 634 generates an image map Mb indicating the characteristic evaluation value of each compound obtained in this way, as shown in (a) of FIG. 58B.
- the image displayed on the display unit 140 dynamically changes from the first image to the second image by changing the setting information of the non-visualization variable included in the search range information d14.
- the user can easily check the influence of the non-visualized variable, which is the variable not used for specifying the position on the image map Mb, and can appropriately support the material development by the user.
- the evaluation value acquisition unit 632 selects all combinations of option data for the variables Pb and Pc. Obtain a characteristic evaluation value for The evaluation value acquiring unit 632 then identifies the firing temperature and firing time corresponding to the maximum characteristic evaluation value. In this case, the user can easily confirm whether there is a possibility of improving the characteristic evaluation value by changing the invisible variable.
- the evaluation value acquiring unit 632 obtains the average of the plurality of option data of the baking temperature and the baking time. Acquire the characteristic evaluation value corresponding to the average of multiple option data. In this case, it becomes easier to discuss the composition of a compound whose characteristic evaluation value is robust against changes in invisible variables, that is, the composition of a compound that can be expected to improve the stability of material properties during mass production.
- the display method acquisition unit 633 selects a plurality of options that can be taken by at least one of the plurality of variables indicated by the search range information d14. Data is changed.
- the image map Mb corresponding to the content of the change is included in the second image and displayed. can be displayed. As a result, the efficiency of searching for materials can be improved.
- the numerical range data indicating the maximum and minimum values of the non-visualized variables may be stored in advance in the database of the display system 600.
- the numerical range data may be included in the search range information d14 stored in the evaluation display database 640 in advance.
- the characteristic display device 630 displays the numerical range data in the external device. may be obtained from
- the characteristic display device 630 is connected to an external device and communicates with the external device to obtain numerical range data from the external device.
- the minimum for the invisible variable which is, for example, the firing temperature or firing time shown in FIGS. can be automatically assigned or set to invisible variables.
- the property display device 630 automatically assigns the minimum value indicated in the numeric range data to the hidden variable. or can be set. Thereby, the maximum value or the minimum value can be presented to the user automatically depending on an external device or the like.
- FIG. 59A and 59B are diagrams showing an example of image transition accompanying a change in the first display target information d15.
- FIG. 59A shows an example of the first display target information d15 included in the first information d10 and the first image displayed on the display unit 140 according to the first display target information d15.
- FIG. 59B is a diagram showing an example of the changed first display target information d15 and the second image displayed on the display unit 140 according to the changed first display target information d15.
- the display method acquisition unit 633 acquires the first display target information d15 shown in (b) of FIG. 59A from the evaluation display database 640.
- the first display target information d15 indicates property 1, property 2, crystal phase, and superimposition as options, respectively.
- the characteristic 1 is, for example, the bandgap, and the characteristic 2 is, for example, the heat resistance temperature.
- characteristic 1 is selected in the first display target information d15.
- the evaluation value acquisition unit 632 acquires such first display target information d15 from the display method acquisition unit 633. Then, the evaluation value acquisition unit 632 acquires a characteristic evaluation value corresponding to the first display target information d15. In other words, the evaluation value acquiring unit 632 acquires the property evaluation value for the property 1 of each of the plurality of compounds.
- the image processing unit 634 generates an image map Mb indicating the characteristic evaluation values for the characteristic 1 thus obtained, and superimposes one or more experimental points on the image map Mb.
- the image processing unit 634 displays on the display unit 140 a first image including an image map Mb on which one or more experimental points are superimposed, as shown in (a) of FIG. 59A.
- the user changes the first display target information d15 of the first information d10 by performing an input operation on the input unit 110 . That is, when the display method acquisition unit 633 acquires an input signal indicating a change in the first display target information d15 from the input unit 110, the display method acquisition unit 633 changes the first display target information d15 according to the input signal to (b) of FIG. 59B. change as shown.
- characteristic 1 in the first display target information d15, not only characteristic 1 but also superimposition is selected, and characteristic 2 is selected as a characteristic related to superimposition. Further, it is selected that there is a threshold value for the characteristic 2, and 200 or more is set for the threshold value.
- the evaluation value acquisition unit 632 acquires the thus changed first display target information d15 from the display method acquisition unit 633. Then, the evaluation value acquisition unit 632 acquires a characteristic evaluation value corresponding to the first display target information d15. That is, since the property evaluation values for the property 1 of each of the compounds have already been obtained as described above, the evaluation value obtaining unit 632 obtains the property evaluation values for the property 2 of each of the plurality of compounds.
- the image processing unit 634 generates an image map Mb indicating the characteristic evaluation values for the characteristic 1 and the characteristic evaluation values for the characteristic 2 obtained for each of the plurality of compounds, as shown in (a) of FIG. 59B. do.
- the image processing unit 634 selects the image map Mb shown in FIG. , the characteristic evaluation values of characteristic 2 are superimposed. More specifically, in the first display target information d15, it is selected that there is a threshold for property 2, and 200 or more is set for the threshold. Therefore, the image processing unit 634 hatches areas where the characteristic evaluation value of the characteristic 2 is less than 200 in the image map Mb described above. For example, the area is covered by striped hatching.
- the image processing unit 634 generates a second image including the image map Mb on which one or more experimental points are superimposed, and displays it on the display unit 140 .
- the first image is changed to the second image.
- the characteristic display device 630 may calculate a new characteristic evaluation value by weighted addition of the characteristic evaluation values without superimposing the plurality of characteristic evaluation values.
- a new characteristic evaluation value is calculated by (evaluation value)+p ⁇ (characteristic evaluation value of characteristic 2).
- Such a new characteristic evaluation value is defined by the user's input operation to the input unit 110 . In this case, since there is only one type of characteristic evaluation value to be displayed, visual understanding is facilitated.
- the image displayed on the display unit 140 dynamically changes from the first image to the second image. This makes it easier for the user to develop materials that satisfy a plurality of required properties, and can appropriately support the user's material development.
- the first information d10 includes the first display target information d15 indicating one or more property types.
- the evaluation value acquiring unit 632 acquires a property evaluation value for each of one or more property types indicated by the first display target information d15 for each of the plurality of compounds.
- the display method acquisition unit 633 changes the type of one or more characteristics indicated by the first display target information d15.
- the image map Mb corresponding to the content of the change is included in the second image and displayed. Evaluation values can be displayed from the viewpoint of various characteristics. As a result, the efficiency of searching for materials can be improved. For example, as described above, users can easily develop materials that satisfy multiple required properties. As a result, material development by users can be appropriately supported.
- FIG. 60A and 60B are diagrams showing an example of image transition accompanying a change in the display range information d16.
- FIG. 60A shows an example of the display range information d16 included in the first information d10 and the first image displayed on the display unit 140 according to the display range information d16.
- FIG. 60B shows an example of the changed display range information d16 and the second image displayed on the display unit 140 according to the changed display range information d16.
- the display method acquisition unit 633 acquires the display range information d16 shown in (b) of FIG. 60A from the evaluation display database 640.
- the display range information d16 indicates the display range, which is the range of characteristic evaluation values that can be represented by color gradation, by the upper and lower limits of the display range. Therefore, the characteristic evaluation value within the display range is assigned a color with a gradation corresponding to the value.
- the characteristic evaluation value above the display range is assigned the color with the maximum gradation within the scale range
- the characteristic evaluation value below the display range is assigned with the color with the minimum gradation within the scale range. .
- the characteristic evaluation value corresponding to that gradation is not uniquely specified, and only whether the characteristic evaluation value is above the display range or below the display range is specified.
- the scale range is a predetermined range of color densities.
- Such display range information d16 indicates data maximum value and user definition as options for the upper limit, and indicates data minimum value and user definition as options for the lower limit.
- the data maximum value is, for example, the maximum characteristic evaluation value in the image map Mb
- the data minimum value is, for example, the minimum characteristic evaluation value in the image map Mb.
- a user definition is a characteristic evaluation value defined by a user, and is specified by an input operation to the input unit 110, for example.
- the maximum data value is selected for the upper limit
- the minimum data value is selected for the lower limit.
- the image processing unit 634 acquires such display range information d16 from the display method acquisition unit 633. Next, the image processing unit 634 assigns color densities to the characteristic evaluation values of the plurality of compounds obtained from the evaluation value obtaining unit 632 according to the upper and lower limits indicated by the display range information d16. . For example, the data maximum value selected for the upper bound is "4.0" and the data minimum value selected for the lower bound is "0.5". In this case, the image processing unit 634 assigns the maximum gradation within the scale range to the maximum data value of "4.0" and the minimum gradation within the scale range to the minimum data value of "0.5".
- the image processing unit 634 evenly assigns larger gradations within the scale range to characteristic evaluation values greater than 0.5 and less than 4.0 as the characteristic evaluation value increases. Then, as shown in (a) of FIG. 60A , the image processing unit 634 generates an image map Mb showing these characteristic evaluation values in the colors of the gradation assigned to the characteristic evaluation values. One or more experimental points are superimposed on the image map Mb. The image processing unit 634 displays on the display unit 140 the first image including the image map Mb on which the one or more experimental points are superimposed, as shown in (a) of FIG. 60A.
- the user can grasp the tendency of the overall characteristic evaluation values in the image map Mb from the image map Mb.
- the user can only grasp that the characteristic evaluation value is large, and the characteristic evaluation value of each compound in that region R1 or the distribution of the characteristic evaluation value hard to grasp.
- the user changes the display range information d16 of the first information d10 by performing an input operation on the input unit 110.
- FIG. When the display method acquiring unit 633 acquires from the input unit 110 the input signal indicating the change of the display range information d16, the display range information d16 is changed as shown in (b) of FIG. 60B according to the input signal. .
- the image processing unit 634 acquires the changed display range information d16 from the display method acquisition unit 633. Next, the image processing unit 634 evaluates the characteristics of each of the plurality of compounds acquired from the evaluation value acquiring unit 632 according to the upper limit “4.00” and the lower limit “3.65” indicated in the display range information d16. Assign a color tint to a value. Then, as shown in FIG. 60B (a), the image processing unit 634 generates an image map Mb showing these characteristic evaluation values in colors of the gradation assigned to the characteristic evaluation values. The image processing unit 634 generates a second image including the image map Mb superimposed with one or more experimental points, and displays the second image on the display unit 140 . As a result, the first image is changed to the second image.
- the user can easily grasp the characteristic evaluation value of each compound in the region R1 of the image map Mb or the distribution of the characteristic evaluation values. That is, the user can easily confirm the difference in the characteristic evaluation values within the region R1.
- the user can understand that many characteristic evaluation values below the lower limit "3.65" of the display range are displayed in areas other than the area R1 of the image map Mb.
- the image displayed on the display unit 140 dynamically changes from the first image to the second image by changing the display range information d16.
- the display range within the range is set, so that the user can easily distinguish between the characteristic evaluation values in the display range. I can understand.
- material development by users can be appropriately supported.
- the gradation corresponding to the characteristic evaluation value is assigned to the characteristic evaluation value from the predetermined color range. A corresponding color may be assigned to that property value.
- the first information d10 includes display range information d16 indicating the display range of characteristic evaluation values.
- the image processing unit 634 associates the display range of the characteristic evaluation values indicated by the display range information d16 with a predetermined color or color gradation scale range, and converts the characteristic evaluation values of each of the plurality of compounds into An image map Mb is generated that is indicated by the color or color gradation corresponding to the characteristic evaluation value within the scale range.
- the display method acquisition unit 633 changes the display range indicated by the display range information d16.
- the image map Mb corresponding to the content of the change is included in the second image and displayed. It can be displayed from various display range viewpoints. As a result, the efficiency of searching for materials can be improved. For example, as described above, even if the range of characteristic evaluation values shown in the image map Mb changes in accordance with the progress of the material search, the change in the display range changes the plurality of values included in the display range. can be indicated by colors or color densities that are distinctly different from each other.
- FIG. 61A and 61B are diagrams showing an example of image transition accompanying a change in search range information d14.
- FIG. 61A shows an example of the search range information d14 included in the first information d10 and the first image displayed on the display unit 140 according to the search range information d14.
- FIG. 61B shows an example of the changed search range information d14 and the second image displayed on the display unit 140 according to the changed search range information d14.
- the display method acquisition unit 633 acquires the search range information d14 shown in (b) of FIG. 61A from the evaluation display database 640.
- the search range information d14 is information indicating a plurality of option data for each range variable as a search range, like the search ranges shown in FIGS. 2 and 12, for example.
- the evaluation value acquisition unit 632 acquires such search range information d14 from the display method acquisition unit 633. Then, the evaluation value acquiring section 632 acquires a characteristic evaluation value corresponding to the search range information d14. In other words, the evaluation value acquiring unit 632 acquires the characteristic evaluation values of each of the multiple compounds having the configuration included in the search range.
- the image processing unit 634 generates an image map Mb indicating these acquired characteristic evaluation values, as shown in (a) of FIG. 61A. Furthermore, the image processing unit 634 superimposes one or more experimental points on the image map Mb, and displays on the display unit 140 a first image including the image map Mb on which the one or more experimental points are superimposed.
- variable b 0.0 in the image map Mb.
- variables (a, b) (0.0, 0.0), (0.05, 0.0), (0.1, 0.0), (0.15, 0.0 ), (0.2, 0.0).
- the user understands that in the region R2, when the variable a is 0.05 or more, the characteristic evaluation value decreases as the value of the variable a increases. It is judged that there is a possibility that the characteristic evaluation value becomes maximum when a numerical value in between is shown.
- the user changes the search range information d14 of the first information d10 by performing an input operation on the input unit 110.
- FIG. When the display method acquisition unit 633 acquires from the input unit 110 an input signal indicating a change in the search range information d14, the display method acquisition unit 633 changes the search range information d14 according to the input signal as shown in (b) of FIG. 61B. . In the example of (b) in FIG. 61B, 0.025 is added as option data for variable a.
- the evaluation value acquisition unit 632 acquires the changed search range information d14 from the display method acquisition unit 633. Then, the evaluation value acquiring section 632 acquires a characteristic evaluation value corresponding to the search range information d14. That is, the evaluation value acquisition unit 632 further acquires the characteristic evaluation values of each of the multiple compounds corresponding to the option data “0.025” of the added variable a.
- the image processing unit 634 generates an image map Mb indicating these acquired characteristic evaluation values. In this image map Mb, as shown in (a) of FIG. 61B, a region R3 including four image element maps Ma is added to the image map Mb shown in (a) of FIG. 61A.
- the number of image element maps Ma in the image map Mb increases with the addition of option data. number may be reduced.
- the image displayed on the display unit 140 dynamically changes from the first image to the second image by changing the search range information d14.
- the user can review the search range according to the material search situation, and can appropriately support the material development by the user.
- the image map Mb includes a plurality of image element maps Ma arranged in a matrix along each of the first coordinate axis and the second coordinate axis.
- Each map Ma has a third coordinate axis and a fourth coordinate axis.
- Image processing unit 634 converts the first coordinate axis, second coordinate axis, third coordinate axis, and fourth coordinate axis to the first, second, third, and fourth variables among the plurality of variables described above. correspond to each other.
- the image processing unit 634 (a) converts each value of the first variable and the second variable used for representing the configuration of the compound from among the plurality of image element maps Ma to identifying an associated image element map Ma, and (b) on the identified image element map Ma, indicated by the value of each of the third and fourth variables used to express the composition of the compound; The position is mapped to the characterization value of that compound.
- the first, second, third and fourth variables are the variables a, b, x and y described above.
- a map such as the image map Mb can indicate the characteristic evaluation values for the configurations of a plurality of compounds each represented by four variables, and can display the characteristic evaluation values of the compounds in a wide range in an easy-to-understand manner. can. As a result, the efficiency of searching for materials can be improved.
- the image processing unit 634 converts the image map Mb increase or decrease the number of image element maps Ma contained in . Specifically, the image processing unit 634 increases or decreases the number of image element maps Ma included in the image map Mb according to the changed search range information d14.
- the number of image element maps Ma corresponding to the content of the change is included in the second image and displayed.
- the efficiency of searching for materials can be improved.
- FIG. 62 is a diagram showing an example of image transition accompanying a change in the map arrangement information d13. Specifically, FIG. 62(a) shows an example of the first image displayed on the display unit 140 according to the map arrangement information d13 included in the first information d10. FIG. 62(b) shows an example of the second image displayed on the display unit 140 according to the changed map arrangement information d13.
- the display method acquisition unit 633 acquires the map arrangement information d13 from the evaluation display database 640.
- the map arrangement information d13 indicates that 20 image element maps Ma are arranged in 4 rows and 5 columns.
- the image processing unit 634 acquires such map arrangement information d13 from the display method acquiring unit 633.
- FIG. Next, the image processing unit 634 generates an image map Mb consisting of 20 image element maps Ma arranged in 4 rows and 5 columns according to the map arrangement information d13, and assigns one or more experimental points to the image. It is superimposed on the map Mb.
- the image processing unit 634 displays on the display unit 140 the first image including the image map Mb on which the one or more experimental points are superimposed, as shown in FIG. 62(a).
- the user selects one or more image element maps Ma included in the image map Mb by performing an input operation on the input unit 110 .
- the user selects one or more image element maps Ma showing large characteristic evaluation values as the one or more image element maps Ma of interest. Selection of such an image element map Ma is performed by an input operation such as clicking or dragging, for example.
- the user clicks on the image element map Ma corresponding to each of the variables (a, b) (0.0, 0.1), (0.05, 0.1), and the image map Mb
- a region R4 in is specified by dragging.
- the input unit 110 outputs an input signal corresponding to the input operation to the display method acquisition unit 633.
- the display method acquisition section 633 changes the map arrangement information d13 according to the input signal, and outputs the changed map arrangement information d13 to the image processing section 634 .
- the changed map arrangement information d13 may indicate the positions of, for example, six image element maps Ma selected by the user on the image map Mb. The position is specified by variables a and b.
- the image processing unit 634 generates an image map Mb consisting of six image element maps Ma selected by the user according to the map arrangement information d13. Then, the image processing section 634 displays on the display section 140 a second image including the image map Mb on which one or more experimental points are superimposed, as shown in FIG. 62(b).
- the image displayed on the display unit 140 dynamically changes from the first image to the second image. This facilitates comparison between a plurality of image element maps Ma, and can appropriately support material development by the user.
- the display method acquisition unit 633 may change the arrangement of the plurality of image element maps Ma indicated by the map arrangement information d13 according to the input signal. That is, the display method acquisition unit 633 may change the map arrangement information d13 so that the plurality of image element maps Ma are rearranged. In this case, comparison between multiple image element maps becomes easier. Further, when displaying the second image on the display unit 140, the image processing unit 634 may change the size of the image element maps Ma according to the number of the selected image element maps Ma. For example, if the number of selected image element maps Ma is small, the image processing unit 634 enlarges those image element maps Ma. In this case, an improvement in user visibility can be expected.
- the first information d10 includes map arrangement information d13 indicating the arrangement form of the displayed image element map Ma.
- map arrangement information d13 is changed by selecting the position of the image element map Ma to be displayed in the display method acquisition unit 633, the image processing unit 634 converts the already generated image map Mb into the changed image map. is changed to an image map Mb including at least one image element map Ma arranged according to the arrangement form indicated by the map arrangement information d13.
- FIG. 63 is a flow chart showing the processing operation of the display system 600 in this embodiment.
- the display method acquisition unit 633 acquires the first information d10 regarding the characteristic evaluation value display method from the evaluation display database 640, and transmits the first information d10 to the evaluation value acquisition unit 632, the experimental point acquisition unit 635, and the image processing unit 634. output to
- the experimental point acquisition unit 635 acquires the first information d10 from the display method acquisition unit 633.
- the experimental point acquisition unit 635 acquires from the experimental database 650 the experimental points for each of the one or more compounds that have been tested corresponding to the search range indicated by the search range information d14 of the first information d10.
- the experimental point acquisition unit 635 outputs the experimental points for each of the one or more tested compounds to the image processing unit 634 .
- Step S213 The evaluation value acquisition unit 632 acquires the first information d10 from the display method acquisition unit 633. FIG. Then, the evaluation value acquisition unit 632 acquires the characteristic evaluation values of each of the plurality of compounds according to the calculation method information d12 and the search range information d14 of the first information d10. At this time, the evaluation value acquiring unit 632 uses one or more evaluators in the evaluator database 620 to acquire characteristic evaluation values for each of the plurality of compounds. The evaluation value acquisition unit 632 outputs the configuration of each of the plurality of compounds and the characteristic evaluation values corresponding to those configurations to the image processing unit 634 .
- the evaluation value acquisition unit 632 acquires an evaluator from the evaluator database 620 and acquires a characteristic evaluation value using the evaluator.
- the evaluation value acquiring unit 632 may acquire the characteristic evaluation values of each of the plurality of compounds from at least one evaluator for evaluating the characteristic values of the compounds stored in the evaluator database 620. . Even in this case, appropriate characteristic evaluation values can be obtained for each of the plurality of compounds.
- Step S214 The image processing unit 634 generates a first image including the image map Mb.
- the image processing unit 634 generates the image map Mb using the first information d10 obtained in step S211 and the configurations and characteristic evaluation values of the plurality of compounds obtained in step S213. Further, the image processing unit 634 superimposes the experimental points of each of the one or more compounds that have been experimented acquired in step S212 on the image map Mb. Then, image processing section 634 generates a first image including image map Mb on which one or more experimental points are superimposed, and outputs the first image to display section 140 .
- Display unit 140 acquires the first image from image processing unit 634 and displays the first image.
- Step S216 A user performs an input operation on the input unit 110 .
- the input unit 110 outputs an input signal indicating a change in the display of the first image to the display method acquisition unit 633 of the characteristic display device 630 according to the user's input operation.
- the display method obtaining unit 633 receives the change of the display of the first image by obtaining the input signal.
- Step S21-7 The display method acquisition unit 633 changes the first information d10 acquired in step S211 according to the input signal acquired in step S216.
- the display method acquisition unit 633 then outputs the changed first information d10 to the evaluation value acquisition unit 632, the experimental point acquisition unit 635, and the image processing unit 634.
- Step S2128 When the modified first information d10 is obtained from the display method obtaining unit 633, the evaluation value obtaining unit 632 and the experimental point obtaining unit 635 obtain the characteristic evaluation value and the experimental point according to the content of the change in the first information d10. get it again.
- the image processing unit 634 then generates a second image according to the changed first information d10.
- This second image includes, for example, an image map Mb showing the reacquired property evaluation values and superimposed with the reacquired experimental points.
- Image processing unit 634 outputs the second image to display unit 140 .
- Display unit 140 acquires the second image from image processing unit 634 and displays the second image.
- the image processing unit 634 in this modified example calculates a priority for each setting item or each invisible variable.
- the priority indicates the degree to which the map changes by changing the option selected from multiple options of the setting item or invisible variable. Then, the image processing unit 634 preferentially displays the setting item or non-visualized variable on the display unit 140 as the priority of the setting item or non-visualized variable is higher.
- FIG. 64 is a diagram showing an example of the first image in this modified example.
- the calculation method image d121 includes only the Bayesian optimization setting items among the three setting items indicated by the calculation method information d12, that is, the machine learning model setting items, the Bayesian optimization setting items, and the display setting items. represent. That is, the image processing unit 634 preferentially displays the setting items for Bayesian optimization over the setting items for the machine learning model and the setting items for display. More specifically, the image processing unit 634 preferentially displays the multiple options of the setting item for Bayesian optimization over the multiple options of each of the setting item for the machine learning model and the setting item for display.
- the image processing unit 634 When the first image shown in FIG. 64 is displayed on the display unit 140, the image processing unit 634 first calculates the priority of each of the multiple setting items.
- the multiple setting items are a machine learning model setting item, a Bayesian optimization setting item, and a display setting item.
- the image processing unit 634 selects one setting item from a plurality of setting items as a processing target item.
- the image processing unit 634 repeatedly executes selection processing for selecting a combination of one or more options from a plurality of options of the item to be processed. Each selection process selects a different combination.
- the image processing unit 634 Each time the selection process is performed, the image processing unit 634 generates a map (for example, image map Mb) based on the combination of one or more options selected by the selection process. Next, the image processing unit 634 calculates, for each position on the image map Mb, the variance value of the characteristic evaluation values indicated at that position based on the plurality of generated image maps Mb. Then, the image processing unit 634 calculates the average of the variance values at each position on the image map Mb as the priority of the above-described processing target item. The image processing unit 634 calculates the priority of each of the plurality of setting items by reselecting each of the plurality of setting items in order as the processing target item.
- a map for example, image map Mb
- the priority is calculated by averaging the variance values, but it is not limited to this.
- the image processing unit 634 when calculating the priority of the processing target item, the image processing unit 634, based on a plurality of image maps Mb generated in the same manner as described above, for each position on the image map Mb, The average of the characteristic evaluation values obtained is calculated as the evaluation average value. Then, the image processing unit 634 calculates the sum of the absolute values of the differences between the characteristic evaluation value indicated at that position in each of the plurality of image maps Mb and the evaluation average value calculated for that position, as a difference absolute value. Calculated as a sum of values. Furthermore, the image processing unit 634 calculates the sum of the sums of the difference absolute values at each position on the image map Mb as the priority of the processing target item.
- setting items that greatly change the map by changing the selected option that is, setting items that greatly change the characteristic evaluation value, and the multiple options that the setting item has are displayed preferentially. Therefore, the user can easily find effective setting items for material development. In other words, the user can easily visually grasp that the map will change greatly by changing the selected option, and can improve the efficiency of material development.
- FIG. 65 is a diagram showing another example of the first image in this modified example.
- the image processing section 634 converts the search range image d141 indicating part of the search range information d14 into the first image as shown in FIG. include in Then, image processing section 634 displays the first image on display section 140 .
- the search range image d141 represents only the variable Pc indicating the firing temperature out of the two invisible variables indicated by the search range information d14, namely the variable Pb indicating the firing time and the variable Pc indicating the firing temperature. That is, the image processing unit 634 displays the variable Pc indicating the baking temperature with priority over the variable Pb indicating the baking time. More specifically, the image processing unit 634 preferentially displays multiple option data that can be taken by the variable Pc indicating the baking temperature over multiple option data that can be taken by the variable Pb that indicates the baking time.
- the image processing unit 634 calculates the priority of each of the plurality of visualization variables, as in the example shown in FIG. For calculating the priority, the average of the variance values or the sum of the absolute difference values may be used. The image processing unit 634 may also calculate the priority of each of the multiple non-visualized variables based on one or more experimental points superimposed on the image map Mb.
- the image processing unit 634 selects one non-visualized variable from a plurality of non-visualized variables as a variable to be processed.
- the image processing unit 634 repeatedly executes selection processing for selecting one option data from a plurality of option data that the processing target variable can take.
- the plurality of option data are at least two of minimum, maximum, best, average, user defined, etc. shown in FIGS. 58A, 58B, and 65, for example.
- different option data are selected.
- the image processing unit 634 creates a map (for example, the image map Mb) based on the option data selected by the selection process and the experiment data stored in the experiment database 650. Identify one or more experimental points to be superimposed.
- the image processing unit 634 calculates, as a first variance value, the variance value of the values of the variables to be processed associated with all the experimental points specified by the repeatedly executed selection process. For example, if the variable to be processed is the variable Pc indicating the sintering temperature, the sintering temperature associated with each specified experimental point (for example, the compositional formula of the experimental point) in the compound basic data 651 shown in FIG. is calculated as the first variance value.
- the image processing unit 634 calculates the variance of all the values of the variables to be processed indicated in the experimental data of the experimental database 650 as the second variance. For example, if the variable to be processed is the variable Pc indicating the firing temperature, the variance of all firing temperatures indicated in the compound basic data 651 shown in FIG. 52 is calculated as the second variance.
- the image processing unit 634 calculates the ratio of the first variance value to the second variance value as the priority of the variable to be processed.
- the image processing unit 634 calculates the priority of each of the plurality of invisible variables by sequentially reselecting each of the plurality of invisible variables as the processing target variable.
- non-visualized variables whose map changes greatly due to changes in the selected option data that is, non-visualized variables whose characteristic evaluation values change greatly, and multiple option data that can be taken by the non-visualized variables are displayed preferentially.
- a non-visualized variable whose value tends to vary greatly and a plurality of option data that the non-visualized variable can take are preferentially displayed. Therefore, the user can easily find invisible variables that are effective for material development. Also, the user can efficiently compare each experimental point. As a result, the efficiency of material development can be improved.
- the image map Mb and the image of the first information d10 such as the calculation method image d121 or the search range image d141 are displayed while being included in the first image.
- the image map Mb and the image of the first information d10 may not be displayed at the same time. That is, the image map Mb and the image of the first information d10 may be displayed on the display unit 140 at different timings.
- FIG. 66 is a flowchart showing a detailed example of generation of the first image by the image processing unit 634 in this modified example. Note that FIG. 66 shows the detailed processing operation of step S214 in FIG.
- the image processing section 634 divides the first information d10 into a plurality of groups. Specifically, the image processing unit 634 divides the calculation method information d12, the search range information d14, etc. included in the first information d10 into a plurality of groups. For example, the calculation method information d12 is divided into groups corresponding to each of the plurality of setting items included in the calculation method information d12. That is, one group consists of a setting item and a plurality of options that the setting item has. Also, the search range information d14 is divided into groups corresponding to each of the plurality of non-visualized variables included in the search range information d14. That is, one group consists of a non-visualized variable and a plurality of option data that the non-visualized variable can take.
- Step S214b the image processing unit 634 calculates the priority of each of the multiple groups. This priority is calculated from the average of variance values, the sum of sums of absolute difference values, variance values based on experimental points, and the like, as described above.
- the image processing unit 634 preferentially includes the high priority group in the first image and displays it on the display unit 140 .
- the image processing unit 634 displays only the group having the highest priority among the plurality of groups in the first image.
- This first image contains a map, such as the image map Mb.
- the image processing unit 634 may arrange a plurality of groups in order of priority and display them on the display unit 140 . That is, the image processing unit 634 arranges a plurality of groups such that groups with higher priority are displayed in front or on top. Further, the image processing unit 634 may display only a predetermined number of groups having high priority among the plurality of groups on the display unit 140 .
- the specified number is an integer of 2 or more, and the priority of the specified number of groups is higher than the priority of other groups. Even in such a case, it is possible to suppress the display of groups with a relatively low degree of contribution to support for material development. As a result, the same effect as the examples shown in FIGS. 64 and 65 can be obtained.
- the image processing unit 634 determines whether or not the number of groups included in the information is equal to or greater than the threshold, and if the number of groups is equal to or greater than the threshold, divides the information into a plurality of groups according to the flowchart of FIG. You may Accordingly, when the number of groups is small, all information is displayed on the display unit 140, and the user can change the first information d10 without hesitation. Furthermore, even when the number of groups is large, groups with high priority are preferentially displayed on the display unit 140, so the user can change the first information d10 without hesitation.
- the characteristic evaluation value is calculated based on the default first information d10 acquired in step S211. Acquired in step S213. However, after calculating the priority of each group, the characteristic evaluation value based on the priority may be acquired. For example, in step S213, when the calculation method information d12 of the first information d10 obtained in step S11 is used, the evaluation value obtaining unit 632 prioritizes each of the plurality of setting items included in the calculation method information d12. Calculate degrees. Next, the evaluation value acquisition unit 632 changes the calculation method information d12 so that the option of the setting item with the highest priority is selected.
- the evaluation value acquisition unit 632 acquires the characteristic evaluation values of each of the plurality of compounds according to the changed calculation method information d12. Even in such a case, the image processing unit 634 may display the first image shown in FIG. 64 on the display unit 140 in step S215.
- the display method acquisition unit 633 includes a plurality of changeable information groups for displaying property evaluation values as comparison indices for comparing a plurality of compounds.
- Acquire the first information d10 consisting of The evaluation value acquisition unit 632 and the image processing unit 634 acquire an image map Mb indicating the characteristic evaluation values of the compounds at positions corresponding to the configurations of the plurality of compounds.
- the image processing unit 634 then outputs the first image including the image map Mb generated based on the priority of each of the plurality of information groups. For example, the first image is output to the display unit 140 and displayed.
- the information group corresponds to the group shown in FIG.
- the information group having the highest priority is included in the first image and displayed, and the display of other information groups can be suppressed.
- the user can easily select and change the displayed information group. That is, if a higher priority is given to an information group that is more useful for displaying characteristic evaluation values, the user can easily grasp changes in the map due to changes in the information group. It is possible to improve the efficiency of material development.
- the image processing unit 634 uses the degree of change of the image map Mb due to the change of the information group for each of the plurality of information groups as the priority of the information group. to generate the first image. Thereby, the user can easily confirm that the image map Mb is greatly changed by changing the information group, and the efficiency of material development can be improved.
- Embodiment 3B The display system according to the present embodiment displays characteristic evaluation values of each of a plurality of compounds in the form of a map, as in Embodiment 3A. Furthermore, the display system in the present embodiment superimposes characteristic experimental values onto the map, as in the first and second embodiments, instead of the respective experimental points of one or more compounds that have already been tested. In addition, the display system according to the present embodiment superimposes characteristic experimental values on the map according to the second information described later.
- the constituent elements in this embodiment are denoted by the same reference numerals as in Embodiments 1, 2 and 3A, and detailed descriptions thereof are omitted. do.
- the image map Mb is given as an example of the map, but the map in the present embodiment is not limited to the image map Mb, and may be the image element map Ma. It may be a set of a plurality of image maps Mb.
- FIG. 67 is a block diagram showing an example of the configuration of display system 700 in this embodiment.
- the characteristic display device 730 is an example of an information display device.
- the property display device 730 in the present embodiment uses the evaluator database 620 and the evaluation display database 640 to acquire the property evaluation values of each of the compounds, like the property display device 630 in the embodiment 3A. Then, the characteristic display device 730 generates a map showing the acquired characteristic evaluation values. Furthermore, using the experiment database 650 and the experiment display database 740, the property display device 730 superimposes the experimental property values of one or more compounds that have been tested on the map.
- Such a characteristic display device 730 includes an evaluation value acquisition section 632 , a display method acquisition section 733 , an experimental value acquisition section 732 and an image processing section 734 .
- the characteristic display device 730 may be composed of a processor such as a CPU and a memory, for example. In this case, the processor functions as the characterization device 730, for example by executing a computer program stored in memory.
- the memory may be volatile or nonvolatile, and may be composed of a volatile memory and a nonvolatile memory.
- the display method acquisition unit 733 acquires an input signal from the input unit 110, acquires the first information d10 from the evaluation display database 640 according to the input signal, and further acquires the second information d20 regarding the characteristic experimental value display method. is obtained from the experimental display database 740 .
- the display method acquiring section 733 then outputs the first information d10 to the evaluation value acquiring section 632, the experimental value acquiring section 732, and the image processing section 734.
- FIG. Furthermore, the display method acquisition section 733 outputs the second information d20 to the experimental value acquisition section 732 and the image processing section 734 .
- an image including a map according to the first information d10 and the second information d20 is displayed on the display unit 140 as the first image.
- the display method acquisition unit 733 when the display method acquisition unit 733 acquires an input signal indicating a change in the display method of the characteristic evaluation values from the input unit 110, the display method acquisition unit 733 changes the first information d10 according to the input signal, and converts the changed first information d10 to Output to the evaluation value acquisition unit 632 , experimental value acquisition unit 732 and image processing unit 734 . Further, when the display method acquisition unit 733 acquires an input signal indicating a change in the display method of characteristic experimental values from the input unit 110, the display method acquisition unit 733 changes the second information d20 according to the input signal, and converts the changed second information d20 to Output to the experimental value acquisition unit 732 and the image processing unit 734 .
- the third image in the present embodiment is an image generated along with the change of the second information d20.
- the experimental value acquisition unit 732 acquires the first information d10 and the second information d20 from the display method acquisition unit 733. FIG. Then, the experimental value acquisition unit 732 stores the configuration and characteristic experimental values of one or more tested compounds corresponding to the search range information d14 of the first information d10 and the second information d20 to the experimental database 650. , and outputs them to the image processing unit 734 . Note that the experimental value acquiring unit 732 may acquire the configuration and property experimental values of all compounds stored in the experimental database 650 regardless of the search range information d14.
- the image processing unit 734 acquires the configuration and characteristic evaluation values of each of the plurality of compounds from the evaluation value acquisition unit 632, and the configuration and characteristics of each of the one or more tested compounds from the experimental value acquisition unit 732. get the value. Further, the image processing unit 734 acquires the first information d10 and the second information d20 from the display method acquiring unit 733. FIG. The image processing unit 734 generates a map showing the characteristic evaluation values of each of the plurality of compounds according to the display method indicated by the first information d10 and the second information d20, and furthermore, the one or more compounds that have been tested. Each characteristic experimental value is superimposed on the map.
- the image processing unit 734 assigns a color with a degree of gradation according to the characteristic evaluation value of each of the plurality of compounds on the map corresponding to the composition of the compound. put in position.
- the image processing unit 734 adds a mark having a color with a gradation corresponding to the characteristic experimental value of each of one or more tested compounds to the configuration of the compound. Superimposed on the corresponding map location.
- the color of the gradation corresponding to the characteristic evaluation value or characteristic experimental value may be a color corresponding to the characteristic evaluation value or characteristic experimental value.
- the image processing unit 734 outputs the image including the map on which the one or more characteristic experimental values are superimposed to the display unit 140 as the first image, the second image, or the third image.
- the experiment display database 740 is a recording medium that stores information about the method of displaying characteristic experimental values.
- This recording medium is, for example, a hard disk drive, RAM, ROM, or semiconductor memory. Also, the recording medium may be volatile or non-volatile.
- FIG. 68 is a diagram showing an example of information stored in the experiment display database 740.
- FIG. 68 is a diagram showing an example of information stored in the experiment display database 740.
- the experiment display database 740 stores second information d20 that is information on the method of displaying characteristic experimental values.
- This second information d20 includes second color information d21, second display target information d22, and display condition information d23.
- the second color information d21 indicates, as a color attribute, at least one of the hue, saturation, and brightness of the characteristic experimental values indicated on the map.
- the second display target information d22 indicates the characteristics of the display target related to the characteristic experimental values.
- the display condition information d23 indicates whether or not there is a condition regarding the display of characteristic experimental values, and if there is such a condition, the content of that condition. For example, the content of the condition is that the characteristic experimental value is greater than or equal to the threshold.
- FIG. 69A and 69B are diagrams showing an example of image transition accompanying a change in the second display target information d22.
- FIG. 69A shows an example of the second display target information d22 included in the second information d20 and the first image displayed on the display unit 140 according to the second display target information d22.
- FIG. 69B shows an example of the changed second display target information d22 and the third image displayed on the display unit 140 according to the changed second display target information d22.
- the first image is changed to the third image by changing the second information d20 without changing the first information d10.
- the display method acquisition unit 733 acquires the second display target information d22 shown in (b) of FIG. 69A from the experimental display database 740.
- the second display target information d22 indicates properties 1, 2, and crystal phase as options for each of the shape and color gradation used for the mark for indicating the property experimental value.
- the characteristic 1 is, for example, the bandgap
- the characteristic 2 is, for example, the heat resistance temperature. That is, in the second display target information d22, the characteristic 1, the characteristic 2, and the crystal phase are shown as options as the characteristics of the characteristic experimental values displayed by the shape of the mark.
- the characteristic 1, the characteristic 2, and the crystal phase are shown as options.
- characteristic 1 is selected for each of the mark shape and color density.
- the experimental value acquisition unit 732 acquires such second display target information d22 from the display method acquisition unit 733. Then, the experimental value acquisition unit 732, for example, among the compounds having the configuration included in the search range indicated by the search range information d14 of the first information d10, the property 1 selected in the second display target information d22
- the experimental data in the experimental database 650 is searched for compounds associated with the property experimental value.
- the experimental value acquisition unit 732 acquires the configuration of each of the searched one or more compounds that have already been tested and the characteristic experimental value of the characteristic 1 from the experimental database 650 and outputs them to the image processing unit 734 .
- the image processing unit 734 generates an image map Mb indicating the characteristic evaluation value for the characteristic 1 acquired by the evaluation value acquiring unit 632, like the image processing unit 634 of Embodiment 3A. Further, the image processing unit 734 acquires the second display target information d22 from the display method acquiring unit 733, and acquires the configuration of each of the one or more tested compounds and the characteristic experimental value of the characteristic 1 from the experimental value acquiring unit 732. get. Then, the image processing unit 734 superimposes a mark indicating the characteristic experimental value of the characteristic 1 of each compound on the position on the image map Mb corresponding to the composition of the compound for each of the one or more compounds that have been tested. .
- the image processing unit 734 superimposes the mark according to the second display target information d22.
- the image processing unit 734 superimposes a mark having a circular shape corresponding to the characteristic 1 and having a color density corresponding to the characteristic experimental value of the characteristic 1 on the image map Mb.
- the image processing unit 734 displays the first image shown in (a) of FIG. 69A on the display unit 140 .
- This first image includes an image map Mb, and on the image map Mb is superimposed a mark having a circular shape and having a color with a density corresponding to the characteristic experimental value. That is, the characteristic experimental value is superimposed on the image map Mb as its mark.
- the image processing unit 734 calculates the relationship between the characteristic experimental value and the gray level, and the relationship between the characteristic evaluation value and the gray level. may be the same. In other words, the gradation scale for characteristic evaluation values and the gradation scale for characteristic experimental values may be used in common.
- the color gradation at the position corresponding to the compound on the image map Mb and the color attached to the characteristic experimental value mark is very different from the gradation of
- the mark e1 of the characteristic experimental value that is significantly different from the characteristic evaluation value can be made conspicuous. In other words, it is possible to make it easier to visually understand that the characteristic experimental value is deviated from the characteristic evaluation value.
- the user can confirm that the characteristic experimental value and the characteristic evaluation value are substantially the same. can be immediately understood visually.
- the user changes the second display target information d22 of the second information d20 by performing an input operation on the input unit 110.
- FIG. For example, when the display method acquiring unit 733 acquires from the input unit 110 an input signal indicating a change in the second display target information d22, the second display target information d22 according to the input signal is displayed in (b) of FIG. 69B. change as shown.
- the crystal phase is selected for the shape of the mark, and the characteristic 1 is selected for the color density of the mark.
- the experimental value acquisition unit 732 acquires the thus changed second display target information d22 from the display method acquisition unit 733. Then, the experimental value acquiring unit 732 selects the compound associated with the characteristic experimental value of each of the characteristic 1 and the crystal phase selected in the second display target information d22 among the compounds having the configuration included in the search range. is retrieved from the experimental data in the experimental database 650 . In addition, in the present embodiment, the type of crystal phase is shown as characteristic experimental values.
- the experimental value acquisition unit 732 obtains the composition of the compound, the characteristic experimental value of characteristic 1 of the compound, and the characteristic experimental value of the crystalline phase of the compound ( That is, the type of crystal phase) is acquired from the experimental database 650 and output to the image processing unit 734 .
- the image processing unit 734 acquires the changed second display target information d22 from the display method acquiring unit 733, and from the experimental value acquiring unit 732, for each of one or more compounds that have been tested, the composition and , the characteristic experimental value of characteristic 1 and the characteristic experimental value of the crystal phase are obtained. Then, for each of the one or more compounds that have been tested, the image processing unit 734 creates a mark indicating the characteristic experimental value of the characteristic 1 of the compound and the characteristic experimental value of the crystalline phase (that is, the type of the crystalline phase) of the compound. is superimposed on the position on the image map Mb corresponding to the configuration of . At this time, the image processing unit 734 superimposes the mark according to the second display target information d22.
- the image processing unit 734 creates a mark having a shape corresponding to the characteristic experimental value of the crystal phase of the compound and having a color with a degree of gradation corresponding to the characteristic experimental value of the characteristic 1 of the compound on the image map Mb. superimpose.
- the image processing unit 734 displays the third image shown in (a) of FIG. 69B on the display unit 140 .
- the third image includes an image map Mb, and the image map Mb includes a mark e2 having a circular shape and having a color with a density corresponding to the characteristic experimental value of the characteristic 1; A mark e3 having a triangular shape and colored with a degree of gradation corresponding to the characteristic experimental value of the characteristic 1 is superimposed.
- the circular mark e2 indicates that the crystal phase of the compound having the configuration corresponding to the position of the mark e2 is of the first type, and the triangular mark e3 indicates the configuration corresponding to the position of the mark e3.
- the crystal phase of the compound having is of the second type.
- the shape of the mark is set to a circular shape, a triangular shape, or the like, depending on the characteristic experimental value of the crystalline phase, that is, the type of the crystalline phase.
- the degree of gradation of the color of the mark is set according to the characteristic experimental value of characteristic 1.
- FIG. As a result, in the third image shown in (a) of FIG. 69B, the gradation of the color of the mark e3 is the same as the example of (a) of FIG. 69A. The color gradation is greatly different, and the shape of the mark e3 is also different from the shape of the other marks e2.
- the display system 700 in this embodiment can suggest to the user that, for example, the process conditions may not be optimal.
- the image displayed on the display unit 140 dynamically changes from the first image to the third image.
- the characteristic display device 730 includes an experimental value acquisition section 732, a display method acquisition section 733, and an image processing section 734.
- the display method acquisition unit 733 acquires the second information d20 for displaying the characteristic experimental values of the compound.
- the experimental value acquiring unit 732 and the image processing unit 734 acquire characteristic experimental values of the compound for each of the one or more compounds that have been tested, and correspond to the composition of the compound.
- the characteristic experimental value of the compound is superimposed on the position on the image map Mb.
- the characteristic experimental values are superimposed on the image map Mb based on the second information d20, so that the characteristic evaluation values and the characteristic experimental values of the plurality of compounds shown in the image map Mb can be appropriately compared. can do.
- the second information d20 is changed by the display method acquisition unit 733.
- the image processing unit 734 outputs to the display unit 140 a third image including the image map Mb in which the display mode of one or more characteristic experimental values superimposed on the image map Mb is changed.
- the image processing unit 734 changes the display mode of one or more characteristic experimental values superimposed on the image map Mb according to the changed second information d20, thereby displaying the image map Mb as A third image including the changed image map Mb is generated and output to the display unit 140 .
- the third image is output to the display unit 140 and displayed.
- the image map Mb on which the characteristic experimental values are superimposed is displayed in the third image in a display mode corresponding to the content of the change.
- the characteristic experimental values of each of the above compounds can be displayed from various viewpoints. As a result, it is possible to improve the efficiency of material search, and appropriately support material development.
- the second information d20 includes second display target information d22 indicating one or more characteristic types.
- the experimental value acquisition unit 732 acquires a property experimental value for each of the one or more property types indicated by the second display target information d22 for each of the one or more compounds that have been tested.
- the image processing unit 734 superimposes a mark on the image map Mb in a form corresponding to the property experimental value for each of the one or more property types for each of the one or more properties that have been tested.
- the display method acquisition unit 733 changes the type of one or more characteristics indicated by the second display target information d22.
- the image map Mb on which the characteristic experimental values are superimposed is displayed in the third image in a display mode corresponding to the content of the change.
- Characterization values for each of one or more compounds can be displayed in terms of various types of properties. As a result, the efficiency of searching for materials can be improved.
- the second information d20 includes second color information d21 indicating at least one of hue, saturation, and lightness as the color attribute of the characteristic experimental value.
- the image processing unit 734 generates an image map Mb in which the characteristic experimental values of one or more tested compounds are superimposed in a color having the color attribute indicated by the second color information d21.
- the display method acquisition unit 733 changes the color attribute indicated by the second color information d21. For example, the display method acquisition unit 733 changes the color attribute according to the user's input operation to the input unit 110 .
- the color of the characteristic experimental value shown in the image map Mb is changed to a color having the changed color attribute. Therefore, the color attributes of the characteristic evaluation values shown in the image map Mb can be arbitrarily changed, and the image map Mb on which the user-friendly characteristic experimental values are superimposed can be included in the third image and displayed. As a result, the efficiency of searching for materials can be improved.
- FIG. 70A and 70B are diagrams showing an example of image transition accompanying a change in the display condition information d23.
- FIG. 70A shows an example of the display condition information d23 included in the second information d20 and the first image displayed on the display unit 140 according to the display condition information d23.
- FIG. 70B shows an example of the changed display condition information d23 and the third image displayed on the display unit 140 according to the changed display condition information d23.
- the display method acquisition unit 733 acquires the display condition information d23 shown in (b) of FIG. 70A from the experimental display database 740.
- the display condition information d23 indicates, as options, "Yes” and "No” threshold setting for the threshold value, which is a condition for displaying characteristic experimental values.
- threshold setting "none" is selected.
- the image processing unit 734 generates an image map Mb indicating the characteristic evaluation values acquired by the evaluation value acquisition unit 632, as described above. Furthermore, the image processing unit 734 acquires the display condition information d23 from the display method acquiring unit 733 and acquires the configuration and characteristic experimental values of one or more tested compounds from the experimental value acquiring unit 732 . Then, the image processing unit 734 superimposes a mark indicating the characteristic experimental value of each of the one or more compounds that have been tested on the position on the image map Mb corresponding to the composition of the compound. At this time, the image processing unit 734 superimposes the mark according to the display condition information d23.
- the image processing unit 734 since the threshold value setting “none” is selected in the display condition information d23, the image processing unit 734 has the same shape regardless of the size of the characteristic experimental value acquired by the experimental value acquisition unit 732. Also, a mark having a color density corresponding to the characteristic experimental value is superimposed on the image map Mb.
- the image processing unit 734 displays the first image shown in (a) of FIG. 70A on the display unit 140 .
- This first image includes an image map Mb.
- the image map Mb for example, all characteristic experimental values obtained by the experimental value obtaining unit 732 each have a circular shape and their characteristics It is superimposed as a mark having a color of gradation according to the experimental value.
- the user changes the display condition information d23 of the second information d20 by performing an input operation on the input unit 110.
- the display method acquisition unit 733 acquires from the input unit 110 an input signal indicating a change in the display condition information d23
- the display method acquisition unit 733 changes the display condition information d23 according to the input signal as shown in (b) of FIG. 70B. change.
- threshold setting "yes” is selected.
- the display condition information d23 indicates a threshold "3.5" as a numerical threshold. That is, the display condition information d23 indicates, as the content of the condition, that the characteristic experimental value is equal to or greater than the threshold "3.5".
- a threshold for specifying the number of items may be set, and a threshold for specifying a date may be set.
- the display condition information d23 indicates that the number of characteristic experimental values is greater than or equal to the threshold or less than the threshold as the content of the condition.
- a date-designated threshold is set, the display condition information d23 indicates, as the content of the condition, that the date when the characteristic experimental value was obtained by the experiment is after the threshold date or before the threshold date.
- the image processing unit 734 acquires the changed display condition information d23 from the display method acquiring unit 733, and acquires the configuration and characteristic experimental values of one or more compounds that have been tested from the experimental value acquiring unit 732. . Then, the image processing unit 734 superimposes a mark indicating the characteristic experimental value of each of the one or more compounds that have been tested on the position on the image map Mb corresponding to the composition of the compound. At this time, the image processing unit 734 superimposes the mark according to the changed display condition information d23. In other words, the display condition information d23 indicates that the threshold setting "Yes" is selected and the characteristic experimental value is equal to or greater than the threshold "3.5". Therefore, as shown in (a) of FIG.
- the image processing unit 734 has a star shape if the characteristic experimental value acquired by the experimental value acquiring unit 732 is equal to or greater than the threshold “3.5”. In addition, a mark e4 having a color with a density corresponding to the characteristic experimental value is superimposed on the image map Mb as the characteristic experimental value. On the other hand, if the characteristic experimental value obtained by the experimental value obtaining section 732 is less than the threshold "3.5", the image processing section 734 has a circular shape and a gray level corresponding to the characteristic experimental value. is superimposed on the image map Mb as its characteristic experimental value.
- the image processing unit 734 emphasizes the mark e4 corresponding to the characteristic experimental value equal to or greater than the threshold "3.5" than the mark e5 corresponding to the characteristic experimental value less than the threshold "3.5". Then, the image processing unit 734 displays the third image including the image map Mb on which the marks e4 and e5 are superimposed on the display unit 140, as shown in (a) of FIG. 70B.
- the image displayed on the display unit 140 dynamically changes from the first image to the third image.
- the image processing unit 734 changes the shape of the mark e4 corresponding to the characteristic experimental value equal to or greater than the threshold "3.5” to the shape of the mark e5 corresponding to the characteristic experimental value less than the threshold "3.5".
- the characteristic experimental values that are equal to or greater than the threshold "3.5” are highlighted.
- the image processing unit 734 may highlight characteristic experimental values equal to or greater than the threshold "3.5" by a method other than the shape of the mark.
- the mark or the property experimental value corresponding to the mark may be highlighted by a border around the mark, a glow decoration on the mark, or the like.
- a threshold for specifying the number of cases is set in the display condition information d23, for example, characteristic experimental values corresponding to the number of thresholds are highlighted in descending order. This allows the user to easily understand promising characteristic experimental values from a large number of characteristic experimental values.
- a date-designated threshold is set in the display condition information d23, for example, characteristic experimental values obtained by experiments after the date of the threshold are highlighted. This allows the user to easily grasp the latest experimental status or the daily experimental status.
- the second information d20 includes the display condition information d23 indicating the display condition of the characteristic experimental value based on the threshold.
- the image processing unit 734 determines the characteristic experimental values that satisfy the display condition indicated by the display condition information d23 and the characteristic experimental values that do not satisfy the display condition among the characteristic experimental values of one or more compounds that have already been tested. are superimposed on the map in different manners.
- the display method acquisition unit 733 changes the display condition indicated by the display condition information d23 by increasing or decreasing the threshold.
- the image map Mb on which the characteristic experimental values are superimposed is displayed in the third image in a display mode corresponding to the content of the change.
- Characteristic evaluation values of each of the above compounds can be displayed from the viewpoint of various display conditions.
- the efficiency of searching for materials can be improved.
- the display mode of characteristic experimental values that satisfy the display condition of the threshold value or more can be emphasized over the display mode of the characteristic experimental value that does not satisfy the display condition of the threshold value or more.
- the characteristic experimental value emphasized in the image map Mb can be changed so that the user can easily see it.
- the first information d10 is not changed in the specific example of changing the image shown in FIGS. 69A to 70B, the first information d10 may be changed as in Embodiment 3A.
- the third image includes an image map Mb reflecting changes in the first information d10 and the second information d20.
- FIG. 71 is a flow chart showing the processing operation of display system 700 in this embodiment.
- the display method acquisition unit 733 acquires the first information d10 regarding the display method of the characteristic evaluation values from the evaluation display database 640, and transmits the first information d10 to the evaluation value acquisition unit 632, the experimental value acquisition unit 732, and the image processing unit 734. output to
- the display method acquisition unit 733 further acquires the second information d20 regarding the display method of characteristic experimental values from the experiment display database 740 and outputs the second information d20 to the experimental value acquisition unit 732 and the image processing unit 734 .
- the experimental value acquisition unit 732 acquires the first information d10 and the second information d20 from the display method acquisition unit 733. FIG. Then, the experimental value acquisition unit 732 obtains the characteristic experimental values of the one or more tested compounds included in the search range indicated by the search range information d14 of the first information d10, The characteristic experimental value of the type indicated by the second display object information d22 is obtained from the experimental database 650 together with the composition of the compound. The experimental value acquisition unit 732 outputs the configuration and characteristic experimental values of the one or more compounds that have been tested to the image processing unit 734 .
- Step S213 The evaluation value acquisition unit 632 acquires the first information d10 from the display method acquisition unit 733. FIG. Then, the evaluation value acquisition unit 632 acquires the characteristic evaluation values of each of the plurality of compounds according to the calculation method information d12 and the search range information d14 of the first information d10. At this time, the evaluation value acquiring unit 632 uses one or more evaluators in the evaluator database 620 to acquire characteristic evaluation values for each of the plurality of compounds. The evaluation value acquisition unit 632 outputs the configuration of each of the plurality of compounds and the characteristic evaluation values corresponding to those configurations to the image processing unit 734 .
- Step S223 The image processor 734 generates a first image including the image map Mb.
- the image processing unit 734 generates the image map Mb using the first information d10 obtained in step S211 and the configurations and characteristic evaluation values of the plurality of compounds obtained in step S213.
- the image processing unit 734 superimposes the characteristic experimental value of each of the one or more compounds that have been tested in step S222 on the position on the image map Mb corresponding to the composition of the compound.
- the image processing unit 734 generates a mark having a form corresponding to the characteristic experimental value according to the second information d20 acquired in step S221, and superimposes the mark as the characteristic experimental value. This produces a first image containing an image map Mb superimposed with the respective characteristic experimental values of one or more tested compounds.
- Image processing portion 734 outputs the first image to display portion 140 .
- Step S224 Display unit 140 acquires the first image from image processing unit 734 and displays the first image.
- Step S225 A user performs an input operation on the input unit 110 .
- the input unit 110 outputs an input signal indicating a change in the display of the first image to the display method acquisition unit 733 of the characteristic display device 730 according to the user's input operation.
- the display method obtaining unit 733 receives the change of the display of the first image by obtaining the input signal.
- the display method acquisition unit 733 changes at least one of the first information d10 acquired in step S211 and the second information d20 acquired in step S221 according to the input signal acquired in step S225. do.
- the display method acquisition unit 733 then outputs the changed at least one piece of information to at least two of the evaluation value acquisition unit 632 , the experimental value acquisition unit 732 , and the image processing unit 734 . That is, when the first information d10 is changed, the display method acquisition unit 733 outputs the changed first information d10 to the evaluation value acquisition unit 632, the experimental value acquisition unit 732, and the image processing unit 734. do.
- the display method acquisition section 733 outputs the changed second information d20 to the experimental value acquisition section 732 and the image processing section 734 .
- Step S227) After obtaining the changed first information d10 from the display method obtaining unit 733, the evaluation value obtaining unit 632 re-obtains the characteristic evaluation value according to the changed content of the first information d10.
- the experimental value acquisition unit 732 acquires the changed first information d10 and second information d20 from the display method acquisition unit 733
- the experimental value acquiring unit 732 acquires characteristic experimental values according to the changed contents of the first information d10 and the second information d20. get back.
- the image processing unit 734 then generates a third image according to the changed first information d10 and second information d20.
- This third image includes, for example, an image map Mb showing the reacquired property evaluation values and on which the reacquired property experimental values are superimposed.
- Image processing portion 734 outputs the third image to display portion 140 .
- Step S228) Display unit 140 acquires the third image from image processing unit 734 and displays the third image.
- Embodiment 3C As in Embodiment 3B, the display system in this embodiment generates and displays an image including a map on which characteristic experimental values of one or more tested compounds are superimposed. Furthermore, the display system according to the present embodiment stores one or more previously generated images and displays the stored images.
- the constituent elements in the present embodiment are denoted by the same reference numerals as those in Embodiments 1, 2, 3A and 3B. detailed description is omitted.
- the image map Mb is given as an example of the map, but the map in the present embodiment is not limited to the image map Mb, and may be the image element map Ma. It may be a set of a plurality of image maps Mb.
- FIG. 72 is a block diagram showing an example of the configuration of display system 800 in this embodiment.
- a display system 800 shown in FIG. 72 includes an input unit 110, an evaluator database 620, a characteristic display device 830, a display unit 140, an evaluation display database 640, an experiment database 650, an experiment display database 740, and an image storage. a portion 820; Note that the characteristic display device 830 is an example of an information display device.
- the property display device 830 in the present embodiment Similar to the property display device 730 of Embodiment 3B, the property display device 830 in the present embodiment generates a map showing property evaluation values of each of a plurality of compounds, and Characteristic experimental values are superimposed on the map. Then, characteristic display device 830 generates an image including the map and displays it on display unit 140 .
- property display device 830 in the present embodiment adds the date when the image was generated to the image, and stores the date-added image in image storage unit 820 . Then, when the characteristic display device 830 receives an input signal indicating the date from the input unit 110 , it acquires an image corresponding to the date from the image storage unit 820 and displays it on the display unit 140 .
- Such a characteristic display device 830 includes an evaluation value acquisition section 632 , a display method acquisition section 833 , an experimental value acquisition section 732 and an image processing section 834 .
- the characteristic display device 830 may be composed of a processor such as a CPU and a memory, for example.
- the processor functions as the characterization device 830, for example by executing a computer program stored in memory.
- the memory may be volatile or nonvolatile, and may be composed of a volatile memory and a nonvolatile memory.
- Display method acquisition unit 833 has the same function as display method acquisition unit 733 of Embodiment 3B, and further acquires an input signal indicating the date from input unit 110 as date setting information d30.
- This date setting information d30 is information for prompting display of an image to which the date set by the user is added.
- the display method acquisition unit 833 acquires the date setting information d30, it outputs the date setting information d30 to the image processing unit 834.
- FIG. As a result, the image to which the date indicated by the date setting information d30 is added is displayed on display unit 140 as the fourth image.
- the display method acquisition unit 833 acquires an input signal indicating a date change from the input unit 110
- the date setting information d30 is changed according to the input signal
- the date setting information d30 after the change is processed by the image processing unit 834. output to As a result, the image to which the date indicated by the changed date setting information d30 is added is displayed on the display unit 140 as the fifth image.
- the image processing unit 834 has the same function as the image processing unit 734 of Embodiment 3B, and further stores the generated image including the map in the image storage unit 820 . At this time, the image processing unit 834 adds the date when the image was generated to the image and stores the image in the image storage unit 820 .
- the image may be any one of the first image, the second image and the third image. Also, the image to which the date is added is stored in image storage unit 820 as a saved image.
- the image processing unit 834 acquires the date setting information d30 from the display method acquiring unit 833, it searches the image storage unit 820 for a saved image to which the date indicated by the date setting information d30 is added. Then, image processing section 834 acquires the saved image to which the date is added from image storage section 820, and outputs the saved image to display section 140 as the fourth or fifth image.
- the image storage unit 820 is a recording medium for storing an image including the map generated by the image processing unit 834 as a saved image.
- This recording medium is, for example, a hard disk drive, RAM, ROM, or semiconductor memory. Also, the recording medium may be volatile or non-volatile. Note that the saved image stored in the image storage unit 820 is added with the date when the saved image was generated as accompanying information.
- FIG. 73A and 73B are diagrams showing an example of image transition accompanying a change in date setting information d30.
- FIG. 73A shows an example of a setting image for receiving date setting information d30 and a fourth image displayed on display unit 140 according to the date setting information d30.
- FIG. 73B shows an example of a setting image for accepting changed date setting information d30 and a fifth image displayed on display unit 140 according to the changed date setting information d30.
- the display method acquisition unit 833 acquires the date setting information d30 from the input unit 110.
- the image processing unit 834 displays a setting image for accepting the date setting information d30 on the display unit 140, as shown in (b) of FIG. 73A.
- the setting image shows ON and OFF as options for setting the date.
- the user performs an input operation on the input unit 110 while viewing the setting image. For example, the user selects OFF by the input operation.
- Input unit 110 outputs date setting information d30, which is an input signal corresponding to the input operation, to display method acquisition unit 833.
- the date setting information d30 indicates OFF for date setting.
- the display method acquisition section 833 outputs the date setting information d30 to the image processing section 834 .
- the image processing unit 834 acquires the date setting information d30 from the display method acquisition unit 833, the date setting information d30 indicates OFF, so the image processing unit 834 acquires the latest saved image from the image storage unit 820. Then, image processing section 834 outputs the latest stored image to display section 140 as the fourth image. That is, the image processing unit 834 displays the fourth image shown in (a) of FIG. 73A on the display unit 140 .
- the user changes the date setting information d30 by performing an input operation on the input unit 110.
- the image processing unit 834 displays a setting image for receiving the change of the date setting information d30 on the display unit 140, as shown in (b1) to (b3) of FIG. 73B.
- the user performs an input operation on the input unit 110 while viewing the setting image. For example, the user selects ON by the input operation.
- the image processing unit 834 receives an input signal indicating its ON from the input unit 110 via the display method acquisition unit 833, the image processing unit 834 sets the slider and slider bar for setting the date, and the continuous playback button. Include in images.
- the user By performing an input operation on the input unit 110, the user moves the slider to set the date to April 1, 2018, as shown in (b1) of FIG. 73B, for example.
- the date setting information d30 is changed. That is, the date setting information d30 is changed from information indicating OFF for date setting to information indicating April 1, 2018 for date setting.
- the display method acquisition unit 833 acquires the changed date setting information d30 from the input unit 110 and outputs the changed date setting information d30 to the image processing unit 834 .
- the image processing unit 834 acquires the changed date setting information d30 from the display method acquiring unit 833, the changed date setting information d30 indicates April 1, 2018.
- the image storage unit 820 is searched for saved images with the date of the 1st.
- image processing section 834 acquires the saved image from image storage section 820 and outputs the saved image to display section 140 as the fifth image. That is, the image processing unit 834 displays the fifth image shown in (a1) of FIG. 73B on the display unit 140.
- the user moves the slider to change the date to April 2, 2018 or April 2018, as shown in (b2) or (b3) of FIG. 73B, for example.
- the date setting information d30 is changed in the same manner as described above.
- the image processing unit 834 acquires the changed date setting information d30 from the display method acquiring unit 833
- the image processing unit 834 stores the saved image to which the date corresponding to the changed date setting information d30 is added to the image storage unit. Search from 820.
- image processing section 834 acquires the saved image from image storage section 820 and outputs the saved image to display section 140 as the fifth image. That is, the image processing unit 834 displays the fifth image shown in (a2) or (a3) in FIG. 73B on the display unit 140.
- the image processing unit 834 acquires each saved image from the image storage unit 820 from the saved image of the old date to the saved image of the new date, and stores the saved images as the fifth image in order from the saved image of the old date. is displayed on the display unit 140 as .
- the image displayed on the display unit 140 dynamically changes from the fourth image to the fifth image by changing the date setting information d30.
- the user can easily grasp the daily progress of the experiment, and can appropriately support the material development by the user.
- the display method acquisition section 833 may output date setting information d30 indicating the plurality of dates to the image processing section 834.
- the image processing unit 834 may arrange the stored images generated on each of the plurality of dates in chronological order and display them on the display unit 140 . This allows the user to easily compare multiple stored images.
- the image processing unit 834 may convert an image including the image map Mb into an image in a state in which the change operation is impossible, and store the image in the state in which the change operation is impossible in the image storage unit 820 as a saved image. . Then, the image processing unit 834 may acquire the stored image from the image storage unit 820 and display it on the display unit 140 as it is, reconstruct the stored image into an image in a state in which a change operation is possible, and reconstruct the image. The resulting image may be displayed on the display unit 140 .
- the image that cannot be changed may be in a format such as JPEG (Joint Photographic Experts Group), GIF (Graphics Interchange Format), or PNG (Portable Network Graphics).
- Such an image that cannot be changed is an image that cannot be updated according to changes in the first information d10, the second information d20, the date setting information d30, and the like.
- an image that can be changed is an image that can be updated according to changes in the first information d10, the second information d20, the date setting information d30, and the like.
- Reconstruction is processing for returning the state of the image from a state in which change operation is impossible to a state in which change operation is possible.
- the storage capacity of the image storage unit 820 can be reduced when the data amount of the image in the state in which the change operation cannot be performed is smaller than the data amount of the image in the state in which the change operation is possible.
- the image in the state in which the change operation is disabled is read from the image storage unit 820 and is displayed on the display unit 140 after being reconstructed into the image in the state in which the change operation is enabled, the user can read the first information d10. , second information d20, date setting information d30, etc., the displayed image can be updated. This will enable additional analysis of images generated in the past, and is expected to lead to smoother discussions and more efficient research and development.
- the image processing section 834 associates the accompanying information indicating the point in time when the first image was generated with the first image, and the first image associated with the accompanying information is displayed. is stored in the image storage unit 820 as a saved image.
- the image processing unit 834 associates the second image with associated information indicating the point in time when the second image was generated, and uses the second image associated with the associated information as a saved image. Stored in the image storage unit 820 .
- the display method acquisition unit 833 acquires time point information indicating the first time point.
- the image processing unit 834 reads the stored image associated with the accompanying information corresponding to the first time point indicated by the time point information from the image storage unit 820 as the fourth image and outputs it to the display unit 140 . Further, the display method acquisition unit 833 changes the first time point indicated by the time point information to the second time point. At this time, the image processing unit 834 reads the saved image associated with the accompanying information corresponding to the second time point from the image storage unit 820 as the fifth image, and displays the fifth image on the display unit 140 instead of the fourth image. output to For example, the accompanying information indicates the date when the first image or the second image was generated, and the point-in-time information corresponds to the date setting information d30 described above. Also, the first time point and the second time point may be absolute points of time such as dates, or relative points of time such as the latest point of time. For example, the fourth image and the fifth image are output to the display unit 140 and displayed.
- the first image or second image generated in the past can be read out from the image storage unit 820 and displayed as the fourth image according to the time point information, which is the date setting information d30, for example. Furthermore, by changing the point-in-time information, the first image or the second image generated at the user's desired point-in-time can be read from the recording medium and displayed as the fifth image. As a result, the efficiency of searching for materials can be improved.
- FIG. 74 is a flow chart showing the processing operation of display system 800 in this embodiment.
- Step S230 the display system 800 executes image generation processing.
- display system 800 executes each step shown in the flowchart of FIG. 71 in Embodiment 3B, or steps S211, S213 and S221 to S224 included in the flowchart, in the image generation processing in step S230.
- the image generation processing in step S230 Thereby, at least the first image among the first image, the second image and the third image is generated and displayed.
- Step S231 the image processing unit 834 of the characteristic display device 830 saves the image generated by the image generation processing in step S230 as a saved image. At this time, the image processing unit 834 adds the date when the image was generated to the image, and stores the date-added image in the image storage unit 820 as a saved image.
- Step S232 the display method acquisition unit 833 of the characteristic display device 830 determines whether or not the date setting information d30 has been received from the input unit 110.
- the display method acquisition unit 833 determines that the date setting information d30 has not been received (No in step S232)
- the display system 800 repeats the processing from step S230.
- Step S233 On the other hand, in step S232, when the display method obtaining unit 833 determines that the date setting information d30 has been received (Yes in step S232), the image processing unit 834 obtains the date setting information d30 from the display method obtaining unit 833. . Then, the image processing unit 834 acquires the saved image to which the date indicated by the date setting information d30 is added from the image storage unit 820 as the fourth image.
- Step S234 Image processing unit 834 displays the fourth image on display unit 140 by outputting the fourth image obtained in step S ⁇ b>233 to display unit 140 .
- Step S235 the display method acquisition unit 833 determines whether or not a change in the date setting information d30 has been received from the input unit 110.
- the characteristic display device 830 executes the process of step S238.
- Step S236 On the other hand, when the display method obtaining unit 833 determines that the change of the date setting information d30 has been received from the input unit 110 (Yes in step S235), the image processing unit 834 obtains the fifth image. That is, the image processing unit 834 acquires from the image storage unit 820 the stored image to which the date indicated by the changed date setting information d30 is added as the fifth image.
- Image processing unit 834 displays the fifth image on display unit 140 by outputting the fifth image acquired in step S236 to display unit 140 .
- Step S238) the characteristic display device 830 determines whether or not the conditions for terminating the process are satisfied. For example, the characteristic display device 830 acquires an input signal from the input unit 110, and determines that the processing end condition is satisfied when the input signal indicates the end of processing. Here, when the property display device 830 determines that the processing end condition is not satisfied (No in step S238), it repeats the processing from step S235. On the other hand, when the property display device 830 determines that the processing end condition is satisfied (Yes in step S238), it ends all the processing related to property display.
- the display system in this embodiment generates and displays an image including a map on which characteristic experimental values of one or more tested compounds are superimposed. Furthermore, the display system in the present embodiment displays the composition formula of the compound having the selected characteristic evaluation value or characteristic experimental value when a characteristic evaluation value or characteristic experimental value is selected on the map.
- the same components as in Embodiments 1, 2, and 3A to 3C are denoted by the same reference numerals as in Embodiments 1, 2, and 3A to 3C. , detailed description is omitted.
- the image map Mb is given as an example of the map, but the map in the present embodiment is not limited to the image map Mb, and may be the image element map Ma. It may be a set of a plurality of image maps Mb.
- FIG. 75 is a block diagram showing an example of the configuration of display system 900 in this embodiment.
- a display system 900 shown in FIG. 75 includes an input section 110, an evaluator database 620, a characteristic display device 930, a display section 140, an evaluation display database 640a, an experiment database 650, and an experiment display database 740a.
- the characteristic display device 930 is an example of an information display device.
- the property display device 930 in the present embodiment Like the property display device 730 of Embodiment 3B, the property display device 930 in the present embodiment generates a map showing the property evaluation values of each of a plurality of compounds, and Characteristic experimental values are superimposed on the map. The property display device 930 then generates an image including the map and displays it on the display unit 140 .
- property display device 930 in the present embodiment identifies the composition formula of a compound having that property evaluation value using evaluation display database 640a, and A composition formula is displayed on the display unit 140 .
- the property display device 930 in the present embodiment identifies the composition formula of the compound having that property experimental value using the experiment display database 740a. A composition formula is displayed on the display unit 140 .
- Such a characteristic display device 930 includes an evaluation value acquisition section 632 , a display method acquisition section 933 , an experimental value acquisition section 732 and an image processing section 934 .
- the characteristic display device 930 may be composed of a processor such as a CPU and a memory, for example.
- the processor functions as the characterization device 930, for example by executing a computer program stored in memory.
- the memory may be volatile or nonvolatile, and may be composed of a volatile memory and a nonvolatile memory.
- the display method acquisition unit 933 has the same function as the display method acquisition unit 733 of Embodiment 3B. Furthermore, the display method acquisition unit 933 identifies the composition formula of the compound having the characteristic evaluation value or characteristic experimental value selected by the user. For example, the user looks at the image displayed on the display unit 140 and selects a characteristic evaluation value indicated on the map in the image by performing an input operation on the input unit 110 . Input unit 110 outputs an input signal indicating the position on the map of the characteristic evaluation value selected according to the user's input operation to display method acquisition unit 933 as position information d40. After acquiring the position information d40 from the input unit 110, the display method acquisition unit 933 obtains the composition formula corresponding to the position indicated by the position information d40 using first composition information described later included in the evaluation display database 640a. Identify.
- the user looks at the image displayed on the display unit 140 and selects the characteristic experimental value shown on the map in the image by performing an input operation on the input unit 110 .
- the input unit 110 outputs an input signal indicating the position on the map of the characteristic experimental value selected according to the user's input operation to the display method acquisition unit 933 as the position information d40.
- the display method acquisition unit 933 acquires the position information d40 from the input unit 110
- the composition formula corresponding to the position indicated by the position information d40 is obtained using second composition information described later included in the experimental display database 740a. Identify.
- the display method acquisition unit 933 outputs the specified composition formula to the image processing unit 934 .
- the image processing unit 934 has the same function as the image processing unit 734 of Embodiment 3B. Furthermore, upon receiving the composition formula from the display method acquisition unit 933 , the image processing unit 934 outputs a composition image showing the composition formula to the display unit 140 . Thereby, the composition image is displayed on the display unit 140 .
- FIG. 76 is a diagram showing an example of information stored in the evaluation display database 640a.
- the evaluation display database 640a in the present embodiment is a recording medium storing the first information d10, and further holds the first composition information d18. ing.
- the first composition information d18 is information indicating the composition formula corresponding to the position of each characteristic evaluation value on the map.
- FIG. 77 is a diagram showing an example of information stored in the experiment display database 740a.
- Experimental display database 740a in the present embodiment is a recording medium storing second information d20, similar to experimental display database 740 in Embodiments 3B and 3C, and further holds second composition information d24. ing.
- the second composition information d24 is information indicating the composition formula corresponding to the position of each characteristic experimental value on the map.
- FIG. 78 is a diagram showing an example of image transition accompanying acquisition of position information d40. Specifically, (a) of FIG. 78 shows an example of the sixth image displayed on the display unit 140, and (b) of FIG. 78 shows the seventh image displayed on the display unit 140 according to the position information d40. An example of an image is shown. Note that the sixth image is, for example, the first image, the second image, or the third image.
- the image processing unit 934 displays the sixth image including the image map Mb on the display unit 140, as shown in FIG. 78(a), as in Embodiment 3B. Also, one or more characteristic experimental values are superimposed on the image map Mb.
- the user selects any one of the one or more characteristic experimental values by performing an input operation on the input unit 110 .
- the input unit 110 outputs position information d40 indicating the position of the selected characteristic experimental value on the image map Mb to the display method acquisition unit 933 in accordance with the input operation.
- the display method acquisition unit 933 acquires the second composition information d24 from the experimental display database 740a.
- the display method acquisition unit 933 searches the second composition information d24 for the composition formula associated with the position on the image map Mb indicated by the position information d40.
- the display method acquisition unit 933 outputs the searched composition formula to the image processing unit 934 .
- the image processing unit 934 acquires the composition formula from the display method acquisition unit 933, it generates a composition image f1 showing the composition formula as shown in FIG. 78(b). Then, the image processing section 934 generates a seventh image by superimposing the composition image f1 on the image map Mb, and outputs the seventh image to the display section 140 . As a result, the seventh image on which the composition image f1 is superimposed is displayed on the display section 140, as shown in FIG. 78(b). That is, the image displayed on display unit 140 dynamically changes from the sixth image to the seventh image.
- characteristic experimental values are selected, but characteristic evaluation values may be selected.
- the display method acquisition unit 933 acquires the first composition information d18 from the evaluation display database 640a. Then, the display method acquisition unit 933 searches the first composition information d18 for the composition formula associated with the position on the image map Mb indicated by the position information d40. The display method acquisition unit 933 outputs the searched composition formula to the image processing unit 934 .
- the composition image f1 showing the composition formula corresponding to the selected characteristic evaluation value is superimposed on the image map Mb, and the seventh image including the image map Mb is displayed on the display unit. 140.
- the selection of the characteristic experimental value or the characteristic evaluation value by the user may be performed by clicking the mouse or by clicking and holding.
- the image processing section 934 may cause the display section 140 to display the composition image f1 while the click-and-hold is being performed.
- the user can easily grasp the compositional formula of the compound corresponding to the selected characteristic evaluation value or characteristic experimental value without obtaining it from the option data of the range variable.
- the composition formula shown in the composition image f1 may not be a strict composition formula.
- the composition image may contain and display the composition formula corresponding to the grid point closest to that position. good.
- the display method acquisition unit 933 obtains the characteristic evaluation value Alternatively, the position information d40 indicating the position of the characteristic experimental value is obtained. Then, the display method acquisition unit 933 acquires composition formula data relating to the composition formula of the compound corresponding to the position indicated by the position information d40. The image processing unit 934 changes the sixth image to the seventh image by superimposing the composition image f1 indicating the composition formula data on the image map Mb. For example, the seventh image is output to the display unit 140 and displayed.
- the compositional formula data may be data indicating the compositional formula of a compound itself, and may indicate any content as long as it is related to the compositional formula, not limited to the compositional formula itself.
- the composition formula is indicated by the position information d40.
- a composition image f1 is displayed. Therefore, the user can easily grasp the composition formula. As a result, it is possible to improve the efficiency of material search, and appropriately support material development.
- the sixth image which is the first, second, or third image, is changed to the seventh image.
- the seventh image may be the fifth image.
- composition image f1 showing the composition formula is displayed, but the composition formula may include the coefficients of the elements as non-visualized variables.
- the invisible variables are displayed in various ways.
- FIG. 79 is a diagram showing an example of a composition image showing a composition formula including coefficients of elements as invisible variables.
- the seventh image includes an image map Mb of a compound having the composition formula "Li 2-3a-4b (Al 1-x Ga x ) a (Ti 1-y Zr y ) 1+b O c ".
- This composition formula includes the coefficient c of the element O as an invisible variable (that is, an unused variable).
- the first value described above is substituted for the coefficient c. Its first value is a constant.
- the image map Mb includes characteristic evaluation values for each of a plurality of compounds having the composition formula “Li 2-3a-4b (Al 1-x Ga x ) a (Ti 1-y Zr y ) 1+b O 3 ” is shown.
- the image processing unit 934 superimposes a composition image f11 identical to the composition image f1 on the image map Mb, as shown in FIG. 79(a). Note that when the first value is substituted for the coefficient c, no matter what position on the image map Mb is selected, the composition image superimposed on that position has the first value (that is, 3) is denoted as the coefficient c.
- the second value described above may be substituted for the coefficient c.
- the second value is a value that satisfies the condition that the characteristic evaluation value indicated at that position is the best value at each position on the image map Mb.
- the image processing unit 934 superimposes the composition image f12 on the image map Mb as shown in FIG. 79(b).
- the composition formula represented by this composition image f12 includes "3.1" as the coefficient c.
- the composition image f12 has the best characteristic evaluation value among the plurality of compounds having the composition formula “Li 1.0 Al 0.08 Ga 0.12 Ti 0.77 Zr 0.33 O c ”. It shows that the composition formula of the compound obtained contains the second value "3.1" as the coefficient c.
- the image processing unit 934 superimposes the composition image f13 on the image map Mb as shown in FIG. 79(c).
- composition formula represented by this composition image f12 includes "2.7" as the coefficient c. That is, the composition image f12 has the best characteristic evaluation value among the plurality of compounds having the composition formula “Li 1.0 Al 0.08 Ga 0.12 Ti 0.88 Zr 0.22 O c ”. It shows that the composition formula of the compound obtained contains the second value "2.7" as the coefficient c. Thus, when the second value is substituted for the coefficient c, different second values are displayed in the composition image according to the position selected on the image map Mb.
- each numerical value within the predetermined numerical range may be substituted for the coefficient c.
- each position indicated by the variables a, b, x, and y in the image map Mb indicates the average value of the property evaluation values of multiple compounds.
- Each of the plurality of compounds is represented by each numerical value substituted for the coefficient c of the composition formula “Li 2-3a-4b (Al 1-x Ga x ) a (Ti 1-y Zr y ) 1+b O c ” It has a compositional formula Variables a, b, x, and y included in the composition formula indicate values corresponding to positions on the image map Mb.
- the image processing unit 934 superimposes the composition image f14 on the image map Mb as shown in (d) of FIG.
- This composition image f14 shows the word "mean", which means arithmetic processing, instead of the coefficient c. That is, the composition image f14 indicates that the average value of the characteristic evaluation values based on the coefficients of the element O appears in the image map Mb.
- the image processing unit 934 superimposes the composition image f15 on the image map Mb, as shown in FIG. 79(e).
- This composition image f15 shows the numerical range used for calculating the average value of the characteristic evaluation values, that is, the numerical range “2.7-3.0” of each numerical value substituted for the coefficient c. Note that when each numerical value within a predetermined numerical range is substituted for the coefficient c, no matter what position is selected on the image map Mb, the composition image superimposed on that position will have "mean ” or its numerical range “2.7-3.0” is displayed.
- the characteristic evaluation value is selected by operating the mouse, but the characteristic predicted value may be selected, or the characteristic experimental value or experimental point may be selected. Even when a property predicted value, property experimental value, or experimental point is selected as a selection, a composition image showing a composition formula corresponding to the selection is superimposed on the image map Mb.
- a composition image showing a composition formula including the coefficient c used to calculate the property prediction value is superimposed.
- the selected item is the characteristic experimental value
- a composition image showing the composition formula of the compound having the characteristic experimental value is superimposed, and when the selected item is the experimental point, the compound image associated with the experimental point A composition image showing the composition formula is superimposed.
- the characteristic experimental value is superimposed on the map.
- a composition image showing the composition formula of a compound having the selected characteristic experimental value is superimposed on the map, as described above.
- the composition formula of the superimposed composition image may differ from the composition formula corresponding to the location of the characteristic experimental value on the map and the characteristic evaluation values surrounding it.
- the display method acquisition section 933 acquires the position information d40 indicating the position of the characteristic predicted value or the characteristic experimental value on the image map Mb. Then, the image processing unit 934 acquires composition formula data relating to the composition formula of the compound corresponding to the position indicated by the position information d40, and superimposes a composition image showing the composition formula data on the image map Mb.
- the formula data includes unused variables associated with compounds that have predicted or experimental properties. Note that the unused variables are variables other than the variables a, b, x, and y used for the coordinate axes of the image map Mb among the plurality of variables.
- the compositional formula data is data indicating, for example, the compositional formula included in the first compositional information d18 or the second compositional information d24.
- the display method acquisition unit 933 acquires the position information d40 indicating the position of the characteristic evaluation value or the characteristic experimental value by selecting the characteristic evaluation value or the characteristic experimental value by operating the mouse.
- the composition image including the non-utilized variable is superimposed on the image map Mb. Therefore, the unused variables can be easily grasped by viewing the displayed composition image.
- variables that are not included in the composition formula may be represented as non-visualized variables.
- Variables not included in the formula may be process variables in specific examples.
- FIG. 80 is a diagram showing an example of a composition image when process variables are used as non-visualized variables.
- the seventh image includes an image map Mb of a compound having the composition formula "Li 2-3a-4b (Al 1-x Ga x ) a (Ti 1-y Zr y ) 1+b O 3 ".
- this image map Mb three process variables, that is, the variable Pa indicating the firing method, the variable Pb indicating the firing time, and the variable Pc indicating the firing temperature, are used as non-visualized variables.
- the image processing unit 934 superimposes the composition image f16 on the image map Mb as shown in FIG.
- mouse selection in the examples of FIGS. 79 and 80 may be a mouse click, a click and hold, or a mouse over.
- the above selections may also be selected using an input device other than a mouse.
- FIG. 81 is a flow chart showing the processing operation of the display system 900 in this embodiment.
- Step S230 the display system 900 executes image generation processing. That is, the display system 900 executes each step shown in the flowchart of FIG. 71 in the embodiment 3B, or steps S211, S213, and S221 to S224 included in the flowchart in the image generation process in step S230. . Thereby, the first image, the second image or the third image is displayed as the sixth image.
- Step S241 the display method acquisition unit 933 of the characteristic display device 930 determines whether or not the position information d40 has been received from the input unit 110.
- the display method acquisition unit 933 determines that the position information d40 has not been received (No in step S241), the display system 900 terminates the processing regarding characteristic display.
- step S242 when the display method acquisition unit 933 determines that the position information d40 has been received (Yes in step S241), the first composition information d18 or the second composition information d24 is obtained from the evaluation display database 640a or the experiment display database 740a. to get For example, when the position of the selected characteristic evaluation value is indicated in the position information d40, the display method obtaining section 933 obtains the first composition information d18 from the evaluation display database 640a. Also, when the position of the selected characteristic experimental value is indicated in the position information d40, the display method acquisition unit 933 acquires the second composition information d24 from the experiment display database 740a.
- the display method acquisition unit 933 searches the composition formula of the compound having the selected characteristic evaluation value or characteristic experimental value from the first composition information d18 or the second composition information d24. Then, the image processing unit 934 generates a composition image f1 including the retrieved composition formula.
- Step S243 The image processing unit 934 generates the seventh image by superimposing the composition image f1 generated in step S242 on the image map Mb of the sixth image generated and displayed in step S230.
- Step S244 Image processing unit 934 displays the seventh image on display unit 140 by outputting the seventh image generated in step S ⁇ b>243 to display unit 140 .
- a map such as the image element map Ma or the image map Mb is generated, but instead of the image element map Ma, the image map Mb may be generated.
- An image element map Ma may be generated instead.
- the generated map may be a set of multiple image maps Mb.
- the experimental value acquiring unit 232, the experimental value acquiring unit 732, and the experimental point acquiring unit 635 acquire characteristic experimental values or experimental points of already-experimented compounds having configurations included in the search range. do.
- the experimental value acquiring unit 232, the experimental value acquiring unit 732, and the experimental point acquiring unit 635 obtain not only the search range, but also the characteristic experimental values of compounds that have been tested and have a configuration included in a range similar to the search range.
- experimental points may also be obtained.
- the experimental value acquiring unit 232, the experimental value acquiring unit 732, and the experimental point acquiring unit 635 acquire characteristic experimental values or experimental points for all compounds included in the experimental database 150 or 650 regardless of the search range. good too.
- predictor database 120 and the evaluator database 620 in each of the above embodiments may be updated based on the experimental results each time experimental results for a new compound are obtained. That is, predictor database 120 and evaluator database 620 may be updated each time experimental database 150 or 650 reflects new experimental results.
- the property prediction value, property experimental value, and property evaluation value are mainly indicated by the degree of color gradation.
- property predicted values, property experimental values, and property evaluated values may be indicated by color.
- the first information d10 or the second information d20 is changed.
- the characteristic display device displays the first information d10 or the second information d20 on the display unit 140, and the user performs an input operation on the input unit 110 while viewing the first information d10 or the second information d20.
- 2 information d20 may be changed.
- any one of the above embodiments 1A, 1B, 2A to 2C, and 3A to 3D may be combined with other embodiments.
- the display modes of maps and characteristic experimental values in Embodiments 1A and 1B may be applied to the display modes of characteristic evaluation values and characteristic experimental values in Embodiments 3A to 3D.
- the display modes of maps and characteristic experimental values in Embodiments 1A and 1B may be applied to the display modes of candidate points in Embodiments 2A to 2C. More specifically, in Embodiments 2A to 2C, the characteristic display device acquires the first display method information and the second display method information of Embodiment 1, and performs processing according to the information. good.
- the characteristic display device in each of the above embodiments is a part of the display system, it may include the entire configuration of the display system.
- the characteristic display device 230 shown in FIG. 13 may include the input section 110, the predictor database 120, the experiment database 150, and the like.
- the characteristic display device may comprise a plurality of processors.
- the characteristic display device may be configured as one computer device, or may be configured from a plurality of computer devices that are communicably connected to each other. In other words, the plurality of components included in the characteristic display device in each of the above embodiments may be distributed and arranged in different devices without being provided in one and the same device.
- each component may be configured with dedicated hardware or realized by executing a software program suitable for each component.
- Each component may be realized by reading and executing a software program recorded in a recording medium such as a hard disk or a semiconductor memory by a program execution unit such as a CPU or processor. 10, 23, 42, 48, at least Each step included in one flow chart may be executed by a processor.
- the display systems 100 to 900 described above may be specifically configured by a computer system including a microprocessor, ROM, RAM, hard disk drive, display unit, keyboard, mouse, and the like.
- a display program is stored in the RAM or hard disk drive.
- the display systems 100-900 achieve their functions by the microprocessor operating according to the display program.
- the display program is constructed by combining a plurality of instruction codes indicating instructions to the computer in order to achieve a predetermined function.
- a system LSI is an ultra-multifunctional LSI manufactured by integrating multiple components on a single chip. Specifically, it is a computer system that includes a microprocessor, ROM, RAM, etc. . A computer program is stored in the RAM. The system LSI achieves its functions by the microprocessor operating according to the computer program.
- IC card or module is a computer system composed of a microprocessor, ROM, RAM, and the like.
- the IC card or module may include the super multifunctional LSI.
- the IC card or module achieves its function by the microprocessor operating according to the computer program. This IC card or this module may have tamper resistance.
- the present disclosure may be a display method executed by the display systems 100 to 900 described above. Also, this display method may be implemented by a computer executing a display program, or may be implemented by a digital signal made up of a display program.
- the present disclosure may consist of a computer-readable non-transitory recording medium for the display program or the digital signal.
- recording media include flexible disks, hard disks, CD-ROMs, MOs, DVDs, DVD-ROMs, DVD-RAMs, BDs (Blu-ray (registered trademark) Discs), and semiconductor memories.
- the display program may be composed of the digital signal recorded on a non-temporary recording medium.
- the present disclosure may be configured by transmitting the display program or the digital signal via an electric communication line, a wireless or wired communication line, a network typified by the Internet, data broadcasting, or the like.
- the present disclosure may also be a computer system comprising a microprocessor and memory, the memory storing a display program, and the microprocessor operating according to the display program.
- the display system may consist of a server and a terminal owned by a user connected to the server via a network.
- the present disclosure has the effect of being able to display information on the properties of multiple compounds in an easy-to-understand manner, and is useful for devices and systems for developing materials.
Abstract
Description
近年、画像認識および自然言語処理などの分野において、機械学習等による認識および識別方法が、著しい進歩を遂げており、材料特性の予測にも応用され始めている。 (Knowledge leading to this disclosure)
In recent years, in fields such as image recognition and natural language processing, recognition and identification methods based on machine learning have made remarkable progress, and are beginning to be applied to prediction of material properties.
本実施の形態における表示システムは、複数の化合物のそれぞれの特性予測値をマップの形態で表示する。 (Embodiment 1A)
The display system according to the present embodiment displays the property prediction values of each of a plurality of compounds in the form of a map.
図1は、本実施の形態における表示システム100の構成の一例を示すブロック図である。図1に示す表示システム100は、入力部110と、予測器データベース(DB)120と、特性表示装置130と、表示部140とを備える。なお、特性表示装置130は、情報表示装置の一例である。 [Configuration of display system 100]
FIG. 1 is a block diagram showing an example of the configuration of a
入力部110は、ユーザによる入力操作を受け付け、その入力操作に応じた入力信号を特性表示装置130に出力する。例えば、入力部110は、例えばキーボード、タッチセンサ、タッチパッドまたはマウスなどとして構成されていてもよい。 [Input unit 110]
The
予測器データベース120は、例えばコンピュータプログラムである予測器を格納している記録媒体である。具体的には、予測器データベース120は、複数の化合物のそれぞれの特性値を予測するための予測器を記憶している。予測される特性値は、例えば、電気伝導度、熱伝導率、バンドギャップなどであって、以下、特性予測値とも呼ばれる。また、予測器は、所定の計算アルゴリズムに基づくコンピュータプログラムである。所定の計算アルゴリズムは、機械学習によって得られるアルゴリズムであってもよい。予測器データベース120は、例えば不揮発性のメモリで構成される。予測器は、化合物に関するデータの入力に対して、その化合物の特性値を出力する。そのデータは、例えば化合物の組成式である。 [Predictor database 120]
The
表示部140は、特性表示装置130から画像を取得し、その画像を表示する。このような表示部140は、例えば、液晶ディスプレイ、プラズマディスプレイ、有機EL(Electro-Luminescence)ディスプレイなどであるが、これらに限定されない。 [Display unit 140]
The
特性表示装置130は、入力部110から入力信号を取得し、その入力信号に応じた複数の化合物の特性値を、予測器データベース120の予測器を用いて予測する。さらに、特性表示装置130は、入力部110から表示方法を示す入力信号を第1表示方法情報として取得し、その表示方法にしたがって、各化合物の予測された特性値を特性予測値として示す画像を生成する。そして、特性表示装置130は、その生成された画像を表示部140に出力する。 [Characteristic display device 130]
The
特性表示装置130は、探索範囲取得部131と、予測値取得部132と、表示方法取得部133と、画像処理部134とを備える。なお、特性表示装置130は、例えば中央演算処理装置(CPU:Central Processing Unit)などのプロセッサとメモリとから構成されていてもよい。この場合、プロセッサは、例えばメモリに格納されているコンピュータプログラムを実行することによって、特性表示装置130として機能する。なお、メモリは、揮発性であっても不揮発性であってもよく、揮発性のメモリと不揮発性のメモリとから構成されていてもよい。 [Configuration of characteristic display device 130]
The
探索範囲取得部131は、入力部110から化合物の探索範囲を示す入力信号を取得する。そして、探索範囲取得部131は、その入力信号を探索範囲信号として予測値取得部132に出力する。化合物の探索範囲とは、特性値の予測対象とされる各化合物の組成式、構成などの範囲である。本実施の形態では、その予測対象とされる化合物は固体電解質であり、その化合物の組成式は、例えば以下の(式1)で示される。 [Search range acquisition unit 131]
The search
M3’∈{La,Al,Ga,In}
M4∈{Ti,Zr,Hf}
M4’∈{Ti,Zr,Hf}
a∈{0.0, 0.05, 0.1, 0.15, 0.2}
b∈{0.0, 0.1, 0.2, 0.3}
x∈{0.0, 0.1, 0.2, 0.3, 0.4, 0.5, 0.6, 0.7, 0.8, 0.9, 1.0}
y∈{0.0, 0.1, 0.2, 0.3, 0.4, 0.5, 0.6, 0.7, 0.8, 0.9, 1.0} M3∈{La, Al, Ga, In}
M3'∈{La, Al, Ga, In}
M4∈{Ti, Zr, Hf}
M4'∈{Ti, Zr, Hf}
a∈{0.0, 0.05, 0.1, 0.15, 0.2}
b∈{0.0, 0.1, 0.2, 0.3}
x ∈ {0.0, 0.1, 0.2, 0.3, 0.4, 0.5, 0.6, 0.7, 0.8, 0.9, 1.0}
y ∈ {0.0, 0.1, 0.2, 0.3, 0.4, 0.5, 0.6, 0.7, 0.8, 0.9, 1.0}
予測値取得部132は、探索範囲取得部131から探索範囲信号を取得する。そして、予測値取得部132は、その探索範囲信号によって示される探索範囲に含まれる複数の変数のそれぞれが取り得る選択肢データの全ての組み合わせを生成する。その組み合わせによって化合物の組成式が表現される。したがって、それらの組み合わせに応じた複数の組成式または構成が生成される。 [Predicted value acquisition unit 132]
The predicted
表示方法取得部133は、入力部110から表示方法を示す入力信号を第1表示方法情報として取得する。そして、表示方法取得部133は、その第1表示方法情報を画像処理部134に出力する。第1表示方法情報によって示される表示方法は、各組成式によって示される化合物の特性予測値を表示する方法である。 [Display method acquisition unit 133]
The display
画像処理部134は、予測値取得部132から、複数の化合物のそれぞれについて、その化合物の組成式および特性予測値を取得する。さらに、画像処理部134は、表示方法取得部133から第1表示方法情報を取得する。画像処理部134は、その第1表示方法情報によって示される表示方法にしたがって複数の化合物の特性予測値を示すマップを生成し、そのマップを含む画像を表示部140に表示する。 [Image processing unit 134]
The
図5A~図5Cは、マップの一例を示す図である。 [Specific example of map]
5A to 5C are diagrams showing examples of maps.
図10は、本実施の形態における表示システム100の処理動作を示すフローチャートである。 [Processing operation]
FIG. 10 is a flow chart showing processing operations of the
まず、探索範囲取得部131は、ユーザによる入力部110への入力操作に応じて、入力部110から出力される探索範囲信号を取得する。この探索範囲信号は、例えば図2に示すような化合物の探索範囲を示す入力信号である。つまり、探索範囲取得部131は、探索範囲を取得する。そして、探索範囲取得部131は、その探索範囲信号を予測値取得部132に出力する。 (Step S111)
First, the search
予測値取得部132は、その探索範囲信号を探索範囲取得部131から取得し、その探索範囲信号によって示される探索範囲にしたがって、複数の変数のそれぞれの選択肢データを組み合わせる。例えば、探索範囲内で可能な全ての組み合わせが生成される。そして、予測値取得部132は、複数の化合物のそれぞれの組成式、すなわち組み合わせを、予測器データベース120の予測器に入力することによって、それらの化合物の特性予測値を取得する。予測値取得部132は、それらの化合物の特性予測値と、その化合物の組成式とを関連付けて画像処理部134に出力する。 (Step S112)
The predicted
表示方法取得部133は、ユーザによる入力部110への入力操作に応じてその入力部110から出力される第1表示方法情報を取得する。この第1表示方法情報は、例えば図5A~図9Bに示すような特性予測値の表示方法を示す。そして、表示方法取得部133は、その第1表示方法情報を画像処理部134に出力する。 (Step S113)
The display
画像処理部134は、予測値取得部132から、複数の化合物のそれぞれについて、その化合物の特性予測値および組成式を取得し、表示方法取得部133から第1表示方法情報を取得する。そして、画像処理部134は、その第1表示方法情報によって示される表示方法にしたがって、複数の化合物のそれぞれの特性予測値を示すマップMaを生成し、そのマップMaを含む画像を表示部140に出力する。 (Step S114)
The
表示部140は、画像処理部134から画像を取得し、その画像を表示する。 (Step S115)
The
上記実施の形態では、マップMaの座標軸には、変数x、yが用いられ、変数a、bは用いられていない。本変形例における画像処理部134は、変数x、yだけでなく、変数a、bも座標軸に用いてマップを生成する。 (
In the above embodiment, the coordinate axes of the map Ma use the variables x and y and do not use the variables a and b. The
上記実施の形態における複数の範囲変数には、カテゴリ変数M3、M3’、M4、M4’と、離散変数a、bと、連続変数x、yとが含まれるが、他の変数が含まれてもよい。本変形例における複数の範囲変数には、上述の各変数だけでなく、例えば、化合物の生成のプロセスに用いられる条件を示す1つ以上のプロセス変数が含まれる。 (
The plurality of range variables in the above embodiment includes categorical variables M3, M3', M4, M4', discrete variables a, b, and continuous variables x, y, but also includes other variables. good too. The plurality of range variables in this modification includes not only each of the variables described above, but also one or more process variables that indicate conditions used in the process of producing a compound, for example.
本実施の形態における表示システムは、実施の形態1Aと同様、複数の化合物のそれぞれの特性予測値をマップの形態で表示するとともに、1つ以上の化合物のそれぞれの特性実験値をそのマップに重畳する。なお、本実施の形態における各構成要素のうち、実施の形態1Aと同一の構成要素については、実施の形態1Aと同一の符号を付し、詳細な説明を省略する。 (Embodiment 1B)
As in Embodiment 1A, the display system in the present embodiment displays the predicted property values of each of a plurality of compounds in the form of a map, and superimposes the experimental property values of one or more compounds on the map. do. It should be noted that among the constituent elements in this embodiment, the constituent elements that are the same as those in Embodiment 1A are assigned the same reference numerals as those in Embodiment 1A, and detailed description thereof will be omitted.
図13は、本実施の形態における表示システム200の構成の一例を示すブロック図である。図13に示す表示システム200は、入力部110と、予測器データベース120と、特性表示装置230と、表示部140と、実験データベース(DB)150とを備える。なお、特性表示装置230は、情報表示装置の一例である。 [Configuration of display system 200]
FIG. 13 is a block diagram showing an example of the configuration of
実験データベース150は、化合物の組成式(すなわち化学式)、その化合物の化合物識別情報、および、その化合物の特性実験値を示す実験データを格納している記録媒体である。なお、この記録媒体は、例えば、ハードディスクドライブ、RAM(Random Access Memory)、ROM(Read Only Memory)、または半導体メモリなどである。また、その記録媒体は、揮発性であっても不揮発性であってもよい。探索範囲にプロセス変数が含まれる場合は、その実験データには、実験で用いられたプロセス条件を示す実験プロセス情報も予め含められていてもよい。 [Experimental database 150]
The
実験値取得部232は、実験済みの1つ以上の化合物のそれぞれの構成および特性実験値を実験データベース150から取得する。構成は、化合物の組成式であってもよく、その組成式およびプロセス条件であってもよい。例えば、実験値取得部232は、探索範囲取得部131から探索範囲を取得し、その探索範囲に含まれる構成を有する化合物の特性実験値を、その構成と共に取得する。実験値取得部232は、その1つ以上の化合物のそれぞれの構成および特性実験値を画像処理部234に出力する。 [Experimental value acquisition unit 232]
The experimental
表示方法取得部133は、入力部110から、特性予測値の表示方法を示す第1表示方法情報と、特性実験値の表示方法を示す第2表示方法情報とを取得する。そして、表示方法取得部133は、その第1表示方法情報および第2表示方法情報を画像処理部234に出力する。 [Display method acquisition unit 133]
The display
画像処理部234は、予測値取得部132から、複数の化合物のそれぞれの構成および特性予測値を取得し、実験値取得部232から、1種以上の化合物のそれぞれの構成および特性実験値を取得する。さらに、画像処理部234は、表示方法取得部133から第1表示方法情報および第2表示方法情報を受ける。画像処理部234は、その第1表示方法情報によって示される表示方法にしたがって複数の化合物の特性予測値を示すマップを生成する。さらに、画像処理部234は、1つ以上の化合物のそれぞれの特性実験値を、その化合物が有する構成に対応するマップ上の位置に重畳する。このとき、画像処理部234は、第2表示方法情報によって示される表示方法にしたがって特性実験値をマップ上に重畳する。そして、画像処理部234は、その1つ以上の化合物の特性実験値が重畳されたマップを含む画像を表示部140に出力する。なお、マップは、画像要素マップMaであってもよく、画像マップMbであってもよい。 [Image processing unit 234]
The
表示部140は、画像処理部234から画像を取得し、その画像、すなわち、1つ以上の化合物の特性実験値が重畳されたマップを含む画像を表示する。 [Display unit 140]
The
図15は、マップの一例を示す図である。 [Specific example of map]
FIG. 15 is a diagram showing an example of a map.
図23は、本実施の形態における表示システム200の処理動作を示すフローチャートである。 [Processing operation]
FIG. 23 is a flow chart showing the processing operation of the
実験値取得部232は、実験データベース150から、各化合物の構成および特性実験値を取得し、画像処理部234に出力する。なお、実験データベース150において、各化合物の構成および特性実験値に、プロセス条件、解析情報などが関連付けられていれば、実験値取得部232は、そのプロセス条件、解析情報なども特性実験値と共に取得して、画像処理部234に出力してもよい。 (Step S121)
The experimental
表示方法取得部133は、ステップS113と同様、ユーザによる入力部110への入力操作に応じてその入力部110から出力される第2表示方法情報を取得する。この第2表示方法情報は、例えば図15~図22Cに示すような特性実験値の表示方法を示す情報である。そして、表示方法取得部133は、その第2表示方法情報を画像処理部234に出力する。 (Step S122)
The display
画像処理部234は、予測値取得部132から、複数の化合物のそれぞれについて、その化合物の特性予測値および構成を取得し、表示方法取得部133から第1表示方法情報を受ける。そして、画像処理部234は、その第1表示方法情報にしたがって、複数の化合物のそれぞれの特性予測値を示すマップを生成する。なお、マップは、画像要素マップMaであってもよく、画像マップMbであってもよい。さらに、画像処理部234は、実験値取得部232から、1つ以上の化合物のそれぞれの特性実験値および構成を取得し、表示方法取得部133から第2表示方法情報を受ける。そして、画像処理部234は、その第2表示方法情報にしたがって、1つ以上の化合物のそれぞれの特性実験値をマップに重畳する。これにより、1つ以上の化合物の特性実験値が重畳されたマップが生成される。画像処理部234は、その1つ以上の化合物の特性実験値が重畳されたマップを含む画像を表示部140に出力する。 (Step S123)
The
表示部140は、画像処理部234から画像を取得し、その画像、すなわち、1つ以上の化合物の特性実験値が重畳されたマップを含む画像を表示する。 (Step S124)
The
画像処理部234は、実施の形態1Aの変形例1のように画像マップMbを生成し、その画像マップMbに特性実験値を重畳してもよい。なお、画像マップMbは、複数の画像要素マップMaの配列からなるマップである。 (Modification of Embodiment 1B)
The
本実施の形態における表示システムは、実施の形態1Aと同様、複数の化合物のそれぞれの特性予測値をマップの形態で表示するとともに、1つ以上の候補点をそのマップに重畳する。候補点は、今後の実験に用いられる化合物の候補(すなわち候補化合物)の構成を示す点である。なお、本実施の形態における各構成要素のうち、実施の形態1Aおよび1Bと同一の構成要素については、実施の形態1Aおよび1Bと同一の符号を付し、詳細な説明を省略する。 (Embodiment 2A)
As in Embodiment 1A, the display system according to the present embodiment displays property prediction values of a plurality of compounds in the form of a map, and superimposes one or more candidate points on the map. A candidate point is a point that indicates the configuration of a compound candidate (that is, a candidate compound) to be used in future experiments. Among the components in this embodiment, the same components as those in Embodiments 1A and 1B are given the same reference numerals as those in Embodiments 1A and 1B, and detailed descriptions thereof are omitted.
図25は、本実施の形態における表示システム300の構成の一例を示すブロック図である。図25に示す表示システム300は、入力部110と、予測器データベース120と、特性表示装置330と、表示部140と、実験データベース150とを備える。なお、特性表示装置330は、情報表示装置の一例である。 [Configuration of display system 300]
FIG. 25 is a block diagram showing an example of the configuration of
本実施の形態における予測値取得部132は、複数の化合物のそれぞれについて、その化合物の構成と、その構成に対して取得された特性予測値とを関連付けて画像処理部334に出力するとともに、その構成および特性予測値を候補点決定部331にも出力する。なお、化合物の構成は、化合物の組成式であってもよく、探索範囲に当該化合物を生成するためのプロセス条件が含まれる場合には、化合物の構成は、化合物の組成式およびプロセス条件であってもよい。プロセス条件は、例えば、焼成方法、焼成時間、焼成温度等を含む。 [Predicted value acquisition unit 132]
The predicted
本実施の形態における実験値取得部232は、実験済みの1つ以上の化合物のそれぞれの構成および特性実験値を実験データベース150から取得する。そして、実験値取得部232は、その実験済みの1つ以上の化合物のそれぞれについて、取得された構成および特性実験値を候補点決定部331に出力する。 [Experimental value acquisition unit 232]
The experimental
表示方法取得部133は、入力部110から、候補点の表示方法を示す第3表示方法情報を取得する。そして、表示方法取得部133は、その第3表示方法情報を候補点決定部331および画像処理部334に出力する。 [Display method acquisition unit 133]
The display
候補点決定部331は、予測値取得部132から化合物の構成および特性予測値を取得し、実験値取得部232から化合物の構成および特性実験値を取得する。さらに、候補点決定部331は、表示方法取得部133から第3表示方法情報を取得する。そして、候補点決定部331は、その第3表示方法情報にしたがって、画像要素マップMa上の全ての位置から、1つ以上の位置をそれぞれ候補点として決定する。このとき、候補点決定部331は、画像要素マップMa上の各位置に示される特性予測値に基づいて、候補点を決定する。または、候補点決定部331は、その各位置に示される特性予測値と、実験済みの1つ以上の化合物のそれぞれの構成に対応する画像要素マップMa上の位置、すなわち特性実験値の位置とに基づいて、候補点を決定する。 [Candidate point determination unit 331]
The candidate
画像処理部334は、実施の形態1Aと同様に、画像要素マップMaを生成する。さらに、画像処理部334は、表示方法取得部133から第3表示方法情報を取得し、その第3表示方法情報にしたがって、候補点決定部331によって決定された1つ以上の候補点をその画像要素マップMaに重畳する。つまり、画像処理部334は、その1つ以上の候補点のそれぞれを示すマークを画像要素マップMaに重畳する。そして、画像処理部334は、その1つ以上の候補点が重畳された画像要素マップMaを含む画像を表示部140に出力する。 [Image processing unit 334]
表示部140は、画像処理部334から画像を取得し、その画像、すなわち、その1つ以上の候補点が重畳された画像要素マップMaを含む画像を表示する。 [Display unit 140]
The
図26は、候補点が重畳された画像要素マップMaの一例を示す図である。 [Specific example of map]
FIG. 26 is a diagram showing an example of an image element map Ma on which candidate points are superimposed.
図33は、本実施の形態における表示システム300の処理動作を示すフローチャートである。 [Processing operation]
FIG. 33 is a flow chart showing the processing operation of the
表示方法取得部133は、ステップS113と同様、ユーザによる入力部110への入力操作に応じてその入力部110から出力される第3表示方法情報を取得する。この第3表示方法情報は、例えば図26~図32に示すような候補点の表示方法を示す情報である。そして、表示方法取得部133は、その第3表示方法情報を候補点決定部331および画像処理部334に出力する。 (Step S131)
The display
候補点決定部331は、予測値取得部132から複数の化合物のそれぞれの構成および特性予測値を取得し、実験値取得部232から1つ以上の化合物のそれぞれの構成および特性実験値を取得する。さらに、候補点決定部331は、表示方法取得部133から第3表示方法情報を取得する。そして、候補点決定部331は、その第3表示方法情報にしたがって、その複数の化合物のそれぞれの構成および特性予測値と、1つ以上の化合物のそれぞれの構成および特性実験値とに基づいて、1つ以上の候補点を決定する。 (Step S132)
The candidate
画像処理部334は、予測値取得部132から、複数の化合物のそれぞれについて、その化合物の構成および特性予測値を取得する。さらに、画像処理部334は、候補点決定部331から1つ以上の候補点を取得する。また、画像処理部334は、表示方法取得部133から第3表示方法情報を取得する。なお、画像処理部334は、実施の形態1Aと同様に、表示方法取得部133から特性予測値の表示方法を示す第1表示方法情報を受けてもよい。 (Step S133)
The
表示部140は、画像処理部334からその画像を取得し、その画像、すなわち、1つ以上の候補点が重畳された画像要素マップMaを含む画像を表示する。 (Step S134)
The
画像処理部334は、実施の形態1Aの変形例1のように画像マップMbを生成し、その画像マップMbに候補点を重畳してもよい。なお、画像マップMbは、複数のマップMaの配列からなるマップである。 (Modification of Embodiment 2A)
The
本実施の形態における表示システムは、実施の形態2Aと同様、複数の化合物のそれぞれの特性予測値を示すマップを生成し、そのマップに候補点を重畳するとともに、さらに、1つ以上の化合物のそれぞれの特性実験値もそのマップに重畳する。なお、本実施の形態における各構成要素のうち、実施の形態2Aと同一の構成要素については、実施の形態2Aと同一の符号を付し、詳細な説明を省略する。また、本実施の形態におけるマップは、画像要素マップMaであるが、画像マップMbであってもよい。 (Embodiment 2B)
As in Embodiment 2A, the display system according to the present embodiment generates a map indicating the property prediction value of each of a plurality of compounds, superimposes the candidate points on the map, and further adds one or more compounds. Each characteristic experimental value is also superimposed on the map. It should be noted that among the constituent elements in this embodiment, the constituent elements that are the same as those in Embodiment 2A are given the same reference numerals as in Embodiment 2A, and detailed description thereof will be omitted. Also, the map in the present embodiment is the image element map Ma, but may be the image map Mb.
図37は、本実施の形態における表示システム400の構成の一例を示すブロック図である。図37に示す表示システム400は、入力部110と、予測器データベース120と、特性表示装置430と、表示部140と、実験データベース150とを備える。なお、特性表示装置430は、情報表示装置の一例である。 [Configuration of display system 400]
FIG. 37 is a block diagram showing an example of the configuration of
本実施の形態における実験値取得部232は、実験済みの1つ以上の化合物のそれぞれの構成および特性実験値を実験データベース150から取得する。そして、実験値取得部232は、その実験済みの1つ以上の化合物のそれぞれについて、取得された構成および特性実験値を候補点決定部331に出力するとともに、画像処理部434にも出力する。 [Experimental value acquisition unit 232]
The experimental
画像処理部434は、実施の形態2Aと同様に、画像要素マップMaを生成する。また、画像処理部434は、実施の形態2Aと同様に、表示方法取得部133から第3表示方法情報を取得し、その第3表示方法情報にしたがって、候補点決定部331によって決定された1つ以上の候補点をその画像要素マップMaに重畳する。さらに、画像処理部434は、実験値取得部232から、実験済みの1つ以上の化合物のそれぞれの構成および特性実験値を取得する。そして、画像処理部434は、その実験済みの1つ以上の化合物のそれぞれの特性実験値を画像要素マップMaに重畳する。この化合物の特性実験値の重畳では、画像処理部434は、その化合物が有する構成に対応する画像要素マップMa上の位置に、その化合物の特性実験値を重畳する。つまり、画像処理部434は、特性実験値を示すマークを画像要素マップMaに重畳する。そして、画像処理部434は、実験済みの1つ以上の化合物の特性実験値および1つ以上の候補点が重畳された画像要素マップMaを含む画像を表示部140に出力する。 [Image processing unit 434]
The
図38は、候補点および特性実験値が重畳された画像要素マップMaの一例を示す図である。 [Specific example of map]
FIG. 38 is a diagram showing an example of an image element map Ma on which candidate points and characteristic experimental values are superimposed.
図42は、本実施の形態における表示システム400の処理動作を示すフローチャートである。 [Processing operation]
FIG. 42 is a flow chart showing the processing operation of the
画像処理部434は、予測値取得部132から、複数の化合物のそれぞれの構成および特性予測値を取得する。さらに、画像処理部434は、候補点決定部331から1つ以上の候補点を取得する。さらに、画像処理部434は、実験値取得部232から、実験済みの1つ以上の化合物のそれぞれの構成および特性実験値を取得する。また、画像処理部434は、第3表示方法情報を表示方法取得部133から受ける。 (Step S141)
The
表示部140は、画像処理部434から画像を取得し、その画像、すなわち、1つ以上の候補点および特性実験値が重畳された画像要素マップMaを含む画像を表示する。 (Step S142)
The
本変形例における表示システムは、特性表示装置430によって生成された画像、すなわち、1つ以上の候補点および特性実験値が重畳された画像要素マップMaを含む画像を保存して表示する機能を有する。なお、本変形例における各構成要素のうち、実施の形態2Bと同一の構成要素については、実施の形態2Bと同一の符号を付し、詳細な説明を省略する。 (Modification of Embodiment 2B)
The display system in this modification has a function of storing and displaying an image generated by the
図43は、本変形例における表示システム401の構成の一例を示すブロック図である。図43に示す表示システム401は、実施の形態2Bにおける表示システム400が有する全ての構成要素と、画像格納部410とを備える。 [Configuration of display system 401]
FIG. 43 is a block diagram showing an example of the configuration of the
画像格納部410は、画像処理部434によって生成された、1つ以上の候補点および特性実験値が重畳された画像要素マップMaを含む画像を特性表示画像として格納するための記録媒体である。この記録媒体は、例えば、ハードディスクドライブ、RAM、ROM、または半導体メモリなどである。また、その記録媒体は、揮発性であっても不揮発性であってもよい。 [Image storage unit 410]
The
本変形例における画像処理部434は、実施の形態2Bと同様、特性表示画像を生成するとともに、その生成された特性表示画像を画像格納部410に格納する。このとき、画像処理部434は、特性表示画像に対して、その特性表示画像が生成された日付を示す日付情報を付加してもよく、その特性表示画像の生成に用いられた探索範囲などを参考情報として付加してもよい。 [Image processing unit 434]
図44は、特性表示画像の履歴の一例を示す図である。 [Specific example of history list image]
FIG. 44 is a diagram showing an example of a history of characteristic display images.
本実施の形態における表示システムは、実施の形態2Bと同様、複数の化合物のそれぞれの特性予測値を示すマップを生成し、そのマップに候補点および特性実験値を重畳する。ここで、本実施の形態における特性表示装置は、その候補点を特性予測値などから決定することなく、データベースから取得する。なお、本実施の形態における各構成要素のうち、実施の形態2Aおよび2Bと同一の構成要素については、実施の形態2Aおよび2Bと同一の符号を付し、詳細な説明を省略する。また、本実施の形態におけるマップは、画像要素マップMaであるが、画像マップMbであってもよい。 (Embodiment 2C)
As in Embodiment 2B, the display system according to the present embodiment generates a map showing property predicted values for each of a plurality of compounds, and superimposes candidate points and property experimental values on the map. Here, the characteristic display device according to the present embodiment acquires the candidate points from the database without determining the candidate points from characteristic predicted values or the like. Among the components in this embodiment, the same components as in Embodiments 2A and 2B are assigned the same reference numerals as those in Embodiments 2A and 2B, and detailed descriptions thereof are omitted. Also, the map in the present embodiment is the image element map Ma, but may be the image map Mb.
図45は、本実施の形態における表示システム500の構成の一例を示すブロック図である。図45に示す表示システム500は、入力部110と、予測器データベース120と、特性表示装置530と、表示部140と、実験データベース150と、候補点データベース(DB)510とを備える。なお、特性表示装置530は、情報表示装置の一例である。 [Configuration of display system 500]
FIG. 45 is a block diagram showing an example of the configuration of
候補点取得部531は、例えば、探索範囲取得部131から探索範囲信号を取得する。そして、候補点取得部531は、その探索範囲信号によって示される探索範囲に含まれる構成を有する1つ以上の化合物を候補点データベース510から検索する。候補点取得部531は、その検索によって見つけ出された化合物の構成を候補点として候補点データベース510から取得し、その候補点を画像処理部534に出力する。 [Candidate point acquisition unit 531]
The candidate point acquisition unit 531 acquires the search range signal from the search
画像処理部534は、予測値取得部132から、複数の化合物のそれぞれの構成および特性予測値を取得し、実験値取得部232から、実験済みの1つ以上の化合物のそれぞれの構成および特性実験値を取得する。また、画像処理部534は、候補点取得部531から1つ以上の候補点を取得し、表示方法取得部133から第3表示方法情報を受ける。画像処理部534は、複数の化合物の特性予測値を示す画像要素マップMaを生成し、その画像要素マップMaに対して、実験済みの1つ以上の化合物のそれぞれの特性実験値を重畳する。さらに、画像処理部534は、第3表示方法情報にしたがって、1つ以上の候補点を画像要素マップMaに重畳する。そして、画像処理部534は、1つ以上の化合物の特性実験値および1つ以上の候補点が重畳された画像要素マップMaを含む画像を表示部140に出力する。 [Image processing unit 534]
The
候補点データベース510は、複数の化合物のそれぞれの構成などを示す候補点データを格納している。 [Candidate point database 510]
The
図47は、候補点および特性実験値が重畳された画像要素マップMaの一例を示す図である。 [Specific example of map]
FIG. 47 is a diagram showing an example of an image element map Ma on which candidate points and characteristic experimental values are superimposed.
図48は、本実施の形態における表示システム500の処理動作を示すフローチャートである。 [Processing operation]
FIG. 48 is a flow chart showing the processing operation of
候補点取得部531は、候補点データベース510の候補点データから、1つ以上の候補点のそれぞれと、その候補点に関連付けられている管理番号とを取得する。そして、候補点取得部531は、その取得された1つ以上の候補点およびそれらの管理番号を画像処理部534に出力する。 (Step S151)
Candidate point acquisition section 531 acquires each of one or more candidate points and the management number associated with the candidate point from the candidate point data of
画像処理部534は、予測値取得部132から、複数の化合物のそれぞれの化合物の構成および特性予測値を取得する。さらに、画像処理部534は、候補点取得部531から1つ以上の候補点およびそれらの管理番号を取得する。さらに、画像処理部534は、実験値取得部232から、実験済みの1つ以上の化合物のそれぞれの構成および特性実験値を取得する。また、画像処理部534は、第3表示方法情報を表示方法取得部133から受ける。 (Step S152)
The
表示部140は、画像処理部534から画像を取得し、その画像、すなわち、1つ以上の候補点、参照画像a1および特性実験値が重畳された画像要素マップMaを表示する。 (Step S153)
The
本実施の形態における表示システムは、実施の形態1および2において用いられた、複数の化合物のそれぞれの特性予測値の代わりに、それらの化合物の特性評価値をマップの形態で表示する。なお、特性評価値は、マップ上の各位置に対応する構成を有する化合物の特性に対する評価値であって、化合物の特性に関する実験の指標として扱われる。このような特性評価値は、選択される算出方法に応じた値を示す。したがって、その算出方法が、実施の形態1および2の特性予測値を取得するための算出方法に等しい場合には、本実施の形態における表示システムは、実施の形態1および2と同様、特性評価値として特性予測値をマップの形態で表示する。さらに、本実施の形態における表示システムは、実験済みの1つ以上の化合物のそれぞれの構成を実験点としてそのマップに重畳する。また、本実施の形態における表示システムは、上述のマップを含む画像を第1画像として表示し、特性評価値の表示方法が変更されると、その第1画像を第2画像に変更する。 (Embodiment 3A)
The display system according to the present embodiment displays the characteristic evaluation values of a plurality of compounds in the form of a map instead of the respective characteristic predicted values of the compounds used in the first and second embodiments. Note that the property evaluation value is an evaluation value for the property of a compound having a configuration corresponding to each position on the map, and is treated as an experimental index for the property of the compound. Such a characteristic evaluation value indicates a value according to the selected calculation method. Therefore, when the calculation method is the same as the calculation method for obtaining the characteristic predicted value in the first and second embodiments, the display system in the present embodiment can perform characteristic evaluation as in the first and second embodiments. The property prediction values are displayed in the form of a map as values. Furthermore, the display system according to the present embodiment superimposes each configuration of one or more compounds that have been tested on the map as experimental points. Further, the display system according to the present embodiment displays the image including the map as the first image, and changes the first image to the second image when the display method of the characteristic evaluation values is changed.
図49は、本実施の形態における表示システム600の構成の一例を示すブロック図である。図49に示す表示システム600は、入力部110と、評価器データベース(DB)620と、特性表示装置630と、表示部140と、評価表示データベース(DB)640と、実験データベース650とを備える。なお、特性表示装置630は、情報表示装置の一例である。 [Configuration of display system 600]
FIG. 49 is a block diagram showing an example of the configuration of
表示方法取得部633は、入力部110から入力信号を取得し、その入力信号に応じて、特性評価値の表示方法に関する第1情報d10を評価表示データベース640から取得する。そして、表示方法取得部633は、その第1情報d10を評価値取得部632、実験点取得部635および画像処理部634に出力する。これにより、その第1情報d10によって示される表示方法にしたがったマップを含む画像が第1画像として表示部140に表示される。 [Display method acquisition unit 633]
The display
評価値取得部632は、表示方法取得部633から第1情報d10を取得する。そして、評価値取得部632は、その第1情報d10によって示される探索範囲に含まれる複数の変数のそれぞれが取り得る選択肢データの全ての組み合わせを生成する。その組み合わせによって化合物の構成(例えば組成式)が表現される。したがって、それらの組み合わせに応じた複数の構成が生成される。 [Evaluation value acquisition unit 632]
The evaluation
実験点取得部635は、表示方法取得部633から第1情報d10を取得する。そして、実験点取得部635は、その第1情報d10によって示される探索範囲に対応する実験済みの1つ以上の化合物のそれぞれの構成を実験データベース650から取得し、その1つ以上の化合物のそれぞれの構成を実験点として画像処理部634に出力する。なお、実験点取得部635は、その探索範囲に関わらず、実験データベース650に格納されている全ての化合物の構成をそれぞれ実験点として取得してもよい。 [Experimental point acquisition unit 635]
The experimental
画像処理部634は、評価値取得部632から、複数の化合物のそれぞれの特性評価値を取得し、実験点取得部635から、実験済みの1つ以上の化合物のそれぞれの実験点を取得する。さらに、画像処理部634は、表示方法取得部633から第1情報d10を受ける。画像処理部634は、その第1情報d10にしたがって複数の化合物の特性評価値を示すマップを生成し、さらに、実験点取得部635によって取得された1つ以上の実験点をマップに重畳する。なお、特性評価値を示すマップの生成では、画像処理部634は、複数の化合物のそれぞれについて、その化合物の特性評価値に応じた濃淡度の色を、その化合物の構成に対応するマップ上の位置に付ける。その特性評価値に応じた濃淡度の色は、特性評価値に応じた色であってもよい。また、実験点の重畳では、画像処理部634は、実験済みの1つ以上の化合物のそれぞれについて、その化合物の実験点に対応するマップ上の位置に、黒円形のマークを重畳する。画像処理部634は、このように1つ以上の実験点が重畳されたマップを含む画像を、第1画像または第2画像として表示部140に出力する。 [Image processing unit 634]
The
評価器データベース620は、化合物の特性値を評価するための少なくとも1つの評価器を格納している記録媒体である。この記録媒体は、例えば、ハードディスクドライブ、RAM、ROM、または半導体メモリなどである。また、その記録媒体は、揮発性であっても不揮発性であってもよい。 [Evaluator database 620]
The
評価表示データベース640は、特性評価値の表示方法に関する情報を格納している記録媒体である。この記録媒体は、例えば、ハードディスクドライブ、RAM、ROM、または半導体メモリなどである。また、その記録媒体は、揮発性であっても不揮発性であってもよい。 [Evaluation display database 640]
The
図51は、実験データベース650に格納されている各データの一例を示す図である。 [Experimental database 650]
FIG. 51 is a diagram showing an example of each data stored in the
図54および図55は、本実施の形態におけるマップの一例を示す図である。なお、図56は、図55のマップの凡例などを示す。つまり、図55の[A]~[R]は、図56に示されるA~Rに対応付けられている組成式である。 [Specific example of map]
54 and 55 are diagrams showing examples of maps in this embodiment. It should be noted that FIG. 56 shows a legend of the map of FIG. 55 and the like. That is, [A] to [R] in FIG. 55 are composition formulas corresponding to A to R shown in FIG.
図57Aおよび図57Bは、算出方法情報d12の変更に伴う画像の遷移の一例を示す図である。具体的には、図57Aは、第1情報d10に含まれる算出方法情報d12と、その算出方法情報d12にしたがって表示部140に表示される第1画像の一例を示す。図57Bは、変更後の算出方法情報d12と、その変更後の算出方法情報d12にしたがって表示部140に表示される第2画像の一例を示す。 [Specific example 1 of image change]
57A and 57B are diagrams showing an example of image transition accompanying a change in calculation method information d12. Specifically, FIG. 57A shows an example of the calculation method information d12 included in the first information d10 and the first image displayed on the
図58Aおよび図58Bは、探索範囲情報d14の変更に伴う画像の遷移の一例を示す図である。具体的には、図58Aは、第1情報d10に含まれる探索範囲情報d14の一部と、その探索範囲情報d14にしたがって表示部140に表示される第1画像の一例を示す。図58Bは、変更後の探索範囲情報d14の一部と、その変更後の探索範囲情報d14にしたがって表示部140に表示される第2画像の一例を示す。 [Specific example 2 of image change]
58A and 58B are diagrams showing an example of image transition accompanying a change in search range information d14. Specifically, FIG. 58A shows part of the search range information d14 included in the first information d10 and an example of the first image displayed on the
図59Aおよび図59Bは、第1表示対象情報d15の変更に伴う画像の遷移の一例を示す図である。具体的には、図59Aは、第1情報d10に含まれる第1表示対象情報d15と、その第1表示対象情報d15にしたがって表示部140に表示される第1画像の一例を示す。図59Bは、変更後の第1表示対象情報d15と、その変更後の第1表示対象情報d15にしたがって表示部140に表示される第2画像の一例を示す図である。 [Specific example 3 of image change]
59A and 59B are diagrams showing an example of image transition accompanying a change in the first display target information d15. Specifically, FIG. 59A shows an example of the first display target information d15 included in the first information d10 and the first image displayed on the
図60Aおよび図60Bは、表示範囲情報d16の変更に伴う画像の遷移の一例を示す図である。具体的には、図60Aは、第1情報d10に含まれる表示範囲情報d16と、その表示範囲情報d16にしたがって表示部140に表示される第1画像の一例を示す。図60Bは、変更後の表示範囲情報d16と、その変更後の表示範囲情報d16にしたがって表示部140に表示される第2画像の一例を示す。 [Specific example 4 of image change]
60A and 60B are diagrams showing an example of image transition accompanying a change in the display range information d16. Specifically, FIG. 60A shows an example of the display range information d16 included in the first information d10 and the first image displayed on the
図61Aおよび図61Bは、探索範囲情報d14の変更に伴う画像の遷移の一例を示す図である。具体的には、図61Aは、第1情報d10に含まれる探索範囲情報d14と、その探索範囲情報d14にしたがって表示部140に表示される第1画像の一例を示す。図61Bは、変更後の探索範囲情報d14と、その変更後の探索範囲情報d14にしたがって表示部140に表示される第2画像の一例を示す。 [Specific example 5 of image change]
61A and 61B are diagrams showing an example of image transition accompanying a change in search range information d14. Specifically, FIG. 61A shows an example of the search range information d14 included in the first information d10 and the first image displayed on the
図62は、マップ配列情報d13の変更に伴う画像の遷移の一例を示す図である。具体的には、図62の(a)は、第1情報d10に含まれるマップ配列情報d13にしたがって表示部140に表示される第1画像の一例を示す。図62の(b)は、変更後のマップ配列情報d13にしたがって表示部140に表示される第2画像の一例を示す。 [Specific example 6 of image change]
FIG. 62 is a diagram showing an example of image transition accompanying a change in the map arrangement information d13. Specifically, FIG. 62(a) shows an example of the first image displayed on the
図63は、本実施の形態における表示システム600の処理動作を示すフローチャートである。 [Processing operation]
FIG. 63 is a flow chart showing the processing operation of the
表示方法取得部633は、特性評価値の表示方法に関する第1情報d10を評価表示データベース640から取得し、その第1情報d10を評価値取得部632、実験点取得部635、および画像処理部634に出力する。 (Step S211)
The display
実験点取得部635は、表示方法取得部633から第1情報d10を取得する。そして、実験点取得部635は、その第1情報d10の探索範囲情報d14によって示される探索範囲に対応する実験済みの1つ以上の化合物のそれぞれの実験点を、実験データベース650から取得する。実験点取得部635は、その実験済み1つ以上の化合物のそれぞれの実験点を画像処理部634に出力する。 (Step S212)
The experimental
評価値取得部632は、表示方法取得部633から第1情報d10を取得する。そして、評価値取得部632は、その第1情報d10の算出方法情報d12および探索範囲情報d14などにしたがって、複数の化合物のそれぞれの特性評価値を取得する。このとき、評価値取得部632は、評価器データベース620の1つ以上の評価器を用いて、複数の化合物のそれぞれの特性評価値を取得する。評価値取得部632は、その複数の化合物のそれぞれの構成と、それらの構成に対応する特性評価値とを、画像処理部634に出力する。 (Step S213)
The evaluation
画像処理部634は、画像マップMbを含む第1画像を生成する。このとき、画像処理部634は、ステップS211で取得された第1情報d10と、ステップS213で取得された複数の化合物のそれぞれの構成および特性評価値とを用いて画像マップMbを生成する。さらに、画像処理部634は、ステップS212で取得された実験済みの1つ以上の化合物のそれぞれの実験点を、その画像マップMbに重畳する。そして、画像処理部634は、1つ以上の実験点が重畳された画像マップMbを含む第1画像を生成し、その第1画像を表示部140に出力する。 (Step S214)
The
表示部140は、画像処理部634から第1画像を取得し、その第1画像を表示する。 (Step S215)
ユーザは、入力部110に対して入力操作を行う。入力部110は、そのユーザによる入力操作に応じて、第1画像の表示の変更を示す入力信号を、特性表示装置630の表示方法取得部633に出力する。表示方法取得部633は、その入力信号を取得することによって、その第1画像の表示の変更を受け付ける。 (Step S216)
A user performs an input operation on the
表示方法取得部633は、ステップS216で取得された入力信号にしたがって、ステップS211で取得された第1情報d10を変更する。そして、表示方法取得部633は、その変更された第1情報d10を、評価値取得部632、実験点取得部635、および画像処理部634に出力する。 (Step S217)
The display
評価値取得部632および実験点取得部635は、その変更された第1情報d10を表示方法取得部633から取得すると、その第1情報d10の変更内容に応じて、特性評価値および実験点を取得し直す。そして、画像処理部634は、変更された第1情報d10にしたがって第2画像を生成する。この第2画像は、例えば、取得し直された特性評価値を示し、かつ、取得し直された実験点が重畳された画像マップMbを含む。画像処理部634は、その第2画像を表示部140に出力する。 (Step S218)
When the modified first information d10 is obtained from the display
表示部140は、画像処理部634から第2画像を取得し、その第2画像を表示する。 (Step S219)
上記実施の形態では、第1情報d10の変更を受け付けるために、第1情報d10に含まれる算出方法情報d12などの情報の全てが表示部140に表示される。具体的には、図57Aおよび図57Bに示すように、算出方法情報d12の全てが表示され、図58Aおよび図58Bに示すように、探索範囲情報d14の全てが表示される。このような情報に多くの設定項目または多くの非可視化変数が含まれている場合には、ユーザは、何れの設定項目または非可視化変数の選択肢を選択してよいかを迷う可能性がある。つまり、ユーザは、選択される選択肢の変更によってマップが大きく変化するような、複数の選択肢を有する設定項目または非可視化変数を容易に見つけることが困難である。 (Modification of Embodiment 3A)
In the above embodiment, all information such as the calculation method information d12 included in the first information d10 is displayed on the
まず、画像処理部634は、第1情報d10を複数のグループに分割する。具体的には、画像処理部634は、第1情報d10に含まれる算出方法情報d12、探索範囲情報d14などを複数のグループに分割する。例えば、算出方法情報d12は、その算出方法情報d12に含まれる複数の設定項目のそれぞれに対応するグループに分割される。つまり、1つのグループは、設定項目と、その設定項目が有する複数の選択肢とからなる。また、探索範囲情報d14は、その探索範囲情報d14に含まれる複数の非可視化変数のそれぞれに対応するグループに分割される。つまり、1つのグループは、非可視化変数と、その非可視化変数が取り得る複数の選択肢データとからなる。 (Step S214a)
First, the
次に、画像処理部634は、その複数のグループのそれぞれの優先度を算出する。この優先度は、上述のように、分散値の平均、差分絶対値和の総和、実験点に基づく分散値などによって算出される。 (Step S214b)
Next, the
次に、画像処理部634は、優先度の高いグループを優先的に第1画像に含めて表示部140に表示する。例えば、図64または図65に示すように、画像処理部634は、複数のグループのうち、最も高い優先度を有するグループのみを第1画像に含めて表示する。この第1画像には、画像マップMbなどのマップが含まれている。 (Step S214c)
Next, the
本実施の形態における表示システムは、実施の形態3Aと同様、複数の化合物のそれぞれの特性評価値をマップの形態で表示する。さらに、本実施の形態における表示システムは、実験済みの1つ以上の化合物のそれぞれの実験点の代わりに、実施の形態1および2と同様、特性実験値をマップに重畳する。また、本実施の形態における表示システムは、後述の第2情報にしたがって特性実験値をマップに重畳する。 (Embodiment 3B)
The display system according to the present embodiment displays characteristic evaluation values of each of a plurality of compounds in the form of a map, as in Embodiment 3A. Furthermore, the display system in the present embodiment superimposes characteristic experimental values onto the map, as in the first and second embodiments, instead of the respective experimental points of one or more compounds that have already been tested. In addition, the display system according to the present embodiment superimposes characteristic experimental values on the map according to the second information described later.
図67は、本実施の形態における表示システム700の構成の一例を示すブロック図である。図67に示す表示システム700は、入力部110と、評価器データベース620と、特性表示装置730と、表示部140と、評価表示データベース640と、実験データベース650と、実験表示データベース(DB)740とを備える。なお、特性表示装置730は、情報表示装置の一例である。 [Configuration of display system 700]
FIG. 67 is a block diagram showing an example of the configuration of
表示方法取得部733は、入力部110から入力信号を取得し、その入力信号に応じて、第1情報d10を評価表示データベース640から取得し、さらに、特性実験値の表示方法に関する第2情報d20を実験表示データベース740から取得する。そして、表示方法取得部733は、その第1情報d10を評価値取得部632、実験値取得部732および画像処理部734に出力する。さらに、表示方法取得部733は、第2情報d20を実験値取得部732および画像処理部734に出力する。これにより、その第1情報d10および第2情報d20にしたがったマップを含む画像が第1画像として表示部140に表示される。 [Display method acquisition unit 733]
The display
実験値取得部732は、表示方法取得部733から第1情報d10および第2情報d20を取得する。そして、実験値取得部732は、その第1情報d10の探索範囲情報d14と、第2情報d20とに対応する実験済みの1つ以上の化合物のそれぞれの構成および特性実験値を、実験データベース650から取得し、それらを画像処理部734に出力する。なお、実験値取得部732は、その探索範囲情報d14に関わらず、実験データベース650に格納されている全ての化合物の構成および特性実験値を取得してもよい。 [Experimental value acquisition unit 732]
The experimental
画像処理部734は、評価値取得部632から、複数の化合物のそれぞれの構成および特性評価値を取得し、実験値取得部732から、実験済みの1つ以上の化合物のそれぞれの構成および特性実験値を取得する。さらに、画像処理部734は、表示方法取得部733から第1情報d10および第2情報d20を取得する。画像処理部734は、第1情報d10および第2情報d20によって示される表示方法にしたがって、複数の化合物のそれぞれの特性評価値を示すマップを生成し、さらに、実験済みの1つ以上の化合物のそれぞれの特性実験値をそのマップに重畳する。なお、特性評価値を示すマップの生成では、画像処理部734は、複数の化合物のそれぞれについて、その化合物の特性評価値に応じた濃淡度の色を、その化合物の構成に対応するマップ上の位置に付ける。また、特性実験値の重畳では、画像処理部734は、実験済みの1つ以上の化合物のそれぞれについて、その化合物の特性実験値に応じた濃淡度の色を有するマークを、その化合物の構成に対応するマップ上の位置に重畳する。その特性評価値または特性実験値に応じた濃淡度の色は、特性評価値または特性実験値に応じた色であってもよい。画像処理部734は、その1つ以上の特性実験値が重畳されたマップを含む画像を、第1画像、第2画像または第3画像として表示部140に出力する。 [Image processing unit 734]
The
実験表示データベース740は、特性実験値の表示方法に関する情報を格納している記録媒体である。この記録媒体は、例えば、ハードディスクドライブ、RAM、ROM、または半導体メモリなどである。また、その記録媒体は、揮発性であっても不揮発性であってもよい。 [Experiment display database 740]
The
図69Aおよび図69Bは、第2表示対象情報d22の変更に伴う画像の遷移の一例を示す図である。具体的には、図69Aは、第2情報d20に含まれる第2表示対象情報d22と、その第2表示対象情報d22にしたがって表示部140に表示される第1画像の一例を示す。図69Bは、変更後の第2表示対象情報d22と、その変更後の第2表示対象情報d22にしたがって表示部140に表示される第3画像の一例を示す。なお、本実施の形態における各具体例では、第1情報d10は変更されず、第2情報d20が変更されることによって、第1画像が第3画像に変更される。 [Specific example 1 of image change]
69A and 69B are diagrams showing an example of image transition accompanying a change in the second display target information d22. Specifically, FIG. 69A shows an example of the second display target information d22 included in the second information d20 and the first image displayed on the
図70Aおよび図70Bは、表示条件情報d23の変更に伴う画像の遷移の一例を示す図である。具体的には、図70Aは、第2情報d20に含まれる表示条件情報d23と、その表示条件情報d23にしたがって表示部140に表示される第1画像の一例を示す。図70Bは、変更後の表示条件情報d23と、その変更後の表示条件情報d23にしたがって表示部140に表示される第3画像の一例を示す。 [Specific example 2 of image change]
70A and 70B are diagrams showing an example of image transition accompanying a change in the display condition information d23. Specifically, FIG. 70A shows an example of the display condition information d23 included in the second information d20 and the first image displayed on the
図71は、本実施の形態における表示システム700の処理動作を示すフローチャートである。 [Processing operation]
FIG. 71 is a flow chart showing the processing operation of
表示方法取得部733は、特性評価値の表示方法に関する第1情報d10を評価表示データベース640から取得し、その第1情報d10を評価値取得部632、実験値取得部732、および画像処理部734に出力する。 (Step S211)
The display
表示方法取得部733は、さらに、特性実験値の表示方法に関する第2情報d20を実験表示データベース740から取得し、その第2情報d20を実験値取得部732および画像処理部734に出力する。 (Step S221)
The display
実験値取得部732は、表示方法取得部733から第1情報d10および第2情報d20を取得する。そして、実験値取得部732は、その第1情報d10の探索範囲情報d14によって示される探索範囲に含まれる実験済みの1つ以上の化合物のそれぞれの特性実験値であって、第2情報d20の第2表示対象情報d22によって示される種別の特性実験値を、その化合物の構成と共に実験データベース650から取得する。実験値取得部732は、その実験済みの1つ以上の化合物のそれぞれの構成および特性実験値を画像処理部734に出力する。 (Step S222)
The experimental
評価値取得部632は、表示方法取得部733から第1情報d10を取得する。そして、評価値取得部632は、その第1情報d10の算出方法情報d12および探索範囲情報d14などにしたがって、複数の化合物のそれぞれの特性評価値を取得する。このとき、評価値取得部632は、評価器データベース620の1つ以上の評価器を用いて、複数の化合物のそれぞれの特性評価値を取得する。評価値取得部632は、その複数の化合物のそれぞれの構成と、それらの構成に対応する特性評価値とを、画像処理部734に出力する。 (Step S213)
The evaluation
画像処理部734は、画像マップMbを含む第1画像を生成する。このとき、画像処理部734は、ステップS211で取得された第1情報d10と、ステップS213で取得された複数の化合物のそれぞれの構成および特性評価値とを用いて画像マップMbを生成する。さらに、画像処理部734は、ステップS222で取得された実験済みの1つ以上の化合物のそれぞれの特性実験値を、その化合物の構成に対応する画像マップMb上の位置に重畳する。このとき、画像処理部734は、ステップS221で取得された第2情報d20にしたがって、その特性実験値に対応する形態のマークを生成し、そのマークを特性実験値として重畳する。これによって、実験済みの1つ以上の化合物のそれぞれの特性実験値が重畳された画像マップMbを含む第1画像が生成される。画像処理部734は、その第1画像を表示部140に出力する。 (Step S223)
The
表示部140は、画像処理部734から第1画像を取得し、その第1画像を表示する。 (Step S224)
ユーザは、入力部110に対して入力操作を行う。入力部110は、そのユーザによる入力操作に応じて、第1画像の表示の変更を示す入力信号を、特性表示装置730の表示方法取得部733に出力する。表示方法取得部733は、その入力信号を取得することによって、その第1画像の表示の変更を受け付ける。 (Step S225)
A user performs an input operation on the
表示方法取得部733は、ステップS225において取得された入力信号にしたがって、ステップS211で取得された第1情報d10と、ステップS221で取得された第2情報d20とのうちの少なくとも1つの情報を変更する。そして、表示方法取得部733は、その変更された少なくとも1つの情報を、評価値取得部632、実験値取得部732、および画像処理部734のうちの少なくとも2つに出力する。つまり、表示方法取得部733は、第1情報d10が変更された場合には、その変更された第1情報d10を、評価値取得部632、実験値取得部732、および画像処理部734に出力する。また、表示方法取得部733は、第2情報d20が変更された場合には、その変更された第2情報d20を、実験値取得部732および画像処理部734に出力する。 (Step S226)
The display
評価値取得部632は、その変更された第1情報d10を表示方法取得部733から取得すると、その第1情報d10の変更内容に応じて、特性評価値を取得し直す。実験値取得部732は、その変更された第1情報d10および第2情報d20を表示方法取得部733から取得すると、その第1情報d10および第2情報d20の変更内容に応じて、特性実験値を取得し直す。そして、画像処理部734は、変更された第1情報d10および第2情報d20にしたがって第3画像を生成する。この第3画像は、例えば、取得し直された特性評価値を示し、かつ、取得し直された特性実験値が重畳された画像マップMbを含む。画像処理部734は、その第3画像を表示部140に出力する。 (Step S227)
After obtaining the changed first information d10 from the display
表示部140は、画像処理部734から第3画像を取得し、その第3画像を表示する。 (Step S228)
本実施の形態における表示システムは、実施の形態3Bと同様、実験済みの1つ以上の化合物のそれぞれの特性実験値が重畳されたマップを含む画像を生成して表示する。さらに、本実施の形態における表示システムは、過去に生成された1つ以上の画像を保存し、保存されている画像を表示する。 (Embodiment 3C)
As in Embodiment 3B, the display system in this embodiment generates and displays an image including a map on which characteristic experimental values of one or more tested compounds are superimposed. Furthermore, the display system according to the present embodiment stores one or more previously generated images and displays the stored images.
図72は、本実施の形態における表示システム800の構成の一例を示すブロック図である。図72に示す表示システム800は、入力部110と、評価器データベース620と、特性表示装置830と、表示部140と、評価表示データベース640と、実験データベース650と、実験表示データベース740と、画像格納部820とを備える。なお、特性表示装置830は、情報表示装置の一例である。 [Configuration of display system 800]
FIG. 72 is a block diagram showing an example of the configuration of
表示方法取得部833は、実施の形態3Bの表示方法取得部733と同様の機能を有するとともに、さらに、入力部110から日付を示す入力信号を日付設定情報d30として取得する。この日付設定情報d30は、ユーザによって設定された日付が付加された画像の表示を促す情報である。表示方法取得部833は、その日付設定情報d30を取得すると、その日付設定情報d30を画像処理部834に出力する。これにより、その日付設定情報d30によって示される日付が付加された画像が第4画像として表示部140に表示される。 [Display method acquisition unit 833]
Display
画像処理部834は、実施の形態3Bの画像処理部734と同様の機能を有するとともに、さらに、生成されたマップを含む画像を画像格納部820に格納する。このとき、画像処理部834は、その画像が生成された日付をその画像に付加して画像格納部820に格納する。その画像は、第1画像、第2画像および第3画像のうちの何れの画像であってもよい。また、画像格納部820には、その日付が付加された画像が保存画像として画像格納部820に格納される。 [Image processing unit 834]
The
画像格納部820は、画像処理部834によって生成されたマップを含む画像を保存画像として格納するための記録媒体である。この記録媒体は、例えば、ハードディスクドライブ、RAM、ROM、または半導体メモリなどである。また、その記録媒体は、揮発性であっても不揮発性であってもよい。なお、画像格納部820に格納される保存画像には、その保存画像が生成された日付が付随情報として付加されている。 [Image storage unit 820]
The
図73Aおよび図73Bは、日付設定情報d30の変更に伴う画像の遷移の一例を示す図である。具体的には、図73Aは、日付設定情報d30を受け付けるための設定画像と、その日付設定情報d30にしたがって表示部140に表示される第4画像の一例を示す。図73Bは、変更後の日付設定情報d30を受け付けるための設定画像と、その変更後の日付設定情報d30にしたがって表示部140に表示される第5画像の一例を示す。 [Specific example of image change]
73A and 73B are diagrams showing an example of image transition accompanying a change in date setting information d30. Specifically, FIG. 73A shows an example of a setting image for receiving date setting information d30 and a fourth image displayed on
図74は、本実施の形態における表示システム800の処理動作を示すフローチャートである。 [Processing operation]
FIG. 74 is a flow chart showing the processing operation of
まず、表示システム800は、画像生成処理を実行する。つまり、表示システム800は、このステップS230における画像生成処理では、実施の形態3Bにおける図71のフローチャートに示される各ステップ、または、そのフローチャートに含まれるステップS211、S213およびS221~S224を実行する。これにより、第1画像、第2画像および第3画像のうちの少なくとも第1画像が生成されて表示される。 (Step S230)
First, the
次に、特性表示装置830の画像処理部834は、ステップS230の画像生成処理によって生成された画像を保存画像として保存する。このとき、画像処理部834は、画像が生成された日付をその画像に対して付加し、日付が付加された画像を保存画像として画像格納部820に格納する。 (Step S231)
Next, the
次に、特性表示装置830の表示方法取得部833は、日付設定情報d30を入力部110から受け付けたか否かを判定する。ここで、日付設定情報d30を受け付けていないと表示方法取得部833によって判定されると(ステップS232のNo)、表示システム800は、ステップS230からの処理を繰り返し実行する。 (Step S232)
Next, the display
一方、ステップS232において、日付設定情報d30を受け付けたと表示方法取得部833によって判定されると(ステップS232のYes)、画像処理部834は、その日付設定情報d30を表示方法取得部833から取得する。そして、画像処理部834は、その日付設定情報d30によって示される日付が付加されている保存画像を第4画像として画像格納部820から取得する。 (Step S233)
On the other hand, in step S232, when the display
画像処理部834は、ステップS233で取得された第4画像を表示部140に出力することによって、その第4画像を表示部140に表示する。 (Step S234)
次に、表示方法取得部833は、日付設定情報d30の変更を入力部110から受け付けたか否かを判定する。ここで、日付設定情報d30の変更を入力部110から受け付けていないと表示方法取得部833によって判定されると(ステップS235のNo)、特性表示装置830は、ステップS238の処理を実行する。 (Step S235)
Next, the display
一方、日付設定情報d30の変更を入力部110から受け付けたと表示方法取得部833によって判定されると(ステップS235のYes)、画像処理部834は、第5画像を取得する。すなわち、画像処理部834は、変更後の日付設定情報d30によって示される日付が付加されている保存画像を第5画像として画像格納部820から取得する。 (Step S236)
On the other hand, when the display
画像処理部834は、ステップS236で取得された第5画像を表示部140に出力することによって、その第5画像を表示部140に表示する。 (Step S237)
次に、特性表示装置830は、処理の終了条件が満たされているか否かを判定する。例えば、特性表示装置830は、入力部110から入力信号を取得し、その入力信号が処理の終了を示している場合には、処理の終了条件が満たされていると判定する。ここで、特性表示装置830は、処理の終了条件が満たされていないと判定すると(ステップS238のNo)、ステップS235からの処理を繰り返し実行する。一方、特性表示装置830は、処理の終了条件が満たされていると判定すると(ステップS238のYes)、特性表示に関する全ての処理を終了する。 (Step S238)
Next, the
本実施の形態における表示システムは、実施の形態3Bと同様、実験済みの1つ以上の化合物のそれぞれの特性実験値が重畳されたマップを含む画像を生成して表示する。さらに、本実施の形態における表示システムは、マップ上における特性評価値または特性実験値が選択された場合には、その選択された特性評価値または特性実験値を有する化合物の組成式を表示する。 (Embodiment 3D)
As in Embodiment 3B, the display system in this embodiment generates and displays an image including a map on which characteristic experimental values of one or more tested compounds are superimposed. Furthermore, the display system in the present embodiment displays the composition formula of the compound having the selected characteristic evaluation value or characteristic experimental value when a characteristic evaluation value or characteristic experimental value is selected on the map.
図75は、本実施の形態における表示システム900の構成の一例を示すブロック図である。図75に示す表示システム900は、入力部110と、評価器データベース620と、特性表示装置930と、表示部140と、評価表示データベース640aと、実験データベース650と、実験表示データベース740aとを備える。なお、特性表示装置930は、情報表示装置の一例である。 [Configuration of display system 900]
FIG. 75 is a block diagram showing an example of the configuration of
表示方法取得部933は、実施の形態3Bの表示方法取得部733と同様の機能を有する。さらに、表示方法取得部933は、ユーザによって選択された特性評価値または特性実験値を有する化合物の組成式を特定する。例えば、ユーザは、表示部140に表示されている画像を見て、その画像中のマップに示される特性評価値を、入力部110に対する入力操作によって選択する。入力部110は、そのユーザによる入力操作に応じて選択された特性評価値のマップ上における位置を示す入力信号を、位置情報d40として表示方法取得部933に出力する。表示方法取得部933は、その位置情報d40を入力部110から取得すると、その位置情報d40によって示される位置に対応する組成式を、評価表示データベース640aに含まれる後述の第1組成情報を用いて特定する。 [Display method acquisition unit 933]
The display
画像処理部934は、実施の形態3Bの画像処理部734と同様の機能を有する。さらに、画像処理部934は、表示方法取得部933から組成式を受けると、その組成式を示す組成画像を表示部140に出力する。これにより、その組成画像が表示部140に表示される。 [Image processing unit 934]
The
図76は、評価表示データベース640aに格納されている情報の一例を示す図である。 [
FIG. 76 is a diagram showing an example of information stored in the
図77は、実験表示データベース740aに格納されている情報の一例を示す図である。 [
FIG. 77 is a diagram showing an example of information stored in the
図78は、位置情報d40の取得に伴う画像の遷移の一例を示す図である。具体的には、図78の(a)は、表示部140に表示される第6画像の一例を示し、図78の(b)は、位置情報d40にしたがって表示部140に表示される第7画像の一例を示す。なお、第6画像は、例えば第1画像、第2画像または第3画像である。 [Specific example of image change]
FIG. 78 is a diagram showing an example of image transition accompanying acquisition of position information d40. Specifically, (a) of FIG. 78 shows an example of the sixth image displayed on the
図81は、本実施の形態における表示システム900の処理動作を示すフローチャートである。 [Processing operation]
FIG. 81 is a flow chart showing the processing operation of the
まず、表示システム900は、画像生成処理を実行する。つまり、表示システム900は、このステップS230における画像生成処理では、実施の形態3Bにおける図71のフローチャートに示される各ステップ、または、そのフローチャートに含まれるステップS211、S213、およびS221~S224を実行する。これにより、第1画像、第2画像または第3画像が第6画像として表示される。 (Step S230)
First, the
次に、特性表示装置930の表示方法取得部933は、位置情報d40を入力部110から受け付けたか否かを判定する。ここで、位置情報d40を受け付けていないと表示方法取得部933によって判定されると(ステップS241のNo)、表示システム900は、特性表示に関する処理を終了する。 (Step S241)
Next, the display
一方、ステップS241において、表示方法取得部933は、位置情報d40を受け付けたと判定すると(ステップS241のYes)、評価表示データベース640aまたは実験表示データベース740aから、第1組成情報d18または第2組成情報d24を取得する。例えば、選択された特性評価値の位置が位置情報d40に示されている場合には、表示方法取得部933は、評価表示データベース640aから第1組成情報d18を取得する。また、選択された特性実験値の位置が位置情報d40に示されている場合には、表示方法取得部933は、実験表示データベース740aから第2組成情報d24を取得する。そして、表示方法取得部933は、その第1組成情報d18または第2組成情報d24から、選択された特性評価値または特性実験値を有する化合物の組成式を検索する。そして、画像処理部934は、その検索された組成式を含む組成画像f1を生成する。 (Step S242)
On the other hand, in step S241, when the display
画像処理部934は、ステップS242で生成された組成画像f1を、ステップS230で生成されて表示されている第6画像の画像マップMbに重畳することによって、第7画像を生成する。 (Step S243)
The
画像処理部934は、ステップS243で生成された第7画像を表示部140に出力することによって、その第7画像を表示部140に表示する。 (Step S244)
以上、本開示に係る種々の表示システムについて、実施の形態に基づいて説明したが、本開示は、これらの実施の形態に限定されるものではない。本開示の趣旨を逸脱しない限り、当業者が思いつく各種変形を本実施の形態に施したもの、異なる実施の形態における構成要素を組み合わせて構築される形態なども、本開示の範囲内に含まれる。 <Other aspects>
Various display systems according to the present disclosure have been described above based on the embodiments, but the present disclosure is not limited to these embodiments. As long as it does not deviate from the spirit of the present disclosure, various modifications conceived by those skilled in the art are applied to the present embodiment, and forms constructed by combining the components of different embodiments are also included within the scope of the present disclosure. .
上記の表示システム100~900は、具体的には、マイクロプロセッサ、ROM、RAM、ハードディスクドライブ、ディスプレイユニット、キーボード、およびマウスなどから構成されるコンピュータシステムにより構成されても良い。RAMまたはハードディスクドライブには、表示プログラムが記憶されている。マイクロプロセッサが、表示プログラムに従って動作することにより、表示システム100~900は、その機能を達成する。ここで表示プログラムは、所定の機能を達成するために、コンピュータに対する指令を示す命令コードが複数個組み合わされて構成されたものである。 (Hardware configuration)
The
110 入力部
120 予測器データベース
130、230、330、430、530、630、730、830、930 特性表示装置
131 探索範囲取得部
132 予測値取得部
133、633、733、833、933 表示方法取得部
134、234、334、434、534、634、734、834、934 画像処理部
140 表示部
150、650 実験データベース
232、732 実験値取得部
331 候補点決定部
410、820 画像格納部
510 候補点データベース
531 候補点取得部
620 評価器データベース
632 評価値取得部
635 実験点取得部
640、640a 評価表示データベース
651 化合物基本データ
652 化合物詳細データ
740、740a 実験表示データベース
a1 参照画像
b1 候補点
d10 第1情報
d11 色彩情報
d12 算出方法情報
d121 算出方法画像
d13 マップ配列情報
d14 探索範囲情報
d141 探索範囲画像
d15 表示対象情報
d16 表示範囲情報
d18 第1組成情報
d20 第2情報
d21 色彩情報
d22 表示対象情報
d23 表示条件情報
d24 第2組成情報
d30 日付設定情報
d40 位置情報
e1、e2、e3、e4、e5 マーク(特性実験値)
f1、f11~f16 組成画像
L1 等値線
Ma、Ma1~Ma4 画像要素マップ(マップ)
Mb 画像マップ
r1、r2、r3、r4 領域
R1、R2、R3、R4 領域 100, 200, 300, 400, 401, 500, 600, 700, 800, 900
f1, f11 to f16 composition image L1 contour lines Ma, Ma1 to Ma4 image element map (map)
Mb image map r1, r2, r3, r4 region R1, R2, R3, R4 region
Claims (22)
- 複数の化合物のそれぞれの特性予測値を取得し、
前記複数の化合物のそれぞれの構成に対応する位置に当該化合物の特性予測値を示すマップを生成し、
1つ以上の候補化合物のそれぞれの構成を示す候補点を、当該候補化合物の構成に対応する前記マップ上の位置に重畳し、
1つ以上の前記候補点が重畳された前記マップを含む画像を生成して出力し、
前記候補化合物は、それぞれ前記マップに示される前記特性予測値を有する前記複数の化合物のうちの実験の候補とされる化合物である、
情報表示方法。 Obtaining property prediction values for each of a plurality of compounds,
Generating a map showing the predicted characteristic value of the compound at the position corresponding to the configuration of each of the plurality of compounds,
superimposing candidate points representing respective configurations of one or more candidate compounds on positions on the map corresponding to the configurations of the candidate compounds;
generating and outputting an image including the map superimposed with one or more of the candidate points;
The candidate compound is a compound that is a candidate for an experiment among the plurality of compounds each having the property prediction value shown in the map.
Information display method. - 前記情報表示方法では、さらに、
前記候補点の表示方法を示す表示方法情報を取得し、
前記候補点の重畳では、
前記表示方法情報にしたがって1つ以上の前記候補点を前記マップに重畳する、
請求項1に記載の情報表示方法。 Further, in the information display method,
acquiring display method information indicating a display method of the candidate points;
In superimposing the candidate points,
superimposing one or more of the candidate points on the map according to the display method information;
The information display method according to claim 1. - 前記表示方法情報は、
前記マップ上の予め定められた複数の位置にのみ前記候補点が重畳されることを、前記候補点の表示方法として示す、
請求項2に記載の情報表示方法。 The display method information is
indicating, as a display method of the candidate points, that the candidate points are superimposed only on a plurality of predetermined positions on the map;
The information display method according to claim 2. - 前記表示方法情報は、
前記マップに重畳される前記候補点の上限数を、前記候補点の表示方法として示し、
前記候補点の重畳では、
前記上限数以下で、かつ1つ以上の前記候補点を前記マップに重畳する、
請求項2または3に記載の情報表示方法。 The display method information is
indicating an upper limit number of the candidate points to be superimposed on the map as a display method of the candidate points;
In superimposing the candidate points,
superimposing one or more of the candidate points on the map, which is equal to or less than the upper limit number;
4. The information display method according to claim 2 or 3. - 前記表示方法情報は、
複数の前記候補点間の予め定められている第1最小離間距離を、前記候補点の表示方法として示し、
前記候補点の重畳では、
互いに前記第1最小離間距離以上離れている複数の前記候補点を前記マップに重畳する、
請求項2~4の何れか1項に記載の情報表示方法。 The display method information is
indicating a predetermined first minimum separation distance between the plurality of candidate points as a display method of the candidate points;
In superimposing the candidate points,
superimposing a plurality of the candidate points separated from each other by the first minimum separation distance or more on the map;
The information display method according to any one of claims 2 to 4. - 前記表示方法情報は、
1つ以上の前記候補点のそれぞれに対応する前記候補化合物の実験の順序を実験計画として表示させることを、前記候補点の表示方法として示す、
請求項2~5の何れか1項に記載の情報表示方法。 The display method information is
indicating, as a display method of the candidate points, displaying the order of experiments on the candidate compounds corresponding to each of the one or more candidate points as an experimental plan;
The information display method according to any one of claims 2 to 5. - 前記表示方法情報は、
1つ以上の前記候補点のうち、当該候補点が重畳される前記マップ上の位置において示される前記特性予測値が基準値以上の候補点を、残りの候補点よりも強調して表示させることを、前記候補点の表示方法として示す、
請求項2~6の何れか1項に記載の情報表示方法。 The display method information is
Among the one or more candidate points, the candidate points having the characteristic prediction value equal to or greater than a reference value indicated at the position on the map where the candidate points are superimposed are displayed with more emphasis than the remaining candidate points. is shown as a display method of the candidate points,
The information display method according to any one of claims 2 to 6. - 前記基準値は、前記複数の化合物のそれぞれの特性予測値の平均値もしくは中央値、または、ユーザによって指定された値である、
請求項7に記載の情報表示方法。 The reference value is an average value or median value of the property prediction values of each of the plurality of compounds, or a value specified by a user.
The information display method according to claim 7. - 前記表示方法情報は、
1つ以上の前記候補点のそれぞれを、当該候補点の優先度に応じて複数のグループのうちの何れか1つのグループに分類し、前記グループに対応付けられている態様のマークを前記マップに重畳することを、前記候補点の表示方法として示す、
請求項2~6の何れか1項に記載の情報表示方法。 The display method information is
Each of the one or more candidate points is classified into one of a plurality of groups according to the priority of the candidate point, and a mark associated with the group is placed on the map. Indicating superimposition as a display method for the candidate points,
The information display method according to any one of claims 2 to 6. - 前記マップは、第1座標軸および第2座標軸のそれぞれに沿ってマトリクス状に配列された複数の画像要素マップを含み、
前記複数の画像要素マップのそれぞれは、第3座標軸および第4座標軸を有し、
前記マップの生成では、
前記第1座標軸、前記第2座標軸、前記第3座標軸、および前記第4座標軸を、化合物の構成を表現するために用いられる第1変数、第2変数、第3変数、および第4変数にそれぞれ対応付け、
前記複数の化合物のそれぞれについて、
前記複数の画像要素マップのうち、当該化合物の構成を表現するために用いられる前記第1変数の値および前記第2変数の値に関連付けられている画像要素マップを特定し、
特性された前記画像要素マップ上における、当該化合物の構成を表現するために用いられる前記第3変数の値および前記第4変数の値に対応する位置に、当該化合物の特性予測値をマッピングする、
請求項2~9の何れか1項に記載の情報表示方法。 the map includes a plurality of image element maps arranged in a matrix along each of a first coordinate axis and a second coordinate axis;
each of the plurality of image element maps has a third coordinate axis and a fourth coordinate axis;
In generating the map,
The first coordinate axis, the second coordinate axis, the third coordinate axis, and the fourth coordinate axis are respectively the first variable, the second variable, the third variable, and the fourth variable used to express the composition of the compound. mapping,
For each of the plurality of compounds,
Identifying, from among the plurality of image element maps, an image element map associated with the first variable value and the second variable value used to express the composition of the compound;
Mapping the property prediction value of the compound to the position corresponding to the value of the third variable and the value of the fourth variable used to express the configuration of the compound on the characterized image element map;
The information display method according to any one of claims 2-9. - 前記表示方法情報は、
前記複数の画像要素マップのそれぞれに重畳される前記候補点の数を、前記候補点の表示方法として示し、
前記候補点の重畳では、
前記複数の画像要素マップのそれぞれに、前記表示方法情報によって示される数の前記候補点を重畳する、
請求項10に記載の情報表示方法。 The display method information is
indicating the number of the candidate points superimposed on each of the plurality of image element maps as a display method of the candidate points;
In superimposing the candidate points,
superimposing the number of candidate points indicated by the display method information on each of the plurality of image element maps;
The information display method according to claim 10. - 前記情報表示方法では、さらに、
実験済みの1つ以上の化合物のそれぞれの特性実験値を取得し、
前記実験済みの1つ以上の化合物のそれぞれの特性実験値を、当該化合物の構成に対応する前記マップ上の位置に重畳し、
前記画像の生成では、
1つ以上の前記候補点および1つ以上の前記特性実験値が重畳された前記マップを含む前記画像を生成する、
請求項2~11の何れか1項に記載の情報表示方法。 Further, in the information display method,
obtaining experimental property values for each of the one or more compounds that have been tested;
superimposing each characteristic experimental value of the one or more compounds that have been tested on the position on the map corresponding to the composition of the compound;
In generating the image,
generating the image comprising the map superimposed with one or more of the candidate points and one or more of the characteristic experimental values;
The information display method according to any one of claims 2-11. - 前記表示方法情報は、
前記候補点と前記特性実験値の位置との間の予め定められている第2最小離間距離を、前記候補点の表示方法として示し、
前記候補点の重畳では、
取得された前記実験済みの1つ以上の特性実験値のそれぞれの位置から、1つ以上の前記候補点を前記第2最小離間距離以上離して前記マップに重畳する、
請求項12に記載の情報表示方法。 The display method information is
indicating a predetermined second minimum separation distance between the candidate point and the position of the characteristic experimental value as a display method of the candidate point;
In superimposing the candidate points,
superimposing the one or more candidate points on the map at a distance equal to or greater than the second minimum separation distance from each position of the one or more characteristic experimental values that have been obtained;
The information display method according to claim 12. - 前記情報表示方法では、さらに、
前記画像の生成の後に、さらに、前記特性実験値の取得が繰り返し実行され、新たな特性実験値が取得された場合、
前記マップに重畳される全ての前記候補点が、前記新たな特性実験値の位置から前記第2最小離間距離以上離れるように、既に重畳されている1つ以上の前記候補点を更新する、
請求項13に記載の情報表示方法。 Further, in the information display method,
After the generation of the image, if the acquisition of the characteristic experimental value is repeatedly executed and a new characteristic experimental value is acquired,
updating the one or more candidate points already superimposed so that all the candidate points superimposed on the map are separated from the position of the new characteristic experimental value by the second minimum separation distance or more;
The information display method according to claim 13. - 前記情報表示方法では、さらに、
前記特性予測値の取得、前記マップの生成、前記表示方法情報の取得、前記特性実験値の取得、前記候補点の重畳、前記特性実験値の重畳、および前記画像の生成が繰り返し実行された後、繰り返し実行された前記画像の生成において生成された複数の画像を、記録媒体から読み出し、前記複数の画像を含む複合画像を生成して出力する、
請求項12に記載の情報表示方法。 Further, in the information display method,
After the acquisition of the property prediction value, the generation of the map, the acquisition of the display method information, the acquisition of the property experimental value, the superimposition of the candidate points, the superposition of the property experimental value, and the generation of the image are repeatedly executed. reading from a recording medium a plurality of images generated in the repeatedly executed image generation, and generating and outputting a composite image including the plurality of images;
The information display method according to claim 12. - 前記候補点の重畳では、
化合物の構成を示す候補点データを格納しているデータベースから、1つ以上の前記候補点を取得し、取得された1つ以上の前記候補点を前記マップに重畳する、
請求項1~15の何れか1項に記載の情報表示方法。 In superimposing the candidate points,
obtaining one or more of the candidate points from a database storing candidate point data indicating the composition of a compound, and superimposing the obtained one or more candidate points on the map;
The information display method according to any one of claims 1 to 15. - 前記候補点の重畳では、
前記複数の化合物のそれぞれの特性予測値に基づいて、1つ以上の前記候補点を決定し、決定された1つ以上の前記候補点を前記マップに重畳する、
請求項1~15の何れか1項に記載の情報表示方法。 In superimposing the candidate points,
Determining one or more of the candidate points based on the property prediction values of each of the plurality of compounds, and superimposing the determined one or more of the candidate points on the map;
The information display method according to any one of claims 1 to 15. - 前記情報表示方法では、さらに、
化合物の構成を表現するために用いられる複数の変数と、前記複数の変数のそれぞれについて、当該変数がとり得る値または元素を示す複数の選択肢データとを取得し、
前記特性予測値の取得では、
前記複数の変数のそれぞれに対して前記複数の選択肢データから1つの選択肢データを選択することによって得られる選択肢データの組み合わせごとに、当該組み合わせに対応する構成を有する化合物の特性予測値を取得する、
請求項1~17の何れか1項に記載の情報表示方法。 Further, in the information display method,
Acquiring a plurality of variables used to express the composition of a compound and, for each of the plurality of variables, a plurality of option data indicating possible values or elements of the variables,
In the acquisition of the characteristic predicted value,
For each combination of option data obtained by selecting one option data from the plurality of option data for each of the plurality of variables, obtaining a property prediction value of a compound having a configuration corresponding to the combination;
The information display method according to any one of claims 1 to 17. - 複数の化合物のそれぞれの構成に対応する位置に当該化合物の特性予測値を示すマップを取得し、
1つ以上の候補化合物のそれぞれの構成を示す候補点を、当該候補化合物の構成に対応する前記マップ上の位置に重畳することによって生成される、前記マップを含む画像を出力し、
前記候補化合物は、それぞれ前記マップに示される前記特性予測値を有する前記複数の化合物のうちの実験の候補とされる化合物である、
情報表示方法。 Obtaining a map showing the predicted characteristic value of the compound at a position corresponding to each configuration of a plurality of compounds,
outputting an image including the map generated by superimposing candidate points representing respective configurations of one or more candidate compounds on positions on the map corresponding to the configurations of the candidate compounds;
The candidate compound is a compound that is a candidate for an experiment among the plurality of compounds each having the property prediction value shown in the map.
Information display method. - 複数の化合物のそれぞれの特性予測値を取得する予測値取得部と、
前記複数の化合物のそれぞれの構成に対応する位置に当該化合物の特性予測値を示すマップを生成する画像処理部とを備え、
前記画像処理部は、
1つ以上の候補化合物のそれぞれの構成を示す候補点を、当該候補化合物の構成に対応する前記マップ上の位置に重畳することによって生成される、前記マップを含む画像を出力し、
前記候補化合物は、それぞれ前記マップに示される前記特性予測値を有する前記複数の化合物のうちの実験の候補とされる化合物である、
情報表示装置。 a predicted value acquisition unit that acquires a property predicted value of each of a plurality of compounds;
An image processing unit that generates a map indicating the predicted characteristic value of the compound at a position corresponding to the configuration of each of the plurality of compounds,
The image processing unit
outputting an image including the map generated by superimposing candidate points representing respective configurations of one or more candidate compounds on positions on the map corresponding to the configurations of the candidate compounds;
The candidate compound is a compound that is a candidate for an experiment among the plurality of compounds each having the property prediction value shown in the map.
Information display device. - 複数の化合物のそれぞれの特性予測値を取得し、
前記複数の化合物のそれぞれの構成に対応する位置に当該化合物の特性予測値を示すマップを生成し、
1つ以上の候補化合物のそれぞれの構成を示す候補点を、当該候補化合物の構成に対応する前記マップ上の位置に重畳し、
1つ以上の前記候補点が重畳された前記マップを含む画像を生成し、表示部に出力することを、コンピュータに実行させ、
前記候補化合物は、それぞれ前記マップに示される前記特性予測値を有する前記複数の化合物のうちの実験の候補とされる化合物である、
プログラム。 Obtaining property prediction values for each of a plurality of compounds,
Generating a map showing the predicted characteristic value of the compound at the position corresponding to the configuration of each of the plurality of compounds,
superimposing candidate points representing respective configurations of one or more candidate compounds on positions on the map corresponding to the configurations of the candidate compounds;
causing a computer to generate an image including the map on which one or more of the candidate points are superimposed, and output the image to a display;
The candidate compound is a compound that is a candidate for an experiment among the plurality of compounds each having the property prediction value shown in the map.
program. - 複数の化合物のそれぞれの構成に対応する位置に当該化合物の特性予測値を示すマップを取得し、
1つ以上の候補化合物のそれぞれの構成を示す候補点を、当該候補化合物の構成に対応する前記マップ上の位置に重畳することによって生成される、前記マップを含む画像を出力することを、コンピュータに実行させ、
前記候補化合物は、それぞれ前記マップに示される前記特性予測値を有する前記複数の化合物のうちの実験の候補とされる化合物である、
プログラム。 Obtaining a map showing the predicted characteristic value of the compound at a position corresponding to each configuration of a plurality of compounds,
outputting an image including the map generated by superimposing candidate points representing respective configurations of one or more candidate compounds on positions on the map corresponding to the configurations of the candidate compounds; and run
The candidate compound is a compound that is a candidate for an experiment among the plurality of compounds each having the property prediction value shown in the map.
program.
Priority Applications (2)
| Application Number | Priority Date | Filing Date | Title |
|---|---|---|---|
| JP2023538571A JPWO2023008449A1 (en) | 2021-07-28 | 2022-07-26 | |
| CN202280050743.2A CN117730373A (en) | 2021-07-28 | 2022-07-26 | Information display method, information display device, and program |
Applications Claiming Priority (2)
| Application Number | Priority Date | Filing Date | Title |
|---|---|---|---|
| JP2021-123657 | 2021-07-28 | ||
| JP2021123657 | 2021-07-28 |
Publications (1)
| Publication Number | Publication Date |
|---|---|
| WO2023008449A1 true WO2023008449A1 (en) | 2023-02-02 |
Family
ID=85087676
Family Applications (1)
| Application Number | Title | Priority Date | Filing Date |
|---|---|---|---|
| PCT/JP2022/028842 WO2023008449A1 (en) | 2021-07-28 | 2022-07-26 | Information display method, information display device, and program |
Country Status (3)
| Country | Link |
|---|---|
| JP (1) | JPWO2023008449A1 (en) |
| CN (1) | CN117730373A (en) |
| WO (1) | WO2023008449A1 (en) |
Citations (6)
| Publication number | Priority date | Publication date | Assignee | Title |
|---|---|---|---|---|
| US7199809B1 (en) | 1998-10-19 | 2007-04-03 | Symyx Technologies, Inc. | Graphic design of combinatorial material libraries |
| JP4009670B2 (en) | 2002-08-02 | 2007-11-21 | 独立行政法人科学技術振興機構 | Component blending design method, component blending design program and recording medium recording the program |
| JP6632412B2 (en) | 2015-02-12 | 2020-01-22 | 株式会社半導体エネルギー研究所 | Oxide semiconductor film |
| JP2020128962A (en) | 2019-02-12 | 2020-08-27 | 株式会社日立製作所 | Material characteristics prediction device and material characteristics prediction method |
| JP2020535566A (en) * | 2017-09-19 | 2020-12-03 | コベストロ・エルエルシー | Technology for custom designing products |
| WO2020263791A1 (en) * | 2019-06-28 | 2020-12-30 | Covestro Llc | Methods for graphical depiction of a value of a property of a material |
-
2022
- 2022-07-26 CN CN202280050743.2A patent/CN117730373A/en active Pending
- 2022-07-26 WO PCT/JP2022/028842 patent/WO2023008449A1/en active Application Filing
- 2022-07-26 JP JP2023538571A patent/JPWO2023008449A1/ja active Pending
Patent Citations (6)
| Publication number | Priority date | Publication date | Assignee | Title |
|---|---|---|---|---|
| US7199809B1 (en) | 1998-10-19 | 2007-04-03 | Symyx Technologies, Inc. | Graphic design of combinatorial material libraries |
| JP4009670B2 (en) | 2002-08-02 | 2007-11-21 | 独立行政法人科学技術振興機構 | Component blending design method, component blending design program and recording medium recording the program |
| JP6632412B2 (en) | 2015-02-12 | 2020-01-22 | 株式会社半導体エネルギー研究所 | Oxide semiconductor film |
| JP2020535566A (en) * | 2017-09-19 | 2020-12-03 | コベストロ・エルエルシー | Technology for custom designing products |
| JP2020128962A (en) | 2019-02-12 | 2020-08-27 | 株式会社日立製作所 | Material characteristics prediction device and material characteristics prediction method |
| WO2020263791A1 (en) * | 2019-06-28 | 2020-12-30 | Covestro Llc | Methods for graphical depiction of a value of a property of a material |
Non-Patent Citations (4)
| Title |
|---|
| AUSTIN D. SENDEK ET AL.: "Holistic computational structure screening of more than 12000 candidates for solid lithium-ion conductor materials", ENERGY & ENVIRONMENTAL SCIENCE, vol. 10, no. 1, 2017, pages 306 - 320, XP055581713, DOI: 10.1039/C6EE02697D |
| JONATHAN SCHMIDT ET AL.: "Predicting the Thermodynamic Stability of Solids Combining Density Functional Theory and Machine Learning", CHEMISTRY OF MATERIALS, vol. 29, no. 12, 2017, pages 5090 - 5103, XP093081989, DOI: 10.1021/acs.chemmater.7b00156 |
| KEI TERAYAMAKOJI TSUDARYO TAMURA: "Efficient recommendation tool of materials by an executable file based on machine learning", JAPANESE JOURNAL OF APPLIED PHYSICS, vol. 58, no. 098001, 2019 |
| XINGFENG HE ET AL.: "Statistical variances of diffusional properties from ab initio molecular dynamics simulations", COMPUTATIONAL MATERIALS, vol. 4, no. 1, 2018, pages 1 - 9 |
Also Published As
| Publication number | Publication date |
|---|---|
| JPWO2023008449A1 (en) | 2023-02-02 |
| CN117730373A (en) | 2024-03-19 |
Similar Documents
| Publication | Publication Date | Title |
|---|---|---|
| Berger et al. | Uncertainty‐aware exploration of continuous parameter spaces using multivariate prediction | |
| US20200342953A1 (en) | Target molecule-ligand binding mode prediction combining deep learning-based informatics with molecular docking | |
| Abousamra et al. | Deep learning-based mapping of tumor infiltrating lymphocytes in whole slide images of 23 types of cancer | |
| De Breuck et al. | Robust model benchmarking and bias-imbalance in data-driven materials science: a case study on MODNet | |
| da Silva et al. | Attribute-based visual explanation of multidimensional projections | |
| Elbasir et al. | BCrystal: an interpretable sequence-based protein crystallization predictor | |
| Yu et al. | Combining multiple positive training sets to generate confidence scores for protein–protein interactions | |
| Bobek et al. | Towards model-agnostic ensemble explanations | |
| WO2023008449A1 (en) | Information display method, information display device, and program | |
| WO2023008447A1 (en) | Information display method, information display device, and program | |
| WO2023008450A1 (en) | Information display method, information display device, and program | |
| Schneider et al. | Visual integration of data and model space in ensemble learning | |
| Goldberg et al. | Toward quantitative geocode accuracy metrics | |
| Pham et al. | Visualisation of Information Uncertainty: Progress and Challenges. | |
| Huang et al. | Interactive visual study of multiple attributes learning model of x-ray scattering images | |
| US20240153174A1 (en) | Information display method, information display device, and recording medium | |
| Kazemian et al. | Applications of evolutionary SVM to prediction of membrane alpha-helices | |
| US20240153597A1 (en) | Information display method, information display device, and recording medium | |
| Guo et al. | Deciphering feature effects on decision-making in ordinal regression problems: an explainable ordinal factorization model | |
| US20230170061A1 (en) | Property display method, property display apparatus, information processing apparatus, and non-transitory computer-readable recording medium | |
| Singgalen | Implementation of rapid application development for spatio-temporal database management | |
| Forghani et al. | Three-dimensional visualization for phylogenetic tree | |
| Walker | Visualising multi-objective populations with treemaps | |
| Lutton et al. | Visual analytics of ea data | |
| WO2012046436A1 (en) | Document analysis device, document analysis method, and document analysis program |
Legal Events
| Date | Code | Title | Description |
|---|---|---|---|
| 121 | Ep: the epo has been informed by wipo that ep was designated in this application |
Ref document number: 22849510 Country of ref document: EP Kind code of ref document: A1 |
|
| WWE | Wipo information: entry into national phase |
Ref document number: 2023538571 Country of ref document: JP |
|
| WWE | Wipo information: entry into national phase |
Ref document number: 2022849510 Country of ref document: EP |
|
| NENP | Non-entry into the national phase |
Ref country code: DE |
|
| ENP | Entry into the national phase |
Ref document number: 2022849510 Country of ref document: EP Effective date: 20240228 |