WO2022264604A1 - ガス濃度特徴量推定装置、ガス濃度特徴量推定方法、プログラム、およびガス濃度特徴量推論モデル生成装置 - Google Patents
ガス濃度特徴量推定装置、ガス濃度特徴量推定方法、プログラム、およびガス濃度特徴量推論モデル生成装置 Download PDFInfo
- Publication number
- WO2022264604A1 WO2022264604A1 PCT/JP2022/013879 JP2022013879W WO2022264604A1 WO 2022264604 A1 WO2022264604 A1 WO 2022264604A1 JP 2022013879 W JP2022013879 W JP 2022013879W WO 2022264604 A1 WO2022264604 A1 WO 2022264604A1
- Authority
- WO
- WIPO (PCT)
- Prior art keywords
- gas
- data
- pixel group
- time
- gas concentration
- Prior art date
Links
- 238000000034 method Methods 0.000 title claims description 54
- 238000009826 distribution Methods 0.000 claims abstract description 159
- 238000007689 inspection Methods 0.000 claims abstract description 146
- 238000010801 machine learning Methods 0.000 claims abstract description 56
- 238000003384 imaging method Methods 0.000 claims description 46
- 230000031700 light absorption Effects 0.000 claims description 41
- 238000012545 processing Methods 0.000 claims description 39
- 238000006243 chemical reaction Methods 0.000 claims description 24
- 230000008569 process Effects 0.000 claims description 23
- 238000004088 simulation Methods 0.000 claims description 19
- 238000012549 training Methods 0.000 abstract description 9
- 239000007789 gas Substances 0.000 description 507
- 239000000047 product Substances 0.000 description 84
- 238000010586 diagram Methods 0.000 description 58
- 238000012800 visualization Methods 0.000 description 31
- 230000003287 optical effect Effects 0.000 description 25
- 230000008859 change Effects 0.000 description 20
- 238000003860 storage Methods 0.000 description 20
- VNWKTOKETHGBQD-UHFFFAOYSA-N methane Chemical compound C VNWKTOKETHGBQD-UHFFFAOYSA-N 0.000 description 18
- 238000004364 calculation method Methods 0.000 description 17
- 238000004891 communication Methods 0.000 description 13
- 230000006870 function Effects 0.000 description 12
- 238000001514 detection method Methods 0.000 description 10
- 230000003595 spectral effect Effects 0.000 description 10
- 239000012530 fluid Substances 0.000 description 9
- 238000005259 measurement Methods 0.000 description 9
- 239000000470 constituent Substances 0.000 description 8
- 230000010354 integration Effects 0.000 description 8
- 238000010521 absorption reaction Methods 0.000 description 7
- 238000004590 computer program Methods 0.000 description 7
- 238000005286 illumination Methods 0.000 description 7
- 230000006872 improvement Effects 0.000 description 5
- ATUOYWHBWRKTHZ-UHFFFAOYSA-N Propane Chemical compound CCC ATUOYWHBWRKTHZ-UHFFFAOYSA-N 0.000 description 4
- 210000004027 cell Anatomy 0.000 description 4
- 238000011960 computer-aided design Methods 0.000 description 4
- 238000005516 engineering process Methods 0.000 description 4
- 238000012986 modification Methods 0.000 description 4
- 230000004048 modification Effects 0.000 description 4
- 239000004215 Carbon black (E152) Substances 0.000 description 3
- 238000004458 analytical method Methods 0.000 description 3
- 238000013527 convolutional neural network Methods 0.000 description 3
- 238000000605 extraction Methods 0.000 description 3
- 229930195733 hydrocarbon Natural products 0.000 description 3
- 150000002430 hydrocarbons Chemical class 0.000 description 3
- 230000005855 radiation Effects 0.000 description 3
- 239000000523 sample Substances 0.000 description 3
- 238000000547 structure data Methods 0.000 description 3
- 230000002123 temporal effect Effects 0.000 description 3
- 230000008901 benefit Effects 0.000 description 2
- 238000009529 body temperature measurement Methods 0.000 description 2
- 238000011156 evaluation Methods 0.000 description 2
- 238000003331 infrared imaging Methods 0.000 description 2
- 239000004973 liquid crystal related substance Substances 0.000 description 2
- 210000002569 neuron Anatomy 0.000 description 2
- 230000010363 phase shift Effects 0.000 description 2
- 239000001294 propane Substances 0.000 description 2
- 238000012360 testing method Methods 0.000 description 2
- 238000012935 Averaging Methods 0.000 description 1
- 230000005457 Black-body radiation Effects 0.000 description 1
- UGFAIRIUMAVXCW-UHFFFAOYSA-N Carbon monoxide Chemical compound [O+]#[C-] UGFAIRIUMAVXCW-UHFFFAOYSA-N 0.000 description 1
- OTMSDBZUPAUEDD-UHFFFAOYSA-N Ethane Chemical compound CC OTMSDBZUPAUEDD-UHFFFAOYSA-N 0.000 description 1
- VGGSQFUCUMXWEO-UHFFFAOYSA-N Ethene Chemical compound C=C VGGSQFUCUMXWEO-UHFFFAOYSA-N 0.000 description 1
- 239000005977 Ethylene Substances 0.000 description 1
- 230000032683 aging Effects 0.000 description 1
- 230000005540 biological transmission Effects 0.000 description 1
- 229910002091 carbon monoxide Inorganic materials 0.000 description 1
- 230000007423 decrease Effects 0.000 description 1
- 238000013135 deep learning Methods 0.000 description 1
- 230000006866 deterioration Effects 0.000 description 1
- 238000009792 diffusion process Methods 0.000 description 1
- 238000006073 displacement reaction Methods 0.000 description 1
- 238000009429 electrical wiring Methods 0.000 description 1
- 238000001914 filtration Methods 0.000 description 1
- 238000004519 manufacturing process Methods 0.000 description 1
- 239000000463 material Substances 0.000 description 1
- 238000011176 pooling Methods 0.000 description 1
- 238000012805 post-processing Methods 0.000 description 1
- 238000003672 processing method Methods 0.000 description 1
- QQONPFPTGQHPMA-UHFFFAOYSA-N propylene Natural products CC=C QQONPFPTGQHPMA-UHFFFAOYSA-N 0.000 description 1
- 125000004805 propylene group Chemical group [H]C([H])([H])C([H])([*:1])C([H])([H])[*:2] 0.000 description 1
- 230000009467 reduction Effects 0.000 description 1
- 230000008439 repair process Effects 0.000 description 1
- 239000004065 semiconductor Substances 0.000 description 1
- 230000035945 sensitivity Effects 0.000 description 1
- 239000000758 substrate Substances 0.000 description 1
- 239000013589 supplement Substances 0.000 description 1
- 230000000007 visual effect Effects 0.000 description 1
Images


Classifications
-
- G—PHYSICS
- G01—MEASURING; TESTING
- G01N—INVESTIGATING OR ANALYSING MATERIALS BY DETERMINING THEIR CHEMICAL OR PHYSICAL PROPERTIES
- G01N21/00—Investigating or analysing materials by the use of optical means, i.e. using sub-millimetre waves, infrared, visible or ultraviolet light
- G01N21/17—Systems in which incident light is modified in accordance with the properties of the material investigated
- G01N21/25—Colour; Spectral properties, i.e. comparison of effect of material on the light at two or more different wavelengths or wavelength bands
- G01N21/31—Investigating relative effect of material at wavelengths characteristic of specific elements or molecules, e.g. atomic absorption spectrometry
- G01N21/35—Investigating relative effect of material at wavelengths characteristic of specific elements or molecules, e.g. atomic absorption spectrometry using infrared light
- G01N21/3504—Investigating relative effect of material at wavelengths characteristic of specific elements or molecules, e.g. atomic absorption spectrometry using infrared light for analysing gases, e.g. multi-gas analysis
-
- G—PHYSICS
- G01—MEASURING; TESTING
- G01M—TESTING STATIC OR DYNAMIC BALANCE OF MACHINES OR STRUCTURES; TESTING OF STRUCTURES OR APPARATUS, NOT OTHERWISE PROVIDED FOR
- G01M3/00—Investigating fluid-tightness of structures
- G01M3/38—Investigating fluid-tightness of structures by using light
-
- G—PHYSICS
- G06—COMPUTING; CALCULATING OR COUNTING
- G06T—IMAGE DATA PROCESSING OR GENERATION, IN GENERAL
- G06T7/00—Image analysis
-
- G—PHYSICS
- G01—MEASURING; TESTING
- G01N—INVESTIGATING OR ANALYSING MATERIALS BY DETERMINING THEIR CHEMICAL OR PHYSICAL PROPERTIES
- G01N21/00—Investigating or analysing materials by the use of optical means, i.e. using sub-millimetre waves, infrared, visible or ultraviolet light
- G01N21/17—Systems in which incident light is modified in accordance with the properties of the material investigated
- G01N21/25—Colour; Spectral properties, i.e. comparison of effect of material on the light at two or more different wavelengths or wavelength bands
- G01N21/31—Investigating relative effect of material at wavelengths characteristic of specific elements or molecules, e.g. atomic absorption spectrometry
- G01N21/35—Investigating relative effect of material at wavelengths characteristic of specific elements or molecules, e.g. atomic absorption spectrometry using infrared light
- G01N21/3504—Investigating relative effect of material at wavelengths characteristic of specific elements or molecules, e.g. atomic absorption spectrometry using infrared light for analysing gases, e.g. multi-gas analysis
- G01N2021/3531—Investigating relative effect of material at wavelengths characteristic of specific elements or molecules, e.g. atomic absorption spectrometry using infrared light for analysing gases, e.g. multi-gas analysis without instrumental source, i.e. radiometric
-
- G—PHYSICS
- G01—MEASURING; TESTING
- G01N—INVESTIGATING OR ANALYSING MATERIALS BY DETERMINING THEIR CHEMICAL OR PHYSICAL PROPERTIES
- G01N2201/00—Features of devices classified in G01N21/00
- G01N2201/02—Mechanical
- G01N2201/022—Casings
- G01N2201/0221—Portable; cableless; compact; hand-held
-
- G—PHYSICS
- G01—MEASURING; TESTING
- G01N—INVESTIGATING OR ANALYSING MATERIALS BY DETERMINING THEIR CHEMICAL OR PHYSICAL PROPERTIES
- G01N2201/00—Features of devices classified in G01N21/00
- G01N2201/12—Circuits of general importance; Signal processing
- G01N2201/129—Using chemometrical methods
- G01N2201/1296—Using chemometrical methods using neural networks
Definitions
- the present disclosure relates to a gas concentration feature quantity estimating device and a gas concentration feature quantity estimating method, and relates to a gas concentration feature quantity estimating method based on an infrared captured image.
- Gas facilities Facilities that use gas (hereinafter referred to as " Gas facilities") are aware of the danger of gas leaks due to aging deterioration and operational errors of the facilities, and are equipped with gas detection devices to minimize gas leaks.
- the gas detection method using infrared video can visualize the gas with images, so compared to the conventional detection probe method, it has the advantage of being able to easily detect the release state of the gas flow and the location of the leak. In addition, since the state of the leaked gas is recorded as a video, there is an advantage that it can be used as evidence of the occurrence of the gas leak and its repair.
- Patent Document 1 discloses an infrared image of an object to be monitored, which detects the presence of gas by detecting the amplitude characteristics in the time-series luminance change of each pixel.
- a technique is disclosed for estimating the concentration thickness product by specifying the background temperature and the background temperature in the absence of gas.
- the mechanical vibrations that occur during operation cause mechanical vibrations in the imaging target, and the captured infrared images may contain mechanical vibration noise.
- mechanical vibration noise may be transmitted from the gas equipment or the like to the imaging device, and the captured infrared image may be affected by the mechanical vibration noise.
- the luminance change of each pixel is detected due to the luminance change of each pixel due to the vibration noise. Therefore, as a problem specific to non-contact gas detection using infrared images, there was concern that the accuracy of the feature value related to the calculated gas concentration would be reduced due to the influence of mechanical vibration noise existing in the measurement environment.
- An object of the present invention is to provide a concentration feature quantity estimating device, a gas concentration feature quantity estimating method, a program, and a gas concentration feature quantity inference model generating device.
- a gas concentration feature value estimating device is a gas concentration feature quantity estimation device having two or more vertical and horizontal pixels each extracted from inspection data of a gas distribution moving image representing an existing region of gas in space.
- an inspection data acquiring unit for acquiring time-series pixel group inspection data of the distribution video and the temperature value of the gas; and time-series pixel group teacher data of the gas distribution video of the same size as the time-series pixel group inspection data.
- the time-series pixel group inspection acquired by the inspection data acquisition unit using an inference model machine-learned using gas temperature values and gas concentration feature values corresponding to the time-series pixel group teacher data as teacher data. and an estimating unit that calculates the gas concentration feature quantity corresponding to the data.
- a gas concentration feature quantity estimating device capable of reducing the influence of mechanical vibration noise on measurement and accurately detecting a feature quantity representing gas concentration in a space from an infrared gas distribution moving image, gas concentration A feature quantity estimation method, a program, and a gas concentration feature quantity inference model generation device can be provided.
- the feature quantity that expresses the gas concentration in the space can be obtained. It can be detected with high accuracy.
- FIG. 1 is a schematic configuration diagram of a gas concentration feature quantity estimation system 1 according to an embodiment
- FIG. FIG. 3 is a schematic diagram showing the relationship between the gas visualization imaging device 10 and an inspection object 300
- 2 is a diagram showing a circuit configuration of a gas concentration feature quantity estimating device 20
- FIG. (a) is a functional block diagram of the control unit 21, and (b) is a functional block diagram of a machine learning unit 2151 in the control unit 21.
- FIG. (a) is a diagram showing the aspect of time-series pixel group inspection data of a gas distribution video image whose regions are extracted from the inspection data of the gas distribution video image;
- 3C is a diagram showing a mode of time-series pixel group teacher data of a gas distribution moving image
- (c) is a schematic diagram showing a mode of a gas concentration feature amount estimated from time-series pixel group inspection data of a gas distribution moving image.
- (a) is the aspect of the time-series pixel group data of the gas distribution video when there is no mechanical vibration noise
- (b) is the gas distribution video when it is affected by mechanical vibration noise.
- 2 is a schematic diagram showing a mode of time-series pixel group data of FIG.
- FIG. 3A is a schematic diagram showing temporal changes in luminance values representing gas distribution in time-series pixel group data of a gas distribution moving image
- FIG. 4B is a schematic diagram showing positional changes in luminance values representing gas distribution in time-series pixel group data.
- FIG. . (a) to (d) are diagrams showing a method of calculating a density-thickness product from a light absorption rate.
- 4 is a flow chart showing the operation of the gas concentration feature quantity estimating device 20 in the learning phase.
- FIG. 4 is a flow chart showing the operation of the gas concentration feature quantity estimating device 20 in the operation phase.
- (a) is an example of a gas distribution moving image to be inspected
- (b) is an example of an inspection object image of a light absorption image
- (c) is an example of a processing result of the light absorption image.
- 3 is a diagram showing a circuit configuration of a machine learning data generation device 30
- FIG. 3 is a functional block diagram of a control unit 31
- FIG. 3A is a schematic diagram showing the data structure of three-dimensional structure data DTstr
- FIG. 3B is a schematic diagram showing the data structure of three-dimensional gas distribution image data DTgas.
- FIG. 10 is a schematic diagram for explaining an outline of a concentration/thickness integration calculation method in a two-dimensional single-viewpoint gas distribution image conversion process
- FIG. 10 is a schematic diagram for explaining an outline of a concentration/thickness integration calculation method under the condition that a structure exists in the two-dimensional single-viewpoint gas distribution image conversion process
- (a) is a schematic diagram showing an outline of the density-thickness product image data
- (b) is a schematic diagram for explaining the outline of the density-thickness integration calculation method in the light absorptance image conversion process
- (c) is a light FIG.
- FIG. 4 is a schematic diagram showing an overview of absorptance image data;
- (a) is a schematic diagram showing an overview of the three-dimensional structure data,
- (b) is a schematic diagram showing an overview of the extracted background location data, and
- (c) is background image data based on the background location data.
- (a) is a schematic diagram showing an outline of background image data
- (b) is a schematic diagram showing an outline of light absorptance image data
- (c) is a schematic diagram showing an outline of light intensity image data.
- 4 is a flowchart showing an outline of a two-dimensional single-viewpoint gas distribution image conversion process;
- 4 is a flowchart showing an overview of background image generation processing;
- 4 is a flowchart showing an overview of light intensity image data generation processing;
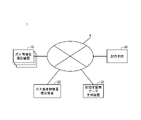
- FIG. 1 is a schematic configuration diagram of a gas concentration feature amount system 1 according to an embodiment.
- the gas concentration feature value system 1 includes a plurality of gas visualization imaging devices 10 connected to a communication network N, a gas concentration feature value estimation device 20, a machine learning data generation device 30, and a storage means 40. consists of
- the communication network N is, for example, the Internet, and the gas visualization imaging device 10, the gas concentration feature value estimation device 20, a plurality of machine learning data generation devices 30, and the storage means 40 are connected so as to exchange information with each other. ing.
- the gas visualization imaging device 10 is a device or system that captures an image of an object to be monitored using infrared rays and provides an infrared image in which gas is visualized. There are modes such as a portable type and a drone-mounted type.
- the gas visualization imaging device 10 includes, for example, imaging means (not shown) composed of an infrared camera that detects infrared rays and takes an image, and an interface circuit (not shown) that outputs to the communication network N.
- An infrared camera is an infrared imaging device that generates an infrared image based on infrared light and outputs the infrared image to the outside. It can be used for a leak gas visualization imaging device for visualizing gas leaks from gas equipment by capturing an infrared moving image of gas in the air using the infrared absorption characteristics of gas.
- Infrared camera images are commonly used to detect hydrocarbon gases.
- a so-called infrared camera equipped with an image sensor having a sensitivity wavelength band for at least part of infrared light wavelengths of 3 ⁇ m to 5 ⁇ m detects infrared light with a wavelength of 3.2 to 3.4 ⁇ m and images It can detect hydrocarbon gases such as methane, ethane, ethylene, and propylene.
- hydrocarbon gases such as methane, ethane, ethylene, and propylene.
- infrared light with a wavelength of 4.52-4.67 ⁇ m different kinds of gases such as carbon monoxide can also be detected.
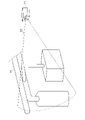
- FIG. 2 is a schematic diagram showing the relationship between the gas visualization imaging device 10 and the inspection object 300.
- the gas visualization imaging device 10 is installed so that the inspection object 300 is included in the field of view 310 of the infrared camera.
- the obtained inspection image is, for example, a video signal for transmitting an image of 30 frames per second.
- the gas visualization imaging device 10 converts the captured image into a predetermined video signal.
- the infrared image signal obtained from the infrared camera is processed as a moving image consisting of a plurality of frames by restoring the video signal to an image.
- the image is an infrared photograph of an object to be monitored, and has infrared intensity as a pixel value.
- the number of pixels of the gas distribution image is, for example, 320 ⁇ 256 pixels, and the number of frames is, for example, 100.
- the gas visualization imaging device detects the presence of gas by capturing changes in the amount of electromagnetic waves emitted from background objects with an absolute temperature of 0 (K) or higher. Changes in the amount of electromagnetic waves are mainly caused by the absorption of electromagnetic waves in the infrared region by the gas or by the generation of black body radiation from the gas itself.
- the gas visualization imaging device 10 captures an image of the gas leakage by photographing the space to be monitored, so that the gas leakage can be detected earlier and the location of the gas can be accurately captured.
- the visualized inspection image is temporarily stored in a memory or the like, and is transferred to and stored in the storage means 40 via the communication network N based on the operation input.
- gas visualization imaging device 10 is not limited to this, and may be any imaging device capable of detecting the gas to be monitored.
- a general visible light camera may be used.
- the storage means 40 is a storage device for storing inspection images transmitted from the gas visualization imaging device 10.
- the storage means 40 includes, for example, a nonvolatile memory such as a hard disk. stored in a state associated with the identification information of The administrator can use a management terminal (not shown) or the like to read the infrared image from the storage means 40 and grasp the state of the infrared image to be browsed.
- the gas concentration feature quantity estimating device 20 acquires an inspection image of the object to be monitored from the gas visualization imaging device 10, estimates the gas feature quantity based on the inspection image, and notifies the user of the gas detection through the display 24. It is a device.
- the gas concentration feature quantity estimating device 20 is realized, for example, as a computer having a general CPU (Central Processing Unit), RAM (Random Access Memory), and programs executed by these. As will be described later, the gas concentration feature quantity estimating device 20 may further include a GPU (Graphics Processing Unit) as a computing device and a RAM.
- GPU Graphics Processing Unit
- FIG. 3 is a diagram showing the circuit configuration of the gas concentration feature quantity estimating device 2. As shown in FIG.
- the gas concentration feature quantity estimating device 20 is a server computer for estimating the optical absorptance based on the inspection image.
- the gas concentration feature value estimating device 20 reads the inspection image stored in the storage means 40 or receives the inspection image from the gas visualization imaging device 10, estimates the light absorption rate of the inspection image, and calculates the light absorption rate.
- An absorptance image is generated and output to the storage means 40 via the communication network N for storage.
- FIG. 3 is a schematic configuration diagram showing the circuit configuration of the gas concentration feature quantity estimating device 20.
- the gas concentration feature quantity estimation device 20 includes a control section 21 , a communication circuit 22 , a storage device 23 , a display device 24 and an operation input section 25 .
- the display device 24 is, for example, a liquid crystal panel or the like, and displays a display screen generated by the control unit 21.
- the operation input unit 25 is an input device for input for the operator to operate the gas concentration feature quantity estimation device 20 .
- an input device such as a keyboard and a mouse, or a touch panel having a touch sensor arranged on the front surface of the display 24 may be implemented as one device that serves as both a display device and an input device.
- the control unit 21 includes a CPU, a RAM, and a ROM, and the CPU executes a program (not shown) stored in the ROM to realize each function of the gas concentration feature value estimation device 20. Specifically, the control unit 21 estimates the gas concentration feature amount of the gas distribution image based on the inspection image acquired from the communication circuit 22, creates an image of the gas concentration feature amount, and creates the image of the gas concentration feature amount. Output to the communication circuit 22 . Specifically, as the gas concentration feature amount, the light absorption rate or the gas concentration thickness product is estimated to create a light absorption rate image or a gas concentration thickness product image, which is output to the communication circuit 22 .
- FIG. 4A is a functional block diagram of the control section 21. As shown in FIG.
- the gas concentration feature value estimation device 20 includes an inspection image acquisition unit 211 , a gas temperature value inspection data acquisition unit 212 , a teacher image acquisition unit 213 , a gas feature value teacher data acquisition unit 214 , a machine A learning unit 2151 , a learning model holding/inference unit 2152 , and a gas concentration feature value output unit 216 are provided.
- the machine learning unit 2151 and the learning model holding/inference unit 2152 constitute the gas concentration feature quantity estimation unit 215 .
- the inspection image acquisition unit 211 is a circuit that acquires pixel group inspection data of the gas distribution moving image (hereinafter sometimes referred to as "gas distribution pixel group inspection data") from the gas visualization imaging device 10.
- a device such as an image capture board can be used that captures image data into a processing device such as a computer.
- the inspection data of the gas distribution moving image is an infrared image captured by an infrared camera and sensitive to wavelengths of 3.2 to 3.4 ⁇ m. , a luminance signal indicating a gas existing region in the space so as to have a high concentration.
- the size of the image may be, for example, 320 ⁇ 256 pixels (vertical ⁇ horizontal).
- the inspection data of the gas distribution moving image is a moving image including time-series data of multiple frames. Gain adjustment, offset adjustment, image inversion processing, and the like may be performed as required for post-processing.
- the pixel group inspection data is inspection data in which the number of pixels in the vertical and horizontal directions is two or more, and the area is extracted from the inspection data of the gas distribution moving image. Further, the pixel group inspection data may be composed of pixel groups whose number is smaller than the number of pixels in the frame of the gas distribution moving image. The reason for this is that the smaller the number of pixels in the pixel group inspection data, the more areas can be extracted from one inspection image for learning, and the number of inspection image data for learning can be reduced. This is because, if the number of pixels of the inspection data is large, it will be necessary to prepare various background variations for learning.
- the time-series pixel group inspection data have a frame pixel count of 3 or more and 7 or less pixels in the vertical and horizontal directions, respectively.
- the pixel group inspection data may be 4 ⁇ 4 pixels in the vertical ⁇ horizontal direction, N frames (N is a natural number), or 10 frames per second (fps) for 10 seconds, where N is approximately 100 frames.
- FIG. 5(a) is a diagram showing a mode of time-series pixel group inspection data of a gas distribution moving image region-extracted from the inspection data of the gas distribution moving image.
- the gas type is a hydrocarbon gas such as methane gas
- the inspection data and pixel group inspection data of the gas distribution moving image captured by the infrared camera are as shown in FIG. 5(a).
- the gas temperature value inspection data acquisition unit 212 is a circuit that acquires the gas temperature value corresponding to the pixel group inspection data of the gas distribution image.
- the brightness value of the captured image is input, and for the gas temperature, the value obtained by converting the temperature value measured by the thermometer into the brightness value is input, but the temperature value may also be input.
- the gas temperature value may be a value obtained by converting the temperature measurement data obtained by measuring the temperature of the gas atmosphere using a thermometer TE at the time of capturing the gas distribution moving image into a brightness value.
- an average value of 4 ⁇ 4 pixels and N frames in time-series pixel group inspection data is used.
- the pixel group inspection data and gas temperature value inspection data are an image captured and measured under the same conditions and a temperature value related to the image.
- a data set consisting of pixel group inspection data and gas temperature value inspection data is output to the inference unit 2152 as inspection target data in the inference unit 2152 .
- the teacher image acquisition unit 213 is a circuit that receives an input of time-series pixel group teacher data of a gas distribution moving image that is region-extracted from the gas distribution moving image generated by the machine learning data generating device 30 .
- FIG. 5(b) shows a mode of time-series pixel group training data of a gas distribution moving image obtained by region extraction from the training data of the gas distribution moving image when a light absorptance image is used as the gas distribution moving image. It is a diagram.
- the time-series pixel group teacher data is an image having the same format as the pixel group inspection data generated by the gas visualization imaging device 10, and is a moving image including a plurality of frames of time-series data. is a statue.
- the time-series pixel group teacher data preferably has a frame pixel count of 3 or more and 7 or less pixels in the vertical and horizontal directions.
- the number of vertical ⁇ horizontal pixels may be 4 ⁇ 4, 10 frames per second (fps), 10 seconds, and N frames (N is a natural number), for example, N may be approximately 100 frames.
- learning is performed effectively by changing the number of frame pixels in the time-series pixel group training data according to the magnitude of the vibration noise. For example, in the case of 3 ⁇ 3 pixels, it is possible to learn the influence of vibration noise of less than 1 pixel on the top, bottom, left, and right. In the case of 4 ⁇ 4, it is possible to learn the influence of vibration noise up to about 1.5 pixels in the vertical and horizontal directions. In the case of 7 ⁇ 7 pixels, the influence of displacement of less than 3 pixels vertically and horizontally can be learned.
- the gas feature teacher data acquisition unit 214 obtains gas temperature value and gas concentration feature teacher data corresponding to the time-series pixel group teacher data region-extracted from the gas distribution moving image generated by the machine learning data generator 30. , are circuits for obtaining representative values for time-series pixel group teacher data.
- the time-series pixel group teacher data, the gas temperature value, and the gas concentration feature amount are images generated under the same conditions and parameters relating to the images.
- the temperature value may be an average value (an average value of N frames) corresponding to the time-series pixel group teacher data.
- a gas temperature value corresponding to the brightness of the time-series pixel group teacher data may be used as the gas temperature value. Further, the light absorption rate or the gas concentration thickness product corresponding to the time-series pixel group teacher data may be used as the gas concentration feature amount.
- the light absorption rate is the rate of light absorption when there is gas in the space, and is expressed as 0 to 1 when the state without gas is 0. Note that the optical absorptance can be converted into a concentration-thickness product by the spectral absorption coefficient of the gas. As shown in FIG. 5(b), for the light absorption rate and the density-thickness product, an average value (average value for 4 ⁇ 4 pixels ⁇ N frames) corresponding to the time-series pixel group teacher data may be used.
- a data set consisting of the teacher data of the time-series pixel group teacher data, the teacher data of the gas temperature value, and the teacher data of the gas concentration feature quantity is output to the machine learning unit 2151 .
- the teacher image acquisition unit 213 cuts out or enlarges it so that it has the same format. Processing such as reduction may be performed.
- the machine learning unit 2151 obtains the time-series pixel group teacher data obtained by region extraction from the teacher data of the gas distribution moving image received by the teacher image acquisition unit 213 and the time-series pixel group teacher data received by the gas feature quantity teacher data acquisition unit 214.
- This is a circuit that performs machine learning based on a data set consisting of gas temperature values and gas concentration feature values corresponding to data and generates an inference model.
- the inference model is formed to estimate the gas concentration feature of the gas distribution video based on the pixel group inspection data of the gas distribution video and the gas temperature value and gas concentration feature of the gas distribution video. .
- CNN convolutional neural network
- PyTorch PyTorch
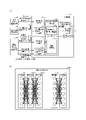
- FIG. 4(b) is a schematic diagram showing the outline of the logical configuration of the machine learning model.
- the machine learning model comprises an input layer 51, an intermediate layer 52-1, an intermediate layer 52-2, .
- the input layer 51 receives a 4 ⁇ 4 ⁇ 100 three-dimensional tensor into which the pixel values of the gas distribution moving image are input.
- the intermediate layer 52-1 is, for example, a convolution layer, and receives a 4 ⁇ 4 ⁇ 100 three-dimensional tensor generated from the data of the input layer 51 by convolution operation.
- the intermediate layer 52-2 is, for example, a pooling layer, and receives a three-dimensional tensor obtained by resizing the data of the intermediate layer 52-1.
- the intermediate layer 52-n is, for example, a fully connected layer, and converts the data of the intermediate layer 52-(n-1) into a two-dimensional vector indicating coordinate values.
- the configuration of the intermediate layers is an example, and the number n of intermediate layers is about 3 to 5, but the present invention is not limited to this. Also, in FIG. 4B, each layer is drawn with the same number of neurons, but each layer may have any number of neurons.
- the machine learning unit 2151 receives as input a data set consisting of time-series pixel group teacher data, teacher data of gas temperature values, and teacher data of gas concentration feature values, and performs learning with the gas concentration feature value as the correct answer to form a machine learning model. is generated and output to the learning model holding/inference unit 2152 .
- the machine learning unit 2151 may be implemented by a GPU and software when the gas concentration feature quantity estimation device 20 includes a GPU and a RAM as arithmetic devices.
- machine learning builds a processing system that can perform processing similar to human shape recognition and recognition of changes over time by automatically adjusting parameters such as convolution filtering used in image recognition through the learning process.
- specific frequency component data appearing in the time-series pixel group teacher data is extracted, and the brightness value, gas temperature value, and gas concentration feature of the specific frequency component data are extracted.
- an inference model for estimating the gas concentration feature amount corresponding to the pixel group inspection data can be constructed.
- the light absorptivity and the concentration-thickness product are parameters that can be calculated by estimating the background temperature with gas and the background temperature without gas from the time change for each pixel, as described in known literature, for example, Patent Literature 1. Therefore, the gas feature amount teacher data acquisition unit 214 is configured to acquire the average value of frames in the time-series pixel group teacher data as teacher data.
- FIG. 6(a) shows the mode of time-series pixel group data of the gas distribution moving image when there is no influence of mechanical vibration noise, and (b) shows the gas distribution when affected by mechanical vibration noise.
- FIG. 4 is a schematic diagram showing a mode of time-series pixel group data of a moving image
- FIG. 7(a) shows the time change of the luminance value in the time-series pixel group data of the gas distribution video when affected by mechanical vibration noise
- (b) shows the luminance value in the time-series pixel group data.
- It is a schematic diagram showing a position change of.
- the change in luminance under the influence of mechanical vibration noise is observed as a change in luminance in the same phase with the same timing of variation in the time direction, and the luminance value in the pixel group data
- the direction of change in is independent of the direction of gas flow, as shown in (b), and is usually in a different direction.
- FIG. 8(a) shows temporal changes in luminance values representing the gas distribution in the time-series pixel group data of the gas distribution moving image, and (b) shows positional changes in the luminance values representing the gas distribution in the time-series pixel group data.
- FIG. 8A the change in brightness representing the gas distribution is observed as a change in brightness accompanied by a timing (phase) shift due to gas flow. ) in the same direction as the gas flow direction.
- the learning model holding/inference unit 2152 holds the machine learning model generated by the machine learning unit 2151, performs inference using the machine learning model, and performs pixel group inspection of the gas distribution moving image acquired by the inspection image acquisition unit 211.
- This is a circuit that estimates and outputs gas concentration feature values corresponding to data.
- the light absorptance or the gas concentration thickness product is specified as the average value of the pixel group inspection data of the input gas distribution moving image and output as the gas concentration feature amount.
- the gas concentration feature quantity output unit 216 is a circuit that generates a display image for displaying the second image output by the learning model holding/inference unit 2152 on the display device 24 .
- FIG. 5(c) is a schematic diagram showing a mode of the gas concentration feature amount estimated from the time-series pixel group inspection data of the gas distribution moving image when the optical absorptance image is used as the gas distribution moving image. An average value of light absorptances of 4 ⁇ 4 pixels and N frames in the time-series pixel group inspection data is output.
- the optical absorptivity can be converted into a concentration-thickness product by the spectral absorption coefficient of the gas.
- the concentration-thickness product can be calculated directly by creating a trained model for a specific gas type, such as methane.
- a specific gas type such as methane.
- the concentration-thickness product of various gas species can be calculated.
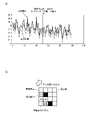
- FIGS. 9(a) to 9(d) are diagrams showing a method of calculating the concentration-thickness product from the light absorption rate.
- the method shown in FIG. 9(a) is a method of experimentally acquiring in advance data on the relationship between the light absorption rate and the concentration-thickness product for each gas type. For example, by measuring the light absorption rate using a gas cell filled with a gas of a predetermined concentration-thickness product and repeating the measurement while changing the concentration-thickness product of the sealed gas, the relationship data between the light absorption rate and the concentration-thickness product can be obtained. get. Then, the density-thickness product is obtained by interpolation processing using the obtained relationship data. An interpolation processing method such as spline interpolation may be used as the interpolation processing.
- An interpolation processing method such as spline interpolation may be used as the interpolation processing.
- relationship data between light absorptance and concentration-thickness product is experimentally acquired in advance for each gas type, mathematical parameter fitting is performed from the acquired relationship data, and light absorptance is This is a method of obtaining an approximation formula for calculating the concentration-thickness product.
- the black dots in FIG. 9(b) are data related to methane gas actually measured using a gas cell, and the black dotted line is the result of interpolation by an approximation formula obtained by fitting mathematical parameters based on the measured data. You can see what is being done.
- the method shown in FIG. 9(c) is a method of obtaining data on the relationship between the light absorption rate and the concentration-thickness product by theoretical calculation for gas species for which the light absorption line database can be used.
- the spectral absorption coefficient can be obtained in detail. can be obtained.
- the black dots in FIG. 9(c) are data on methane gas obtained using HITRAN, and the black solid line is the result of cubic spline interpolation. It can be seen that good interpolation is achieved by calculating the cubic spline coefficient with the intervals between the measurement points and obtaining the concentration-thickness product value corresponding to the light absorptance value.
- the relationship data between the light absorptance and the concentration thickness product is acquired by the same method as in FIG. 9(c), and the relationship data acquired by the same method as in FIG. Interpolate.
- the black dots in FIG. 9(d) are data related to methane gas obtained using HITRAN, and the black dotted line is the result of interpolation by an approximation formula obtained by fitting mathematical parameters based on this data. I know there is.
- the concentration-thickness product can be calculated by the same calculation method even when the gas type is different, such as propane gas.
- the concentration-thickness product of the output methane gas is converted to the light absorption rate by the above method, and then converted to the concentration-thickness product of propane gas as another gas species. It is also possible to
- the optical absorptance that does not depend on the gas type is calculated, and based on the calculated optical absorptance, the concentration thickness in the specific gas type You can find the product.
- the gas concentration feature amount is the gas concentration thickness product
- a method of directly obtaining the concentration thickness product specifying a specific gas type as the gas concentration feature amount may be adopted.
- the gas type is fixed, the accuracy can be improved and the calculation can be simplified.
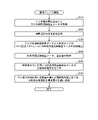
- FIG. 10 is a flowchart showing the operation of the gas concentration feature value estimation device 20 in the learning phase.
- a method for constructing an inference model for estimating the light absorption rate as the gas concentration feature amount will be described.
- the gas concentration-thickness product may be substituted for the optical absorptance in the following processing, and the concentration-thickness product may be estimated as the gas concentration feature quantity.
- gas distribution video teaching data is created based on the three-dimensional fluid simulation (step S110).
- the 3D optical reflectance image data may be based on a 3D optical illumination analysis simulation.
- 3D CAD Computer-Aided Design
- 3D concept modeling of gas equipment consider the structure model, and use commercially available 3D optical illumination analysis simulation software to create a 3D model.
- An optical illumination analysis simulation is performed, and the three-dimensional optical reflection image data obtained as the simulation result is converted into a two-dimensional image observed from a predetermined viewpoint position and generated.
- an image containing a region with gas and a region without gas is used using a subject with a background temperature difference.
- an image without vibration noise and an image with vibration noise are combined on the image to form learning data.
- the image with vibration noise is generated by vibrating the original background data in the plane direction by simulation to generate background data with vibration noise, and superimposing the gas distribution image on this background data with vibration noise. do.
- a region of time-series pixel group teacher data of a predetermined size (4 ⁇ 4 pixels ⁇ N frames) is extracted from the gas distribution image teacher data (step S120).
- the temperature value and light absorption rate of the gas corresponding to the time-series pixel group teacher data are calculated (step S130).
- the gas temperature value and light absorption rate may be average values of 4 ⁇ 4 pixels ⁇ N frames in time-series pixel group teacher data.
- the time-series pixel group teacher data is acquired as a training image by the teacher image acquiring unit 213, and the corresponding temperature value and light absorption rate are acquired by the gas feature amount teacher data acquiring unit 214 as correct data.
- image data that has undergone processing such as gain adjustment may be acquired as necessary.
- step S150 data is input to the convolutional neural network, machine learning is executed, and an inference model for estimating the light absorption rate is constructed (step S150). This allows deep learning to optimize the parameters by trial and error to form a machine-learned model.
- the formed machine-learned model is held in the learning model holding/inference unit 2152 .
- an inference model for estimating the light absorption rate is formed based on the characteristics of the time-series pixel group teacher data of the gas distribution image.
- FIG. 11 is a flow chart showing the operation of the gas concentration feature value estimation device 20 in the operation phase.
- the gas distribution moving image inspection data acquired by the gas visualization imaging device 10 is acquired (step S210), and the temperature value of the imaging environment is measured (step S220).
- the gas distribution moving image inspection image is an infrared image captured by the infrared camera of the gas visualization imaging device 10, and is a moving image showing the gas distribution in which the gas leakage portion to be inspected is visualized.
- a region of time-series pixel group inspection data of a predetermined size (4 ⁇ 4 pixels ⁇ N frames) is extracted from the gas distribution image data (step S230).
- a part of each frame of the captured image may be cut out so as to include all the pixels in which gas has been detected, and time-series pixel group inspection data may be generated as a frame of the gas distribution image.
- a data set consisting of a combination of time-series pixel group inspection data of gas distribution images and temperature values is acquired (step S240).
- the time-series pixel group inspection data is acquired as an image of an inspection object by the inspection image acquisition unit 211 , and the corresponding temperature value is acquired by the gas temperature value inspection data acquisition unit 212 .
- image data that has undergone processing such as gain adjustment may be acquired as necessary.
- the time-series pixel group inspection data is image data in the same format as the time-series pixel group teacher data, and consists of time-series data of a plurality of frames. Subtraction of offset components and gain adjustment may be performed on the inspection image.
- the learned model is used to calculate the estimated light absorption rate of the time-series pixel group inspection data (step S250).
- the time-series pixel group teacher data of the gas distribution image is input, and the light absorptance is estimated based on its features.
- the estimated optical absorptance is converted into a concentration-thickness product value (step S260).
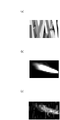
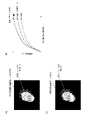
- FIG. 12(a) is an example of a gas distribution moving image to be inspected.
- the gas distribution moving image to be inspected is a time series in which a gas image corresponding to the light absorptance image in FIG. 12(b) is superimposed on a background image of a vertically extending rod-shaped object. It is one frame image of inspection data.
- the inspection image is 112 ⁇ 64 pixels long and wide, and 100 frames.
- vibration noise a high-pixel frame image is generated for each frame so that the amount of movement is an integer, and after the movement, the frame image is reduced to 112 ⁇ 64 pixels to give sub-pixel vibration deviation. .
- FIG. 12(a) is created by creating a background image with no gas with this vibration deviation, and then superimposing a gas image corresponding to the light absorptance image in FIG. 12(b).
- FIG. 12(b) is an example of an image to be inspected (correct image) of a light absorption image, and is a light absorption rate image of gas superimposed on the gas distribution moving image of FIG. 12(a). It is data of 16 pixels. Time-series pixel group inspection data having a 4 ⁇ 4 pixel area as one pixel can be extracted from this inspection target image.
- FIG. 12(c) is an example of the processing result of the light absorption image.
- Time-series pixel group inspection data of the light absorption rate image shown in FIG. 14387 (16-bit value) corresponding to the gas temperature is input to each region, the gas concentration feature amount is calculated, and one gas concentration feature amount image is output. This is data of 28 ⁇ 16 pixels per frame.
- the time-series pixel group inspection data and the teacher data of the gas distribution moving image are time-series pixel group inspection data in which the number of pixels in the vertical direction and the number of horizontal pixels are two or more, respectively.
- the learning data used in the learning phase can also be prepared using simulation.
- three-dimensional simulation of gas diffusion is performed using fluid simulation, and time-series changes in three-dimensional concentration distribution data of gas are obtained.
- the viewpoint is set at a predetermined position, and the concentration-thickness product of the gas (visual image) is scanned over an angular region that includes the space in which the gas exists, with respect to the three-dimensional concentration distribution data at a certain time.
- the integrated value of the density distribution on the line in the distance direction from the viewpoint) is obtained, and two-dimensional density-thickness product distribution data at that time, that is, a density-thickness product image is obtained.
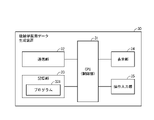
- FIG. 13 is a diagram showing the configuration of the machine learning data generation device 30.
- the machine learning data generation device 30 includes a control unit (CPU) 31, a communication unit 32, a storage unit 33, a display unit 34, and an operation input unit 35.
- the control unit 31 generates machine learning data. It is implemented as a computer that executes a generation program.
- the storage unit 33 stores the program 331 required for the operation of the machine learning data generation device 30, and also functions as a temporary storage area for temporarily storing the calculation results of the control unit 31.
- the communication unit 32 transmits and receives information to and from the machine learning data generation device 30 and the storage means 40 .
- the display unit 34 is, for example, a liquid crystal panel or the like, and displays a display screen generated by the CPU 31 .
- the control unit 31 implements the functions of the machine learning data generation device 30 by executing the machine learning data generation program 331 in the storage unit 33 .
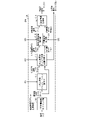
- FIG. 14 is a functional block diagram of the machine learning data generation device 30. As shown in FIG. The conditional parameters necessary for processing input in each functional block in FIG. 14(b) are as shown in the table below.
- the machine learning data generation device 30 includes a three-dimensional structure modeling unit 311, a three-dimensional fluid simulation execution unit 312, a two-dimensional single-view gas distribution image conversion processing unit 313, and a light absorption rate image conversion unit. 314 , a background image generation unit 315 , and a light intensity image generation unit 316 .
- the three-dimensional structure modeling unit 311 performs three-dimensional structure modeling for designing a three-dimensional structure model and laying out structures in a three-dimensional space based on an operation input from the operator to the operation input unit 35,
- the structure three-dimensional data DTstr is output to the subsequent stage.
- the structural three-dimensional data DTstr is shape data representing the three-dimensional shape of, for example, piping and other plant facilities.
- Commercially available three-dimensional CAD (Computer-Aided Design) software can be used for three-dimensional structure modeling.
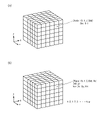
- FIG. 15(a) is a schematic diagram showing the data structure of the structure three-dimensional data DTstr.
- the X direction, Y direction, and Z direction in each drawing are defined as the width direction, the depth direction, and the height direction, respectively.
- the structure three-dimensional data DTstr is three-dimensional voxel data representing a three-dimensional space, and from the structure identification information Std arranged at coordinates in the X, Y, and Z directions, Configured. Since the structure identification information Std is expressed as three-dimensional shape data, it may be recorded as a binary image of 0 and 1, such as "with structure" and "without structure".
- the three-dimensional fluid simulation execution unit 312 acquires the structure three-dimensional data DTstr as an input, and further acquires the condition parameters CP1 required for the fluid simulation based on the operation input to the operation input unit 35 by the operator.
- the condition parameter CP1 is, for example, settings necessary for a fluid simulation mainly related to gas leakage, such as gas species, gas flow rate, gas flow velocity in three-dimensional space, shape, diameter, and position of the gas leakage source, as shown in Table 1. It is a parameter that defines conditions. It is possible to generate a large amount of learning data by generating images by changing many types of these condition parameters.
- the three-dimensional gas distribution image data DTgas is data including at least three-dimensional gas concentration distribution. Calculations are performed using commercially available three-dimensional fluid simulation software, such as ANSYS Fluent, Flo EFD, and Femap/Flow.
- FIG. 15(b) is a schematic diagram showing the data structure of the three-dimensional gas distribution image data DTgas.
- the three-dimensional gas distribution image data DTgas is three-dimensional voxel data representing a three-dimensional space, and gas concentration data of voxels arranged at coordinates in the X, Y, and Z directions.
- Dst (%) and may further include voxel gas flow velocity vector data Vc (Vx, Vy, Vz).
- the two-dimensional single-viewpoint gas distribution image conversion processing unit 313 receives and acquires the three-dimensional gas distribution image data DTgas of the gas leaking from the gas leakage source into the three-dimensional space. , a condition parameter CP2 required for conversion to a two-dimensional single-viewpoint gas distribution image is acquired.
- the condition parameter CP2 is a parameter related to the photographing conditions of the gas visualization imaging device, such as the angle of view of the imaging device, the line of sight direction, the distance, and the image resolution as shown in Table 1, for example.
- the two-dimensional single-viewpoint gas distribution image conversion processing unit 313 converts the three-dimensional gas distribution image data DTgas into two-dimensional gas distribution image data observed from a predetermined viewpoint position. As a result, a process of converting into density-thickness product image data DTdt as two-dimensional gas distribution image data is performed.
- the density-thickness product image DTdt is an image corresponding to an inspection image in which leaked gas is captured by the gas visualization imaging device 10, and is an image representing how the gas can be seen from a viewpoint. Furthermore, by considering the information of the structure three-dimensional data DTstr, it is possible to generate the gas concentration thickness product image data DTdt that does not reflect the gas image that is blocked by the structure and cannot be observed from the viewpoint.
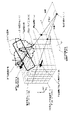
- FIG. 16 is a schematic diagram for explaining the outline of the concentration/thickness calculation method in the three-dimensional single-viewpoint gas distribution image conversion process.
- FIG. 4 is a conceptual diagram of a method for generating product image data DTdt;
- the two-dimensional single-viewpoint gas distribution image conversion processing unit 313 spatially integrates the three-dimensional gas concentration image indicated by the three-dimensional gas distribution image data DTgas in the line-of-sight direction from a preset viewpoint position (X, Y, Z).
- a plurality of values of the thickness product Dst are generated by changing the angles ⁇ and ⁇ of the line-of-sight direction, and the obtained values of the density-thickness product Dst are arranged two-dimensionally to generate the density-thickness product image data DTdt.
- an arbitrary viewpoint position SP (X, Y, Z) is set in a three-dimensional space, and three-dimensional gas distribution image data DTgas is obtained from the viewpoint position SP (X, Y, Z).
- a virtual image plane VF is set at a position separated by a predetermined distance in the direction of the three-dimensional gas concentration image indicated by .
- the virtual image plane VF is set so that the center O intersects a straight line passing through the viewpoint position SP (X, Y, Z) and the center voxel of the three-dimensional gas distribution image data DTgas.
- the image frame of the virtual image plane VF is set according to the angle of view of the gas visualization imaging device 10 .
- the line-of-sight direction DA from the viewpoint position SP (X, Y, Z) to the target pixel A (x, y) on the virtual image plane VF is the line-of-sight direction DO toward the central pixel O, that is, the gas visualization imaging device with respect to the line-of-sight direction DO in the X direction at an angle ⁇ and in the Y direction at an angle ⁇ .
- the gas concentration distribution data corresponding to the voxel of the three-dimensional gas distribution image intersecting the line of sight is spaced in the line-of-sight direction DA with respect to the voxel intersecting the line of sight.
- the value of the gas concentration thickness product for the pixel of interest A(x, y) is calculated.
- the position of the target pixel A (x, y) is gradually moved, and all the pixels on the virtual image plane VF become the target pixel.
- the concentration thickness product image data DTdt is calculated.
- FIG. 17 is a schematic diagram for explaining the outline of the density/thickness integration calculation method under the condition that a structure exists in the three-dimensional single-viewpoint gas distribution image conversion process. 10 indicates the case where observation is not possible.
- the target pixel A is calculated by a method that does not perform spatial integration of the gas concentration distribution that exists behind the structure when viewed from the viewpoint position SP (X, Y, Z).
- the value of the gas concentration thickness product is calculated for (x, y).
- the time-series data of the density-thickness product image is converted into the time-series data of the light absorptance image using the spectral absorption coefficient data of the gas species set during the simulation.
- the light absorption rate image conversion unit 314 acquires the condition parameter CP3 based on the operation input, further converts the gas concentration thickness product image data DTdt into the light absorption rate image data DT ⁇ , and outputs the data to the subsequent stage.
- FIG. 18A is a schematic diagram showing an outline of density-thickness product image data
- FIG. 3A and 3B are schematic diagrams showing an outline of light absorptance image data
- the gas concentration thickness product value Dt at the pixel (x, y) in the gas concentration thickness product image data DTdt shown in FIG. the relationship between the gas concentration thickness product and the light absorptance ⁇ is used to calculate the light absorptance value ⁇ corresponding to the gas concentration thickness product in the pixel (x, y) shown in FIG. 18(c).
- the optical absorptance ⁇ differs depending on the gas type specified by the condition parameter CP3, and the relationship data between the concentration-thickness product value Dt and the optical absorptivity ⁇ , for example, the gas concentration-thickness product value Dt stored in a data table or the like is used.
- the relationship between the value Dt of the gas concentration thickness product for each gas type and the light absorptance ⁇ may be acquired in advance by actual measurement.
- an image equivalent to the captured image is generated using the obtained time-series data of the light absorptance image and a predetermined background image.
- the background image is composed of the same number of frames as the light absorptance image, and is constructed so that the brightness of the image is constant or varies over time. Also, the pattern in one frame may be full-screen filling, or may have different brightness set for each small area.
- the light absorptance can be obtained from the time-series data of the light absorptance image described above by extracting regions and averaging in the spatial and temporal directions.
- the above is the method of preparing learning data using simulation.
- the background image generation unit 315 acquires the background part data PTbk and the condition parameter CP5 based on the operation input, and generates the background image data DTIback.
- FIG. 19(a) is a schematic diagram showing an overview of the three-dimensional structure data.
- the structure three-dimensional data DTstr is three-dimensional voxel data representing a three-dimensional space.
- a value indicating the classification of the structure surface is assigned to each pixel and recorded as a multivalued image such as 0, 1, 2, 3, .
- the structure identification information Std made up of this multi-valued image is subjected to two-dimensional single-view conversion processing using the virtual image plane VF observed from the viewpoint position SP (X, Y, Z) as the image frame. Background part data PTbk is generated.
- FIG. 19(b) is a schematic diagram showing an overview of the extracted background part data PTbk.
- the background classification Std is, for example, a classification number classified based on the optical characteristics of the surface of the structure. For example, it may be set such that 1 is unpainted piping, 2 is painted, and 3 is concrete.
- FIG. 19(c) is a conceptual diagram showing a method of generating background image data DTIback based on background part data PTbk. As shown in FIG. 19(c), the background image data DTIback is generated based on the background part data PTbk generated as a multivalued image and the condition parameter CP5 based on the operation input.
- the condition parameter CP5 is the lighting conditions for the structure, such as the background two-dimensional temperature distribution, the background surface spectral emissivity, the background surface spectral reflectance, the illumination light wavelength distribution, the spectral illuminance, and the illumination angle, as shown in Table 1. , is the temperature condition of the structure itself.
- the background image data DTIback is generated by assigning different condition parameters CP5 for each background classification Std.
- the background image data DTIback is generated by applying different conditions for each background classification Std depending on whether the background is present or not.
- the light intensity image generation unit 316 generates light intensity image data DTI based on the light absorption rate image data DT ⁇ , the background image data DTIback, and the gas temperature condition provided as the condition parameter CP4 based on the operation input.
- FIG. 20(a) is a schematic diagram showing an outline of the background image data DTIback
- (b) is a schematic diagram showing an outline of the light absorptance image data DT ⁇
- (c) is a schematic diagram showing an outline of the light intensity image data. It is a diagram.
- DTIback (x, y) is the infrared intensity at the coordinates (x, y) of the background image
- Igas is the blackbody radiance corresponding to the gas temperature
- the light absorption rate is at the coordinates (x, y) of the light absorption rate image.
- DT ⁇ (x, y) the infrared intensity DTI(x, y) at the coordinates (x, y) of the light intensity image is calculated by Equation (1).
- the light intensity image generator 316 calculates the coordinates (x, y ) to calculate the infrared intensity DTI(x,y). As a result, along the line-of-sight direction DA corresponding to the target pixel A (x, y), the infrared radiation emitted by the background structure and the infrared radiation emitted by the gas existing in the voxels of the three-dimensional gas distribution image intersecting the line of sight are detected. The summation of radiation can be calculated.
- the infrared intensity DTI (x, y) is calculated for all pixels A (x, y) on the virtual image plane VF to generate the light intensity image data DTI.
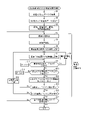
- FIG. 21 is a flowchart showing an overview of the two-dimensional single-viewpoint gas distribution image conversion process. The processing is executed by a two-dimensional single-viewpoint gas distribution image conversion processing unit 313 whose function is configured by the control unit 31 .
- the two-dimensional single-viewpoint gas distribution image conversion processing unit 313 acquires structure three-dimensional data DTstr (step S1), and further acquires three-dimensional gas distribution image data DTgas (step S2).
- step S1 structure three-dimensional data DTstr
- step S2 three-dimensional gas distribution image data DTgas
- step S3 input of information regarding, for example, the angle of view of the imaging device, the line-of-sight direction, the distance, and the image resolution is accepted as the condition parameter CP2 (step S3).
- the viewpoint position SP X, Y, Z
- the viewpoint position SP corresponding to the position of the imaging portion of the gas visualization imaging device 10 is set within the three-dimensional space (step S4).
- a virtual image plane VF is set at a predetermined distance in the direction of the three-dimensional gas concentration image from the viewpoint position SP (X, Y, Z). It is calculated according to the angle of view of the imaging device 10 (step S5).
- step S6 the coordinates of the target pixel A (x, y) are set to the initial values (step S6), and the target pixel A (x, y) on the virtual image plane VF from the viewpoint position SP (X, Y, Z).
- step S7 A position LV on the directed line of sight is set to an initial value (step S7).
- step S10 it is determined whether or not there is a voxel of the three-dimensional gas distribution image data DTgas that intersects with the line of sight. (for example, 1) (step S11) and returns to step S8. If there is a voxel that intersects with the line of sight, the density thickness value Dst of that voxel is read, and the integral stored in the addition register or the like is The sum with the value Dsti is stored as a new integral value Dsti in an addition register or the like (step S12).
- step S13 it is determined whether or not the total length of the line of sight corresponding to the range where the line of sight intersects with the voxel has been calculated. If not, the position LV on the line of sight is incremented by the unit length. Then (step S14), the process returns to step S8, and if completed, along the line-of-sight direction DA corresponding to the target pixel A (x, y), voxels of the three-dimensional gas distribution image that intersect the line of sight are displayed.
- the gas concentration distribution data is spatially integrated to calculate the value of the gas concentration thickness product for the target pixel A(x, y).
- step S15 it is determined whether or not the calculation of the gas concentration thickness product value has been completed for all the pixels on the virtual image plane VF (step S15). ) is gradually moved (step S16), the process returns to step S7, and if completed, the value of the gas concentration thickness product is calculated for all pixels on the virtual image plane VF, and the virtual image plane VF A gas concentration thickness product image DTdt is generated as two-dimensional gas distribution image data for .
- step S17 it is determined whether or not generation of the gas concentration thickness product image DTdt has been completed for all viewpoint positions SP (X, Y, Z) to be calculated (step S17). Returning to S4, the gas concentration thickness product image DTdt is generated for the newly input viewpoint position SP (X, Y, Z).
- FIG. 22 is a flowchart showing an outline of background image generation processing. The processing is executed by the background image generation unit 315 whose function is configured by the control unit 31 .
- the background image generation unit 315 acquires the structure three-dimensional data DTstr (step S1).
- the operations of steps S3 to S8 are the same as the operations of each step in FIG.
- step 8 when the background part data PTbk of the voxel that intersects the line of sight is "with structure", the background classification Std of the background part data PTbk is acquired (step S121A), and the condition parameter CP5 corresponding to the background classification Std is obtained. is input (step S122A) to determine the background image data value of the pixel A of interest, the position of the pixel A (x, y) of interest is gradually moved (step S9), and the process returns to step S7.
- the condition parameter CP5 is, for example, conditions such as background two-dimensional temperature distribution, background surface spectral emissivity, background surface spectral reflectance, illumination light wavelength distribution, spectral illuminance, and illumination angle.
- step S13 it is determined whether or not the calculation for the total length of the line of sight corresponding to the range where the line of sight intersects with the voxel has been completed.
- step S14 the position LV on the line is incremented by the unit length (step S14), and the process returns to step S8.
- step S15 the standard value set when there is no structure is determined as the background image data value for the target pixel A, and whether the calculation for all pixels on the virtual image plane VF is completed. It is determined whether or not (step S15), and if not completed, the position of the target pixel A (x, y) is gradually moved (step S16), and the process returns to step S7. End the process.
- the standard value set when there is no structure is, for example, a background image data value corresponding to the ground or sky in real space.
- a standard value can be obtained by appropriately setting the condition indicated by the condition parameter CP5.
- the background classification Std of the background part data PTbk is obtained for all pixels on the virtual image plane VF, and the background image data DTIback for the virtual image plane VF is generated.
- FIG. 23 is a flowchart showing an overview of the light intensity image data generation process.
- the background image data DTIback (x, y) and the light absorptance image data DT ⁇ (x, y) regarding the virtual image plane VF are acquired (steps S101 and 102), and the condition parameter CP4 regarding the gas temperature condition is input (step S103).
- step S104 the black body radiance Igas corresponding to the gas temperature is acquired (step S104), the infrared intensity DTI (x, y) of the light intensity image is calculated by (Equation 1) (step S105), and the light intensity image
- Equation 1 the infrared intensity DTI (x, y) of the light intensity image is calculated by (Equation 1) (step S105), and the light intensity image
- the data is output as data DTI (step S106), and the process ends.
- the light intensity image data DTI generated by the machine learning data generation device 30 is used as a gas distribution moving image, and the gas concentration feature amount calculated from the light absorptance image data Dt ⁇ or the gas concentration thickness product image DTdt is a gas concentration feature. It can be used as teacher data for machine learning used in the quantity estimation device 20 .
- an input such as a gas leak image and gas leak source position coordinate information in this example
- a correct output It is possible to efficiently generate tens of thousands of sets of learning data, which can contribute to improvement of learning accuracy.
- the machine learning model can contribute to the improvement of learning accuracy.
- the machine learning model in the gas leakage detection device can contribute to further improvement in learning accuracy.
- a gas concentration feature value estimating device is a gas concentration feature quantity estimation device having two or more vertical and horizontal pixels each extracted from inspection data of a gas distribution moving image representing an existing region of gas in space.
- an inspection data acquiring unit for acquiring time-series pixel group inspection data of the distribution video and the temperature value of the gas; and time-series pixel group teacher data of the gas distribution video of the same size as the time-series pixel group inspection data.
- the time-series pixel group inspection acquired by the inspection data acquisition unit using an inference model machine-learned using gas temperature values and gas concentration feature values corresponding to the time-series pixel group teacher data as teacher data.
- an estimating unit that calculates the gas concentration feature quantity corresponding to the data.
- the time-series pixel group inspection data may have a frame pixel number smaller than the frame pixel number of the gas distribution moving image.
- the time-series pixel group inspection data may have a frame pixel count of 3 or more and 7 or less in the vertical and horizontal directions.
- the time-series pixel group teacher data may be a moving image including vibration noise.
- the gas concentration feature amount is an optical absorptance, and further, based on the relationship characteristic between the optical absorptance of the gas species and the concentration thickness product, the time series A configuration may be provided that includes a conversion unit that converts the light absorptance corresponding to the pixel group inspection data into a concentration thickness product value related to the gas type.
- the gas concentration feature amount may be a gas concentration thickness product.
- the gas distribution moving image may be an image captured by an imaging device.
- the teaching data of the gas distribution moving image may be generated by simulation.
- the teacher data of the gas distribution moving image may be generated from a background image and a light absorptance.
- the number of frames in the time-series pixel group inspection data or the time-series pixel group teacher data is greater than the number of vertical or horizontal pixels in each frame.
- the gas concentration feature amount corresponding to the time-series pixel group inspection data is a sequence of values calculated for each frame of the time-series pixel group inspection data. A certain configuration may be used.
- the gas concentration feature amount corresponding to the time-series pixel group inspection data is an average value of values calculated for each frame of the time-series pixel group inspection data.
- a certain configuration may be used.
- the imaging device may be an infrared camera.
- the number of vertical and horizontal pixels extracted from the inspection data of the gas distribution moving image representing the gas existing region in space is 2 or more.
- Time-series pixel group inspection data of a certain gas distribution video and the temperature value of the gas are acquired, and time-series pixel group teacher data of the gas distribution video having the same size as the time-series pixel group inspection data and the time-series pixel group inspection data are acquired.
- the gas concentration feature value corresponding to the time-series pixel group inspection data acquired using an inference model machine-learned using the gas temperature value and the gas concentration feature value value corresponding to the sequence pixel group teacher data as teacher data. may be configured to calculate an estimated value of .
- a program is a program that causes a computer to perform a gas concentration feature amount estimation process, wherein the gas concentration feature amount estimation process includes a gas distribution moving image representing a gas existing region in space.
- the gas concentration feature amount estimation process includes a gas distribution moving image representing a gas existing region in space.
- the gas concentration feature value inference model generation device includes two pixels each in the vertical and horizontal directions extracted from teacher data of a gas distribution video representing an existing region of gas in space.
- a teacher data acquisition unit configured to acquire, as teacher data, the time-series pixel group teacher data of the gas distribution moving image, and the gas temperature value and the gas concentration feature quantity value corresponding to the time-series pixel group teacher data. and time-series pixel group inspection data having the same size as the time-series pixel group teacher data, and an estimated value of the gas concentration feature amount corresponding to the gas temperature value corresponding to the time-series pixel group inspection data, which are combined into the teacher data. and a machine learning unit that constructs an inference model calculated based on the above.
- the gas moving image teacher data acquired by the gas concentration feature quantity estimation device 20 is generated by simulation using the machine learning data generation device 30 as an example.
- the gas moving image training data an actual image captured by the gas visualization imaging device 10 may be used.
- the temperature value can be the temperature measurement result of the imaging atmosphere
- the teaching data of the gas concentration feature amount can be the value calculated based on the brightness of the moving gas teaching image.
- the time element is 100 frames
- the pixel element is 4 ⁇ 4
- machine learning is performed in which the weight of the time element is relatively increased.
- the configuration is given as an example. However, it may be configured such that the pixel element is relatively increased with respect to the time element.
- the present invention may be a computer system comprising a microprocessor and memory, the memory storing the computer program, and the microprocessor operating according to the computer program.
- it may be a computer system that has a computer program for processing in the system of the present disclosure or its components, and that operates according to this program (or instructs each connected part to operate).
- the present invention also includes the case where all or part of the processing in the system or its constituent elements is configured by a computer system configured with a microprocessor, a recording medium such as ROM and RAM, a hard disk unit, and the like.
- the RAM or hard disk unit stores a computer program that achieves the same operations as the above devices. Each device achieves its function by the microprocessor operating according to the computer program.
- a system LSI is an ultra-multifunctional LSI manufactured by integrating multiple components on a single chip. Specifically, it is a computer system that includes a microprocessor, ROM, RAM, etc. . These may be made into one chip individually, or may be made into one chip so as to include part or all of them.
- the RAM stores a computer program that achieves the same operations as those of the above devices.
- the system LSI achieves its functions by the microprocessor operating according to the computer program.
- the present invention also includes a case where processing in a system or its components is stored as an LSI program, and this LSI is inserted into a computer to execute a predetermined program.
- the method of circuit integration is not limited to LSI, and may be realized with a dedicated circuit or a general-purpose processor.
- An FPGA Field Programmable Gate Array
- a reconfigurable processor that can reconfigure the connections and settings of circuit cells inside the LSI may be used.
- part or all of the functions of the system or its constituent elements according to each embodiment may be implemented by a processor such as a CPU executing a program. It may be a non-transitory computer-readable recording medium in which a program for executing the operation of the system or its components is recorded. By recording the program and signals on a recording medium and transferring the program, the program may be executed by another independent computer system. It goes without saying that the above program can be distributed via a transmission medium such as the Internet.
- each component thereof may be configured by a programmable device such as a CPU, a GPU (Graphics Processing Unit), or a processor, and software.
- a programmable device such as a CPU, a GPU (Graphics Processing Unit), or a processor, and software.
- These components can be single circuit components or aggregates of multiple circuit components. Also, a plurality of components can be combined to form a single circuit component, or a plurality of circuit components can be aggregated.
- Division of functional blocks is just an example. good. Also, the functions of multiple functional blocks having similar functions may be processed by a single piece of hardware or software in parallel or in a time-sharing manner.
- gas concentration feature value estimation device gas concentration feature value estimation method, program, and gas concentration feature value inference model generation device according to the present disclosure are widely applicable to estimation of gas concentration feature values using an infrared imaging device.
- gas concentration feature quantity estimation system 10 gas visualization imaging device 20 gas concentration feature quantity estimation device 21 control unit 210 gas leakage position identification device 211 inspection image acquisition unit 212 gas temperature value inspection data acquisition unit 213 teacher image acquisition unit 214 gas feature quantity Teacher data acquisition unit 215 Gas concentration feature amount estimation unit 2151 Machine learning unit 2152 Learning model holding/inference unit 216 Gas concentration feature amount output unit 22 Communication circuit 23 Storage device 24 Display device 25 Operation input unit 30 Machine learning data generation device 31 Control unit (CPU) 311 three-dimensional structure modeling unit 312 three-dimensional fluid simulation execution unit 313 two-dimensional single-viewpoint gas distribution image conversion processing unit 314 light absorption rate image conversion unit 315 background image generation unit 316 light intensity image generation unit 32 communication unit 33 storage unit 34 Display unit 35 Operation input unit 40 Storage means
Abstract
Description
<ガス濃度特徴量推定システム1の構成>
本開示の実施の形態は、ガス設備のガス漏れ検査画像からガス漏れを分析する、ガス濃度特徴量システム1として実現される。以下、実施の形態に係るガス濃度特徴量システム1について、図面を用いて詳細に説明する。
ガス可視化撮像装置10は、赤外線を用いて監視対象を撮像し、ガスが可視化された赤外線画像を提供する装置またはシステムであって、ガス設備等に設置された設置型、検査者が持ち運ぶことが可能なポータブル型、ドローン搭載型等の態様がある。ガス可視化撮像装置10は、例えば、赤外線を検知して撮像する赤外線カメラからなる撮像手段(不図示)、通信ネットワークNに出力するインターフェイス回路(不図示)を備える。
記憶手段40は、ガス可視化撮像装置10から送信される検査画像を記憶する記憶装置であり、例えばハードディスクなどの不揮発性メモリを含んで構成され、検査画像及び光吸収率画像をガス可視化撮像装置10の識別情報と関連付けた状態で保存する。管理者は、管理端末(不図示)等に用いて記憶手段40から赤外線画像を読み出して、閲覧対象の赤外線画像の状態を把握することができる。
ガス濃度特徴量推定装置20は、ガス可視化撮像装置10から監視対象を撮像した検査画像を取得し、検査画像に基づいてガス特徴量の推定を行い、表示器24を通じてユーザにガス検知を通知する装置である。ガス濃度特徴量推定装置20は、例えば、一般的なCPU(Central Processing Unit)とRAM(Random Access Memory)と、これらで実行されるプログラムを備えるコンピュータとして実現される。なお、後述するように、ガス濃度特徴量推定装置20は、演算装置としてのGPU(Graphics Processing Unit)とRAMをさらに備えてもよい。
図4(a)は、制御部21の機能ブロック図である。
ガス濃度特徴量出力部216は、学習モデル保持・推論部2152が出力した第2の画像を表示器24に表示するための表示画像を生成する回路である。図5(c)は、ガス分布動画像として光吸収率画像を用いたときの、ガス分布動画像の時系列画素群検査データから推定されたガス濃度特徴量の態様を示す模式図である。時系列画素群検査データにおける4×4画素、Nフレームの光吸収率の平均値が出力される。
以下、図面を用いて、本実施の形態におけるガス濃度特徴量推定装置20の動作について説明する。
以下、実施の形態に係るガス濃度特徴量推定装置を用いて性能評価試験を行った。以下、その結果について、画像を用いて説明する。
以上説明したように、本実施の形態では、複数の画素群からなる時系列情報を利用することにより、機械的な振動ノイズによる輝度変化とガスの流れによる輝度変化とを区別できる。これより、機械的な振動ノイズによってタイミングが揃っているのか、ガスの流れの影響で位相が揃っていないか判別できるだけの数の画素の情報を用いて機械学習させることで機械的な振動ノイズの影響を低減することができる。
次に、機械学習用データ生成装置30の構成について説明する。
学習フェーズで用いる学習データはシミュレーションを利用して準備することもできる。まず流体シミュレーションを用いてガス拡散についての3次元シミュレーションを行い、ガスの3次元的な濃度分布データの時系列変化を求める。次に、所定の位置に視点を設定し、ある時刻の3次元的な濃度分布データに対して、ガスが存在する空間を含むような角度領域にわたって視線を走査しながらガスの濃度厚み積(視線上にある濃度分布の、視点からの距離方向の積分値)を求め、その時刻の2次元的な濃度厚み積分布データ、すなわち濃度厚み積画像を得る。時刻を変化させながら上述の処理を繰り返すことで複数の濃度厚み積画像フレームからなる時系列データを得ることができる。
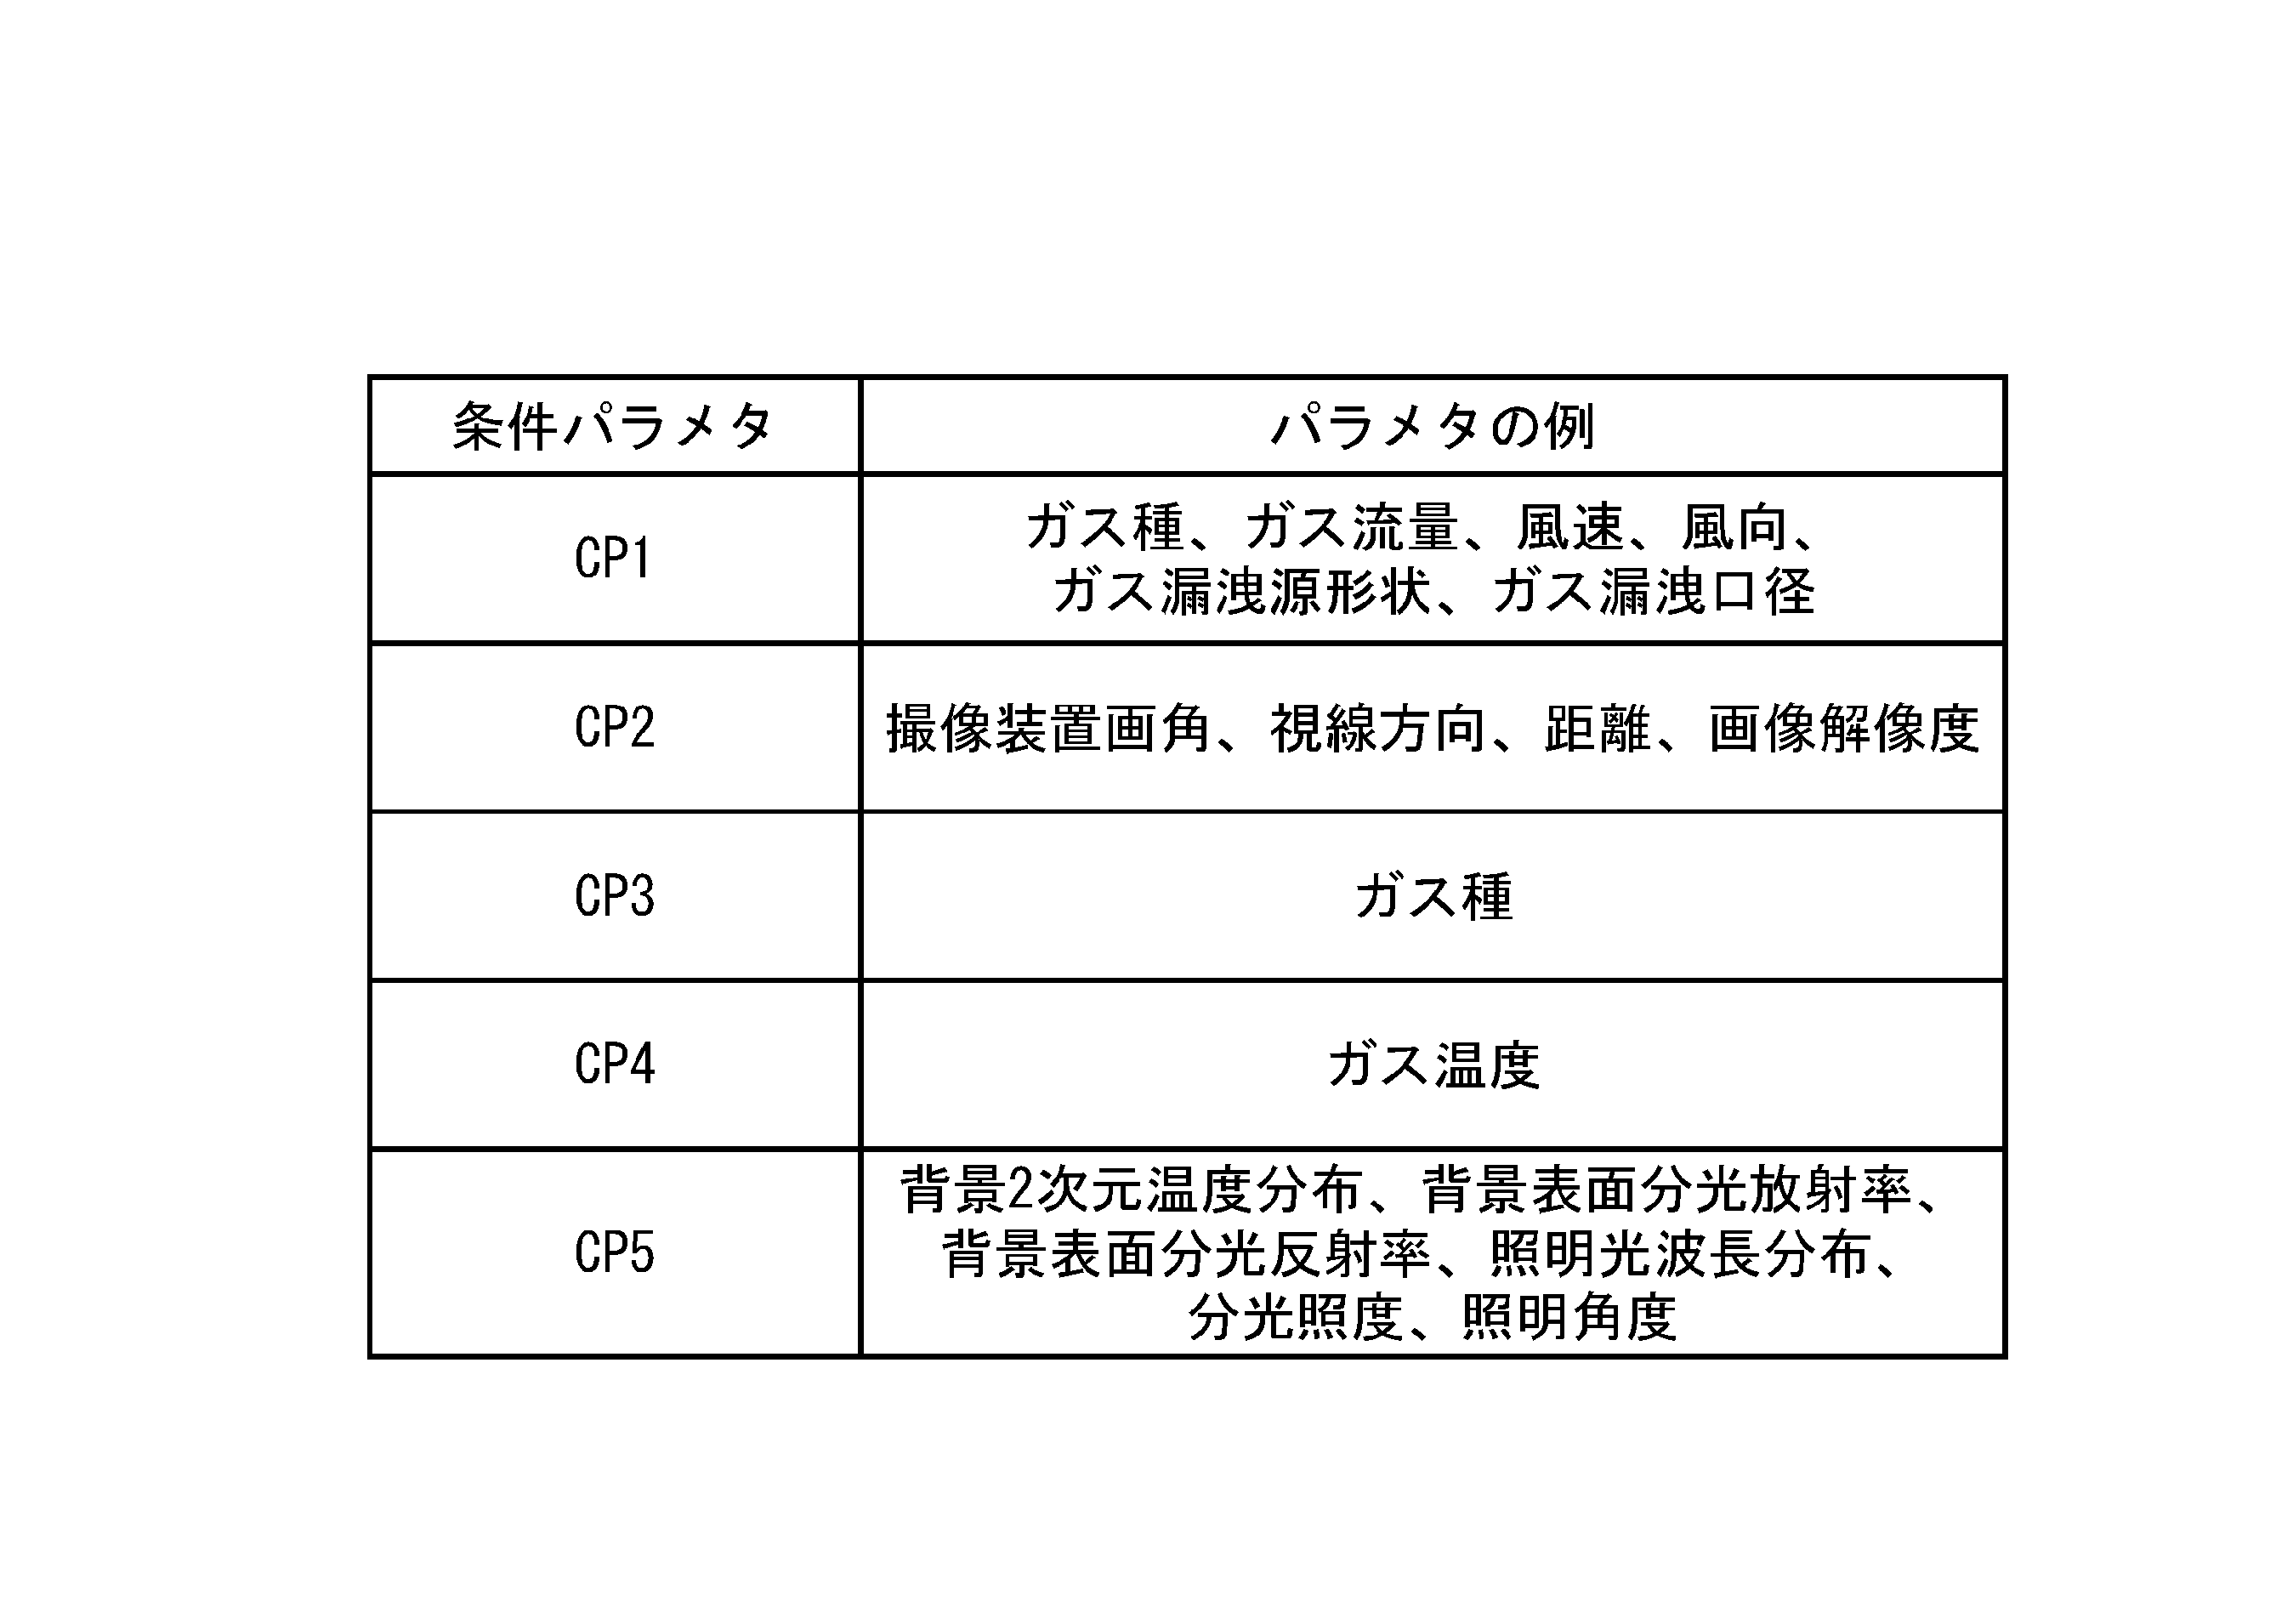
次に、シミュレーション時に設定したガス種の分光吸収係数データを用いて濃度厚み積画像の時系列データを光吸収率画像の時系列データに変換する。
次に、求められた光吸収率画像の時系列データと所定の背景画像を用いて、撮像画像相当の画像を生成する。背景画像は光吸収率画像と同数のフレームから構成されており、画像の輝度が時系列にわたって一定、あるいは変化するように構成されている。また、1つのフレーム内のパターンは全画面塗りつぶしの場合もあれば、小領域ごとに異なる輝度が設定される場合もある。

次に、図面を用いて、機械学習用データ生成装置30における2次元単視点ガス分布画像変換処理動作を説明する。
次に、図面を用いて、機械学習用データ生成装置30における背景画像生成処理動作を説明する。
次に、図面を用いて、機械学習用データ生成装置30における光強度画像データ生成処理動作を説明する。
以上により、機械学習用データ生成装置30により生成された光強度画像データDTIをガス分布動画像とし、光吸収率画像データDtα又はガス濃度厚み積画像DTdtから算出したガス濃度特徴量をガス濃度特徴量推定装置20に用いる機械学習用教師データとして用いることができる。
本開示の一態様に係るガス濃度特徴量推定装置は、空間中におけるガスの存在領域を表すガス分布動画像の検査データから領域抽出された、縦及び横の画素数がそれぞれ2以上であるガス分布動画像の時系列画素群検査データと、前記ガスの温度値とを取得する検査データ取得部と、前記時系列画素群検査データと同一サイズのガス分布動画像の時系列画素群教師データと、前記時系列画素群教師データに対応するガス温度値及びガス濃度特徴量の値とを教師データとして機械学習された推論モデルを用いて、前記検査データ取得部が取得した前記時系列画素群検査データに対応する前記ガス濃度特徴量を算出する推定部とを備えたことを特徴とする。さらに、前記時系列画素群検査データは、前記ガス分布動画像のフレームの画素数よりも少ないフレーム画素数を有する構成としてもよい。
群教師データと、前記時系列画素群教師データに対応するガス温度値及びガス濃度特徴量の値とを教師データとして機械学習された推論モデルを用いて、取得した前記時系列画素群検査データに対応する前記ガス濃度特徴量の推定値を算出する構成としてもよい。
以上、実施の形態に係るガス濃度特徴量推定システム1について説明したが、本開示は、その本質的な特徴的構成要素を除き、以上の実施の形態に何ら限定を受けるものではない。例えば、実施の形態に対して当業者が思いつく各種変形を施して得られる形態や、本発明の趣旨を逸脱しない範囲で各実施の形態における構成要素及び機能を任意に組み合わせることで実現される形態も本開示に含まれる。以下では、そのような形態の一例として、上記した実施の形態の変形例を説明する。
以上で説明した実施の形態は、いずれも本発明の好ましい一具体例を示すものである。実施の形態で示される数値、形状、材料、構成要素、構成要素の配置位置及び接続形態、工程、工程の順序などは一例であり、本発明を限定する主旨ではない。また、実施の形態における構成要素のうち、本発明の最上位概念を示す独立請求項に記載されていない工程については、より好ましい形態を構成する任意の構成要素として説明される。
10 ガス可視化撮像装置
20 ガス濃度特徴量推定装置
21 制御部
210 ガス漏洩位置同定装置
211 検査画像取得部
212 ガス温度値検査データ取得部
213 教師画像取得部
214 ガス特徴量教師データ取得部
215 ガス濃度特徴量推定部
2151 機械学習部
2152 学習モデル保持・推論部
216 ガス濃度特徴量出力部
22 通信回路
23 記憶装置
24 表示器
25 操作入力部
30 機械学習用データ生成装置
31 制御部(CPU)
311 3次元構造物モデリング部
312 3次元流体シミュレーション実行部
313 2次元単視点ガス分布画像変換処理部
314 光吸収率画像変換部
315 背景画像生成部
316 光強度画像生成部
32 通信部
33 記憶部
34 表示部
35 操作入力部
40 記憶手段
Claims (16)
- 空間中におけるガスの存在領域を表すガス分布動画像の検査データから領域抽出された、縦及び横の画素数がそれぞれ2以上である時系列画素群検査データと、前記ガスの温度値とを取得する検査データ取得部と、
前記時系列画素群検査データと同一サイズのガス分布動画像の時系列画素群教師データと、前記時系列画素群教師データに対応するガス温度値及びガス濃度特徴量の値とを教師データとして機械学習された推論モデルを用いて、前記検査データ取得部が取得した前記時系列画素群検査データに対応する前記ガス濃度特徴量を算出する推定部とを備えた
ガス濃度特徴量推定装置。 - 前記時系列画素群検査データは、前記ガス分布動画像のフレームの画素数よりも少ないフレーム画素数を有する、
請求項1に記載のガス濃度特徴量推定装置。 - 前記時系列画素群検査データは、縦及び横の画素数がそれぞれ3以上7以下のフレーム画素数を有する、
請求項2に記載のガス濃度特徴量推定装置。 - 前記時系列画素群教師データは、振動ノイズを含む動画像である、
請求項1から3の何れか1項に記載のガス濃度特徴量推定装置。 - 前記ガス濃度特徴量は、光吸収率であり、
さらに、ガス種の光吸収率と濃度厚み積との関係性特性に基づき、前記時系列画素群検査データに対応する前記光吸収率を前記ガス種に関する濃度厚み積値に変換する変換部を備えた
請求項1から4の何れか1項に記載のガス濃度特徴量推定装置。 - 前記ガス濃度特徴量は、ガス濃度厚み積である
請求項1に記載のガス濃度特徴量推定装置。 - 前記ガス分布動画像は撮像装置により撮像された画像である
請求項1から6の何れか1項に記載のガス濃度特徴量推定装置。 - 前記ガス分布動画像の教師データは、シミュレーションにより生成される
請求項1から7の何れか1項に記載のガス濃度特徴量推定装置。 - 前記ガス分布動画像の教師データは、背景画像と光吸収率から生成される
請求項1から8の何れか1項に記載のガス濃度特徴量推定装置。 - 前記時系列画素群検査データ又は前記時系列画素群教師データにおけるフレーム数は、各フレームにおける縦又は横の画素数よりも多い
請求項1から9の何れか1項に記載のガス濃度特徴量推定装置。 - 前記時系列画素群検査データに対応する前記ガス濃度特徴量は、前記時系列画素群検査データのフレームごとに算出された値からなる数列である
請求項1から10の何れか1項に記載のガス濃度特徴量推定装置。 - 前記時系列画素群検査データに対応する前記ガス濃度特徴量は、前記時系列画素群検査データのフレームごとに算出された値の平均値である
請求項1から11の何れか1項にガス濃度特徴量推定装置。 - 前記撮像装置は赤外カメラである
請求項7に記載のガス濃度特徴量推定装置。 - 空間中におけるガスの存在領域を表すガス分布動画像の検査データから領域抽出された、縦及び横の画素数がそれぞれ2以上であるガス分布動画像の時系列画素群検査データと、前記ガスの温度値とを取得し、
前記時系列画素群検査データと同一サイズのガス分布動画像の時系列画素群教師データと、前記時系列画素群教師データに対応するガス温度値及びガス濃度特徴量の値とを教師データとして機械学習された推論モデルを用いて、取得した前記時系列画素群検査データに対応する前記ガス濃度特徴量の推定値を算出する
ガス濃度特徴量推定方法。 - コンピュータにガス濃度特徴量推定処理を行わせるプログラムであって、
前記ガス濃度特徴量推定処理は、
空間中におけるガスの存在領域を表すガス分布動画像の検査データから領域抽出された、縦及び横の画素数がそれぞれ2以上であるガス分布動画像の時系列画素群検査データと、前記ガスの温度値とを取得し、
前記時系列画素群検査データと同一サイズのガス分布動画像の時系列画素群教師データと、前記時系列画素群教師データに対応するガス温度値及びガス濃度特徴量の値とを教師データとして機械学習された推論モデルを用いて、取得した前記時系列画素群検査データに対応する前記ガス濃度特徴量の推定値を算出する
プログラム。 - 空間中におけるガスの存在領域を表す、縦及び横の画素数がそれぞれ2以上であるガス分布動画像の時系列画素群教師データと、前記時系列画素群教師データに対応するガス温度値及びガス濃度特徴量の値とを教師データとして取得する教師データ取得部と、
ガス分布動画像の検査データから領域抽出された前記時系列画素群教師データと同一サイズの時系列画素群検査データと、当該時系列画素群検査データに対応するガス温度値に対応する前記ガス濃度特徴量の推定値を、前記教師データに基づき算出する推論モデルを構築する機械学習部とを備えた
ガス濃度特徴量推論モデル生成装置。
Priority Applications (2)
| Application Number | Priority Date | Filing Date | Title |
|---|---|---|---|
| JP2023529589A JPWO2022264604A1 (ja) | 2021-06-16 | 2022-03-24 | |
| EP22824600.5A EP4357746A1 (en) | 2021-06-16 | 2022-03-24 | Gas concentration feature quantity estimation device, gas concentration feature quantity estimation method, program, and gas concentration feature quantity inference model generation device |
Applications Claiming Priority (2)
| Application Number | Priority Date | Filing Date | Title |
|---|---|---|---|
| JP2021100464 | 2021-06-16 | ||
| JP2021-100464 | 2021-06-16 |
Publications (1)
| Publication Number | Publication Date |
|---|---|
| WO2022264604A1 true WO2022264604A1 (ja) | 2022-12-22 |
Family
ID=84527044
Family Applications (1)
| Application Number | Title | Priority Date | Filing Date |
|---|---|---|---|
| PCT/JP2022/013879 WO2022264604A1 (ja) | 2021-06-16 | 2022-03-24 | ガス濃度特徴量推定装置、ガス濃度特徴量推定方法、プログラム、およびガス濃度特徴量推論モデル生成装置 |
Country Status (3)
| Country | Link |
|---|---|
| EP (1) | EP4357746A1 (ja) |
| JP (1) | JPWO2022264604A1 (ja) |
| WO (1) | WO2022264604A1 (ja) |
Citations (7)
| Publication number | Priority date | Publication date | Assignee | Title |
|---|---|---|---|---|
| JPH058093A (ja) | 1991-02-18 | 1993-01-19 | Sanki Kogyo Kk | 空缶の圧縮処理方法 |
| WO2017104607A1 (ja) * | 2015-12-15 | 2017-06-22 | コニカミノルタ株式会社 | ガス濃度厚み積測定装置、ガス濃度厚み積測定方法、ガス濃度厚み積測定プログラム、及び、ガス濃度厚み積測定プログラムを記録したコンピュータ読み取り可能な記録媒体 |
| WO2017104617A1 (ja) | 2015-12-15 | 2017-06-22 | コニカミノルタ株式会社 | ガス検知用画像処理装置、ガス検知用画像処理方法、ガス検知用画像処理プログラム、ガス検知用画像処理プログラムを記録したコンピュータ読み取り可能な記録媒体、及び、ガス検知システム |
| WO2017213075A1 (ja) * | 2016-06-07 | 2017-12-14 | コニカミノルタ株式会社 | ガス検知用画像処理装置、ガス検知用画像処理方法及びガス検知用画像処理プログラム |
| JP2019074777A (ja) * | 2017-10-12 | 2019-05-16 | キヤノン株式会社 | 画像処理方法、画像処理装置、および撮像装置 |
| US20190331301A1 (en) * | 2016-12-30 | 2019-10-31 | Du Yuchuan | Method for leakage detection of underground pipeline corridor based on dynamic infrared thermal image processing |
| WO2020079920A1 (ja) * | 2018-10-16 | 2020-04-23 | 千代田化工建設株式会社 | 流体漏洩検知システム、流体漏洩検知装置、及び学習装置 |
-
2022
- 2022-03-24 JP JP2023529589A patent/JPWO2022264604A1/ja active Pending
- 2022-03-24 EP EP22824600.5A patent/EP4357746A1/en active Pending
- 2022-03-24 WO PCT/JP2022/013879 patent/WO2022264604A1/ja active Application Filing
Patent Citations (7)
| Publication number | Priority date | Publication date | Assignee | Title |
|---|---|---|---|---|
| JPH058093A (ja) | 1991-02-18 | 1993-01-19 | Sanki Kogyo Kk | 空缶の圧縮処理方法 |
| WO2017104607A1 (ja) * | 2015-12-15 | 2017-06-22 | コニカミノルタ株式会社 | ガス濃度厚み積測定装置、ガス濃度厚み積測定方法、ガス濃度厚み積測定プログラム、及び、ガス濃度厚み積測定プログラムを記録したコンピュータ読み取り可能な記録媒体 |
| WO2017104617A1 (ja) | 2015-12-15 | 2017-06-22 | コニカミノルタ株式会社 | ガス検知用画像処理装置、ガス検知用画像処理方法、ガス検知用画像処理プログラム、ガス検知用画像処理プログラムを記録したコンピュータ読み取り可能な記録媒体、及び、ガス検知システム |
| WO2017213075A1 (ja) * | 2016-06-07 | 2017-12-14 | コニカミノルタ株式会社 | ガス検知用画像処理装置、ガス検知用画像処理方法及びガス検知用画像処理プログラム |
| US20190331301A1 (en) * | 2016-12-30 | 2019-10-31 | Du Yuchuan | Method for leakage detection of underground pipeline corridor based on dynamic infrared thermal image processing |
| JP2019074777A (ja) * | 2017-10-12 | 2019-05-16 | キヤノン株式会社 | 画像処理方法、画像処理装置、および撮像装置 |
| WO2020079920A1 (ja) * | 2018-10-16 | 2020-04-23 | 千代田化工建設株式会社 | 流体漏洩検知システム、流体漏洩検知装置、及び学習装置 |
Also Published As
| Publication number | Publication date |
|---|---|
| JPWO2022264604A1 (ja) | 2022-12-22 |
| EP4357746A1 (en) | 2024-04-24 |
Similar Documents
| Publication | Publication Date | Title |
|---|---|---|
| EP3258445B1 (en) | Augmented reality occlusion | |
| US10497111B2 (en) | Information processing apparatus and method of selecting viewpoint for measuring object, and measuring system | |
| US8179393B2 (en) | Fusion of a 2D electro-optical image and 3D point cloud data for scene interpretation and registration performance assessment | |
| KR101604037B1 (ko) | 카메라와 레이저 스캔을 이용한 3차원 모델 생성 및 결함 분석 방법 | |
| An et al. | Quantifying time-series of leaf morphology using 2D and 3D photogrammetry methods for high-throughput plant phenotyping | |
| JP6239314B2 (ja) | ハイパースペクトル画像のシミュレーション方法 | |
| den Bieman et al. | Deep learning video analysis as measurement technique in physical models | |
| CN107067470A (zh) | 基于红外热像仪与深度相机的便携式三维温度场重建系统 | |
| Diaz et al. | Analysis and evaluation between the first and the second generation of RGB-D sensors | |
| CN108416805B (zh) | 一种基于深度学习的本征图像分解方法及装置 | |
| Dufour et al. | 3D surface measurements with isogeometric stereocorrelation—application to complex shapes | |
| El Ghazouali et al. | Optimised calibration of machine vision system for close range photogrammetry based on machine learning | |
| JP2012141758A (ja) | 三次元データ処理装置、方法及びプログラム | |
| CN110225335A (zh) | 相机稳定性评估方法及装置 | |
| WO2022264604A1 (ja) | ガス濃度特徴量推定装置、ガス濃度特徴量推定方法、プログラム、およびガス濃度特徴量推論モデル生成装置 | |
| KR20190124625A (ko) | 인공위성 센서와 지상관측망을 이용한 입자상 물질의 연직 분포 분석시스템, 분석장치, 및 분석방법 | |
| Son et al. | High-quality as-is 3D thermal modeling in MEP systems using a deep convolutional network | |
| CN104685542B (zh) | 用于检测和表征水道系统的方法和系统 | |
| WO2021246210A1 (ja) | 機械学習用データ生成装置、機械学習用データ生成方法、プログラム及び学習用データセット | |
| KR101919958B1 (ko) | 건축 구조물의 변형률 분포 시각화 장치 및 방법 | |
| US20230274443A1 (en) | Gas migration estimation device, gas migration estimation method, estimation model generation device, estimation model generation method, and program | |
| CN105046724B (zh) | 差分像运动大气相干参数测试中的双像点质心提取方法 | |
| US20230351568A1 (en) | Reflection-component-reduced image generating device, reflection component reduction inference model generating device, reflection-component-reduced image generating method, and program | |
| Rangel et al. | Gas leak inspection using thermal, visual and depth images and a depth-enhanced gas detection strategy | |
| WO2023105856A1 (ja) | ガス濃度測定装置、ガス濃度測定方法、およびプログラム |
Legal Events
| Date | Code | Title | Description |
|---|---|---|---|
| 121 | Ep: the epo has been informed by wipo that ep was designated in this application |
Ref document number: 22824600 Country of ref document: EP Kind code of ref document: A1 |
|
| ENP | Entry into the national phase |
Ref document number: 2023529589 Country of ref document: JP Kind code of ref document: A |
|
| WWE | Wipo information: entry into national phase |
Ref document number: 2022824600 Country of ref document: EP |
|
| NENP | Non-entry into the national phase |
Ref country code: DE |
|
| ENP | Entry into the national phase |
Ref document number: 2022824600 Country of ref document: EP Effective date: 20240116 |