WO2022259801A1 - 情報処理装置、情報処理方法及びプログラム - Google Patents
情報処理装置、情報処理方法及びプログラム Download PDFInfo
- Publication number
- WO2022259801A1 WO2022259801A1 PCT/JP2022/019915 JP2022019915W WO2022259801A1 WO 2022259801 A1 WO2022259801 A1 WO 2022259801A1 JP 2022019915 W JP2022019915 W JP 2022019915W WO 2022259801 A1 WO2022259801 A1 WO 2022259801A1
- Authority
- WO
- WIPO (PCT)
- Prior art keywords
- information
- index value
- area
- bar
- map
- Prior art date
- Legal status (The legal status is an assumption and is not a legal conclusion. Google has not performed a legal analysis and makes no representation as to the accuracy of the status listed.)
- Ceased
Links
Images




Classifications
-
- G—PHYSICS
- G06—COMPUTING OR CALCULATING; COUNTING
- G06Q—INFORMATION AND COMMUNICATION TECHNOLOGY [ICT] SPECIALLY ADAPTED FOR ADMINISTRATIVE, COMMERCIAL, FINANCIAL, MANAGERIAL OR SUPERVISORY PURPOSES; SYSTEMS OR METHODS SPECIALLY ADAPTED FOR ADMINISTRATIVE, COMMERCIAL, FINANCIAL, MANAGERIAL OR SUPERVISORY PURPOSES, NOT OTHERWISE PROVIDED FOR
- G06Q50/00—Information and communication technology [ICT] specially adapted for implementation of business processes of specific business sectors, e.g. utilities or tourism
- G06Q50/10—Services
- G06Q50/26—Government or public services
Definitions
- the present invention relates to an information processing device, an information processing method, and a program.
- Patent Document 1 discloses a disaster area identification system that identifies a disaster area and creates disaster area identification information based on failure information, earthquake seismic intensity information, and map information that indicate the failure status of communication equipment, etc., sent from a telecommunications carrier. be written.
- the system described in the document divides the map of the disaster area into grids, and generates a map that is color-coded according to the degree of damage probability and scale of damage corresponding to each grid.
- This document describes a format in which a mesh layer displaying the number of human damages and damages to houses for each range partitioned in a grid pattern in a bar graph format is superimposed on a map image.
- Patent Document 2 describes a display system that displays the time transition of a specific place or building on a two-dimensional map or the like.
- the time axis is set in the vertical direction through the 2D map, and the 2D map is moved along the time axis by operating the slider set along the time axis. Embodiments are described.
- Patent Document 3 describes a guidance system that uses incident information to guide police officers.
- the system described in the document uses a time zone bar to specify a time zone, displays a pie chart representing the ratio of the frequency of incidents that occurred during the specified time zone, and plots crime occurrence marks on a two-dimensional map. superimposed on the
- Patent Document 1 can statically grasp the degree of damage at each hour, it is difficult to grasp the dynamic transition of the degree of damage.
- Patent Document 2 can grasp the damage history of historical buildings, but it is difficult to grasp the dynamic changes in the degree of damage in any given disaster.
- Patent Document 3 can statically grasp the incident frequency for each time period, but it is difficult to grasp the dynamic transition of the incident frequency.
- the present invention has been made in view of such circumstances, and aims to provide an information processing device, an information processing method, and a program that can grasp the dynamic time transition of index values in a survey target area.
- An information processing apparatus is an information processing apparatus that includes a processor and a memory that stores a program to be executed by the processor. , obtains survey target information in the survey target area at two or more specified dates and times, calculates the index value of the survey target information for each specified date and time, and creates an index value bar having a length corresponding to the index value and perform statistical processing on the index values at two or more specified dates and times to calculate statistical values, generate statistical value information including a slider bar representing the time axis and time transition display of statistical values, and investigate
- This is an information processing device that superimposes an index value bar corresponding to a date and time specified using a slider bar on a map of a survey target area on a screen that displays a map of the target area and statistical value information.
- statistical value information representing the temporal transition of the statistical value of the index value is calculated for two or more dates and times, and the index value for each area is mapped to the two-dimensional map of the survey target area.
- Statistical value information is displayed on the screen on which the indicator value bar is superimposed. This makes it possible to grasp the dynamic time transition of the index value in the survey target area.
- the processor may acquire survey conditions and set the survey target area based on the acquired survey conditions.
- the index value can be a numerical value that expresses the degree of information subject to investigation. Examples of index values include the number of survey targets that have been surveyed and the number of survey targets that have not yet been surveyed.
- the processor may calculate multiple index values.
- Statistical values can use the statistical values of index values for each area.
- the same index value as that used for the index value bar may be used for the time transition information.
- a processor acquires a map of a survey target area including a plurality of areas, generates an index value bar representing an index value of survey target information for each area, and generates an index value bar corresponding to each area.
- the indicator value bar for the target area is displayed superimposed on the map of the survey area.
- the index value of the survey target information for each area can be grasped based on the map of the survey target area on which the index value bar is superimposed and displayed.
- the processor changes the display mode of the index value bar for each area according to the ratio of the index value for each area to the total value of the survey target information in the entire survey target area.
- An example of differentiating the display mode of the index value bar is to vary the color of the index value bar.
- modes for different colors include a mode for varying saturation, a mode for varying brightness, and a mode for varying hue.
- the display mode of the index value bars for each area is varied according to the degree of concentration of the index value bars for each area.
- An example of differentiating the display mode of the index value bar is to vary the width of the index value bar.
- a processor generates an index value bar having a three-dimensional shape.
- the visibility of the index values when comparing the index values for each region is improved, and the difference in the index values for each region can be easily recognized.
- the processor acquires a plurality of types of survey target information, and superimposes and displays the index value bar on the map of the survey target area according to the selection information of the survey target information.
- arbitrary survey target information can be selectively displayed on the map of the survey target area from among multiple types of survey target information.
- the processor displays a screen for designating a plurality of types of investigation target information.
- desired research object information can be specified from among multiple types of research object information displayed on the screen.
- the processor uses the remaining number of survey targets as the index value of the survey target information.
- the processor causes a warning to be displayed on the screen when the index value satisfies a prescribed warning condition.
- the presence of an index value that satisfies the warning conditions can be notified.
- the processor uses whether or not the rate of change of the index value is equal to or less than a prescribed threshold as the warning condition.
- a warning based on the rate of change of the index value can be issued.
- the processor causes the screen to display a highlighting that emphasizes the index value when the index value satisfies a prescribed highlighting condition.
- a processor generates a first index value bar representing the index value of the first survey target information and a second index value bar representing the index value of the second survey target information, The index value bar and the second index value bar are superimposed on the map of the research target area.
- a computer acquires a map of a survey target area, acquires survey target information in the survey target area at two or more specified dates and times, and acquires survey target information indexes for each specified date and time. Calculate a value, generate an index value bar having a length corresponding to the index value, perform statistical processing on the index value at two or more specified dates and times to calculate the statistical value, and create a slider bar representing the time axis. and statistical value information including time transition display of statistical values, and on the screen that displays the map of the survey target area and statistical value information, the index value bar corresponding to the date and time specified using the slider bar is displayed as the survey target.
- the program according to the present disclosure provides a computer with a function to acquire a map of the survey target area, a function to acquire survey target information in the survey target area at two or more specified dates and times, and an index of survey target information for each specified date and time.
- a function to calculate a value a function to generate an index value bar having a length corresponding to the index value, a function to perform statistical processing on the index value at two or more specified dates and times to calculate the statistical value, a time axis
- the program according to the present disclosure it is possible to obtain the same effects as the information processing apparatus according to the present disclosure.
- the constituent requirements of the information processing apparatus according to other aspects can be applied to the constituent requirements of the program according to other aspects.
- statistical value information representing the temporal transition of the statistical value of the index value is calculated for two or more dates, and the index value bar corresponding to the index value for each area is superimposed on the two-dimensional map of the survey target area.
- Statistics information is displayed on the displayed screen. This makes it possible to grasp the dynamic time transition of the index value in the survey target area.
- FIG. 1 is a schematic diagram showing a configuration example of an information processing system according to an embodiment.
- FIG. 2 is a functional block diagram showing the electrical configuration of the information processing terminal device shown in FIG.
- FIG. 3 is a block diagram showing a hardware configuration example of the information processing terminal device shown in FIG.
- FIG. 4 is a functional block diagram showing the electrical configuration of the mobile terminal device shown in FIG.
- FIG. 5 is a flow chart showing the procedure of the information processing method according to the embodiment.
- FIG. 6 is a schematic diagram showing a first structural example of the damage information display screen.
- FIG. 7 is a schematic diagram of a damage information display screen showing another aspect of time transition information.
- FIG. 8 is an explanatory diagram of the three-dimensional bar shown in FIG. FIG.
- FIG. 9 is a schematic diagram showing a modification of the first structural example of the damage information display screen.
- FIG. 10 is a schematic diagram showing a second configuration example of the damage information display screen.
- FIG. 11 is a schematic diagram showing a third configuration example of the damage information display screen.
- FIG. 12 is a schematic diagram showing a fourth configuration example of the damage information display screen.
- FIG. 13 is an explanatory diagram of index values used in the fourth configuration example.
- FIG. 14 is an explanatory diagram of the maximum flood depth on the first date.
- FIG. 15 is an explanatory diagram of the maximum value of the flood depth on the second date.
- FIG. 16 is an explanatory diagram of the maximum flood depth on the third date.
- FIG. 1 is a schematic diagram showing a configuration example of an information processing system according to an embodiment.
- An information processing system for acquiring various types of damage information in a survey target area and processing the various types of damage information will be described below, taking housing damage certification surveys as an example. It should be noted that the damage information described in the embodiment is an example of research target information.
- the information processing system 10 shown in FIG. 1 includes an information processing terminal device 12, a server device 14, an external storage device 15, and a mobile terminal device 16.
- Information processing terminal device 12 , server device 14 , external storage device 15 and portable terminal device 16 can perform data communication with each other via network 18 .
- the information processing terminal device 12 includes a computer 20 , an input device 21 and a display device 22 .
- the information processing terminal device 12 reads the map information of the survey target area from the map database 24 stored in the external storage device 15, generates a two-dimensional map of the survey target area, and displays the two-dimensional map of the survey target area on the display device 22. to display.
- the input device 21 transmits to the computer 20 an operation signal representing input information based on the user's operation.
- the computer 20 receives operation signals transmitted from the input device 21 .
- FIG. 1 illustrates a keyboard and a mouse as examples of the input device 21 .
- the information processing terminal device 12 acquires various types of information transmitted from the mobile terminal device 16, and superimposes the various types of information on the screen displaying the two-dimensional map of the survey target area. The details of the display of the two-dimensional map of the survey target area will be described later.
- the server device 14 acquires various types of information transmitted from the information processing terminal device 12 and the mobile terminal device 16 . In addition, the server device 14 transmits various kinds of information to the information processing terminal device 12 and the mobile terminal device 16 in response to various requests transmitted from the information processing terminal device 12 and the mobile terminal device 16 .
- a computer is used as the server device 14 .
- the form of the computer may be a personal computer or a workstation.
- a map database 24 and a damage information database 25 are stored in the external storage device 15.
- the map database 24 stores map information for each area associated with the identification information of the area.
- the map database 24 transmits map information of the survey target area in response to requests transmitted from the information processing terminal device 12 and the mobile terminal device 16 .
- Regions can use municipalities, which are basic local governments. Prefectures, which are wide-area local governments, may be used as regions. A region includes one or more regions. If a city is used as the region, the region may use a town, chome, number and number, and so on.
- damage information representing the degree of damage for each region is stored for each date.
- the damage information for each region is stored in association with identification information for each region such as the name of the region.
- the damage information for each area includes damage information for each area that represents the degree of damage for each area.
- the damage information for each area is stored in association with identification information for each area such as an area name. Examples of damage information include the number of damaged houses and depth of inundation. The number of damaged houses may be subdivided into completely destroyed, partially destroyed, and partially destroyed.
- Damage information is collected and managed for each unit period used in chronological order, such as year, month, day, and time.
- a day is used as the unit period for damage information management.
- the term "date” may be read as a term representing an arbitrary point on the time axis, such as date and time.
- Portable computers such as tablet computers, notebook computers, and smartphones used by investigators are used as the mobile terminal device 16 .
- the mobile terminal device 16 has a display device 26 .
- Various information acquired by the mobile terminal device 16 is displayed on the display device 26 .
- the mobile terminal device 16 is equipped with an input device. Input devices are used by investigators to enter information. Operation buttons displayed on the display device 26 are used as input devices.
- the input device is illustrated in FIG. 4 with reference numeral 80 attached.
- the mobile terminal device 16 may be mounted on a flying object such as a drone, acquire information in response to remote control by an operator, and transmit the acquired information.
- the information processing system 10 may include multiple mobile terminal devices 16 .
- the network 18 may use wireless communication using any frequency band.
- Network 18 may use any wired form of communication.
- Network 18 may combine wireless and wired forms of communication.
- Network 18 may use any communication standard.
- FIG. 2 is a functional block diagram showing the electrical configuration of the information processing terminal device shown in FIG.
- the information processing terminal device 12 includes a map information acquisition section 40 .
- the map information acquisition unit 40 acquires map information of the survey target area from the map database 24 .
- the information processing terminal device 12 may include a survey target area setting unit that acquires setting information of the survey target area.
- the information processing terminal device 12 may include a map information storage unit that stores map information of the survey target area acquired from the map database 24 .
- the information processing terminal device 12 includes a two-dimensional map generation unit 42 .
- the two-dimensional map generation unit 42 generates a two-dimensional map including the entire survey area based on the map information of the survey area acquired from the map database 24 .
- the information processing terminal device 12 may include a two-dimensional map storage unit that stores a two-dimensional map that includes the entire survey target area.
- the information processing terminal device 12 includes a damage information acquisition unit 50 .
- the damage information acquisition unit 50 acquires damage information from the damage information database 25 using the identification information and the date of the survey target area as conditions for acquiring the damage information.
- the information processing terminal device 12 may include an acquisition condition setting unit that sets acquisition conditions for damage information used when acquiring damage information from the damage information database 25 .
- the information processing terminal device 12 may include a damage information storage unit that stores damage information acquired from the damage information database 25 .
- the damage information acquisition unit 50 acquires damage information for each date for two or more dates.
- the damage information acquisition unit 50 can specify a period including two or more dates and acquire damage information for each date included in the specified period.
- the information processing terminal device 12 includes a three-dimensional bar generation section 52 .
- the three-dimensional bar generation unit 52 generates a three-dimensional bar representing an index value, which is a value of damage information for each area included in the survey target area.
- a three-dimensional bar may adopt a mode having a height corresponding to the index value for each region.
- the three-dimensional bar is superimposed on the two-dimensional map on the damage information display screen.
- An example of the damage information display screen is illustrated in FIG. 6 with reference numeral 200 attached.
- a three-dimensional bar is generated for each date corresponding to the damage information for each date, associated with the date, and stored for each date. If damage information for a new date is obtained, a three-dimensional bar for the new date is generated.
- index values include the number of damaged houses, the remaining number of surveyed houses, and the depth of flooding.
- the number of damaged houses the number of completely destroyed houses, the number of large-scale partially destroyed houses, and the number of partially destroyed houses can be used. The details of the three-dimensional bar and the damage information display image will be described later.
- the information processing terminal device 12 includes a statistic value calculation unit 60 .
- the statistical value calculator 60 statistically processes the index values and calculates the statistical values of the index values. Statistics may use totals, maximums, remaining numbers, and the like. Examples of statistical values include the total number of damaged houses when the index value is the number of damaged houses, the total number of remaining surveyed houses when the index value is the number of surveyed houses remaining, and the index. Examples include the maximum value of the flood depth when the value is the flood depth.
- the information processing terminal device 12 includes a statistical value information generating section 62 .
- the statistic value information generation unit 62 generates statistic value information representing time transition of statistic values for each date for two or more dates.
- An example of statistical information is a graph showing the number of uninvestigated homes by date. Details of the statistical value information will be described later.
- the information processing terminal device 12 includes a user input signal acquisition section 70 .
- the user input signal acquisition section 70 acquires a user input signal transmitted according to the operation of the input device 21 .
- An example of user input is date selection.
- the information processing terminal device 12 has a date setting section 72 .
- the date setting unit 72 sets the date to be used for the damage information display screen based on the user input signal representing the date selection acquired using the user input signal acquisition unit 70 .
- the information processing terminal device 12 includes a damage status display screen generation unit 74 .
- the damage status display screen generation unit 74 generates a damage information display screen to be displayed using the display device 22 and transmits a display signal representing the damage information display screen to the display device 22 .
- the damage status display screen generation unit 74 generates a damage information display screen on which a three-dimensional bar representing index values for each area is superimposed on the two-dimensional map of the survey target area and statistical value information is displayed. do.
- FIG. 3 is a block diagram showing a hardware configuration example of the information processing terminal device shown in FIG.
- the information processing terminal device 12 includes a processor 100 , a computer-readable medium 102 that is a non-temporary tangible object, a communication interface 104 and an input/output interface 106 .
- the processor 100 includes a CPU (Central Processing Unit). Processor 100 may include a GPU (Graphics Processing Unit). Processor 100 is coupled to computer-readable media 102 , communication interface 104 , and input/output interface 106 via bus 108 . Input device 21 and display device 22 are connected to bus 108 via input/output interface 106 .
- CPU Central Processing Unit
- GPU Graphics Processing Unit
- the computer-readable medium 102 includes a memory as a main memory and a storage as an auxiliary memory.
- the computer-readable medium 102 can use semiconductor memories such as ROM (Read Only Memory) and RAM (Random Access Memory), hard disk devices, solid state drive devices, and the like.
- Computer readable medium 102 may use any combination of devices.
- the hard disk device can be called HDD, which is an abbreviation for Hard Disk Drive in English.
- a solid state drive device may be referred to as SSD, which is an abbreviation for the English notation Solid State Drive.
- the information processing terminal device 12 is connected to the network 18 shown in FIG. .
- the computer-readable medium 102 can be used for various functions of the information processing terminal device 12, such as a two-dimensional map generation program 120, a three-dimensional bar generation program 122, a statistical value calculation program 124, a statistical value information generation program 126, and a damage information display screen generation program 128.
- Various programs corresponding to functions are stored.
- the two-dimensional map generation program 120 is used for processing related to generation of a two-dimensional map of the survey target area, which is performed by the map information acquisition unit 40 and the two-dimensional map generation unit 42 shown in FIG.
- the three-dimensional bar generation program 122 is used for processing related to three-dimensional bar generation, such as calculation of index values performed by the damage information acquisition unit 50 and the three-dimensional bar generation unit 52 .
- the statistical value calculation program 124 is used for processing related to calculation of statistical values, which is performed in the statistical value calculation section 60 .
- the statistical value information generation program 126 is used for statistical value information generation processing performed by the statistical value information generation unit 62 .
- the damage information display screen generation program 128 is used for generation processing of the damage information display screen displayed on the display device 22 , which is executed in the damage status display screen generation unit 74 .
- Various programs stored in the computer-readable medium 102 include one or more instructions.
- the computer-readable medium 102 stores various data, various parameters, and the like.
- the information processing terminal device 12 implements various functions in the information processing terminal device 12 by executing various programs stored in the computer-readable medium 102 by the processor 100 .
- program is synonymous with the term software.
- the information processing terminal device 12 performs data communication with an external device via the communication interface 104 .
- Communication interface 104 may use various standards such as USB (Universal Serial Bus).
- the communication form of the communication interface 104 may use either wired communication or wireless communication.
- the information processing terminal device 12 is connected to the input device 21 and the display device 22 via the input/output interface 106 .
- Input devices such as a keyboard and a mouse are used as the input device 21 .
- the input device 21 may use a touch panel system.
- a liquid crystal display, an organic EL display, or the like can be used for the display device 22 .
- Display device 22 may use any combination of devices.
- EL in the organic EL display is an abbreviation for Electro-Luminescence.
- examples of the hardware structure of the processor 100 include a CPU, GPU, PLD (Programmable Logic Device), and ASIC (Application Specific Integrated Circuit).
- a CPU is a general-purpose processor that executes programs and acts as various functional units.
- a GPU is a processor specialized for image processing.
- a PLD is a processor whose electrical circuit configuration can be changed after the device is manufactured. Examples of PLDs include FPGAs (Field Programmable Gate Arrays). An ASIC is a processor with dedicated electrical circuitry specifically designed to perform a particular process.
- One processing unit may be composed of one of these various processors, or may be composed of two or more processors of the same type or different types. Examples of combinations of various processors include combinations of one or more FPGAs and one or more CPUs, and combinations of one or more FPGAs and one or more GPUs. Another example of a combination of various processors is a combination of one or more CPUs and one or more GPUs.
- a single processor may be used to configure multiple functional units.
- a combination of one or more CPUs and software such as SoC (System On a Chip), typified by a computer such as a client or server, is adopted.
- SoC System On a Chip
- a mode is given in which one processor is configured and this processor is operated as a plurality of functional units.
- IC is an abbreviation for Integrated Circuit.
- various functional units are configured using one or more of the various processors described above as a hardware structure.
- the hardware structure of the various processors described above is, more specifically, an electric circuit combining circuit elements such as semiconductor elements.
- the hardware configuration of the information processing terminal device 12 shown in FIG. 3 can be adopted for the server device 14 and the mobile terminal device 16 shown in FIG.
- the information processing terminal device 12 described in the embodiment is an example of an information processing device.
- FIG. 4 is a functional block diagram showing the electrical configuration of the mobile terminal device shown in FIG.
- the mobile terminal device 16 has a display device 26 .
- Various types of information acquired by the mobile terminal device 16 are displayed on the display device 26 .
- a liquid crystal display or the like may be used as the display device 26 .
- the mobile terminal device 16 has an input device 80 .
- the input device 80 is used when inputting various kinds of information to the mobile terminal device 16 .
- Examples of the input device 80 include operation buttons provided on the mobile terminal device 16 and software buttons displayed on the display device 26 .
- the mobile terminal device 16 has a signal processing device 82 .
- the signal processing device 82 processes signals representing various types of information input to the mobile terminal device 16 . Examples of various signals include a signal representing image data and a signal representing audio data.
- the mobile terminal device 16 includes a storage device 84. Various types of information used by the mobile terminal device 16 are stored in the storage device 84 .
- the storage device 84 stores image data, audio data, and the like.
- the mobile terminal device 16 has a communication interface 86 .
- the communication interface 86 performs data communication with the information processing terminal device 12 and the server device 14 shown in FIG. If the information processing system 10 includes a plurality of mobile terminal devices 16, the communication interface 86 can implement data communication with other mobile terminal devices 16.
- FIG. 1 A communication interface 86 performs data communication with the information processing terminal device 12 and the server device 14 shown in FIG. If the information processing system 10 includes a plurality of mobile terminal devices 16, the communication interface 86 can implement data communication with other mobile terminal devices 16.
- FIG. 5 is a flow chart showing the procedure of the information processing method according to the embodiment.
- the map information acquisition unit 40 shown in FIG. 2 acquires and stores map information of the survey area from the map database 24 based on the setting information of the survey area.
- the two-dimensional map generation unit 42 generates a two-dimensional map of the survey target area using the map information of the survey target area.
- the damage information acquisition unit 50 acquires and stores the damage information of the survey target area from the damage information database 25 based on the damage information acquisition conditions defined in advance.
- the three-dimensional bar generation unit 52 calculates an index value for each area based on the damage information for each area, and generates and stores a three-dimensional bar for each area.
- the statistical value calculation unit 60 calculates statistical values of index values.
- the statistical value information generation unit 62 generates statistical value information representing the time transition of the statistical value.
- the user input signal acquisition unit 70 determines whether or not the user input signal has been acquired. If it is determined in the user input signal acquisition determination step S16 that the user input signal has not been acquired, the determination is No. If the determination is No, the process proceeds to the specified date setting step S18. In the prescribed date setting step S18, the date setting unit 72 sets a prescribed date.
- An example of the predetermined date is the date when the damage information was last obtained, such as the current date.
- the damage status display screen generation unit 74 generates a damage information display screen and transmits a display signal representing the damage information display screen to the display device 22 shown in FIG.
- the damage information display screen superimposes the index value for each area on the date set in the specified date setting step S18 or the date set in the specified date setting step S20 on the two-dimensional map of the survey target area, and displays the statistical values.
- the statistical value information generated in the information generating step S14 is displayed.
- the damage information display screen generated in the damage information display screen generation step S ⁇ b>22 is displayed on the display device 22 .
- the information processing terminal device 12 determines whether to continue or end the display of the damage information display screen. In the display termination determination step S24, if it is determined that the display of the damage information display screen should be continued, the determination is No. If the determination is No, the process proceeds to the user input signal acquisition determination step S16, and each step from the user input signal acquisition determination step S16 to the display end determination step S24 is repeatedly executed until a Yes determination is made in the display end determination step S24.
- the display termination determination step S24 if it is determined to terminate the display of the damage information display screen, the determination is Yes. In the case of Yes determination, the prescribed end processing is executed and the display of the damage information display screen is ended.
- the 3D bar and statistical value information are updated based on the acquired damage information, and the damage information display screen is displayed according to the update of the 3D bar, etc. May be updated.
- FIG. 6 is a schematic diagram showing a first structural example of the damage information display screen.
- a damage information display screen 200 shown in the figure is displayed using the display device 22 .
- the damage information display screen 200 includes a two-dimensional map 202 of the survey target area 201, a plurality of three-dimensional bars 204 corresponding to each area 203 included in the survey target area 201, and statistical value information 206 representing the time transition of the damage information. Is displayed.
- the two-dimensional map 202 includes the entire survey area 201 .
- a survey map or an edited map may be used, and the method of creating the two-dimensional map 202 is not limited.
- An aerial photograph or the like may be used as the two-dimensional map 202 .
- the three-dimensional bar 204 for each area 203 has a height corresponding to the magnitude of the index value for each area 203.
- FIG. 6 illustrates a three-dimensional bar 204 in which the number of damaged homes is used as an index value. Also, the three-dimensional bar 204 is colored to represent the ratio of the index value for each area 203 to the total index value for each area 203 in the research target area 201 .
- the three-dimensional bar generation unit 52 shown in FIG. 2 changes the display mode of the three-dimensional bar 204 according to the ratio of the index value for each area 203 to the total index value for each area 203 in the survey target area 201. .
- the shading of the three-dimensional bar 204 shown in FIG. 6 corresponds to the color given to each three-dimensional bar 204.
- Four colors are used for the three-dimensional bar 204 shown in FIG. Note that the number of colors used in the three-dimensional bar 204 is not limited to the example shown in FIG.
- the statistical value information 206 includes a time slider 210.
- the time slider 210 includes a slider 212 representing a time axis and a cursor 214 movable along the slider 212 .
- the position of cursor 214 represents the date on which three-dimensional bar 204 is displayed. That is, the user can use slider 212 to specify a date for displaying a plurality of three-dimensional bars 204 superimposed on two-dimensional map 202 .
- FIG. 6 illustrates a slider 212 corresponding to 31 days from November 15th to December 15th, with the cursor 214 positioned on December 1st. Also shown in FIG. 6 is a three-dimensional bar 204 representing the number of damaged homes per area 203 on December 1st.
- the statistical value information 206 includes time transition information 220.
- a graph representing the time transition of statistical values is used for the time transition information 220 shown in FIG.
- the statistical value used is the total number of damaged houses in the survey area as a whole up to each date.
- the time transition information 220 represents the time transition of the total number of damaged houses in the survey area as a whole up to each date.
- the graph used for the time transition information 220 shown in FIG. It shows how the number of damaged houses monotonously increases from the start of the survey to the end of the survey, which means that the increasing trend becomes smaller.
- FIG. 7 is a schematic diagram of a damage information display screen showing another aspect of time transition information.
- the damage information display screen 200A shown in FIG. 7 shows an example in which the total number of damaged houses in the entire survey target area for each date is used as the time transition information 220A included in the statistical value information 206A.
- the number of damaged houses tends to increase at the beginning of the investigation, and as the investigation progresses, the number of damaged houses peaks, and as the number of houses targeted for investigation decreases, the number of damaged houses increases. decreases.
- the total number of damaged houses in the entire survey area on each date is calculated by accumulating the total number of damaged houses in the survey area for each date for all days up to each date.
- the total number of damaged homes for the entire target area can be used.
- the total number of damaged houses in the entire survey area on each date can be the total number of damaged houses in the survey area on each date.
- FIG. 8 is an explanatory diagram of the three-dimensional bar shown in FIG. FIG. 8 shows part of the three-dimensional bar 204 shown in the damage information display screen 200 shown in FIG.
- FIG. 8 schematically illustrates the three-dimensional bar 204, and the hatching attached to the ceiling surface of the three-dimensional bar 204 represents the color of the three-dimensional bar 204.
- a three-dimensional bar 2041 shown in FIG. 8 corresponds to the area 2031.
- the three-dimensional bar 2041 uses a prism having a bottom surface with the same planar shape as the region 2031 .
- the three-dimensional bar 2042 corresponds to the area 2032 and has a bottom surface with the same planar shape as the area 2032 .
- the shape of the arbitrary three-dimensional bar 204 is not limited to the examples shown in FIGS. 6-8, and any shape polyhedron may be used.
- the three-dimensional bar 204 described in the embodiment is an example of an index value bar having a length corresponding to an index value, and an example of an index value bar having a three-dimensional shape.
- the time slider 210 including the slider 212 and cursor 214 described in the embodiment is an example of a slider bar representing the time axis.
- the time transition information 220 described in the embodiment is an example of time transition display of statistical values.
- FIG. 9 is a schematic diagram showing a modification of the first structural example of the damage information display screen.
- the damage information display screen 300 shown in FIG. 9 like the damage information display screen 200 shown in FIG. 8, illustration of some of the constituent elements of the damage information display screen 300 is omitted.
- adjacent three-dimensional bars 204 overlap each other in areas where the density of the three-dimensional bars 204 is relatively high.
- the relatively low three-dimensional bar 204 is hidden behind the relatively high three-dimensional bar 204, and the visibility of the three-dimensional bar 204 is lowered.
- the three-dimensional bar 304 used in the damage information display screen 300 shown in FIG. 9 is adjusted to be narrower than the three-dimensional bar 204 shown in FIG.
- the three-dimensional bar 204 shown in FIG. 6 may be thinned to generate the three-dimensional bar 304 shown in FIG.
- the three-dimensional bar 304 may be colored to represent the ratio of each area 203 to the total index value for each area 203 in the survey target area 201 .
- the three-dimensional bar generation unit 52 shown in FIG. 2 performs processing to change the display mode of the three-dimensional bar 204 according to the degree of density of the three-dimensional bar 204 shown in FIG.
- an emphasis mark 320 is attached to the area 203 that satisfies the specified emphasis conditions.
- An emphasis mark 320 shown in FIG. 9 is displayed at a position corresponding to the three-dimensional bar 304.
- An example of an emphasis condition is that the ratio of the index value for each area 203 to the total index value for all areas 203 in the survey target area 201 is above a certain level.
- a plurality of emphasis marks 320 corresponding to each of a plurality of emphasis conditions may be displayed. Note that the highlighting mark 320 described in the embodiment is an example of highlighting.
- FIG. 10 is a schematic diagram showing a second configuration example of the damage information display screen.
- the number of damaged houses for each date and for each area 203 is used as an index value, and the total number of damaged houses in the entire survey target area 201 up to each date is used as a statistical value. is calculated.
- a group of index value specification buttons 404 configured to freely select index values representing the degree of damage are displayed as a user interface.
- a damage information display screen 400 shown in FIG. 10 displays an indicator value specification button 402 including one or more index value specification buttons 402 for damage information including the two-dimensional map 202, the three-dimensional bar 204, and the statistical value information 206 shown in FIG. Button group 404 is added.
- FIG. 10 exemplifies a first button 4021, a second button 4022, a third button 4023, a fourth button 4024, and a fifth button 4025 as the plurality of index value designation buttons 402.
- FIG. 10 exemplifies a first button 4021, a second button 4022, a third button 4023, a fourth button 4024, and a fifth button 4025 as the plurality of index value designation buttons 402.
- the first button 4021 is selected when specifying the number of completely destroyed houses as an index value.
- a damage information display screen 400 shown in FIG. 10 shows a state in which the first button 4021 is selected.
- a second button 4022 is selected when specifying the number of large-scale partially destroyed houses.
- the third button 4023 is selected when specifying the number of half-destroyed houses.
- a fourth button 4024 is selected when specifying the number of partially damaged houses.
- a fifth button 4025 is selected when specifying the number of undamaged houses.
- the three-dimensional bar generation unit 52 shown in FIG. and generate a three-dimensional bar 204 for each date and each area 203 .
- the statistic value calculation unit 60 can calculate statistic values corresponding to the index values used for the three-dimensional bar 204 .
- the statistical value information generator 62 can generate statistical value information 206 based on statistical values corresponding to index values used for the three-dimensional bar 204 .
- Time transition information 220 representing the time transition of the total number of completely destroyed houses in the survey target area 201 is generated.
- the damage information display screen 400 selects an arbitrary index value from among a plurality of different index values according to the progress of the housing damage certification survey when judging the area 203 with a relatively large degree of damage. to display the selected index value.
- the damage information display screen 400 when an arbitrary index value is selected, an index value different from the selected index value can be selected. It is possible to change the display from the value to the newly selected index value.
- FIG. 11 is a schematic diagram showing a third configuration example of the damage information display screen.
- the housing damage certification survey there may be a case where it is desired to grasp the remaining number of houses to be surveyed, which represents the number of uninvestigated houses among the houses to be surveyed.
- the remaining number of surveyed houses for each date and for each area 203 is used as an index value, and the survey in the entire surveyed area 201 up to each date is used as a statistical value.
- the remaining number of target houses is calculated.
- the remaining number of surveyed houses for each date and each area 203 is used as the height of the three-dimensional bar 204 .
- the time transition of the remaining number of survey target houses in the entire survey target area 201 up to each date is displayed as the time transition information 220B of the statistical value information 206B.
- the graph used for the time transition information 220B shown in FIG. It shows that the number of remaining surveyed houses decreases monotonically from the start of the survey to the end of the survey.
- a warning mark 502 is attached to the position of the three-dimensional bar 2045 in the area 2035 that satisfies the prescribed warning conditions.
- FIG. 11 shows how the warning mark 502 is arranged above the three-dimensional bar 2045 .
- the area 2035 to which the three-dimensional bar 2045 is attached satisfies the condition that the rate of decrease in the number of remaining surveyed houses during a certain period in the past from the date specified in advance is below a certain level.
- An example of the certain period of time is three days.
- An example of the rate of decrease below a certain level is the average value of the rate of decrease per day in the past in the area 2035 .
- rate of decrease described in the embodiment is an example of the rate of change.
- condition that the rate of decrease is below a certain level described in the embodiment is an example of the condition below a specified threshold.
- the shape, size and display position of the warning mark 502 are not limited to the example shown in FIG. 11, and any shape, size and display position can be used. Also, the warning mark 502 may use a colored aspect.
- the damage information display screen 500 can grasp the progress of the housing damage certification investigation based on the decrease in the number of remaining surveyed houses. Also, a warning mark 502 is displayed for the area 2035 that satisfies the specified warning condition. This makes it possible to grasp the characteristics of the progress of the housing damage certification survey.
- FIG. 12 is a schematic diagram showing a fourth configuration example of the damage information display screen.
- 13 to 16 are explanatory diagrams of the components of the damage information display screen 600 shown in FIG. 12.
- FIG. 14 to 16 the statistical value information 206C shown in FIG. 12 is simplified.
- the maximum value of the inundation height for each area 203 up to each date is used as the index value, and the statistic value is the inundation height of the surveyed houses in the entire survey area 201 up to each date. is used.
- a damage information display screen 600 shown in FIG. 12 displays a three-dimensional bar 204 superimposed on a two-dimensional map 202 for each area 203, like the damage information display screen 200 shown in FIG.
- the damage information display screen 600 displays, as the statistical value information 206C, the temporal transition of the maximum flood depth in the entire survey area 201 .
- As the time transition information 220C a graph representing the time transition of the maximum flood depth in the entire survey area 201 is displayed.
- the maximum flood depth for each region 203 up to the date specified using the time slider 210 is used as the index value, and the height of the three-dimensional bar 204 is The maximum immersion depth per 203 is used.
- FIG. 12 illustrates a slider 212 corresponding to three days from April 1st to April 3rd.
- FIG. 13 is an explanatory diagram of index values used in the fourth configuration example.
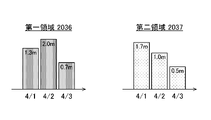
- FIG. 13 shows the temporal transition of the flood depth in the first region 2036 and the second region 2037 using bar graphs showing the flood depth for each date and region.
- FIG. 13 shows the flood depth in the first region 2036 and the flood depth in the second region 2037 for three days.
- the first area 2036 has a flood depth of 1.3 meters on April 1st, a flood depth of 2.0 meters on April 2nd, and a flood depth of 0.7 meters on April 3rd. is meter.
- the second area 2037 has a flood depth of 1.7 meters on April 1, a flood depth of 1.0 meters on April 2, and a flood depth of 0.5 meters on April 3. is meter.
- FIG. 14 is an explanatory diagram of the maximum flood depth on the first date.
- FIG. 14 shows a bar graph showing the maximum flood depth on the first date.
- FIG. 14 shows an example in which April 1 is used as the first date, which is the starting point of the time transition of the flood depth. As shown in FIG. 13, the flood depth on April 1 in the first region 2036 is 1.3 meters, and the flood depth on April 1 in the second region 2037 is 1.7 meters.
- three-dimensional bar 2046 in first region 2036 has a height corresponding to 1.3 meters
- three-dimensional bar 2047 in second region 2037 has a height of , with a height corresponding to 1.7 meters.
- FIG. 15 is an explanatory diagram of the maximum flood depth on the second date.
- FIG. 15 shows a bar graph showing the maximum flood depth on the second date.
- FIG. 15 shows an example in which April 2nd, which is the day after the starting date, is used as the second date, which is ahead of the first date. As shown in FIG. 13, the flood depth on April 2 in the first region 2036 is 2.0 meters, and the flood depth on April 2 in the second region 2037 is 1.0 meters.
- the three-dimensional bar 2046 in the first region 2036 has a height corresponding to 2.0 meters
- the three-dimensional bar 2047 in the second region 2037 has a height of , with a height corresponding to 1.7 meters.
- the index value of the first region 2036 is updated, and the height of the three-dimensional bar 2046 of the first region 2036 is updated.
- the maximum value of the flood depth in the second region 2037 has not been updated, the index value of the second region 2037 is maintained, and the height of the three-dimensional bar 2047 in the second region 2037 is maintained.
- FIG. 16 is an explanatory diagram of the maximum flood depth on the third date.
- FIG. 16 shows a bar graph showing the maximum flood depth on the third date.
- FIG. 16 shows an example in which April 3rd, which is the day after the second date, is used as the third date, which is earlier than the second date.
- the flood depth on April 3 in the first area 2036 is 0.7 meters
- the flood depth on April 3 in the second area 2037 is 0.5 meters.
- three-dimensional bar 2046 in first region 2036 has a height corresponding to 2.0 meters
- three-dimensional bar 2047 in second region 2037 has a height of , with a height corresponding to 1.7 meters.
- the first region 2036 and the second region 2037 maintain their index values due to the maintenance of the maximum value of the immersion depth, and the heights of the three-dimensional bars 2046 and 2047 maintained.
- the three-dimensional bar 2046 and three-dimensional bar 2047 shown in FIGS. 14 to 16 are superimposed on the two-dimensional map 202 shown in FIG. 6 and the like. Note that specific numerical values such as dates, periods, and flood depths shown in FIGS. 13 to 16 are examples.
- a three-dimensional bar 204 representing index values for each date and each area 203 is superimposed on the two-dimensional map 202 of the survey target area 201.
- Statistical value information 206 representing the temporal transition of the statistic value of the index value is displayed.
- the statistical value information 206 an arbitrary date during the survey period is specified according to user's operation or the like.
- the damage information display screen 200 or the like displays damage information for a designated date. This allows the user to grasp the degree of damage for each area 203 on any date during the investigation period.
- a three-dimensional bar 204 has a height corresponding to the index value for each region 203 .
- the three-dimensional bar 204 is given a color corresponding to the ratio of the index value for each area 203 to the index value for the entire survey area 201 . As a result, the distribution of index values in the survey target area 201 can be grasped at a glance.
- a damage information display screen 300 shown in FIG. 9 uses a three-dimensional bar 304 whose width is adjusted to be narrower than the three-dimensional bar 204 shown in FIG. 6 and the like. As a result, in the damage information display screen 300, deterioration in the visibility of each three-dimensional bar 304 in a portion where the density of the three-dimensional bars 304 is relatively high is suppressed.
- an emphasis mark 320 is added to the area 203 that satisfies the defined emphasis condition. Thereby, the area 203 with the emphasis mark 320 can be made conspicuous with respect to the other areas 203 .
- a damage information display screen 400 shown in FIG. 10 displays an index value designation button group 404 for designating the type of index value used in the three-dimensional bar 204 .
- the index value designation button group 404 includes two or more index value designation buttons 402 . Thereby, the user can specify the index value designation button 402 corresponding to the desired index value to display the three-dimensional bar 204 corresponding to the desired index value on the damage information display screen 400 .
- a warning mark 502 is displayed at the position of the three-dimensional bar 2045 corresponding to the area 2035 that satisfies the specified warning condition. Thereby, the user can grasp the area 203 that matches the warning condition at a glance of the damage information display screen 500 .
- the maximum value of the flood depth in a specified period is used as the index value.
- Three-dimensional bar 204 has a height corresponding to the maximum flood depth up to the date specified using time slider 210 . Thereby, the user can grasp the maximum value of the index value in the prescribed period.
- a damage information display screen for displaying damage information at a specified time can be configured.
- a damage information display screen that acquires damage information on a weekly basis and a monthly basis in a specified period, and displays the time transition of the damage information on a weekly basis and the damage information on the specified week.
- the date described in the embodiment is an example of date and time.
- Each date described in the embodiment is an example of each date and time.
- the external storage device 15 shown in FIG. 1 can include a first storage device that stores the map database 24 and a second storage device that stores the damage information database 25.
- the external storage device 15 may be connected to the information processing terminal device 12 without going through the network 18 .
- one three-dimensional bar 204 is displayed for one region 203, but when a plurality of index values are calculated for one region 203, may be used to display a plurality of three-dimensional bars 204 .
- the A second bar may be generated corresponding to the first bar and the second index value.
- one index value or two or more index values may be selectively generated from among the plurality of index values. According to this aspect, it is possible to grasp the degree of a plurality of pieces of damage information for one area.
- the first damage information in this aspect is an example of the first investigation target information.
- the second damage information is an example of the second investigation target information.
- the first bar is an example of a first index value bar.
- the second bar is an example of a second index value bar.
- the index value used for the three-dimensional bar 204 shown in FIG. may be different.
- the index value used for the three-dimensional bar 204 shown in FIG. 6 may be the number of unsurveyed houses, which is the index value used for the time transition information 220. Also, a first bar representing the number of unsurveyed houses and a second bar representing the number of surveyed houses may be generated and displayed.
- the information processing system shown in this embodiment can be applied to surveys targeting regions and areas divided based on geographical names such as addresses. For example, it can be applied to surveys on taxes, surveys on land, and surveys on residents conducted by local governments.
Landscapes
- Business, Economics & Management (AREA)
- Tourism & Hospitality (AREA)
- Marketing (AREA)
- Primary Health Care (AREA)
- Health & Medical Sciences (AREA)
- Economics (AREA)
- General Health & Medical Sciences (AREA)
- Human Resources & Organizations (AREA)
- Development Economics (AREA)
- Educational Administration (AREA)
- Strategic Management (AREA)
- Physics & Mathematics (AREA)
- General Business, Economics & Management (AREA)
- General Physics & Mathematics (AREA)
- Engineering & Computer Science (AREA)
- Theoretical Computer Science (AREA)
- User Interface Of Digital Computer (AREA)
Priority Applications (1)
| Application Number | Priority Date | Filing Date | Title |
|---|---|---|---|
| JP2023527576A JPWO2022259801A1 (https=) | 2021-06-10 | 2022-05-11 |
Applications Claiming Priority (2)
| Application Number | Priority Date | Filing Date | Title |
|---|---|---|---|
| JP2021-097103 | 2021-06-10 | ||
| JP2021097103 | 2021-06-10 |
Publications (1)
| Publication Number | Publication Date |
|---|---|
| WO2022259801A1 true WO2022259801A1 (ja) | 2022-12-15 |
Family
ID=84424844
Family Applications (1)
| Application Number | Title | Priority Date | Filing Date |
|---|---|---|---|
| PCT/JP2022/019915 Ceased WO2022259801A1 (ja) | 2021-06-10 | 2022-05-11 | 情報処理装置、情報処理方法及びプログラム |
Country Status (2)
| Country | Link |
|---|---|
| JP (1) | JPWO2022259801A1 (https=) |
| WO (1) | WO2022259801A1 (https=) |
Cited By (1)
| Publication number | Priority date | Publication date | Assignee | Title |
|---|---|---|---|---|
| WO2026053820A1 (ja) * | 2024-09-03 | 2026-03-12 | 富士フイルム株式会社 | 情報処理装置、情報処理方法、プログラム、及び情報処理システム |
Citations (4)
| Publication number | Priority date | Publication date | Assignee | Title |
|---|---|---|---|---|
| JP2012018604A (ja) * | 2010-07-09 | 2012-01-26 | Nippon Telegr & Teleph Corp <Ntt> | 災害危機管理装置、被害レベル計算方法、およびプログラム |
| JP2013186675A (ja) * | 2012-03-07 | 2013-09-19 | Yahoo Japan Corp | イベント情報提供装置、イベント情報提供方法及びイベント情報提供プログラム |
| JP2015072612A (ja) * | 2013-10-03 | 2015-04-16 | 株式会社日立製作所 | 早期状況把握方法、および装置 |
| JP2017003596A (ja) * | 2007-02-09 | 2017-01-05 | 株式会社ユピテル | 目標物検出装置及びプログラム |
Family Cites Families (3)
| Publication number | Priority date | Publication date | Assignee | Title |
|---|---|---|---|---|
| JP6381252B2 (ja) * | 2014-03-31 | 2018-08-29 | 株式会社早稲田エルダリーヘルス事業団 | 移動運動解析装置及びプログラム |
| JP6141360B2 (ja) * | 2015-06-29 | 2017-06-07 | 日本瓦斯株式会社 | 管理システム及びその方法 |
| JP6693900B2 (ja) * | 2017-03-16 | 2020-05-13 | ヤフー株式会社 | コンテンツ提供装置、コンテンツ提供方法およびコンテンツ提供プログラム |
-
2022
- 2022-05-11 WO PCT/JP2022/019915 patent/WO2022259801A1/ja not_active Ceased
- 2022-05-11 JP JP2023527576A patent/JPWO2022259801A1/ja active Pending
Patent Citations (4)
| Publication number | Priority date | Publication date | Assignee | Title |
|---|---|---|---|---|
| JP2017003596A (ja) * | 2007-02-09 | 2017-01-05 | 株式会社ユピテル | 目標物検出装置及びプログラム |
| JP2012018604A (ja) * | 2010-07-09 | 2012-01-26 | Nippon Telegr & Teleph Corp <Ntt> | 災害危機管理装置、被害レベル計算方法、およびプログラム |
| JP2013186675A (ja) * | 2012-03-07 | 2013-09-19 | Yahoo Japan Corp | イベント情報提供装置、イベント情報提供方法及びイベント情報提供プログラム |
| JP2015072612A (ja) * | 2013-10-03 | 2015-04-16 | 株式会社日立製作所 | 早期状況把握方法、および装置 |
Cited By (1)
| Publication number | Priority date | Publication date | Assignee | Title |
|---|---|---|---|---|
| WO2026053820A1 (ja) * | 2024-09-03 | 2026-03-12 | 富士フイルム株式会社 | 情報処理装置、情報処理方法、プログラム、及び情報処理システム |
Also Published As
| Publication number | Publication date |
|---|---|
| JPWO2022259801A1 (https=) | 2022-12-15 |
Similar Documents
| Publication | Publication Date | Title |
|---|---|---|
| Jucker | Deciphering the fingerprint of disturbance on the three‐dimensional structure of the world’s forests | |
| Harig et al. | The tsunami scenario database of the Indonesia Tsunami Early Warning System (InaTEWS): Evolution of the coverage and the involved modeling approaches | |
| Yonekura et al. | A statistical model of tropical cyclone tracks in the western North Pacific with ENSO-dependent cyclogenesis | |
| KR20110039190A (ko) | 데이터 세트의 시각화 | |
| CN116482763B (zh) | 基于逻辑树法的概率性地震海啸灾害分析方法 | |
| Becerril et al. | The historical case of Paricutin volcano (Michoacán, México): challenges of simulating lava flows on a gentle slope during a long-lasting eruption | |
| CN117391305B (zh) | 一种土地空间信息的构建方法、系统、电子设备及介质 | |
| CN112001435A (zh) | 区域滑坡预警中训练样本集的构建方法、系统及存储介质 | |
| WO2022259801A1 (ja) | 情報処理装置、情報処理方法及びプログラム | |
| KR102350254B1 (ko) | 격자기반 데이터를 활용한 시공간적 변화 패턴 도시방법 | |
| Dyadkov et al. | The expert earthquake database (EEDB) for seismic-geodynamic research | |
| CN115186037B (zh) | 地图显示方法、装置、电子设备和计算机可读介质 | |
| JP2009251250A (ja) | 数値地図データ処理方法、数値地図データ処理プログラム及び数値地図データ処理装置。 | |
| JP2008209417A (ja) | 画像解析装置およびその方法、並びにプログラム | |
| JP6127386B2 (ja) | 生態環境策定方法及びその装置 | |
| CN111950134B (zh) | 基于bim的地质灾害评估方法、装置及计算机可读存储介质 | |
| CN118628681A (zh) | 城市群生态安全格局图生成方法、系统及计算机设备 | |
| JP2012247585A (ja) | レーザプロファイラデータから浸水予測地点を抽出する方法 | |
| CN115936158A (zh) | 一种基于集成学习的人口空间化方法及系统 | |
| Thomas et al. | A method for planning disaster risk management and calibrating disaster relief efforts: application to the 2009 and 2022 Tonga tsunamis | |
| Sarup et al. | Study of tectonics in relation to the seismic activity of the Dalvat area, Nasik District, Maharashtra, India using remote sensing and GIS techniques | |
| Anugrah et al. | Real-time Geographic Information System (GIS) for Monitoring the Area of Potential Water Level Using Rule Based System | |
| CN116684886B (zh) | 一种基于兵棋棋盘的卫星蜂窝网络规划方法 | |
| Zolfaghari | Use of raster-based data layers to model spatial variation of seismotectonic data in probabilistic seismic hazard assessment | |
| CN119941774B (zh) | 一种基于多源数据的形变斜坡提取方法、装置及设备 |
Legal Events
| Date | Code | Title | Description |
|---|---|---|---|
| 121 | Ep: the epo has been informed by wipo that ep was designated in this application |
Ref document number: 22819985 Country of ref document: EP Kind code of ref document: A1 |
|
| WWE | Wipo information: entry into national phase |
Ref document number: 2023527576 Country of ref document: JP |
|
| NENP | Non-entry into the national phase |
Ref country code: DE |
|
| 122 | Ep: pct application non-entry in european phase |
Ref document number: 22819985 Country of ref document: EP Kind code of ref document: A1 |