WO2022244388A1 - 気象観測装置、気象観測システム、および、気象観測方法 - Google Patents
気象観測装置、気象観測システム、および、気象観測方法 Download PDFInfo
- Publication number
- WO2022244388A1 WO2022244388A1 PCT/JP2022/009544 JP2022009544W WO2022244388A1 WO 2022244388 A1 WO2022244388 A1 WO 2022244388A1 JP 2022009544 W JP2022009544 W JP 2022009544W WO 2022244388 A1 WO2022244388 A1 WO 2022244388A1
- Authority
- WO
- WIPO (PCT)
- Prior art keywords
- water vapor
- data
- echo
- spectrum
- weather
- Prior art date
- Legal status (The legal status is an assumption and is not a legal conclusion. Google has not performed a legal analysis and makes no representation as to the accuracy of the status listed.)
- Ceased
Links
Images



Classifications
-
- G—PHYSICS
- G01—MEASURING; TESTING
- G01J—MEASUREMENT OF INTENSITY, VELOCITY, SPECTRAL CONTENT, POLARISATION, PHASE OR PULSE CHARACTERISTICS OF INFRARED, VISIBLE OR ULTRAVIOLET LIGHT; COLORIMETRY; RADIATION PYROMETRY
- G01J1/00—Photometry, e.g. photographic exposure meter
- G01J1/42—Photometry, e.g. photographic exposure meter using electric radiation detectors
-
- G—PHYSICS
- G01—MEASURING; TESTING
- G01N—INVESTIGATING OR ANALYSING MATERIALS BY DETERMINING THEIR CHEMICAL OR PHYSICAL PROPERTIES
- G01N21/00—Investigating or analysing materials by the use of optical means, i.e. using sub-millimetre waves, infrared, visible or ultraviolet light
- G01N21/17—Systems in which incident light is modified in accordance with the properties of the material investigated
- G01N21/25—Colour; Spectral properties, i.e. comparison of effect of material on the light at two or more different wavelengths or wavelength bands
- G01N21/31—Investigating relative effect of material at wavelengths characteristic of specific elements or molecules, e.g. atomic absorption spectrometry
- G01N21/35—Investigating relative effect of material at wavelengths characteristic of specific elements or molecules, e.g. atomic absorption spectrometry using infrared light
- G01N21/3504—Investigating relative effect of material at wavelengths characteristic of specific elements or molecules, e.g. atomic absorption spectrometry using infrared light for analysing gases, e.g. multi-gas analysis
-
- G—PHYSICS
- G01—MEASURING; TESTING
- G01W—METEOROLOGY
- G01W1/00—Meteorology
-
- Y—GENERAL TAGGING OF NEW TECHNOLOGICAL DEVELOPMENTS; GENERAL TAGGING OF CROSS-SECTIONAL TECHNOLOGIES SPANNING OVER SEVERAL SECTIONS OF THE IPC; TECHNICAL SUBJECTS COVERED BY FORMER USPC CROSS-REFERENCE ART COLLECTIONS [XRACs] AND DIGESTS
- Y02—TECHNOLOGIES OR APPLICATIONS FOR MITIGATION OR ADAPTATION AGAINST CLIMATE CHANGE
- Y02A—TECHNOLOGIES FOR ADAPTATION TO CLIMATE CHANGE
- Y02A90/00—Technologies having an indirect contribution to adaptation to climate change
- Y02A90/10—Information and communication technologies [ICT] supporting adaptation to climate change, e.g. for weather forecasting or climate simulation
Definitions
- the present invention relates to a weather observation device, a weather observation system, and a weather observation method.
- Radar devices such as X-band radars are known as weather radars (see Patent Document 1, for example).
- a weather radar device transmits transmission waves (radio waves) around the weather radar device, and receives reflected waves reflected by moisture or the like as received waves. Then, the weather radar apparatus performs signal processing on the received wave to generate echo data indicating the relationship between the distance from the weather radar antenna and the strength of the echo signal as weather data.
- the microwave radiometer measures the amount of water vapor in the observation area by receiving natural radiation from the observation area in the atmosphere as receiving waves (microwaves) (see Patent Document 2, for example).
- microwave radiometers are easily affected by rain, and it is difficult to accurately estimate the amount of water vapor in the atmosphere during rainy weather.
- the present invention provides a more accurate measurement of the amount of water vapor in the atmosphere using a microwave radiometer, even in situations where it is difficult for the microwave radiometer to accurately measure the amount of water vapor in the atmosphere.
- An object of the present invention is to provide a meteorological observation device, a meteorological observation system, and a meteorological observation method capable of making accurate measurements.
- a weather observation apparatus includes an echo data acquisition unit that acquires echo data detected by a weather radar device, and water vapor detected by a microwave radiometer.
- a water vapor spectrum data acquisition unit that acquires water vapor spectrum data specifying an amount;
- a region identification unit that specifies a region for acquiring the water vapor spectrum data;
- an echo data extraction unit that extracts echo data existing in the region;
- a spectrum correction unit that corrects the water vapor spectrum data based on the echo intensity of the echo data extracted by the echo data extraction unit.
- the spectrum correction unit may correct the water vapor spectrum data using the precipitation intensity specified by the echo data.
- the spectrum correction unit may correct the water vapor spectrum data according to the approximate sum of precipitation intensities in the region.
- the spectrum correction unit may subtract, from at least the peak value of the water vapor spectrum data, a value corresponding to the approximate sum of precipitation intensities in the region.
- the area may be an area within a predetermined angular range with respect to the microwave radiometer.
- an echo image showing the intensity of precipitation around the weather radar device based on the echo data may generate an image of the area of occurrence
- a weather observation system includes a weather radar device that observes weather conditions, including at least precipitation intensity, around the device by transmitting and receiving electromagnetic waves; A microwave radiometer that detects the amount of water vapor by receiving spectral data of water vapor radiated from the water vapor contained therein, and the weather observation device.
- a weather observation method acquires echo data detected by a weather radar device, and specifies the amount of water vapor detected by a microwave radiometer. Spectral data is acquired, a region for acquiring the water vapor spectral data is specified, echo data existing in the region is extracted, and the water vapor spectral data is corrected based on the echo intensity of the extracted echo data.
- the microwave radiometer even if it is difficult for the microwave radiometer to accurately measure the amount of water vapor in the atmosphere, it is possible to more accurately measure the amount of water vapor in the atmosphere using the microwave radiometer.
- FIG. 1 is a block diagram showing the configuration of a weather observation system according to one embodiment of the present invention
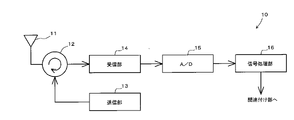
- FIG. 1 is a block diagram showing the configuration of a weather radar device of a weather observation system
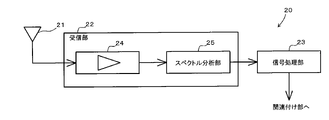
- FIG. 1 is a block diagram showing the configuration of a microwave radiometer of a weather observation system
- FIG. 4A is a schematic plan view showing the observation area of the weather observation system
- FIG. 4B is a schematic echo image showing the observation results of the observation area by the weather radar device.
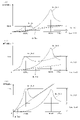
- FIGS. 5A to 5C are schematic spectrum diagrams showing the observation results of the observation area by the microwave radiometer.
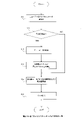
- 7 is a flowchart showing an example of spectral data correction processing in an associating unit; It is a schematic diagram which shows the correction
- 5 is a flowchart showing an example of echo data correction processing in an echo data correction unit
- FIG. 4 is a schematic echo diagram showing a post-correction echo image
- FIG. 4 is a schematic echo
- FIG. 1 is a block diagram showing the configuration of a weather observation system 1 according to one embodiment of the present invention.
- the weather observation system 1 uses the echo data ED as data obtained by the weather radar device 10 and the spectrum data SD as data obtained by the microwave radiometer 20, so that the microwave radiometer 20 Correct the observations. With this correction, the weather observation system 1 measures the water vapor amount more accurately while the influence of rain is suppressed.
- the weather observation system 1 also corrects the echo data ED by using the spectrum data SD. With such a configuration, the weather observation system 1 can observe the amount of water vapor in the atmosphere that cannot be detected by the weather radar device 10 .
- FIG. 2 is a block diagram showing the configuration of the weather radar device 10 of the weather observation system 1.
- FIG. 3 is a block diagram showing the configuration of the microwave radiometer 20 of the weather observation system 1.
- FIG. 4A is a schematic plan view showing an observation area AR of the weather observation system 1.
- FIG. 4B is a schematic echo image showing the result of observation of the observation area AR by the weather radar device 10.
- FIG. 5A to 5C are schematic spectrum diagrams showing observation results of the observation area AR by the microwave radiometer 20.
- the observation area AR of the weather observation system 1 is an area with a predetermined radius centered on the observation point P1 installed on the ground.
- the radius of this observation area AR differs according to the frequency band and transmission power of the weather radar device 10 .
- Examples of the frequency band of the weather radar device 10 include S band (2.8 GHz band), C band (5 GHz band), and X band (9.7 GHz band).
- the weather radar device 10 and the microwave radiometer 20 observe a predetermined elevation angle range from the observation point P1 as an observation area AR.
- one precipitation area AR1 which is an area in which precipitation occurs, is shown in the observation area AR.
- two high humidity areas AR2 and AR3 are indicated as high humidity areas AR2 and AR3 where no precipitation occurs but the amount of moisture in the atmosphere is greater than that of other non-precipitation areas.
- the high humidity areas AR2 and AR3 are areas where cumulonimbus clouds are likely to occur, and are areas where so-called guerrilla rainstorms are likely to occur. This embodiment will be described on the premise that the amount of water vapor and the amount of cloud water are the same in the high humidity areas AR2 and AR3.
- the high humidity area AR2 is present at a position straight ahead from the precipitation area AR1 along a predetermined straight line direction (radial direction) from the observation point P1. Therefore, when the high humidity area AR2 is viewed from the observation point P1, the high humidity area AR2 is visible through the rain area AR1. Also, the high humidity area AR3 exists at a position straight ahead from the observation point P1 along the direction opposite to the straight line direction. Therefore, when the high humidity area AR3 is viewed from the observation point P1, the high humidity area AR3 is visible without passing through the rain area AR1.
- the weather observation system 1 includes a weather radar device 10, a microwave radiometer 20, an association unit 30 (weather observation device), and a display unit 40.
- the weather radar device 10 By transmitting and receiving electromagnetic waves, the weather radar device 10 observes the weather conditions around itself, including at least the precipitation intensity.
- the weather radar device 10 has an antenna 11 , a circulator 12 , a transmitter 13 , a receiver 14 , an A/D converter 15 and a signal processor 16 .
- the antenna 11 is configured to transmit radar transmission waves, which are electromagnetic waves, and receive radar reception waves (reflected waves), which are electromagnetic waves. Specifically, the antenna 11 outputs a radar transmission wave output from the transmitter 13 via the circulator 12 . Also, the antenna 11 receives a radar received wave and outputs the radar received wave to the receiving section 14 via the circulator 12 .
- the antenna 11 rotates around the vertical axis L1 on the observation point P1, transmits radar transmission waves to 360 degrees around the observation point P1, and receives radar reception waves.
- the operation from transmitting a radar transmission wave to transmitting the next radar transmission wave is referred to as "sweep".
- the operation of rotating the antenna 11 by 360° while transmitting and receiving electromagnetic waves is called “scanning”.
- the radar reception waves received after the weather radar device 10 has transmitted the radar transmission waves contain echo signals reflected by rain or the like.
- the radar transmission wave generated by the transmission unit 13 is a transmission signal obtained by up-converting a predetermined radar transmission waveform into a predetermined RF (Radio Frequency) frequency band and amplifying it.
- the receiving unit 14 amplifies the radar reception wave from the antenna 11.
- the receiving section 14 outputs the amplified received radar wave to the A/D converting section 15 .
- the A/D converter 15 converts the received radar wave, which is an analog signal, into a received radar signal, which is a digital signal.
- the A/D converter 15 outputs the radar reception signal to the signal processor 16 .
- the signal processing unit 16 performs predetermined signal processing on the radar reception signal to generate echo data ED as data indicating the relationship between the distance from the observation point P1 and the echo intensity for each sweep. Then, the signal processing unit 16 generates echo data ED for one scan. Referring to FIG. 4(B), in echo image E specified by echo data ED for one scan, rain echo E1 exists in a region corresponding to rain region AR1. The signal intensity of the precipitation echo E1 corresponds to the precipitation intensity (precipitation amount) around the weather radar device 10 .
- the echo data ED includes a plurality of meteorological parameters such as precipitation amount, precipitation position, and cloud water content.
- the echo data ED generated by the signal processing section 16 is output to the associating section 30 .
- the precipitation detected by the weather radar device 10 is rain, but this need not be the case.
- the weather radar device 10 can also detect precipitation other than rain, such as rain, snow, hail, hail, and frost, as an echo.
- precipitation other than rain such as rain, snow, hail, hail, and frost
- the echo image E no echoes are present in locations corresponding to the high humidity areas AR2 and AR3, which are areas in which no precipitation occurs. That is, the weather radar device 10 does not detect the high humidity areas AR2 and AR3 regardless of whether or not there is water vapor.
- the microwave radiometer 20 detects the amount of water vapor by receiving spectral data of water vapor emitted from the water vapor contained in the atmosphere.
- the microwave radiometer 20 has an antenna 21 , a receiver 22 and a signal processor 23 .
- the antenna 21 is configured to receive radiation waves (microwaves) of the atmosphere in the observation area AR.
- the antenna 21 receives radiated waves and outputs the radiated waves to the LNA 24 of the receiving section 22, which will be described later.
- the antenna 21 receives radiation waves from 360 degrees around the observation point P1 while rotating around the vertical axis L1 at the observation point P1.
- the operation of receiving radiation waves at one angular position around the vertical axis L1 is called “sweep”.
- the operation of rotating the antenna 21 by 360° while receiving radiation waves is called “scanning”.
- reception of the antenna reception wave by the antenna 11 of the weather radar device 10 and reception of the radiation wave by the antenna 21 of the microwave radiometer 20 are performed simultaneously. That is, precipitation observation by the weather radar device 10 and water vapor observation by the microwave radiometer 20 are performed simultaneously.
- the angles (receiving angles) of the antennas 11 and 21 about the vertical axis L1 are preferably the same, but they do not have to be the same.
- the receiving section 22 has an LNA (Low Noise Amp) 24 and a spectrum analysis section 25 .
- LNA Low Noise Amp
- the LNA 24 amplifies the radiated waves and outputs the amplified radiated waves to the spectrum analysis section 25 .
- the spectrum analysis unit 25 generates spectrum data SD indicating the relationship between the frequency f and the signal strength a.
- the spectrum data SD includes water vapor spectrum data specifying the amount of water vapor detected by the microwave radiometer 20 .
- FIGS. 5A to 5C show an example of the water vapor spectrum sv, the cloud water spectrum sl, and the oxygen spectrum so at one angular position among the angular positions around the vertical axis L1.
- Each spectrum sv, sl, and so is a spectrum with frequency f on the horizontal axis and signal strength a on the vertical axis.
- Spectral data SD includes data specifying spectra sv, sl, and so.
- the spectral data SD is data indicating a synthesized spectrum obtained by synthesizing the respective spectra sv, sl, and so. is shown.
- the water vapor spectrum sv is the intensity of the spectrum corresponding to the approximate sum of the amount of water vapor in the directional region observed by the microwave radiometer 20. , and is a curve that rises to the right such that the signal strength is maximized in the vicinity of 22 GHz.
- the water vapor spectrum sv is a curve rising to the right along the cloud water spectrum sl.
- the cloud water spectrum sl indicates the amount of cloud water Lwc (Liquid Water Contents) at the location observed by the microwave radiometer 20, and has an upward curve.
- the cloud water content is the amount of fine water droplets contained in a unit volume of air.
- the oxygen spectrum so indicates the intensity of the spectrum corresponding to the sum of the amount of oxygen in the direction region observed by the microwave radiometer 20, and becomes a chevron-shaped curve with the maximum signal intensity near 60 GHz.
- FIG. 5(A) shows an example of each spectrum sv, sl, so (spectrum sv1, sl1, so1) in an area of the observation area AR that does not include any of the precipitation area AR1 and the high humidity areas AR2, AR3.
- FIG. 5B shows an example of each spectrum sv, sl, so (spectrum sv2, sl2, so2) in an area including the high humidity area AR3 in the observation area AR.
- FIG. 5(C) shows an example of each spectrum sv, sl, so (spectrum sv3, sl3, so3) in an area including the precipitation area AR1 and the high humidity area AR2 in the observation area AR.
- the signal intensity on the cloud water spectrum sl at the peak frequency of 22 GHz of the water vapor spectrum sv corresponds to the cloud water amount Lwc at the location observed by the microwave radiometer 20 .
- the difference between the cloud water content Lwc and the peak value PEAK of the water vapor spectrum sv corresponds to the water vapor content Vc.
- the water vapor amount Vc refers to the amount of water vapor contained as gas in the air.
- the amount of cloud water Lwc and the amount of water vapor Vc obtained by the microwave radiometer 20 that observes the predetermined area each increase in a short time. do. Therefore, by detecting changes in the amount of cloud water Lwc and the amount of water vapor Vc, it is possible to predict the occurrence of a torrential downpour.
- spectrum analysis section 25 outputs spectrum data SD to signal processing section 23.
- the signal processing unit 23 performs predetermined signal processing on the spectrum data SD to specify the water vapor content Vc, the cloud water content Lwc, and the temperature distribution based on the spectra sv, sl, and so at the observation points for each sweep.
- Spectral data SD and radiometer data ER are output to association unit 30 .
- the association unit 30 is connected to the weather radar device 10 and the microwave radiometer 20 so as to be able to communicate data wirelessly or by wire.
- the association unit 30 may be installed at the observation point P1, or may be installed at a meteorological observatory or the like separate from the observation point P1.
- the association unit 30 associates the echo data ED obtained by the weather radar device 10 and the spectrum data SD obtained by the microwave radiometer 20 with each other.
- the association unit 30 includes an echo data acquisition unit 31, a spectrum data acquisition unit 32, an area identification unit 33, an echo data extraction unit 34, a spectrum correction unit 35, and an echo correction unit 36.
- the spectrum data acquisition unit 32 includes a water vapor spectrum data acquisition unit.
- the association unit 30 is composed of a hardware processor 29 (eg, CPU, FPGA, etc.) and a device such as a non-volatile memory.
- a hardware processor 29 eg, CPU, FPGA, etc.
- the CPU reads a program from the nonvolatile memory and executes it, so that the associating unit 30 is configured as an echo data acquisition unit 31, a spectrum data acquisition unit 32, an area identification unit 33, an echo data extraction unit 34, a spectrum correction unit 35, and a It can function as an echo correction unit 36 .
- the cloud water spectrum sl1 obtained by observing an area that does not include any of the precipitation area AR1 and the high humidity areas AR2 and AR3 and the cloud water spectrum s2 obtained by observing the high humidity area AR3 are shown in the same graph.
- the peak value PEAK of the water vapor spectrum sv1 obtained by observing an area that does not include the precipitation area AR1 and the high humidity areas AR2 and AR3 is big.
- Water vapor spectrum sv3 and cloud water spectrum sl3 obtained by observing precipitation area AR1 and high humidity area AR2 have higher water vapor content Vc3 and cloud It shows the amount of water Lwc3.
- the water vapor content and cloud water content in the high humidity area AR2 and the corresponding water vapor content and cloud water content in the high humidity area AR3 are the same.
- the water vapor amount Vc3 and the cloud water amount Lwc3 indicated by the water vapor spectrum sv3 and the cloud liquid water spectrum sl3 have an error with respect to the actual water vapor amount and the cloud water amount.
- This deviation is because the radiated wave incident on the antenna 21 of the microwave radiometer 20 contains a component caused by precipitation in the precipitation area AR1.
- the measurement results of the microwave radiometer 20 are easily affected by precipitation, and it is difficult to accurately calculate the amount of water vapor in the atmosphere during rainy weather.
- the weather radar device 10 can detect echoes of precipitation, it is difficult to observe water vapor in the atmosphere.
- the association unit 30 corrects the spectrum data SD using the echo data ED in order to correct the above-described error between the water vapor content and the cloud water content. More specifically, the association unit 30 corrects the water vapor amount Vc specified by the spectrum data SD using the precipitation intensity EDP specified by the echo data ED. An example of processing for correcting the spectrum data SD in the associating unit 30 will be described later.
- the echo correction unit 36 in the association unit 30 performs correction by adding data indicating high humidity areas to locations corresponding to the high humidity areas AR2 and AR3 in the echo image E specified by the echo data ED. More specifically, the echo correction unit 36 adds data specifying the water vapor amount Vc to the echo data ED by combining the water vapor spectrum data specifying the water vapor spectrum sv with the echo data ED. An example of echo data supplementation processing in the echo correction unit 36 will be described later.
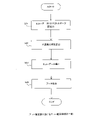
- FIG. 6 is a flowchart showing an example of spectral data correction processing in the association unit 30.
- FIG. 6 is a flowchart showing an example of spectral data correction processing in the association unit 30.
- the association unit 30 first reads echo data ED and spectrum data SD for one sweep. More specifically, the echo data acquisition unit 31 acquires echo data ED detected by the weather radar device 10 .
- the spectral data acquisition unit 32 acquires spectral data SD including a water vapor spectrum sv specifying the amount of water vapor detected by the microwave radiometer 20 (step S11).
- the region specifying unit 33 specifies a region for obtaining spectral data SD including the water vapor spectrum sv, based on the echo data ED.
- the area is a predetermined angle based on the microwave radiometer 20, that is, a range of a predetermined angle for one or more sweeps.
- the area specifying unit 33 determines whether or not a rain area (for example, rain area AR1) exists in the area specified by the echo data ED (step S12).
- the echo data extraction unit 34 extracts the echo data ED present in the rain area AR1 (step S13). Then, the spectrum correction unit 35 corrects the spectrum data SD based on the echo intensity of the echo data ED extracted by the echo data extraction unit 34 (step S14). More specifically, the spectrum correction unit 35 corrects the spectrum data SD including the water vapor spectrum sv according to the approximate sum of the rainfall intensities in the regions identified by the region identification unit 33 . For example, the spectrum correction unit 35 subtracts, from at least the peak value of the spectrum data SD including the water vapor spectrum sv, a value corresponding to the approximate sum of the rainfall intensities in the region. Specifically, as shown in FIG.
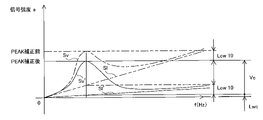
- FIG. 7 is a schematic diagram showing a corrected image of the water vapor spectrum sv.
- the spectrum correction unit 35 corrects the amount of water vapor Vc and the amount of cloud water Lwc specified by the radiometer data ER so that the amount of water vapor Vc and the amount of cloud water Lwc specified by the spectrum data SD or corrected spectrum data SD′ are obtained. is updated to generate corrected radiometer data ER' (step S15).
- step S12 determines whether the precipitation area is included (NO in step S12). If it is determined in step S12 that the precipitation area is not included (NO in step S12), the spectrum correction unit 35 does not correct the spectrum data SD.
- the spectrum correction unit 35 outputs the spectrum data SD or the corrected spectrum data SD' after the above processing is performed to the echo correction unit 36, and displays the radiometer data ER or the corrected radiometer data ER'. Output to the unit 40 (step S16).
- the area specifying unit 33 may repeat the above-described processing of steps S11 to S15 for each sweep data or for each scan data.
- echo data processing is performed by the echo correction unit 36 after processing by the spectrum correction unit 35 for data of one sweep.
- FIG. 8 is a flowchart showing an example of echo data correction processing in the echo correction unit 36.
- the echo correction unit 36 first reads the echo data ED for one sweep and the spectrum data SD or corrected spectrum data SD' (step S21).
- the echo correction unit 36 calculates the distribution of the amount of water vapor along the distance direction (radiation wave reception direction) from the observation point P1 specified by the spectrum data SD or the corrected spectrum data SD' (step S22).
- the water vapor content distribution can be calculated, for example, by solving an inverse problem with respect to the water vapor spectra sv, sv' specified by the spectrum data SD or corrected spectrum data SD'.
- the echo correction unit 36 generates corrected echo data ED' by correcting the echo data ED (step S23). More specifically, the echo correction unit 36 corrects an echo image indicating the rainfall intensity around the weather radar device 10 based on the echo data ED, and a part indicating the area identified by the area identification unit 33 in the echo image. Then, a water vapor generation area image is generated based on the water vapor spectrum sv corrected by the spectrum correction unit 35 . Specifically, as shown in FIG. 9, the echo correction unit 36 displays echo images E2 and E3 having signal intensities corresponding to the amount of water vapor in the echo image E' specified by the post-correction echo data ED'. The echo data ED is corrected as follows. As a result, echo images E2 and E3 representing the humid areas AR2 and AR3, which were not displayed in the echo image E, are displayed in the corrected echo image E'. FIG. 9 is a schematic echo diagram showing the post-correction echo image E'.
- the echo correction unit 36 outputs the corrected echo data ED' to the display unit 40 (step S24).
- the echo correction unit 36 may repeat the above-described processing of steps S21 to S24 for each sweep data or for each scan data.
- the display unit 40 is an image display device such as a liquid crystal display.
- the display unit 40 displays an image based on the given corrected echo data ED' and radiometer data ER.
- the corrected echo image E′ indicated by the corrected echo data ED′ is displayed on a part of the screen of the display unit 40, and the water vapor specified by the radiometer data ER is displayed on a part of the display unit 40.
- An image showing the amount or the like numerically can be exemplified.
- the echo data acquisition unit 31 acquires the echo data ED detected by the weather radar device 10 .
- the water vapor spectrum data acquisition unit acquires spectrum data SD including a water vapor spectrum sv specifying the amount of water vapor detected by the microwave radiometer 20 .
- the region specifying unit 33 specifies a region for obtaining spectrum data SD including the water vapor spectrum sv.
- the echo data extractor 34 extracts the echo data ED existing in the area.
- the spectrum correction section 35 corrects the spectrum data SD including the water vapor spectrum sv based on the echo intensity of the echo data ED extracted by the echo data extraction section 34 .
- the spectrum correction unit 35 corrects the water vapor spectrum sv using the precipitation intensity EDP specified by the echo data ED. According to this configuration, the increase in the amount of water vapor and the amount of water vapor specified by the water vapor spectrum sv or the like caused by the increase in the amount of water vapor due to rainfall can be more accurately corrected by the spectrum correction unit 35 .
- the echo correction unit 36 adds the echo image indicating the rainfall intensity around the weather radar device 10 based on the echo data ED, and the spectral correction unit 35 generates a water vapor generation area image based on the corrected water vapor spectrum sv.
- the amount of water vapor echo images E2 and E3, which is difficult to detect with the weather radar device 10, can be indicated by the echo image E'.
- a user or the like viewing the echo image E' can more accurately grasp the weather in the observation area AR.
- the present invention can be widely applied as a weather observation device, a weather observation system, and a weather observation method.
- weather observation system 10 weather radar device 13 transmitter 14 receiver 20 microwave radiometer 22 receiver 30 association unit (weather observation device) 31 Echo data acquisition unit 32 Spectrum data acquisition unit 33 Region identification unit 34 Echo data extraction unit 35 Spectrum correction unit 36 Echo correction unit a Signal intensity ED Echo data EDP Precipitation intensity f Frequency Lwc Cloud water amount SD Spectrum data Vc Water vapor content
Landscapes
- Physics & Mathematics (AREA)
- Spectroscopy & Molecular Physics (AREA)
- Environmental & Geological Engineering (AREA)
- General Physics & Mathematics (AREA)
- Life Sciences & Earth Sciences (AREA)
- Analytical Chemistry (AREA)
- Health & Medical Sciences (AREA)
- Biochemistry (AREA)
- General Health & Medical Sciences (AREA)
- Immunology (AREA)
- Pathology (AREA)
- Engineering & Computer Science (AREA)
- Chemical & Material Sciences (AREA)
- Atmospheric Sciences (AREA)
- Biodiversity & Conservation Biology (AREA)
- Ecology (AREA)
- Environmental Sciences (AREA)
- Radar Systems Or Details Thereof (AREA)
Abstract
マイクロ波放射計が大気中の水蒸気量を正確に測定することが困難な状況にあっても、マイクロ波放射計を用いた大気中の水蒸気量をより正確に測定できる気象観測装置、気象観測システム、および、気象観測方法を提供する。 気象観測装置(30)は、気象レーダ装置(10)で検出されたエコーデータを取得するエコーデータ取得部(31)と、マイクロ波放射計(20)で検出された水蒸気量を特定する水蒸気スペクトルデータを取得する水蒸気スペクトルデータ取得部(32)と、前記水蒸気スペクトルデータを取得する領域を特定する領域特定部(33)と、前記領域に存在するエコーデータを抽出するエコーデータ抽出部(34)と、前記エコーデータ抽出部(34)で抽出した前記エコーデータのエコー強度に基づいて、前記水蒸気スペクトルデータを補正するスペクトル補正部(35)と、を備える。
Description
本発明は、気象観測装置、気象観測システム、および、気象観測方法に関する。
気象レーダとして、Xバンドレーダ等のレーダ装置が知られている(例えば、特許文献1参照)。気象レーダ装置は、当該気象レーダ装置の周囲に送信波(電波)を送信し、水分等に反射した反射波等を受信波として受信する。そして、気象レーダ装置は、受信波に信号処理を施すことで、気象レーダアンテナからの距離とエコー信号の強さとの関係を示すエコーデータを、気象データとして生成する。
また、マイクロ波放射計は、大気中の観測領域からの自然放射を受信波(マイクロ波)として受信することで、観測領域における水蒸気量等を計測する(例えば、特許文献2参照)。
上述した気象観測装置のうち、マイクロ波放射計は、雨の影響を受け易く、雨天時に大気中の水蒸気量を正確に推定することが難しい。
本発明は、上記実情に鑑みることにより、マイクロ波放射計が大気中の水蒸気量を正確に測定することが困難な状況にあっても、マイクロ波放射計を用いた大気中の水蒸気量をより正確に測定できる気象観測装置、気象観測システム、および、気象観測方法を提供することを目的とする。
(1)上記課題を解決するために、この発明のある局面に係わる気象観測装置は、気象レーダ装置で検出されたエコーデータを取得するエコーデータ取得部と、マイクロ波放射計で検出された水蒸気量を特定する水蒸気スペクトルデータを取得する水蒸気スペクトルデータ取得部と、前記水蒸気スペクトルデータを取得する領域を特定する領域特定部と、前記領域に存在するエコーデータを抽出するエコーデータ抽出部と、前記エコーデータ抽出部で抽出した前記エコーデータのエコー強度に基づいて、前記水蒸気スペクトルデータを補正するスペクトル補正部と、を備える。
(2)前記スペクトル補正部は、前記エコーデータで特定される降水強度を用いて前記水蒸気スペクトルデータを補正する場合がある。
(3)前記スペクトル補正部は、前記領域における降水強度の略総和に応じて、前記水蒸気スペクトルデータを補正する場合がある。
(4)前記スペクトル補正部は、当該領域における降水強度の略総和に応じた値を、前記水蒸気スペクトルデータのうち、少なくともピーク値から減算する場合がある。
(5)前記領域は、前記マイクロ波放射計を基準とした所定角度の範囲の領域である場合がある。
(6)前記エコーデータに基づいて前記気象レーダ装置の周囲の降水強度を示すエコー画像と、前記エコー画像のうち前記領域を示す箇所に、前記スペクトル補正部が補正した前記水蒸気スペクトルデータに基づく水蒸気発生エリア画像と、を生成する場合がある。
(7)上記課題を解決するために、この発明のある局面に係わる気象観測システムは、電磁波を送受信することで自装置の周囲の少なくとも降水強度を含む気象状況を観測する気象レーダ装置と、大気中に含まれる水蒸気から放射される水蒸気のスペクトルデータを受信することで水蒸気量を検出するマイクロ波放射計と、前記気象観測装置と、を備えている。
(8)上記課題を解決するために、この発明のある局面に係わる気象観測方法は、気象レーダ装置で検出されたエコーデータを取得し、マイクロ波放射計で検出された水蒸気量を特定する水蒸気スペクトルデータを取得し、前記水蒸気スペクトルデータを取得する領域を特定し、前記領域に存在するエコーデータを抽出し、抽出した前記エコーデータのエコー強度に基づいて、前記水蒸気スペクトルデータを補正する。
本発明によると、マイクロ波放射計が大気中の水蒸気量を正確に測定することが困難な状況にあっても、マイクロ波放射計を用いた大気中の水蒸気量をより正確に測定できる。
以下、本発明を実施するための形態について、図面を参照しつつ説明する。
図1は、本発明の一実施形態に係る気象観測システム1の構成を示すブロック図である。気象観測システム1は、気象レーダ装置10で得られたデータとしてのエコーデータEDと、マイクロ波放射計20で得られたデータとしてのスペクトルデータSDと、を用いることで、マイクロ波放射計20における観測結果を補正する。この補正により、気象観測システム1は、雨の影響を抑制された状態でより正確な水蒸気量を測定する。また、気象観測システム1は、スペクトルデータSDを用いることで、エコーデータEDを補正する。このような構成により、気象観測システム1は、気象レーダ装置10で捉えることのできない、大気中の水蒸気量を観測することが可能である。
図2は、気象観測システム1の気象レーダ装置10の構成を示すブロック図である。図3は、気象観測システム1のマイクロ波放射計20の構成を示すブロック図である。図4(A)は、気象観測システム1の観測領域ARを示す模式的な平面図である。図4(B)は、気象レーダ装置10による観測領域ARの観測結果を示す模式的なエコー画像である。図5(A)~図5(C)は、それぞれ、マイクロ波放射計20による観測領域ARの観測結果を示す模式的なスペクトル図である。
図4(A)を参照して、気象観測システム1の観測領域ARは、地上に設置された観測点P1を中心として、所定の半径の領域である。この観測領域ARの半径は、気象レーダ装置10の周波数帯及び送信電力に応じて異なる。気象レーダ装置10の周波数帯として、S帯(2.8GHz帯)、C帯(5GHz帯)、X帯(9.7GHz帯)を例示できる。気象レーダ装置10、および、マイクロ波放射計20は、観測点P1から所定の仰角範囲を観測領域ARとして観測する。
図4(A)において、一例として、観測領域ARにおいて、降水中の領域である降水領域AR1を一箇所示している。また、観測領域ARにおいて、降水は生じていないけれども大気中の水分量が他の非降水領域の水分量よりも多い多湿領域を多湿領域AR2,AR3として二箇所示している。多湿領域AR2,AR3は、積乱雲が発生するおそれのある領域であり、いわゆるゲリラ豪雨が発生するおそれのある領域である。本実施形態では、多湿領域AR2,AR3における水蒸気量および雲水量が同じである前提で説明する。
図4(A)に示す例において、多湿領域AR2は、観測点P1から所定の直線方向(径方向)に沿って降水領域AR1から真っ直ぐに進んだ位置に存在している。このため、観測点P1から多湿領域AR2を見たとき、降水領域AR1を通して多湿領域AR2が視認される。また、多湿領域AR3は、観測点P1から上記直線方向とは反対の方向に沿って真っ直ぐに進んだ位置に存在している。このため、観測点P1から多湿領域AR3を見たとき、降水領域AR1は通さずに多湿領域AR3が視認される。
図1~図4(A)を参照して、次に、気象観測システム1の構成を説明する。
気象観測システム1は、気象レーダ装置10と、マイクロ波放射計20と、関連付け部30(気象観測装置)と、表示部40と、を有している。
気象レーダ装置10は、電磁波を送受信することで自装置の周囲の少なくとも降水強度を含む気象状況を観測する。気象レーダ装置10は、アンテナ11と、サーキュレータ12と、送信部13と、受信部14と、A/D変換部15と、信号処理部16と、を有している。
アンテナ11は、電磁波であるレーダ送信波の送信と、電磁波であるレーダ受信波(反射波)の受信と、を行うように構成されている。具体的には、アンテナ11は、送信部13からサーキュレータ12を介して出力されたレーダ送信波を出力する。また、アンテナ11は、レーダ受信波を受信し、このレーダ受信波を、サーキュレータ12を介して受信部14へ出力する。
アンテナ11は、観測点P1上の鉛直軸L1回りを回転しつつ、観測点P1の周囲360度に対してレーダ送信波を送信するとともに、レーダ受信波を受信する。なお、以下の説明では、レーダ送信波を送信してから次のレーダ送信波を送信するまでの動作を、「スイープ」という。また、電磁波の送受信を行いながらアンテナ11を360°回転させる動作を、「スキャン」という。
気象レーダ装置10がレーダ送信波を送信した後に受信されるレーダ受信波は、雨等で反射されたエコー信号を含んでいる。送信部13で生成されるレーダ送信波は、所定のレーダ送信波形を所定のRF(Radio Frequency)周波数帯にアップコンバートおよび増幅された送信信号である。
受信部14は、アンテナ11からのレーダ受信波を増幅する。受信部14は、増幅したレーダ受信波を、A/D変換部15に出力する。
A/D変換部15は、アナログ信号であるレーダ受信波をデジタル信号であるレーダ受信信号に変換する。A/D変換部15は、レーダ受信信号を信号処理部16に出力する。
信号処理部16は、レーダ受信信号に所定の信号処理を施すことで、1スイープ毎に、観測点P1からの距離とエコー強度との関係を示すデータとしてのエコーデータEDを生成する。そして、信号処理部16は、1スキャン分のエコーデータEDを生成する。図4(B)を参照して、1スキャン分のエコーデータEDで特定されるエコー画像Eにおいて、降水領域AR1に対応する領域に、降水エコーE1が存在している。降水エコーE1の信号強度は、気象レーダ装置10の周囲の降水強度(降水量)に相当する。エコーデータEDは、降水量、降水位置、雲水量等の複数の気象パラメータを含んでいる。信号処理部16で生成されたエコーデータEDは、関連付け部30へ出力される。
再び図1~図4(A)を参照して、なお、本実施形態では、気象レーダ装置10で検出される降水が雨である形態を説明するけれどもこの通りでなくてもよい。気象レーダ装置10は、降雨以外の雨・雪・雹(ひょう)・霰(あられ)・霜等の降水もエコーとして検出可能である。但し、エコー画像Eでは、降水していない領域である多湿領域AR2,AR3に対応する箇所にエコーが存在していない。すなわち、気象レーダ装置10では、水蒸気の有無・多少に拠らず、多湿領域AR2,AR3は検出されない。
次に、マイクロ波放射計20の構成を説明する。
マイクロ波放射計20は、大気中に含まれる水蒸気から放射される水蒸気のスペクトルデータを受信することで水蒸気量を検出する。マイクロ波放射計20は、アンテナ21と、受信部22と、信号処理部23と、を有している。
アンテナ21は、観測領域ARにおける大気の放射波(マイクロ波)を受信するように構成されている。アンテナ21は、放射波を受信し、この放射波を受信部22の後述するLNA24へ出力する。
アンテナ21は、観測点P1における鉛直軸L1回りを回転しつつ、観測点P1の周囲360度に対して放射波を受信する。なお、以下の説明では、鉛直軸L1回りの一の角度位置における放射波を受信する動作を「スイープ」という。また、放射波の受信を行いながらアンテナ21を360°回転させる動作を、「スキャン」という。本実施形態では、気象レーダ装置10のアンテナ11によるアンテナ受信波の受信と、マイクロ波放射計20のアンテナ21による放射波の受信とは、同時に行われる。すなわち、気象レーダ装置10による降水観測と、マイクロ波放射計20による水蒸気観測とが同時に行われる。鉛直軸L1回りのアンテナ11,21の角度(受信角度)は、一致していることが好ましいけれども、一致していなくてもよい。
受信部22は、LNA(Low Noise Amp)24と、スペクトル分析部25と、を有している。
LNA24は、放射波を増幅し、増幅した放射波をスペクトル分析部25へ出力する。
スペクトル分析部25は、周波数fと信号強度aとの関係を示すスペクトルデータSDを生成する。スペクトルデータSDは、マイクロ波放射計20で検出された水蒸気量を特定する水蒸気スペクトルデータを含む。図5(A)~図5(C)は、鉛直軸L1回りの角度位置のうち、一の角度位置における水蒸気スペクトルsv、雲水スペクトルsl、および、酸素スペクトルsoの一例を示している。各スペクトルsv,sl,soは、横軸を周波数f、縦軸を信号強度aで示されるスペクトルである。スペクトルデータSDは、スペクトルsv,sl,soを特定するデータを含んでいる。なお、実際には、スペクトルデータSDは、各スペクトルsv,sl,soが合成されてなる合成スペクトルを示すデータであるが、説明の便宜上、図では3つのスペクトルsv,sl,soをそれぞれ独立して示している。
図4(A)および図5(A)~図5(C)を参照して、水蒸気スペクトルsvは、マイクロ波放射計20で観測された方向領域における水蒸気量の略総和に対応したスペクトルの強度を示しており、22GHz付近において信号強度が最大となるような右肩上がりの曲線となっている。水蒸気スペクトルsvは、雲水スペクトルslに沿って右肩上がりとなる曲線である。
雲水スペクトルslは、マイクロ波放射計20で観測された箇所における雲水量Lwc(Liquid Water Contents)を示しており、右肩上がりの曲線となっている。雲水量は、単位体積の空気中に含まれる微水滴の量であり、降水領域では相対的に多くなり、晴天領域等の非降水領域では相対的に少なくなる。
酸素スペクトルsoは、マイクロ波放射計20で観測された方向領域における酸素量の総和に対応したスペクトルの強度を示しており、60GHz付近において信号強度が最大となるような山形形状の曲線となっている。
図5(A)では、観測領域ARのうち降水領域AR1および多湿領域AR2,AR3の何れも含まない領域における各スペクトルsv,sl,so(スペクトルsv1,sl1,so1)の一例を示している。図5(B)では、観測領域ARのうち、多湿領域AR3を含む領域における各スペクトルsv,sl,so(スペクトルsv2,sl2,so2)の一例を示している。図5(C)では、観測領域ARのうち、降水領域AR1および多湿領域AR2を含む領域における各スペクトルsv,sl,so(スペクトルsv3,sl3,so3)の一例を示している。
水蒸気スペクトルsvのピーク周波数22GHzにおける雲水スペクトルsl上での信号強度が、マイクロ波放射計20で観測した箇所における雲水量Lwcに相当する。そして、雲水量Lwcと水蒸気スペクトルsvのピーク値PEAKとの差分が、水蒸気量Vcに相当する。水蒸気量Vcとは、空気中に気体として包含されている水蒸気の量をいう。
例えば、夏において所定の領域で急速に雨雲が発達して降雨が生じるとき、当該所定の領域を観測するマイクロ波放射計20によって得られる雲水量Lwcおよび水蒸気量Vcは、それぞれ、短時間で増加する。よって、雲水量Lwcおよび水蒸気量Vcの変化を検出することで、ゲリラ豪雨の発生を予測することができる。
また、酸素スペクトルsoにおいて、各周波数帯での放射の強さに基づいて、逆問題を解くことで、観測点P1からの距離方向における温度分布(気温分布、酸素の温度分布に対応)を算出することが可能である。
図1、図3、図4(A)および図5(A)~図5(C)を参照して、スペクトル分析部25は、スペクトルデータSDを、信号処理部23へ出力する。
信号処理部23は、スペクトルデータSDに所定の信号処理を施すことで、1スイープ毎の観測箇所におけるスペクトルsv,sl,soに基づいて、水蒸気量Vc、雲水量Lwc、および、温度分布を特定するデータとしての、放射計データERを生成する。スペクトルデータSDおよび放射計データERは、関連付け部30へ出力される。
関連付け部30は、気象レーダ装置10およびマイクロ波放射計20と、無線または有線でデータ通信可能に接続されている。関連付け部30は、観測点P1に設置されていてもよいし、観測点P1とは別の気象台等に設置されていてもよい。関連付け部30は、気象レーダ装置10で得られたエコーデータEDと、マイクロ波放射計20で得られたスペクトルデータSDとを互いに関連付ける。
関連付け部30は、エコーデータ取得部31と、スペクトルデータ取得部32と、領域特定部33と、エコーデータ抽出部34と、スペクトル補正部35と、エコー補正部36とを含む。スペクトルデータ取得部32は、水蒸気スペクトルデータ取得部を含む。
関連付け部30は、ハードウェア・プロセッサ29(例えば、CPU、FPGA等)および不揮発性メモリ等のデバイスで構成されている。例えば、CPUが不揮発性メモリからプログラムを読み出して実行することにより、関連付け部30を、エコーデータ取得部31、スペクトルデータ取得部32、領域特定部33、エコーデータ抽出部34、スペクトル補正部35およびエコー補正部36として機能させることができる。
降水領域AR1および多湿領域AR2,AR3の何れも含まない領域を観測して得られた雲水スペクトルsl1と、多湿領域AR3を観測して得られた雲水スペクトルs2とは、同じグラフで示される。一方、降水領域AR1および多湿領域AR2,AR3の何れも含まない領域を観測して得られた水蒸気スペクトルsv1のピーク値PEAKと比べて、多湿領域AR3を観測して得られた水蒸気スペクトルsv2のピーク値は、大きい。
降水領域AR1および多湿領域AR2を観測して得られた水蒸気スペクトルsv3および雲水スペクトルsl3は、多湿領域AR3を観測して得られた水蒸気スペクトルsv2および雲水スペクトルsl2と比べて、高い水蒸気量Vc3および雲水量Lwc3を示している。一方で、実際には、前述したように、多湿領域AR2における水蒸気量および雲水量と、多湿領域AR3における対応する水蒸気量および雲水量は、同じである。
すなわち、水蒸気スペクトルsv3および雲水スペクトルsl3で示される水蒸気量Vc3と雲水量Lwc3は、実際の水蒸気量および雲水量に対して誤差を生じている。このずれは、マイクロ波放射計20のアンテナ21に入射される放射波に、降水領域AR1における降水が原因の成分が混じっているからである。
上述の説明から明らかなように、マイクロ波放射計20の測定結果は、降水の影響を受け易く、雨天時に大気中の水蒸気量を正確に算出し難い。また、気象レーダ装置10は、降水のエコーは検出可能であるけれども、大気中の水蒸気を観測することが難しい。
そこで、関連付け部30は、上述した、水蒸気量と雲水量の誤差を補正するために、エコーデータEDを用いてスペクトルデータSDを補正する。より具体的には、関連付け部30は、エコーデータEDで特定される降水強度EDPを用いてスペクトルデータSDで特定される水蒸気量Vcを補正する。関連付け部30におけるスペクトルデータSDを補正する処理の一例は、後述する。
関連付け部30におけるエコー補正部36は、エコーデータEDで特定されるエコー画像Eにおいて、多湿領域AR2,AR3に相当する箇所に多湿領域であることを示すデータを追加する補正を行う。より具体的には、エコー補正部36は、水蒸気スペクトルsvを特定する水蒸気スペクトルデータとエコーデータEDとを組み合わせることで、水蒸気量Vcを特定するデータをエコーデータEDに追加する。エコー補正部36におけるエコーデータ補足処理の一例は、後述する。
次に、関連付け部30の各ユニットによる処理の流れの一例を説明する。
図6は、関連付け部30におけるスペクトルデータ補正処理の一例を示すフローチャートである。なお、以下では、フローチャートを参照しながら説明するときは、フローチャート以外の図も適宜参照しながら説明する。
関連付け部30は、まず、1スイープ分のエコーデータEDとスペクトルデータSDとを読込む。より詳細には、エコーデータ取得部31は、気象レーダ装置10で検出されたエコーデータEDを取得する。スペクトルデータ取得部32は、マイクロ波放射計20で検出された水蒸気量を特定する水蒸気スペクトルsvを含むスペクトルデータSDを取得する(ステップS11)。次に、領域特定部33は、エコーデータEDに基づいて、水蒸気スペクトルsvを含むスペクトルデータSDを取得する領域を特定する。当該領域は、マイクロ波放射計20を基準とした所定角度、すなわち1または複数スイープ分の所定角度の範囲の領域である。具体的には、領域特定部33は、エコーデータEDで特定される領域中に降水領域(例えば降水領域AR1)が存在しているか否かを判定する(ステップS12)。
降水領域が含まれていると判定された場合(ステップS12でYES)、エコーデータ抽出部34は、降水領域AR1に存在するエコーデータEDを抽出する(ステップS13)。そして、スペクトル補正部35は、エコーデータ抽出部34で抽出したエコーデータEDのエコー強度に基づいて、スペクトルデータSDを補正する(ステップS14)。より詳細には、スペクトル補正部35は、領域特定部33により特定された上記領域における降水強度の略総和に応じて、水蒸気スペクトルsvを含むスペクトルデータSDを補正する。たとえば、スペクトル補正部35は、当該領域における降水強度の略総和に応じた値を、水蒸気スペクトルsvを含むスペクトルデータSDのうち、少なくともピーク値から減算する。具体的には、図7に示すように、エコーデータEDで特定される、降水領域AR1の降水強度EDPから導かれる雲水量Lwc10に相当する値分、水蒸気スペクトルsvのピーク値PEAKおよび当該ピーク値PEAKにおける周波数での雲水スペクトルslの信号強度がそれぞれ低下するように、水蒸気スペクトルsvおよび雲水スペクトルslを補正する。これにより、補正後スペクトルsv',sl'を特定する補正後スペクトルデータSD'が生成される。図7は、水蒸気スペクトルsvの補正イメージを示す模式図である。
次に、スペクトル補正部35は、スペクトルデータSDまたは補正後スペクトルデータSD'で特定される水蒸気量Vcおよび雲水量Lwcとなるように、放射計データERで特定される水蒸気量Vcおよび雲水量Lwcを更新することで、補正後放射計データER'を生成する(ステップS15)。
一方、ステップS12で降水領域が含まれていないと判定された場合(ステップS12でNO)、スペクトル補正部35は、スペクトルデータSDの補正は行わない。
スペクトル補正部35は、上述の処理が行われた後のスペクトルデータSDまたは補正後スペクトルデータSD'を、エコー補正部36へ出力するとともに、放射計データERまたは補正後放射計データER'を表示部40へ出力する(ステップS16)。
領域特定部33は、上述のステップS11~S15の処理を、1スイープ分のデータ毎に繰返し行ってもよいし、1スキャン分のデータ毎に繰返し行ってもよい。本実施形態では、1スイープのデータについて、スペクトル補正部35における処理の後、エコー補正部36におけるエコーデータ処理が行われる。
図8は、エコー補正部36におけるエコーデータ補正処理の一例を示すフローチャートである。
エコー補正部36は、まず、1スイープ分のエコーデータEDと、スペクトルデータSDまたは補正後スペクトルデータSD'と、を読込む(ステップS21)。
次に、エコー補正部36は、スペクトルデータSDまたは補正後スペクトルデータSD'で特定される、観測点P1からの、距離方向(放射波受信方向)に沿った水蒸気量の分布を算出する(ステップS22)。水蒸気量の分布は、スペクトルデータSDまたは補正後スペクトルデータSD'で特定される水蒸気スペクトルsv,sv'に関して、例えば、逆問題を解くことで算出できる。
次に、エコー補正部36は、エコーデータEDを補正することで、補正後エコーデータED'を生成する(ステップS23)。より詳細には、エコー補正部36は、エコーデータEDに基づいて気象レーダ装置10の周囲の降水強度を示すエコー画像と、エコー画像のうち、領域特定部33により特定された上記領域を示す箇所に、スペクトル補正部35が補正した水蒸気スペクトルsvに基づく水蒸気発生エリア画像と、を生成する。具体的には、エコー補正部36は、図9に示すように、補正後エコーデータED'で特定されるエコー画像E'において、水蒸気量に応じた信号強度のエコー像E2,E3が表示されるように、エコーデータEDを補正する。これにより、補正後エコー画像E'において、エコー画像Eには表示されていなかったエコー像としての、多湿領域AR2,AR3を示すエコー像E2,E3が表示される。図9は、補正後エコー画像E'を示す模式的なエコー図である。
エコー補正部36は、補正後エコーデータED'を表示部40へ出力する(ステップS24)。
エコー補正部36は、上述のステップS21~S24の処理を、1スイープ分のデータ毎に繰返し行ってもよいし、1スキャン分のデータ毎に繰返し行ってもよい。
表示部40は、液晶ディスプレイ等の画像表示装置である。表示部40は、与えられた補正後エコーデータED'および放射計データERに基づいて画像表示を行う。この画像として、表示部40の画面の一部に、補正後エコーデータED'で示される補正後エコー画像E'を示すとともに、表示部40の一部に、放射計データERで特定される水蒸気量等を数値で示す画像を例示できる。
以上説明したように、本実施形態によると、エコーデータ取得部31は、気象レーダ装置10で検出されたエコーデータEDを取得する。水蒸気スペクトルデータ取得部は、マイクロ波放射計20で検出された水蒸気量を特定する水蒸気スペクトルsvを含むスペクトルデータSDを取得する。領域特定部33は、水蒸気スペクトルsvを含むスペクトルデータSDを取得する領域を特定する。エコーデータ抽出部34は、当該領域に存在するエコーデータEDを抽出する。スペクトル補正部35は、エコーデータ抽出部34で抽出したエコーデータEDのエコー強度に基づいて、水蒸気スペクトルsvを含むスペクトルデータSDを補正する。この構成によると、水蒸気スペクトルデータで特定される水蒸気量Vcが降水に起因して実際の水蒸気量よりも多くなるような誤差が生じても、この誤差を気象レーダ装置10のエコーデータEDで補正できる。よって、マイクロ波放射計20が大気中の水蒸気量を正確に測定することが困難な状況にあっても、マイクロ波放射計20を用いた大気中の水蒸気量をより正確に測定できる。
また、本実施形態によると、スペクトル補正部35は、エコーデータEDで特定される降水強度EDPを用いて、水蒸気スペクトルsvを補正する。この構成によると、降雨によって雲水量が増すことに起因して生じる、水蒸気スペクトルsv等で特定される水蒸気量及び雲水量の増加を、スペクトル補正部35によってより正確に補正できる。
また、本実施形態によると、エコー補正部36は、エコーデータEDに基づいて気象レーダ装置10の周囲の降水強度を示すエコー画像と、エコー画像のうち当該領域を示す箇所に、スペクトル補正部35が補正した水蒸気スペクトルsvに基づく水蒸気発生エリア画像と、を生成する。この構成によると、気象レーダ装置10で検出することが困難な水蒸気量(エコー像E2,E3)について、エコー画像E'で示すことができる。これにより、エコー画像E'を見たユーザー等が、観測領域ARの天候をより正確に把握することができる。
以上、本発明の実施形態について説明したけれども、本発明は上述の実施の形態に限られない。本発明は、特許請求の範囲に記載した限りにおいて様々な変更が可能である。
本発明は、気象観測装置、気象観測システム、および、気象観測方法として、広く適用することができる。
1 気象観測システム
10 気象レーダ装置
13 送信部
14 受信部
20 マイクロ波放射計
22 受信部
30 関連付け部(気象観測装置)
31 エコーデータ取得部
32 スペクトルデータ取得部
33 領域特定部
34 エコーデータ抽出部
35 スペクトル補正部
36 エコー補正部
a 信号強度
ED エコーデータ
EDP 降水強度
f 周波数
Lwc 雲水量
SD スペクトルデータ
Vc 水蒸気量
10 気象レーダ装置
13 送信部
14 受信部
20 マイクロ波放射計
22 受信部
30 関連付け部(気象観測装置)
31 エコーデータ取得部
32 スペクトルデータ取得部
33 領域特定部
34 エコーデータ抽出部
35 スペクトル補正部
36 エコー補正部
a 信号強度
ED エコーデータ
EDP 降水強度
f 周波数
Lwc 雲水量
SD スペクトルデータ
Vc 水蒸気量
Claims (8)
- 気象レーダ装置で検出されたエコーデータを取得するエコーデータ取得部と、
マイクロ波放射計で検出された水蒸気量を特定する水蒸気スペクトルデータを取得する
水蒸気スペクトルデータ取得部と、
前記水蒸気スペクトルデータを取得する領域を特定する領域特定部と、
前記領域に存在するエコーデータを抽出するエコーデータ抽出部と、
前記エコーデータ抽出部で抽出した前記エコーデータのエコー強度に基づいて、前記水蒸気スペクトルデータを補正するスペクトル補正部と、
を備えることを特徴とする気象観測装置。 - 請求項1に記載の気象観測装置であって、
前記スペクトル補正部は、前記エコーデータで特定される降水強度を用いて前記水蒸気スペクトルデータを補正することを特徴とする、気象観測装置。 - 請求項2に記載の気象観測装置であって、
前記スペクトル補正部は、前記領域における降水強度の略総和に応じて、前記水蒸気スペクトルデータを補正することを特徴とする気象観測装置。 - 請求項3に記載の気象観測装置であって、
前記スペクトル補正部は、当該領域における降水強度の略総和に応じた値を、前記水蒸気スペクトルデータのうち、少なくともピーク値から減算することを特徴とする気象観測装置。 - 請求項1乃至4の何れか一項に記載の気象観測装置であって、
前記領域は、前記マイクロ波放射計を基準とした所定角度の範囲の領域であることを特徴とする気象観測装置。 - 請求項2乃至5の何れかに記載の気象観測装置であって、
前記エコーデータに基づいて前記気象レーダ装置の周囲の降水強度を示すエコー画像と、前記エコー画像のうち前記領域を示す箇所に、前記スペクトル補正部が補正した前記水蒸気スペクトルデータに基づく水蒸気発生エリア画像と、を生成することを特徴とする気象観測装置。 - 電磁波を送受信することで自装置の周囲の少なくとも降水強度を含む気象状況を観測する気象レーダ装置と、
大気中に含まれる水蒸気から放射される水蒸気のスペクトルデータを受信することで水蒸気量を検出するマイクロ波放射計と、
請求項1乃至請求項6の何れか1項に記載の気象観測装置と、
を備えていることを特徴とする、気象観測システム。 - 気象レーダ装置で検出されたエコーデータを取得し、
マイクロ波放射計で検出された水蒸気量を特定する水蒸気スペクトルデータを取得し、
前記水蒸気スペクトルデータを取得する領域を特定し、
前記領域に存在するエコーデータを抽出し、
抽出した前記エコーデータのエコー強度に基づいて、前記水蒸気スペクトルデータを補正する
ことを特徴とする気象観測方法。
Priority Applications (1)
| Application Number | Priority Date | Filing Date | Title |
|---|---|---|---|
| JP2023522251A JP7828340B2 (ja) | 2021-05-18 | 2022-03-04 | 気象観測装置、気象観測システム、および、気象観測方法 |
Applications Claiming Priority (2)
| Application Number | Priority Date | Filing Date | Title |
|---|---|---|---|
| JP2021-084140 | 2021-05-18 | ||
| JP2021084140 | 2021-05-18 |
Publications (1)
| Publication Number | Publication Date |
|---|---|
| WO2022244388A1 true WO2022244388A1 (ja) | 2022-11-24 |
Family
ID=84140540
Family Applications (1)
| Application Number | Title | Priority Date | Filing Date |
|---|---|---|---|
| PCT/JP2022/009544 Ceased WO2022244388A1 (ja) | 2021-05-18 | 2022-03-04 | 気象観測装置、気象観測システム、および、気象観測方法 |
Country Status (2)
| Country | Link |
|---|---|
| JP (1) | JP7828340B2 (ja) |
| WO (1) | WO2022244388A1 (ja) |
Cited By (1)
| Publication number | Priority date | Publication date | Assignee | Title |
|---|---|---|---|---|
| WO2025150420A1 (ja) * | 2024-01-12 | 2025-07-17 | 国立研究開発法人宇宙航空研究開発機構 | 情報処理システム、情報処理装置、情報処理方法、及びプログラム |
Citations (5)
| Publication number | Priority date | Publication date | Assignee | Title |
|---|---|---|---|---|
| WO2016181694A1 (ja) * | 2015-05-14 | 2016-11-17 | 古野電気株式会社 | 遮蔽域検出装置、レーダ装置、気象レーダ装置、及び遮蔽域検出方法 |
| WO2020075430A1 (ja) * | 2018-10-09 | 2020-04-16 | 古野電気株式会社 | 映像生成装置及び映像生成方法 |
| JP6739126B1 (ja) * | 2020-01-20 | 2020-08-12 | 国立研究開発法人宇宙航空研究開発機構 | 計測データ処理装置 |
| WO2020166232A1 (ja) * | 2019-02-12 | 2020-08-20 | 古野電気株式会社 | 水蒸気観測計及び水蒸気観測方法 |
| CN111965666A (zh) * | 2020-07-16 | 2020-11-20 | 中国矿业大学 | 一种气溶胶三维空间分布制图方法 |
-
2022
- 2022-03-04 JP JP2023522251A patent/JP7828340B2/ja active Active
- 2022-03-04 WO PCT/JP2022/009544 patent/WO2022244388A1/ja not_active Ceased
Patent Citations (5)
| Publication number | Priority date | Publication date | Assignee | Title |
|---|---|---|---|---|
| WO2016181694A1 (ja) * | 2015-05-14 | 2016-11-17 | 古野電気株式会社 | 遮蔽域検出装置、レーダ装置、気象レーダ装置、及び遮蔽域検出方法 |
| WO2020075430A1 (ja) * | 2018-10-09 | 2020-04-16 | 古野電気株式会社 | 映像生成装置及び映像生成方法 |
| WO2020166232A1 (ja) * | 2019-02-12 | 2020-08-20 | 古野電気株式会社 | 水蒸気観測計及び水蒸気観測方法 |
| JP6739126B1 (ja) * | 2020-01-20 | 2020-08-12 | 国立研究開発法人宇宙航空研究開発機構 | 計測データ処理装置 |
| CN111965666A (zh) * | 2020-07-16 | 2020-11-20 | 中国矿业大学 | 一种气溶胶三维空间分布制图方法 |
Non-Patent Citations (1)
| Title |
|---|
| TANIGUCHI, YUJI; YAMANASHI, MASATO: "The development on the technique to process the data of microwave radiometer", MSS TECHNICAL REVIEW, JP, vol. 28, no. 5, 30 March 2018 (2018-03-30), JP, pages 1 - 10, XP009541341 * |
Cited By (1)
| Publication number | Priority date | Publication date | Assignee | Title |
|---|---|---|---|---|
| WO2025150420A1 (ja) * | 2024-01-12 | 2025-07-17 | 国立研究開発法人宇宙航空研究開発機構 | 情報処理システム、情報処理装置、情報処理方法、及びプログラム |
Also Published As
| Publication number | Publication date |
|---|---|
| JPWO2022244388A1 (ja) | 2022-11-24 |
| JP7828340B2 (ja) | 2026-03-11 |
Similar Documents
| Publication | Publication Date | Title |
|---|---|---|
| US7592948B2 (en) | System and method for dual polarization radar with automatic built-in test equipment and calibration | |
| US9097805B2 (en) | Systems and methods for calibrating dual polarization radar systems | |
| US9261583B2 (en) | Systems and methods for calibrating dual polarization radar systems | |
| JP6099318B2 (ja) | 水蒸気観測装置および気象レーダ | |
| US9329266B2 (en) | Weather radar apparatus, observation sequence generation method, and observation sequence generation program | |
| Crisologo et al. | Polarimetric rainfall retrieval from a C-Band weather radar in a tropical environment (The Philippines) | |
| JP7828340B2 (ja) | 気象観測装置、気象観測システム、および、気象観測方法 | |
| CN109884605B (zh) | 云雨对雷达信号的吸收衰减和米氏散射衰减的提取方法 | |
| CA2711460A1 (en) | An improved system and method for dual polarization radar with automatic built-in test equipment and calibration | |
| JP2014102235A (ja) | レーダ信号処理装置 | |
| Yoshikawa et al. | Dual-directional radar observation for preliminary assessment of the Ku-band broadband radar network | |
| JP6445145B2 (ja) | 降水強度算出装置、気象レーダ装置、降水強度算出方法、及び降水強度算出プログラム | |
| JPH09138279A (ja) | レーダ雨量測定装置 | |
| KR100942689B1 (ko) | 편파파라메터 차등위상을 이용한 편파레이더 강수감쇠 보정방법 | |
| Yanovsky et al. | Peculiarities and Experience of W-Band Cloud Radar Calibration | |
| Williams et al. | Calibrating radar wind profiler reflectivity factor using surface disdrometer observations | |
| Curtis et al. | Diagnosis of tilted weather radars using solar interference | |
| JPH09138272A (ja) | レーダ雨量測定装置 | |
| Friedrich et al. | On the use of advanced Doppler radar techniques to determine horizontal wind fields for operational weather surveillance | |
| CN110441745B (zh) | 一种基于宽带雷达俯视测量目标rcs的方法和系统 | |
| Bharadwaj et al. | Calibration system for ARM radars | |
| Iocca et al. | Open-Source Data Processing Chain for Marche Region X-band Weather Radar | |
| WO2025004425A1 (ja) | 気象レーダ装置 | |
| JPH09257928A (ja) | 気象レーダ装置 | |
| Setyoko et al. | The need for national standard of x-band radar technology to detect rainfall and disaster mitigation |
Legal Events
| Date | Code | Title | Description |
|---|---|---|---|
| 121 | Ep: the epo has been informed by wipo that ep was designated in this application |
Ref document number: 22804309 Country of ref document: EP Kind code of ref document: A1 |
|
| WWE | Wipo information: entry into national phase |
Ref document number: 2023522251 Country of ref document: JP |
|
| NENP | Non-entry into the national phase |
Ref country code: DE |
|
| 122 | Ep: pct application non-entry in european phase |
Ref document number: 22804309 Country of ref document: EP Kind code of ref document: A1 |