WO2022208734A1 - 情報提示プログラム、情報提示方法および情報提示装置 - Google Patents
情報提示プログラム、情報提示方法および情報提示装置 Download PDFInfo
- Publication number
- WO2022208734A1 WO2022208734A1 PCT/JP2021/013860 JP2021013860W WO2022208734A1 WO 2022208734 A1 WO2022208734 A1 WO 2022208734A1 JP 2021013860 W JP2021013860 W JP 2021013860W WO 2022208734 A1 WO2022208734 A1 WO 2022208734A1
- Authority
- WO
- WIPO (PCT)
- Prior art keywords
- hypothesis
- hypotheses
- learning
- learning model
- information presentation
- Prior art date
- Legal status (The legal status is an assumption and is not a legal conclusion. Google has not performed a legal analysis and makes no representation as to the accuracy of the status listed.)
- Ceased
Links
Images







Classifications
-
- G—PHYSICS
- G06—COMPUTING OR CALCULATING; COUNTING
- G06N—COMPUTING ARRANGEMENTS BASED ON SPECIFIC COMPUTATIONAL MODELS
- G06N20/00—Machine learning
-
- G—PHYSICS
- G06—COMPUTING OR CALCULATING; COUNTING
- G06N—COMPUTING ARRANGEMENTS BASED ON SPECIFIC COMPUTATIONAL MODELS
- G06N5/00—Computing arrangements using knowledge-based models
- G06N5/04—Inference or reasoning models
- G06N5/045—Explanation of inference; Explainable artificial intelligence [XAI]; Interpretable artificial intelligence
-
- G—PHYSICS
- G06—COMPUTING OR CALCULATING; COUNTING
- G06N—COMPUTING ARRANGEMENTS BASED ON SPECIFIC COMPUTATIONAL MODELS
- G06N3/00—Computing arrangements based on biological models
- G06N3/02—Neural networks
-
- G—PHYSICS
- G06—COMPUTING OR CALCULATING; COUNTING
- G06N—COMPUTING ARRANGEMENTS BASED ON SPECIFIC COMPUTATIONAL MODELS
- G06N3/00—Computing arrangements based on biological models
- G06N3/02—Neural networks
- G06N3/08—Learning methods
Definitions
- the present invention relates to an information presentation program and the like.
- FIG. 20 is a diagram for explaining the conventional technology.
- conventional technology when performing machine learning (wide learning) based on data, multiple learning models are generated and presented to the user by adjusting parameters, random number seeds, and preprocessing. Based on the hypotheses set of the presented multiple learning models, the user grasps the commonalities and differences of the learning models as a whole, and selects a learning model for discovering useful knowledge.
- FIG. 21 is a diagram showing an example of a learning model hypothesis set.
- the hypothesis set of the learning model is information for explaining the output result of the learning model, and has hypotheses and weights, for example.
- a hypothesis is represented by a set of attributes.
- the weight indicates how much the corresponding hypothesis influences the output result of the learning model. If the weight is a positive value, the larger the weight, the more influential the hypothesis is when the corresponding hypothesis is determined to be "True.” If the weight is a negative value, the lower the weight, the more influential the hypothesis is when the corresponding hypothesis is determined to be "FALSE".
- the hypothesis set 1-1 is the hypothesis set of one learning model (first learning model) to be compared
- the hypothesis set 1-2 is the hypothesis set of the other learning model (second learning model). do.
- each hypothesis of the hypothesis set 1-1 and some of the hypotheses of the hypothesis set 8-2 such as the hypothesis "attribute D1-2 ⁇ attribute F1-1 ⁇ attribute F1-2"
- the hypotheses are common, most of the hypotheses are not common.
- FIG. 22 is a diagram showing the relationship between the hypothesis and weight of each hypothesis set.
- the vertical axis in FIG. 22 indicates the weight of the hypothesis of the first learning model.
- the horizontal axis indicates the weight of the hypothesis of the second learning model.
- the point P1 among the plotted points corresponds to the hypothesis "attribute A1-1 ⁇ attribute B1-1 ⁇ attribute C1-1" of the hypothesis set 8-1.
- Point P2 corresponds to hypothesis "attribute G1-1" of hypothesis set 8-2.
- a point P3 corresponds to a hypothesis "attribute D1-2 ⁇ attribute F1-1 ⁇ attribute F1-2" common to hypothesis sets 8-1 and 8-2. Description of other points will be omitted.
- the top K learning models are listed in descending order of the objective function.
- FIG. 23 is a diagram for explaining the problems of the conventional technology.
- learning models 6-1, 6-2, 6-3, 6-5, and 6-7 be the top K learning models among the plurality of learning models 6-1 to 6-13.
- learning models 6-1, 6-2, 6-3, 6-5, 6-7 are enumerated, and other learning models 6-4, 6-6, 6-8 to 6-13 is not listed, and knowledge of region 7a cannot be obtained.
- an object of the present invention is to provide an information presentation program, an information presentation method, and an information presentation device that can easily compare complicated learning models.
- the computer executes the following processing.
- a computer generates a plurality of learning models by executing machine learning using learning data.
- Hierarchical information representing, in a hierarchical structure, the relationship between common hypotheses and differential hypotheses for a plurality of hypotheses extracted from each of a plurality of learning models, each of which is defined by a combination of one or more explanatory variables. to generate
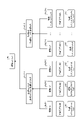
- FIG. 1 is a diagram for explaining the processing of the information presentation device according to the embodiment.
- FIG. 2 is a diagram (1) for explaining similarity determination processing executed by the information presentation apparatus according to the present embodiment.
- FIG. 3 is a diagram (2) for explaining similarity determination processing executed by the information presentation apparatus according to the present embodiment.
- FIG. 4 is a diagram (3) for explaining similarity determination processing executed by the information presentation apparatus according to the present embodiment.
- FIG. 5 is a diagram (4) for explaining similarity determination processing executed by the information presentation apparatus according to the present embodiment.
- FIG. 6 is a functional block diagram showing the configuration of the information presentation device according to this embodiment.
- FIG. 7 is a diagram showing an example of the data structure of learning data.
- FIG. 8 is a diagram illustrating an example of the data structure of a hypothetical database; FIG.
- FIG. 9 is a diagram showing an example of the data structure of a common hypothesis set table.
- FIG. 10 is a flow chart showing a processing procedure for identifying common hypothesis sets.
- FIG. 11 is a diagram for explaining the process of excluding contradictory hypotheses between hypothesis sets.
- FIG. 12 is a diagram for explaining the process of generating hypotheses that are common among hypothesis sets.
- FIG. 13 is a diagram showing the relationship of learning models to common hypothesis sets.
- FIG. 14 is a diagram for explaining the process of updating the conclusion part considering the weight of the hypothesis.
- FIG. 15 is a flow chart showing the processing procedure of the information presentation device according to the present embodiment.
- FIG. 16 is a flowchart (1) showing a processing procedure of similarity calculation processing.
- FIG. 17 is a diagram showing an example of a scatter diagram of cumulative values of weights between learning models.
- FIG. 18 is a flowchart (2) showing the procedure of similarity calculation processing.
- FIG. 19 is a diagram showing an example of the hardware configuration of a computer that implements the same functions as the information presentation device of the embodiment.
- FIG. 20 is a diagram for explaining the conventional technology.
- FIG. 21 is a diagram illustrating an example of a learning model hypothesis set.
- FIG. 22 is a diagram showing the relationship between the hypothesis and the weight of each hypothesis set.
- FIG. 23 is a diagram for explaining the problem of the conventional technology.
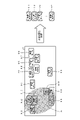
- FIG. 1 is a diagram for explaining the processing of the information presentation device according to the embodiment.
- the information presentation device generates a plurality of learning models M1, M2, M3, M4, . . . Mn by executing machine learning using learning data.
- a plurality of learning models M1 to Mn are collectively referred to as "learning model M" as appropriate.
- the information presentation device acquires a hypothesis set from the learning model M.
- the hypothesis set of the learning model M becomes information explaining the output result of the learning model M.
- FIG. In the example shown in FIG. 1, hypothesis set H1 of learning model M1 includes hypotheses hy1, hy2, hy3, hy4, and hy5.
- Hypothesis set H2 of learning model M2 includes hypotheses hy1, hy2, hy3, hy4, and hy6.
- Hypothesis set H3 of learning model M3 includes hypotheses hy1, hy2, hy3, hy4, and hy7.
- Hypothesis set H4 of learning model M4 includes hypotheses hy1, hy2, hy8, and hy9.
- Hypothesis set Hn of learning model Mn includes hypotheses hy1, hy2, hy8, hy10, and hy12. Description of hypothesis sets of other learning models M is omitted.
- the information presentation device executes similarity determination based on the hypothesis set of the learning model M, and classifies the learning model M into similar learning models M.
- the information presentation device classifies the learning models M1, M2, and M3 into the first group.
- the information presentation device classifies the learning models M4, Mn, etc. into the second group. Descriptions of other learning models and other groups are omitted.
- the information presentation device compares the hypothesis sets H1 to H3 of the learning models M1 to M3 belonging to the first group, and identifies common hypotheses hy1, hy2, hy3, and hy4.
- the information presentation device compares hypothesis sets H4, Hn, etc. of learning models M4, Mn, etc. belonging to the second group, and identifies common hypotheses hy1, hy2, hy8.
- the information presentation device compares "hypotheses 1, hy2, hy3, hy4" common to the first group with "hypotheses hy1, hy2, hy8" common to the second group, and Identify the “hypotheses hy1, hy2” to be used.
- the information presentation device connected the common hypothesis sets Hc1, Hc2-1, Hc2-2 and the unique hypothesis sets Hc3-1, Hc3-2, Hc3-3, Hc3-n based on the above execution results. Generate hierarchical information.
- the common hypothesis set Hc1 includes "hypotheses hy1, hy2" common to all learning models M.
- the common hypothesis set Hc2-1 is a hypothesis set common to the learning models M1 to M3 belonging to the first group, and includes "hypotheses hy3, hy4" excluding the hypothesis of the common hypothesis set Hc1.
- the common hypothesis set Hc2-2 is a hypothesis set common to the learning models M4, Mn, etc. belonging to the second group, and includes the hypothesis hy8 excluding the hypothesis of the common hypothesis set Hc1.
- the unique hypothesis set Hc3-1 includes "hypothesis hy5" unique to the learning model M1, which excludes the common hypothesis sets Hc1 and Hc2-1 from the hypothesis set H1 included in the learning model M1.
- the unique hypothesis set Hc3-2 includes a “hypothesis hy6” unique to the learning model M2, which excludes the hypotheses of the common hypothesis sets Hc1 and Hc2-1 from the hypothesis set H2 included in the learning model M2.
- the specific hypothesis set Hc3-3 includes “hypothesis hy7” specific to the learning model M3, which excludes the hypotheses of the common hypothesis sets Hc1 and Hc2-1 from the hypothesis set H3 included in the learning model M3.
- the unique hypothesis set Hc3-4 includes "hypothesis hy9" unique to the learning model M4, which excludes the hypotheses of the common hypothesis sets Hc1 and Hc2-2 from the hypothesis set H4 included in the learning model M4.
- the specific hypothesis set Hc3-n includes “hypotheses hy10, hy11, hy12” specific to the learning model Mn, excluding the hypotheses of the common hypothesis sets Hc1, Hc2-2, among the hypothesis sets Hn included in the learning model Mn.
- the information presentation device provides common hypotheses and differential hypotheses for a plurality of hypotheses defined by combinations of one or more attributes (explanatory variables) extracted from each learning model M. Generates hierarchical information that expresses the relationship between and in a hierarchical structure. A user can easily compare complicated learning models by referring to the hierarchical information.
- FIG. 2 is a diagram (1) for explaining similarity determination processing executed by the information presentation apparatus according to the present embodiment.
- the information presentation device can calculate the degree of similarity even between learning models that are difficult to compare by adjusting the granularity of hypotheses and calculating the cumulative value of the weights.
- Hypothesis set H1-1 includes hypotheses hy1-1, hy1-2, and hy1-3.
- Hypothesis set H2-1 includes hypotheses hy2-1, hy2-1, and hy3-1.
- Hypothesis hy1-1 is a hypothesis consisting of a combination of the attributes “win once”, “politician among relatives”, “claim_ABC bill”, and “ranking rate_less than 0.8”, and has a weight of "-0.95". ”.
- Hypothesis hy1-2 is a hypothesis consisting of a combination of the attributes “ ⁇ newcomer (rejection of newcomer)”, “politician among relatives”, “assertion_ABC bill”, and “ranking rate_less than 0.8”, and the weight is “ ⁇ 0.96”.
- Hypotheses hy1-3 are hypotheses consisting of a combination of the attributes “current job,” “relatives of politicians,” “assertion_ABC bill,” and “ranking rate_less than 0.8,” with a weight of “-0.85.” Become. Attributes are an example of explanatory variables.
- hypothesis hy1-3 Comparing each attribute of hypothesis hy1-3 with each attribute of hypothesis hy1-1, the attribute "current job" of hypothesis hy1-3 includes the attribute "won once" of hypothesis hy1-1. Since other attributes match hypotheses hy1-1 and hy1-3, hypothesis hy1-3 is a hypothesis that includes hypothesis hy1-1.
- hypothesis hy1-3 When each attribute of hypothesis hy1-3 is compared with each attribute of hypothesis hy1-2, the attribute "current job" of hypothesis hy1-3 includes the attribute " ⁇ newcomer” of hypothesis hy1-2. Other attributes match hypotheses hy1-2 and hy1-3, so hypothesis hy1-3 is a hypothesis that includes hypothesis hy1-2.
- Hypothesis hy2-1 is a hypothesis consisting of the attribute " ⁇ newcomer” and has a weight of "0.69”.
- Hypothesis hy2-2 is a hypothesis consisting of the attribute "assertion_ABC bill” and has a weight of "0.81”.
- Hypothesis hy2-3 is a hypothesis consisting of the attribute "winning once” and the weight is "0.82”.
- Hypotheses hy2-4 are hypotheses that have the attribute "ranking rate_less than 0.8" and have a weight of "-0.94".
- the hypothesis set H1-1 and hypothesis set H2-1 shown in FIG. 2 do not have the same granularity of hypotheses and cannot be compared.
- the information presentation device executes a process of matching the granularity of hypotheses between the hypothesis set H1-1 and the hypothesis set H2-1.
- FIG. 3 is a diagram (2) for explaining similarity determination processing executed by the information presentation device according to the present embodiment.
- the information presentation device adds hypotheses hy2-1′, hy2-2′, hy2-3′, hy2 corresponding to hypotheses hy2-1 to hy2-4 of the hypothesis set H2-1 to the hypothesis set H1-1.
- Add -4' Since hypotheses corresponding to hypotheses hy2-1′, hy2-2′, hy2-3′, and hy2-4′ do not exist in the hypothesis set H1-1, the information presentation device displays hypotheses hy2-1′, hy2-2 ', hy2-3', and hy2-4' are set to 0 (initial value).
- hypotheses hy2-1', hy2-2', hy2-3', and hy2-4' are included in hypothesis hy1-1. Also, hypotheses hy2-1', hy2-2', hy2-3', and hy2-4' are included in hypothesis hy1-1. It is also assumed that the hypothesis hy1-1 and the hypothesis hy1-2 have an inclusive relation to each other.
- the information presentation device adds the weight of hypotheses hy2-1', hy2-2', hy2-3', and hy2-4' (the weight is 0) to the weight of hypothesis hy1-1 at the inclusion destination.
- the information presentation device adds the weight of the hypothesis hy1-2 to the weight of the hypothesis hy1-1 to obtain the hypothesis hy1- Update the weight of 1 to "-1.93".
- the information presentation device adds the weight of hypotheses hy2-1', hy2-2', hy2-3', and hy2-4' (the weight is 0) to the weight of hypothesis hy1-2 in the inclusion destination.
- the information presentation device adds the weight of the hypothesis hy1-1 to the weight of the hypothesis hy1-2 to obtain the hypothesis hy1- Update the weight of 2 to "-1.93".
- the information presentation device sets the weight of the hypothesis hy1-1 or the weight of the hypothesis hy1-2 to the weight of the hypothesis hy1-3, which is the inclusion destination. By adding to the weight, the weight of hypothesis hy1-3 is updated to "-2.78".
- the information presentation device executes the process of FIG. 3 to calculate the vector V1-1 of the hypothesis set H1-1.
- FIG. 4 is a diagram (3) for explaining similarity determination processing executed by the information presentation device according to the present embodiment.
- the information presentation device adds hypotheses hy1-1′, hy1-2′, and hy1-3′ corresponding to hypotheses hy1-1 to hy1-3 of hypothesis set 1-1 to hypothesis set H2-1. do. Since the hypotheses corresponding to the hypotheses hy1-1′, hy1-2′, hy1-3′ do not exist in the hypothesis set H2-1, the information presentation device displays hypotheses hy1-1′, hy1-2′, hy1-3 ' is set to 0 (initial value).
- hypotheses hy2-1, hy2-2, hy2-3, and hy2-4 are included in hypothesis hy1-1. Also, hypotheses hy2-1, hy2-2, hy2-3, and hy2-4 are included in hypothesis hy1-1. Also, the hypothesis hy1-1 and the hypothesis hy1-2 have an inclusive relationship.
- the information presentation device adds the weight (initial value 0) of hypothesis hy1-2' to hypothesis hy1-1' because hypothesis hy1-1' and hypothesis hy1-2' are mutually inclusive. Further, the information presentation device adds the weights (initial values) of the hypotheses hy2-1, hy2-2, hy2-3, and hy2-4 to the weights of the hypotheses hy1-1' in which the hypotheses hy1- Update the weight of 1' to "1.39".
- the information presentation device adds the weight of hypothesis hy1-1' (initial value 0) to hypothesis hy1-2' because hypothesis hy1-1' and hypothesis hy1-2' are mutually inclusive. Further, the information presentation device adds the weights (initial values) of the hypotheses hy2-1, hy2-2, hy2-3, and hy2-4 to the weights of the hypotheses hy1-2' in which the hypotheses hy1- Update the weight of 2' to "1.39".
- the information presentation device sets the weight of the hypothesis hy1-1' or the weight of the hypothesis hy1-2' By adding to the weight of hy1-3′, the weight of hypothesis hy1-3′ is updated to “1.39”.
- the information presentation device executes the process of FIG. 4 to calculate the vector V2-1 of the hypothesis set H2-1.
- FIG. 5 is a diagram (4) for explaining similarity determination processing executed by the information presentation device according to the present embodiment.
- the information presentation device compares the vector V1-1 of the hypothesis set H1-1 with the vector V2-1 of the hypothesis set H2-1 to determine the degree of similarity between the hypothesis set H1-1 and the hypothesis set H1-2. calculate.
- the information presentation device aligns the granularity of the hypotheses, calculates the cumulative value of the weight, and uses it as the value of each dimension of the vector to calculate the degree of similarity. It becomes possible.
- the information presentation device calculates the degree of similarity of the learning model M by executing processing for calculating the degree of similarity for all combinations of the learning models M.
- FIG. The information presentation device classifies the learning models whose similarity is equal to or higher than the threshold into the same group, and executes the processing described with reference to FIG. 1 .
- FIG. 6 is a functional block diagram showing the configuration of the information presentation device according to this embodiment.
- this information presentation device 100 has a communication section 110 , an input section 120 , a display section 130 , a storage section 140 and a control section 150 .
- the communication unit 110 is connected to an external device or the like by wire or wirelessly, and transmits and receives information to and from the external device or the like.
- the communication unit 110 is implemented by a NIC (Network Interface Card) or the like.
- the communication unit 110 may be connected to a network (not shown).
- the input unit 120 is an input device that inputs various types of information to the information presentation device 100 .
- the input unit 120 corresponds to a keyboard, mouse, touch panel, or the like.
- the display unit 130 is a display device that displays information output from the control unit 150 .
- the display unit 130 corresponds to a liquid crystal display, an organic EL (Electro Luminescence) display, a touch panel, or the like.
- the storage unit 140 has learning data 141 , a learning model table 142 , a hypothesis database 143 , a common hypothesis set table 144 and hierarchy information 145 .
- the storage unit 140 corresponds to semiconductor memory devices such as RAM (Random Access Memory), ROM (Read Only Memory), flash memory, and storage devices such as HDD (Hard Disk Drive).
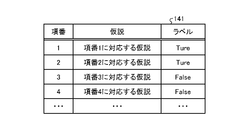
- the learning data 141 is data in which hypotheses are associated with labels corresponding to the hypotheses.
- FIG. 7 is a diagram showing an example of the data structure of learning data. As shown in FIG. 7, this learning data 141 associates item numbers, hypotheses, and labels.
- the item number is a number that identifies each hypothesis.
- a hypothesis indicates a combination of multiple attributes, and for example, each attribute is associated with an AND condition or the like. Attributes correspond to explanatory variables.
- a label is a correct label corresponding to a hypothesis, and "True" or "False” is set.
- the learning model table 142 is a table that holds a plurality of learning models M.
- a learning model is generated by the learning unit 151 .
- a description of the data structure of the learning model table 142 is omitted.
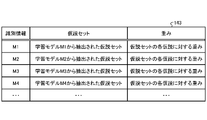
- the hypothesis database 143 is a table that holds hypothesis sets extracted from the learning model M.
- FIG. 8 is a diagram illustrating an example of the data structure of a hypothetical database; As shown in FIG. 8, this hypothesis database 143 associates identification information, hypothesis sets, and weights.
- the identification information is information for identifying the learning model M.
- FIG. A hypothesis set is information for explaining a learning model and is extracted from the learning model.
- a hypothesis set contains multiple hypotheses.
- a hypothesis is expressed by one or more attributes (explanatory variables).
- Weight is the weight set for each hypothesis.
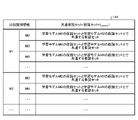
- the common hypothesis set table 144 is a table that holds common hypothesis sets among the hypothesis sets of each learning model.
- FIG. 9 is a diagram showing an example of the data structure of a common hypothesis set table. As shown in FIG. 9, the common hypothesis set table 144 has comparison identification information and common hypothesis sets.
- the comparison identification information is information for identifying a set of learning models M to be compared.
- a common hypothesis set indicates a common hypothesis set (one or more hypotheses) in the hypothesis sets of the learning models M compared.
- the hierarchical information 145 indicates information obtained by hierarchically connecting a common hypothesis set indicating a common hypothesis and a unique hypothesis set indicating a difference hypothesis in the hypothesis set of the learning model M.
- FIG. the hierarchical information 145 corresponds to the common hypothesis sets Hc1, Hc2-1, Hc2-2 and unique hypothesis sets Hc3-1 to Hc3-n described in FIG.
- the common hypothesis set will be referred to as hypothesis set H common as appropriate.
- the control unit 150 has a learning unit 151 , a classification unit 152 and a generation unit 153 .
- the control unit 150 can be realized by a CPU (Central Processing Unit), an MPU (Micro Processing Unit), or the like.
- the control unit 150 can also be realized by hardwired logic such as ASIC (Application Specific Integrated Circuit) and FPGA (Field Programmable Gate Array).
- the learning unit 151 generates a learning model M by executing machine learning based on the learning data 141.
- the learning unit 151 When executing machine learning, the learning unit 151 generates a plurality of learning models M by changing the parameters of the learning models M, random number seeds, preprocessing, and the like.
- the learning unit 151 registers the generated multiple learning models M in the learning model table 142 .
- the learning unit 151 may perform machine learning based on the technology described in Patent Document (Japanese Unexamined Patent Application Publication No. 2020-46888) or the like, or may perform machine learning using other conventional technology.
- a learning model M generated by machine learning includes a set of hypotheses for explaining the output results of the learning model M, and each hypothesis is assigned a weight.
- the learning unit 151 may further use a plurality of learning data (not shown) to generate different learning models M.
- the classification unit 152 classifies a plurality of learning models M into a plurality of groups according to similarity. It is assumed that learning models belonging to the same group are similar to each other.
- the classification unit 152 outputs the classification result of the learning model M to the generation unit 153 .
- An example of the processing of the classification unit 152 will be described below.
- the classification unit 152 executes a process of generating a hypothesis database, a process of identifying the similarity of learning models, and a process of classifying learning models.
- the process of generating the hypothesis database 143 by the classification unit 152 will be described.
- the classification unit 152 extracts the hypothesis set of the learning model M and the weights included in this hypothesis set from the learning model M registered in the learning model table 142 and registers them in the hypothesis database 143 .
- the classification unit 152 associates the hypothesis set and the weight with the identification information of the learning model M when registering the hypothesis set and the weight in the hypothesis database 143 .
- the classification unit 152 repeatedly executes the above process for each learning model M.
- the process of identifying the similarity of the learning model by the classification unit 152 will be described.
- the process of specifying the degree of similarity by the classification unit 152 corresponds to the process described with reference to FIGS. 2 to 5 above.
- the classification unit 152 selects a learning model for similarity comparison. For example, a case will be described in which the classification unit 152 selects the learning model M1 with the identification information "M1" and the learning model M2 with the identification information "M2".
- the classification unit 152 compares the hypothesis set of the learning model M1 with the hypothesis set of the learning model M1.
- the hypothesis set of the learning model M1 will be referred to as a first hypothesis set
- the hypothesis set of the learning model M2 will be referred to as a second hypothesis set.
- the classification unit 152 adds hypotheses that exist in the second hypothesis set but do not exist in the first hypothesis set to the first hypothesis set.
- the classification unit 152 adds hypotheses that exist in the first hypothesis set but do not exist in the second hypothesis set to the second hypothesis set. By executing such processing, the classification unit 152 aligns the granularity of the hypotheses of the first hypothesis set and the granularity of the hypotheses of the second hypothesis set.
- the classification unit 152 determines the inclusion relationship of the hypotheses after aligning the granularity of the hypotheses for the first hypothesis set and the second hypothesis set.
- the classification unit 152 may determine the inclusion relationship in any manner. For example, the classification unit 152 determines the inclusion relationship for each hypothesis based on a table that defines the inclusion relationship for each attribute. In this table, information is defined such that "won once" and " ⁇ newcomer" are included in "current job".
- the classification unit 152 assigns a weight to each hypothesis by calculating the cumulative value of the weights set to the hypotheses based on the inclusion relationship of the hypotheses.
- the processing in which the classification unit 152 calculates the cumulative value, calculates the weight, and assigns the weight to each hypothesis corresponds to the processing described with reference to FIGS. 4 and 5 .
- the classification unit 152 identifies a first vector in which each hypothesis of the first hypothesis set is a dimension and the value of each dimension is the cumulative value of each hypothesis.
- the classification unit 152 identifies a second vector having each hypothesis of the second hypothesis set as a dimension and the value of each dimension as the cumulative value of each hypothesis.
- the classification unit 152 identifies the distance between the first vector and the second vector as the degree of similarity.
- the classification unit 152 identifies the degree of similarity between each learning model by repeatedly executing the above processing for all combinations of learning models M.
- the learning unit 151 specifies the degree of similarity between the learning models, and classifies the learning models with the degree of similarity equal to or greater than the threshold into the same group. For example, when the similarity between the learning model M1 and the learning model M2 is equal to or greater than the threshold, and the similarity between the learning model M2 and the learning model M3 is equal to or greater than the threshold, the classification unit 152 classifies the learning models M1 and M2. , M3 into the same group.
- the classification unit 152 classifies a plurality of learning models into a plurality of groups by executing the above processing, and outputs the classification result to the generation unit 153 .
- hypotheses added to each hypothesis set by the classification unit 152 are used only when the classification unit 152 generates vectors so that the granularity of the hypotheses is uniform. shall not be used.
- Generating unit 153 generates common hypothesis sets (for example, common hypothesis sets Hc1, Hc2-1, Hc2-2, unique hypothesis sets (for example, unique hypothesis sets Hc3-1 to Hc3 -n) are hierarchically connected to generate hierarchical information 145.
- the generating unit 153 may output the hierarchical information 145 to the display unit 130 for display, or send the hierarchical information 145 to an external device connected to the network. 145 may be sent.
- the generation unit 153 compares the hypothesis sets of the learning models M classified into the same group and identifies a common hypothesis set in the same group. In addition, the generation unit 153 compares the common hypothesis sets of each group to identify common hypothesis sets between different groups.
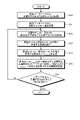
- FIG. 10 is a flow chart showing a processing procedure for identifying common hypothesis sets.
- FIG. 10 as an example, a case of identifying a common hypothesis set common to a hypothesis set Hn of a learning model Mn and a hypothesis set of another learning model M will be described.
- the generation unit 153 of the information presentation device 100 acquires the hypothesis set Hn of the learning model Mn from the hypothesis database 143 (step S10).
- the generation unit 153 acquires a list of learning models M from the hypothesis database 143 (step S11).
- the generation unit 153 acquires the hypothesis set H i of the undetermined learning model M from the list of learning models M (step S12).
- the generation unit 153 excludes contradictory hypotheses between the hypothesis set H i and the hypothesis set H n (step S13).
- the hypothesis set H i and the hypothesis set H n from which contradictory hypotheses are excluded are denoted as the hypothesis set H i ' and the hypothesis set H n ', respectively.
- the generation unit 153 generates a hypothesis set H common common to the hypothesis set H i ' and the hypothesis set H n ' (step S14).
- the generation unit 153 registers the information of the learning model having the hypothesis set H common in the common hypothesis set table 144, and records the relationship of the learning model corresponding to the hypothesis set H common (step S15).
- step S16 If the generation unit 153 has not executed processing for all the learning models M included in the list (step S16, No), the process proceeds to step S12. When the generation unit 153 has executed the processing for all the learning models M included in the list (step S16, Yes), the processing ends.
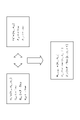
- FIG. 11 is a diagram for explaining the process of excluding contradictory hypotheses between hypothesis sets.
- the generation unit 153 executes "contradiction determination” as follows.
- the generation unit 153 generates two hypotheses “H1: C1 ⁇ R1” and “H2: C2 ⁇ R2” in which the condition part is in the inclusion relationship “C1 ⁇ C2 ⁇ C1 ⁇ C2” and the conclusion part is in the exclusion relationship If "R1 ⁇ R2 ⁇ ", it is determined that H1 and H2 are inconsistent (True).
- Hypotheses ⁇ H n,1 , H n,2 , H n,3 , H n,4 , H n,5 ⁇ shall be included in the hypothesis set H n of the learning model Mn.
- Each hypothesis shall be shown below.
- A, B, C, D, E, and F of each hypothesis are examples of attributes (explanatory variables).
- Hn ,1 A ⁇ Ture Hn ,2 : B ⁇ F ⁇ Ture Hn ,3 : C ⁇ Ture Hn ,4 : D ⁇ False Hn ,5 : E ⁇ Ture
- Hypothesis set H 1 of learning model M1 includes hypotheses ⁇ H 1,1 , H 1,2 , H 1,3 , H 1,4 , H 1,5 ⁇ .
- Each hypothesis shall be shown below.
- A, B, C, D, E, and F of each hypothesis are examples of attributes (explanatory variables).
- H 1,1 A ⁇ Ture H 1,2 : B ⁇ Ture H 1,3 : C ⁇ D ⁇ Ture H 1,4 : E ⁇ False
- the generation unit 153 determines that Hn ,4 of the hypothesis set Hn and H1,3 of the hypothesis set H1 are inconsistent. The generation unit 153 also determines that H n,5 of the hypothesis set H n and H 1,4 of the hypothesis set H 1 are inconsistent.
- the generation unit 153 generates a hypothesis set H n ′ by excluding contradictory H n,4 and H n,5 from the hypothesis set H n based on the result of the contradiction determination.
- the generation unit 153 generates a hypothesis set H 1 ′ by excluding contradictory H 1,4 and H 1,5 from the hypothesis set H 1 based on the result of the contradiction determination.
- FIG. 12 is a diagram for explaining the process of generating hypotheses that are common among hypothesis sets.
- the generation unit 153 executes "common hypothesis generation” as follows.
- the generator 153 determines whether or not the conditional parts of the two hypotheses “H1: C1 ⁇ R1” and “H2: C2 ⁇ R2” are in the inclusion relationship “C1 ⁇ C2 ⁇ C1 ⁇ C2”.
- the hypothesis set H n ' (hypothesis set H n with contradictory hypotheses removed) of the learning model Mn and the hypothesis set H 1 ' (hypothesis set H 1 with contradictory hypotheses removed) of the learning model M1 are divided. will be used for explanation.
- Hypothesis set H n ' of learning model Mn includes hypotheses ⁇ H n,1 , H n,2 , H n,3 ⁇ .
- Hypothesis set H 1 ′ of learning model M1 includes hypotheses ⁇ H 1,1 , H 1,2 , H 1,3 ⁇ .
- the generation unit 153 Since the hypothesis H n,1 of the hypothesis set H n ′ and the hypothesis H 1,1 of the hypothesis set H 1 ′ match, the generation unit 153 generates a common hypothesis “H c,1 : A ⁇ True”.
- the generation unit 153 will explain the common hypothesis generation for the hypothesis H n,2 of the hypothesis set H n ′ and the hypothesis H 1,2 of the hypothesis set H 1 ′.
- the generating unit 153 generates the common part “True” of the concluding part. Through the above processing, the generation unit 153 generates the hypothesis H n,2 , the hypothesis H1,2 and the common hypothesis “B ⁇ F ⁇ True”.
- the generation unit 153 executes the above process to generate a hypothesis set H common common to the hypothesis set H n ' of the learning model Mn and the hypothesis set H 1 ' of the learning model M1.
- the common hypothesis set H common includes hypotheses ⁇ H c,1 , H c,2 ⁇ .
- Each hypothesis shall be as follows.
- H c,1 A ⁇ True Hc ,2 : B ⁇ F ⁇ True
- the generation unit 153 records the relationship of learning models corresponding to the common hypothesis set H common based on the results of the processing performed in FIG. 12 .
- FIG. 13 is a diagram showing the relationship of learning models to common hypothesis sets.
- the example shown in FIG. 13 shows a hypothesis set Hcommon common to the hypothesis set H1 corresponding to the learning model M1 and the hypothesis set Hn corresponding to the learning model Mn.
- the generation unit 153 registers the relationship of the learning model to the common hypothesis set shown in FIG. 13 in the common hypothesis set table 144 of the storage unit 140 .
- the generation unit 153 associates the set of identification information of the compared learning model M with the common hypothesis set H common , and registers them in the common hypothesis set table 144 .
- FIG. 14 is a diagram for explaining the process of updating the conclusion part considering the weight of the hypothesis.
- the example shown in FIG. 14 will be described using the hypothesis set Hn of the learning model Mn .
- Each hypothesis shall be shown below.
- the weights of H n,1 , H n,2 , H n,3 , H n,4 and H n,5 are respectively 0.2, 0.3, 0.4, ⁇ 0.3, and 0.2. do.
- H n,1 A ⁇ True (weight: 0.2)
- H n,2 B ⁇ F ⁇ True (weight: 0.3)
- H n,3 C ⁇ True (weight: 0.4)
- H n,4 D ⁇ False (weight: ⁇ 0.3)
- H n,5 E ⁇ True (weight: 0.2)
- hypothesis H n,3 is assumed to be included in hypothesis H n,4 and hypothesis H n,5 .
- the generation unit 153 adds the weight “0.4” of the hypothesis H n, 3 to the weight “ ⁇ 0.3” of the hypothesis H n,4 of the inclusion destination, thereby obtaining the hypothesis H n, Update the weight of 4 to "0.1". Also, since the weight of hypothesis H n,4 has changed from a negative value to a positive value, the conclusion part of hypothesis H n,4 is updated to "True".
- the generator 153 adds the weight “0.4” of the hypothesis H n, 3 to the weight “0.2” of the hypothesis H n,5 of the inclusion destination, thereby reducing the weight of the hypothesis H n,5 to “0. .6”. Also, since the weight of hypothesis H n,5 does not change from a positive value, the conclusion part of hypothesis H n,5 is left as "True”.
- the generation unit 153 By executing the above process, the generation unit 153 repeatedly executes the process of identifying a common hypothesis set among the hypothesis sets of the learning models belonging to the same group. Similarly, the generation unit 153 identifies a common hypothesis set among the hypothesis sets of each group based on the hypothesis sets of each group. By executing such processing, the generation unit 153 can generate, for example, the common hypothesis sets Hc1, Hc2-1, Hc2-2 and the unique hypothesis sets Hc3-1, Hc3-2, Hc3-3, Hc3 described in FIG. - specify n. The generating unit 153 also generates hierarchical information 145 in which common hypothesis sets Hc1, Hc2-1, Hc2-2 and unique hypothesis sets Hc3-1, Hc3-2, Hc3-3, Hc3-n are hierarchically connected. do.
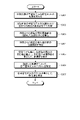
- FIG. 15 is a flow chart showing the processing procedure of the information presentation device according to the present embodiment.
- the learning unit 151 of the information presentation device 100 generates a plurality of learning models M based on the learning data 141 and registers them in the learning model table 142 (step S101).
- the classification unit 152 of the information presentation device 100 extracts the hypothesis set and the weight of the hypothesis from the learning model M of the learning model table 142, and registers them in the hypothesis database 143 (step S102).
- the classification unit 152 executes similarity processing (step S103).
- the classification unit 152 classifies the learning models into a plurality of groups based on the degree of similarity of each learning model M (step S104).
- the generation unit 153 of the information presentation device 100 executes common hypothesis identification processing (step S105).
- the generation unit 153 generates the hierarchy information 145 based on the result of the common hypothesis identification process (step S106). Generation unit 153 outputs hierarchical information 145 to display unit 130 (step S107).
- FIG. 16 is a flowchart (1) showing a processing procedure of similarity calculation processing.
- the classification unit 152 of the information presentation device 100 aligns the granularity of hypothesis sets of learning models M to be compared (step S201).
- the classification unit 152 lists all the conditional parts of the hypotheses included in the hypothesis set of the learning model M to be compared (Step S202).
- the classification unit 152 determines the inclusive relationship between the conditional parts of the enumerated hypotheses (step S203). The classification unit 152 calculates the cumulative weight of each hypothesis for each learning model M and identifies a vector (step S204).
- the classification unit 152 calculates the degree of similarity based on the vector of each learning model M (step S205).
- step S105 of FIG. 15 corresponds to the processing procedure described with reference to FIG.
- FIG. 17 is a diagram showing an example of a scatter diagram of cumulative values of weights between learning models.
- a scatter diagram of the learning model Mn and the learning model Mn is assumed to be a scatter diagram (n, m).
- the vertical axis of the scatter diagram (n, m) is the axis that indicates the cumulative value of the hypotheses of the learning model Mn.
- the horizontal axis of the scatter diagram (n, m) is the axis that indicates the cumulative value of the hypotheses of the learning model Mm.
- a scatter diagram of a set of learning models M whose similarity is equal to or greater than the threshold is a scatter diagram as shown in scatter diagrams (1, 2). That is, the learning model M1 and the learning model M2 are similar learning models. As shown in scatter diagrams (1, 3), (2, 3), (4, 3), and (5, 3), the positive/negative of the cumulative value may be different for each learning model.
- the information presentation device 100 generates a plurality of learning models M by executing machine learning using the learning data 141 .
- the information presentation device 100 displays, in a hierarchical structure, a relationship between a common hypothesis and a differential hypothesis for a plurality of hypotheses extracted from each of a plurality of learning models, each of which is defined by a combination of one or more explanatory variables.
- the hierarchy information 145 to represent is generated. By referring to the hierarchical information 145, the user can see the commonalities and differences of the hypotheses of multiple learning models M from multiple learning models M, making it possible to easily compare complicated learning models. can do.
- the information presentation device 100 identifies a common hypothesis that is common to the hypothesis set of one learning model and the hypothesis set of the other learning model to be compared, and the difference hypothesis that is the difference, and places the common hypothesis in the upper layer of the difference hypothesis.
- Hierarchical information 145 is generated by arranging them. Common hypotheses correspond to the common hypothesis set in FIG. 1, and differential hypotheses correspond to the unique hypothesis set in FIG.
- the information presentation device 100 identifies the degree of similarity of the learning model based on the hypothesis set extracted from the learning model M, and classifies the plurality of learning models into a plurality of groups based on the identified degree of similarity.
- the information presentation device 100 identifies common hypotheses and differential hypotheses based on the classification results. This makes it possible to identify common hypotheses and differential hypotheses based on hypotheses sets of similar learning models.
- the information presentation device 100 aligns the granularity of the hypotheses of the hypothesis sets of each learning model M to be compared, and identifies the similarity of each learning model M to be compared based on the cumulative value of the hypothesis sets. This makes it possible to identify the degree of similarity of each learning model M even if the hypotheses of the learning models to be compared do not completely correspond.
- processing procedure of the similarity degree calculation processing executed by the classification unit 152 is not limited to the processing procedure of FIG. 16, and for example, the similarity degree calculation processing shown in FIG. 18 may be executed.
- FIG. 18 is a flowchart (2) showing the processing procedure of the similarity calculation process.
- the classification unit 152 of the information presentation device 100 aligns the granularity of hypothesis sets of the learning models M to be compared (step S301).
- the classification unit 152 lists all the conditional parts of the hypotheses included in the hypothesis set of the learning model M to be compared (step S302).
- the classification unit 152 calculates the overlap rate between the enumerated hypotheses (step S303). In the process of step S303, the classification unit 152 may calculate the overlapping ratio by excluding additional hypotheses for matching granularity.
- the classification unit 152 determines the inclusive relationship between the conditional parts of the enumerated hypotheses (step S304). The classification unit 152 calculates the cumulative value of the weight of each hypothesis for each learning model M, and corrects the cumulative value by multiplying the cumulative value by the overlapping ratio (step S305).
- the classification unit 152 identifies the vector of each learning model based on the corrected cumulative value (step S306).
- the classification unit 152 calculates the degree of similarity based on the vector of each learning model M (step S307).
- the classification unit 152 of the information presentation device 100 corrects the cumulative value and calculates the vector based on the overlapping ratio of the learning model M to be compared.
- the vector of the learning model M to be compared is adjusted according to the overlapping ratio of the hypothesis set of the learning model M, so that the similarity of each learning model M can be calculated more accurately.
- the classification unit 152 of the information presentation device 100 described above calculates the vectors of the learning models by aligning the granularity of the hypothesis sets of the learning models M to be compared, it is not limited to this.
- the classification unit 152 compares the hypothesis sets of the learning models M to be compared, identifies co-occurring hypotheses, calculates a vector using only the identified hypotheses, and identifies the similarity of the learning models M. You may As a result, the process of aligning the granularity of hypotheses is skipped, so that similar learning models M can be specified while simplifying the process.
- FIG. 19 is a diagram showing an example of the hardware configuration of a computer that implements the same functions as the information presentation device of the embodiment.
- the computer 200 has a CPU 201 that executes various arithmetic processes, an input device 202 that receives data input from the user, and a display 203 .
- the computer 200 also has a communication device 204 and an interface device 205 for exchanging data with an external device or the like via a wired or wireless network.
- the computer 200 also has a RAM 206 that temporarily stores various information, and a hard disk device 207 . Each device 201 - 207 is then connected to a bus 208 .
- the hard disk device 207 has a learning program 207a, a classification program 207b, and a generation program 207c. Further, the CPU 201 reads each program 207 a to 207 c and develops them in the RAM 206 .
- the learning program 207a functions as a learning process 206a.
- Classification program 207b functions as classification process 206b.
- the generation program 207c functions as a generation process 206c.
- the processing of the learning process 206a corresponds to the processing of the learning unit 151.
- the processing of the classification process 206 b corresponds to the processing of the classification section 152 .
- the processing of the generation process 206 c corresponds to the processing of the generation unit 153 .
- each program 207a to 207c do not necessarily have to be stored in the hard disk device 207 from the beginning.
- each program is stored in a “portable physical medium” such as a flexible disk (FD), CD-ROM, DVD, magneto-optical disk, IC card, etc. inserted into the computer 200 . Then, the computer 200 may read and execute each program 207a to 207c.
- a “portable physical medium” such as a flexible disk (FD), CD-ROM, DVD, magneto-optical disk, IC card, etc.
- communication unit 120 input unit 130 display unit 140 storage unit 141 learning data 142 learning model table 143 hypothesis database 144 common hypothesis set table 145 hierarchical information 150 control unit 151 learning unit 152 classification unit 153 generation unit
Landscapes
- Engineering & Computer Science (AREA)
- Theoretical Computer Science (AREA)
- Software Systems (AREA)
- Data Mining & Analysis (AREA)
- Evolutionary Computation (AREA)
- Medical Informatics (AREA)
- Physics & Mathematics (AREA)
- Computing Systems (AREA)
- General Engineering & Computer Science (AREA)
- General Physics & Mathematics (AREA)
- Mathematical Physics (AREA)
- Artificial Intelligence (AREA)
- Computer Vision & Pattern Recognition (AREA)
- Computational Linguistics (AREA)
- Information Retrieval, Db Structures And Fs Structures Therefor (AREA)
Priority Applications (5)
| Application Number | Priority Date | Filing Date | Title |
|---|---|---|---|
| EP21934900.8A EP4318333A4 (en) | 2021-03-31 | 2021-03-31 | Information presentation program, information presentation method, and information presentation device |
| JP2023510027A JP7495008B2 (ja) | 2021-03-31 | 2021-03-31 | 情報提示プログラム、情報提示方法および情報提示装置 |
| CN202180096464.5A CN117083620A (zh) | 2021-03-31 | 2021-03-31 | 信息提示程序、信息提示方法以及信息提示装置 |
| PCT/JP2021/013860 WO2022208734A1 (ja) | 2021-03-31 | 2021-03-31 | 情報提示プログラム、情報提示方法および情報提示装置 |
| US18/468,565 US20240005214A1 (en) | 2021-03-31 | 2023-09-15 | Non-transitory computer-readable recording medium storing information presentation program, information presentation method, and information presentation device |
Applications Claiming Priority (1)
| Application Number | Priority Date | Filing Date | Title |
|---|---|---|---|
| PCT/JP2021/013860 WO2022208734A1 (ja) | 2021-03-31 | 2021-03-31 | 情報提示プログラム、情報提示方法および情報提示装置 |
Related Child Applications (1)
| Application Number | Title | Priority Date | Filing Date |
|---|---|---|---|
| US18/468,565 Continuation US20240005214A1 (en) | 2021-03-31 | 2023-09-15 | Non-transitory computer-readable recording medium storing information presentation program, information presentation method, and information presentation device |
Publications (1)
| Publication Number | Publication Date |
|---|---|
| WO2022208734A1 true WO2022208734A1 (ja) | 2022-10-06 |
Family
ID=83458172
Family Applications (1)
| Application Number | Title | Priority Date | Filing Date |
|---|---|---|---|
| PCT/JP2021/013860 Ceased WO2022208734A1 (ja) | 2021-03-31 | 2021-03-31 | 情報提示プログラム、情報提示方法および情報提示装置 |
Country Status (5)
| Country | Link |
|---|---|
| US (1) | US20240005214A1 (https=) |
| EP (1) | EP4318333A4 (https=) |
| JP (1) | JP7495008B2 (https=) |
| CN (1) | CN117083620A (https=) |
| WO (1) | WO2022208734A1 (https=) |
Citations (4)
| Publication number | Priority date | Publication date | Assignee | Title |
|---|---|---|---|---|
| JP2018077547A (ja) * | 2015-03-16 | 2018-05-17 | 国立大学法人東京農工大学 | 並列処理装置、並列処理方法、および、並列化処理用プログラム |
| JP2020046888A (ja) | 2018-09-18 | 2020-03-26 | 富士通株式会社 | 学習プログラム、予測プログラム、学習方法、予測方法、学習装置および予測装置 |
| JP2020140572A (ja) * | 2019-02-28 | 2020-09-03 | 富士通株式会社 | 配分方法、抽出方法、配分プログラム、抽出プログラム、配分装置及び抽出装置 |
| JP2021012531A (ja) * | 2019-07-05 | 2021-02-04 | 富士通株式会社 | 予測プログラム、予測方法および予測装置 |
-
2021
- 2021-03-31 EP EP21934900.8A patent/EP4318333A4/en not_active Withdrawn
- 2021-03-31 JP JP2023510027A patent/JP7495008B2/ja active Active
- 2021-03-31 WO PCT/JP2021/013860 patent/WO2022208734A1/ja not_active Ceased
- 2021-03-31 CN CN202180096464.5A patent/CN117083620A/zh active Pending
-
2023
- 2023-09-15 US US18/468,565 patent/US20240005214A1/en active Pending
Patent Citations (4)
| Publication number | Priority date | Publication date | Assignee | Title |
|---|---|---|---|---|
| JP2018077547A (ja) * | 2015-03-16 | 2018-05-17 | 国立大学法人東京農工大学 | 並列処理装置、並列処理方法、および、並列化処理用プログラム |
| JP2020046888A (ja) | 2018-09-18 | 2020-03-26 | 富士通株式会社 | 学習プログラム、予測プログラム、学習方法、予測方法、学習装置および予測装置 |
| JP2020140572A (ja) * | 2019-02-28 | 2020-09-03 | 富士通株式会社 | 配分方法、抽出方法、配分プログラム、抽出プログラム、配分装置及び抽出装置 |
| JP2021012531A (ja) * | 2019-07-05 | 2021-02-04 | 富士通株式会社 | 予測プログラム、予測方法および予測装置 |
Non-Patent Citations (3)
| Title |
|---|
| SATOSHI HARAMASAKAZU ISHIHATA: "Approximate and Exact Enumeration of Rule Models", AAAI-18 |
| SATOSHI HARATAKANORI MAEHARA: "Enumerate Lasso Solutions for Feature Selection", AAAI-17 |
| See also references of EP4318333A4 |
Also Published As
| Publication number | Publication date |
|---|---|
| CN117083620A (zh) | 2023-11-17 |
| US20240005214A1 (en) | 2024-01-04 |
| EP4318333A1 (en) | 2024-02-07 |
| JPWO2022208734A1 (https=) | 2022-10-06 |
| JP7495008B2 (ja) | 2024-06-04 |
| EP4318333A4 (en) | 2024-05-22 |
Similar Documents
| Publication | Publication Date | Title |
|---|---|---|
| US12045779B2 (en) | System, method, and computer program for automatically removing data from candidate profiles that may influence bias | |
| US11593665B2 (en) | Systems and methods driven by link-specific numeric information for predicting associations based on predicate types | |
| US10565521B2 (en) | Merging feature subsets using graphical representation | |
| JP6414363B2 (ja) | 予測システム、方法およびプログラム | |
| JP6311851B2 (ja) | 共クラスタリングシステム、方法およびプログラム | |
| CN107392217B (zh) | 计算机实现的信息处理方法及装置 | |
| US20190065987A1 (en) | Capturing knowledge coverage of machine learning models | |
| US20200051098A1 (en) | Method and System for Predictive Modeling of Consumer Profiles | |
| US20200202212A1 (en) | Learning device, learning method, and computer-readable recording medium | |
| JPWO2018088277A1 (ja) | 予測モデル生成システム、方法およびプログラム | |
| US11537914B2 (en) | Systems and methods for determining developed code scores of an application | |
| WO2016063502A1 (ja) | 知識管理装置、知識管理方法、及び、プログラムの記録媒体 | |
| JP6375210B2 (ja) | モデル構築装置及びプログラム | |
| JP7495008B2 (ja) | 情報提示プログラム、情報提示方法および情報提示装置 | |
| US11188325B1 (en) | Systems and methods for determining developed code scores of an application | |
| JP6270768B2 (ja) | 営業担当者候補抽出システム | |
| KR102876273B1 (ko) | 사용자 차량 추천을 위한 빅데이터 수집 시스템 및 그 동작 방법 | |
| US20240184815A1 (en) | Search apparatus, search method, and computer readable recording medium | |
| Melo et al. | Model performance prediction: A meta-learning approach for concept drift detection | |
| CN114897054B (zh) | 用户信息分类模型的训练、用户信息分类方法及装置 | |
| Nowak et al. | Interactive Selection of Reference Sets in Multistage Bipolar Method | |
| US20240346400A1 (en) | Method and system for workforce elasticity indexing | |
| CA3098731C (en) | Method and system for workforce elasticity indexing | |
| Nouretdinov | Conformal Mining for Multiple Error Correction in the Data | |
| Melo et al. | A Meta-Learning Approach for Concept |
Legal Events
| Date | Code | Title | Description |
|---|---|---|---|
| 121 | Ep: the epo has been informed by wipo that ep was designated in this application |
Ref document number: 21934900 Country of ref document: EP Kind code of ref document: A1 |
|
| ENP | Entry into the national phase |
Ref document number: 2023510027 Country of ref document: JP Kind code of ref document: A |
|
| WWE | Wipo information: entry into national phase |
Ref document number: 202180096464.5 Country of ref document: CN |
|
| WWE | Wipo information: entry into national phase |
Ref document number: 2021934900 Country of ref document: EP |
|
| ENP | Entry into the national phase |
Ref document number: 2021934900 Country of ref document: EP Effective date: 20231031 |
|
| NENP | Non-entry into the national phase |
Ref country code: DE |
|
| WWW | Wipo information: withdrawn in national office |
Ref document number: 2021934900 Country of ref document: EP |