WO2022059467A1 - Cell analysis method and cell analysis device - Google Patents
Cell analysis method and cell analysis device Download PDFInfo
- Publication number
- WO2022059467A1 WO2022059467A1 PCT/JP2021/031651 JP2021031651W WO2022059467A1 WO 2022059467 A1 WO2022059467 A1 WO 2022059467A1 JP 2021031651 W JP2021031651 W JP 2021031651W WO 2022059467 A1 WO2022059467 A1 WO 2022059467A1
- Authority
- WO
- WIPO (PCT)
- Prior art keywords
- parallel processing
- cell
- data
- processor
- unit
- Prior art date
Links
- 238000004458 analytical method Methods 0.000 title claims abstract description 192
- 238000012545 processing Methods 0.000 claims abstract description 481
- 238000000034 method Methods 0.000 claims abstract description 78
- 230000008569 process Effects 0.000 claims abstract description 52
- 238000005259 measurement Methods 0.000 claims description 248
- 238000013135 deep learning Methods 0.000 claims description 110
- 238000004422 calculation algorithm Methods 0.000 claims description 91
- 239000011159 matrix material Substances 0.000 claims description 56
- 230000005540 biological transmission Effects 0.000 claims description 43
- 238000005070 sampling Methods 0.000 claims description 36
- 238000004891 communication Methods 0.000 claims description 14
- 230000001678 irradiating effect Effects 0.000 claims description 9
- 238000013473 artificial intelligence Methods 0.000 claims description 4
- 238000001914 filtration Methods 0.000 claims 1
- 210000004027 cell Anatomy 0.000 description 467
- 239000000523 sample Substances 0.000 description 145
- 238000012549 training Methods 0.000 description 91
- 238000006243 chemical reaction Methods 0.000 description 89
- 239000003153 chemical reaction reagent Substances 0.000 description 59
- 238000013528 artificial neural network Methods 0.000 description 57
- 230000006870 function Effects 0.000 description 51
- 238000003860 storage Methods 0.000 description 44
- 210000004369 blood Anatomy 0.000 description 42
- 239000008280 blood Substances 0.000 description 42
- 238000010586 diagram Methods 0.000 description 40
- 239000012472 biological sample Substances 0.000 description 38
- 238000004364 calculation method Methods 0.000 description 35
- 230000003287 optical effect Effects 0.000 description 29
- 210000000440 neutrophil Anatomy 0.000 description 28
- 238000001514 detection method Methods 0.000 description 26
- 238000002360 preparation method Methods 0.000 description 21
- 210000000265 leukocyte Anatomy 0.000 description 20
- 210000003924 normoblast Anatomy 0.000 description 20
- 210000003743 erythrocyte Anatomy 0.000 description 19
- 238000012546 transfer Methods 0.000 description 19
- 239000000975 dye Substances 0.000 description 17
- 210000002700 urine Anatomy 0.000 description 16
- 210000001124 body fluid Anatomy 0.000 description 15
- 239000010839 body fluid Substances 0.000 description 15
- 210000000601 blood cell Anatomy 0.000 description 14
- 239000000306 component Substances 0.000 description 13
- 238000007689 inspection Methods 0.000 description 13
- 210000004940 nucleus Anatomy 0.000 description 13
- 241000894006 Bacteria Species 0.000 description 12
- 230000002159 abnormal effect Effects 0.000 description 11
- 238000012360 testing method Methods 0.000 description 11
- 210000003651 basophil Anatomy 0.000 description 10
- 238000007405 data analysis Methods 0.000 description 10
- 238000011478 gradient descent method Methods 0.000 description 10
- 239000007788 liquid Substances 0.000 description 10
- 210000004698 lymphocyte Anatomy 0.000 description 10
- 238000010186 staining Methods 0.000 description 10
- 239000003219 hemolytic agent Substances 0.000 description 9
- 230000002949 hemolytic effect Effects 0.000 description 9
- 208000032839 leukemia Diseases 0.000 description 9
- 230000007246 mechanism Effects 0.000 description 9
- 210000001616 monocyte Anatomy 0.000 description 9
- 239000004094 surface-active agent Substances 0.000 description 9
- 210000000170 cell membrane Anatomy 0.000 description 8
- 238000003384 imaging method Methods 0.000 description 8
- 230000000877 morphologic effect Effects 0.000 description 8
- 239000004065 semiconductor Substances 0.000 description 8
- 230000002485 urinary effect Effects 0.000 description 8
- 230000015572 biosynthetic process Effects 0.000 description 7
- 210000003979 eosinophil Anatomy 0.000 description 7
- 238000005755 formation reaction Methods 0.000 description 7
- 210000003714 granulocyte Anatomy 0.000 description 7
- 102000039446 nucleic acids Human genes 0.000 description 7
- 108020004707 nucleic acids Proteins 0.000 description 7
- 150000007523 nucleic acids Chemical class 0.000 description 7
- 230000008054 signal transmission Effects 0.000 description 7
- 208000031261 Acute myeloid leukaemia Diseases 0.000 description 6
- 208000033776 Myeloid Acute Leukemia Diseases 0.000 description 6
- 230000004913 activation Effects 0.000 description 6
- 239000003086 colorant Substances 0.000 description 6
- 238000009826 distribution Methods 0.000 description 6
- 239000007850 fluorescent dye Substances 0.000 description 6
- 210000005259 peripheral blood Anatomy 0.000 description 6
- 239000011886 peripheral blood Substances 0.000 description 6
- 210000004881 tumor cell Anatomy 0.000 description 6
- 230000001154 acute effect Effects 0.000 description 5
- 230000003204 osmotic effect Effects 0.000 description 5
- 239000012192 staining solution Substances 0.000 description 5
- PGLIUCLTXOYQMV-UHFFFAOYSA-N Cetirizine hydrochloride Chemical compound Cl.Cl.C1CN(CCOCC(=O)O)CCN1C(C=1C=CC(Cl)=CC=1)C1=CC=CC=C1 PGLIUCLTXOYQMV-UHFFFAOYSA-N 0.000 description 4
- 241000233866 Fungi Species 0.000 description 4
- 208000006664 Precursor Cell Lymphoblastic Leukemia-Lymphoma Diseases 0.000 description 4
- 239000003795 chemical substances by application Substances 0.000 description 4
- 238000013527 convolutional neural network Methods 0.000 description 4
- 238000003703 image analysis method Methods 0.000 description 4
- 230000035945 sensitivity Effects 0.000 description 4
- 206010025323 Lymphomas Diseases 0.000 description 3
- 210000004460 N cell Anatomy 0.000 description 3
- 230000002378 acidificating effect Effects 0.000 description 3
- 238000000149 argon plasma sintering Methods 0.000 description 3
- 210000001185 bone marrow Anatomy 0.000 description 3
- 239000012141 concentrate Substances 0.000 description 3
- 230000007423 decrease Effects 0.000 description 3
- 201000010099 disease Diseases 0.000 description 3
- 208000037265 diseases, disorders, signs and symptoms Diseases 0.000 description 3
- 210000002919 epithelial cell Anatomy 0.000 description 3
- 210000000981 epithelium Anatomy 0.000 description 3
- 210000003958 hematopoietic stem cell Anatomy 0.000 description 3
- 238000007430 reference method Methods 0.000 description 3
- 239000012128 staining reagent Substances 0.000 description 3
- 239000000126 substance Substances 0.000 description 3
- 239000000725 suspension Substances 0.000 description 3
- 230000001360 synchronised effect Effects 0.000 description 3
- 208000024893 Acute lymphoblastic leukemia Diseases 0.000 description 2
- 208000014697 Acute lymphocytic leukaemia Diseases 0.000 description 2
- 206010000890 Acute myelomonocytic leukaemia Diseases 0.000 description 2
- XKRFYHLGVUSROY-UHFFFAOYSA-N Argon Chemical compound [Ar] XKRFYHLGVUSROY-UHFFFAOYSA-N 0.000 description 2
- 206010003445 Ascites Diseases 0.000 description 2
- 208000010839 B-cell chronic lymphocytic leukemia Diseases 0.000 description 2
- 208000032791 BCR-ABL1 positive chronic myelogenous leukemia Diseases 0.000 description 2
- 208000010833 Chronic myeloid leukaemia Diseases 0.000 description 2
- 208000017604 Hodgkin disease Diseases 0.000 description 2
- 208000021519 Hodgkin lymphoma Diseases 0.000 description 2
- 208000010747 Hodgkins lymphoma Diseases 0.000 description 2
- 208000031422 Lymphocytic Chronic B-Cell Leukemia Diseases 0.000 description 2
- 208000034578 Multiple myelomas Diseases 0.000 description 2
- 208000033761 Myelogenous Chronic BCR-ABL Positive Leukemia Diseases 0.000 description 2
- 208000033835 Myelomonocytic Acute Leukemia Diseases 0.000 description 2
- 206010035226 Plasma cell myeloma Diseases 0.000 description 2
- 208000002151 Pleural effusion Diseases 0.000 description 2
- 208000011912 acute myelomonocytic leukemia M4 Diseases 0.000 description 2
- 210000001175 cerebrospinal fluid Anatomy 0.000 description 2
- 230000008859 change Effects 0.000 description 2
- 208000032852 chronic lymphocytic leukemia Diseases 0.000 description 2
- 238000007796 conventional method Methods 0.000 description 2
- 239000003085 diluting agent Substances 0.000 description 2
- 238000004043 dyeing Methods 0.000 description 2
- 239000000284 extract Substances 0.000 description 2
- 238000000684 flow cytometry Methods 0.000 description 2
- 239000012530 fluid Substances 0.000 description 2
- 239000007789 gas Substances 0.000 description 2
- 230000007274 generation of a signal involved in cell-cell signaling Effects 0.000 description 2
- 239000011521 glass Substances 0.000 description 2
- 239000012535 impurity Substances 0.000 description 2
- 210000004005 intermediate erythroblast Anatomy 0.000 description 2
- 238000012886 linear function Methods 0.000 description 2
- 230000000527 lymphocytic effect Effects 0.000 description 2
- 208000003747 lymphoid leukemia Diseases 0.000 description 2
- 210000001237 metamyelocyte Anatomy 0.000 description 2
- 210000001167 myeloblast Anatomy 0.000 description 2
- 210000003887 myelocyte Anatomy 0.000 description 2
- 210000000633 nuclear envelope Anatomy 0.000 description 2
- 210000004180 plasmocyte Anatomy 0.000 description 2
- 230000010287 polarization Effects 0.000 description 2
- 210000004765 promyelocyte Anatomy 0.000 description 2
- APTZNLHMIGJTEW-UHFFFAOYSA-N pyraflufen-ethyl Chemical compound C1=C(Cl)C(OCC(=O)OCC)=CC(C=2C(=C(OC(F)F)N(C)N=2)Cl)=C1F APTZNLHMIGJTEW-UHFFFAOYSA-N 0.000 description 2
- 230000009467 reduction Effects 0.000 description 2
- 210000001995 reticulocyte Anatomy 0.000 description 2
- 239000000758 substrate Substances 0.000 description 2
- 208000011580 syndromic disease Diseases 0.000 description 2
- ANRHNWWPFJCPAZ-UHFFFAOYSA-M thionine Chemical compound [Cl-].C1=CC(N)=CC2=[S+]C3=CC(N)=CC=C3N=C21 ANRHNWWPFJCPAZ-UHFFFAOYSA-M 0.000 description 2
- HIXDQWDOVZUNNA-UHFFFAOYSA-N 2-(3,4-dimethoxyphenyl)-5-hydroxy-7-methoxychromen-4-one Chemical compound C=1C(OC)=CC(O)=C(C(C=2)=O)C=1OC=2C1=CC=C(OC)C(OC)=C1 HIXDQWDOVZUNNA-UHFFFAOYSA-N 0.000 description 1
- 206010000871 Acute monocytic leukaemia Diseases 0.000 description 1
- CIWBSHSKHKDKBQ-JLAZNSOCSA-N Ascorbic acid Chemical compound OC[C@H](O)[C@H]1OC(=O)C(O)=C1O CIWBSHSKHKDKBQ-JLAZNSOCSA-N 0.000 description 1
- 206010018910 Haemolysis Diseases 0.000 description 1
- 108010052285 Membrane Proteins Proteins 0.000 description 1
- 102000018697 Membrane Proteins Human genes 0.000 description 1
- 208000035489 Monocytic Acute Leukemia Diseases 0.000 description 1
- 206010028980 Neoplasm Diseases 0.000 description 1
- 208000015914 Non-Hodgkin lymphomas Diseases 0.000 description 1
- 241000047703 Nonion Species 0.000 description 1
- 238000012951 Remeasurement Methods 0.000 description 1
- 240000004808 Saccharomyces cerevisiae Species 0.000 description 1
- RTAQQCXQSZGOHL-UHFFFAOYSA-N Titanium Chemical compound [Ti] RTAQQCXQSZGOHL-UHFFFAOYSA-N 0.000 description 1
- JQDZNJOONPXQSL-UHFFFAOYSA-N [acetyloxy-[2-(diacetyloxyamino)ethyl]amino] acetate;sodium Chemical compound [Na].CC(=O)ON(OC(C)=O)CCN(OC(C)=O)OC(C)=O JQDZNJOONPXQSL-UHFFFAOYSA-N 0.000 description 1
- 239000002253 acid Substances 0.000 description 1
- 230000003321 amplification Effects 0.000 description 1
- 150000001450 anions Chemical class 0.000 description 1
- 239000003146 anticoagulant agent Substances 0.000 description 1
- 229940127219 anticoagulant drug Drugs 0.000 description 1
- 229910052786 argon Inorganic materials 0.000 description 1
- 210000001367 artery Anatomy 0.000 description 1
- 150000001555 benzenes Chemical class 0.000 description 1
- 239000012503 blood component Substances 0.000 description 1
- 201000011510 cancer Diseases 0.000 description 1
- 239000003093 cationic surfactant Substances 0.000 description 1
- 150000001768 cations Chemical class 0.000 description 1
- 210000003855 cell nucleus Anatomy 0.000 description 1
- 238000004590 computer program Methods 0.000 description 1
- 238000012937 correction Methods 0.000 description 1
- 210000000805 cytoplasm Anatomy 0.000 description 1
- 238000013136 deep learning model Methods 0.000 description 1
- 230000001419 dependent effect Effects 0.000 description 1
- 230000009977 dual effect Effects 0.000 description 1
- RTZKZFJDLAIYFH-UHFFFAOYSA-N ether Substances CCOCC RTZKZFJDLAIYFH-UHFFFAOYSA-N 0.000 description 1
- 230000002349 favourable effect Effects 0.000 description 1
- 230000002068 genetic effect Effects 0.000 description 1
- 238000009499 grossing Methods 0.000 description 1
- CPBQJMYROZQQJC-UHFFFAOYSA-N helium neon Chemical compound [He].[Ne] CPBQJMYROZQQJC-UHFFFAOYSA-N 0.000 description 1
- 208000019691 hematopoietic and lymphoid cell neoplasm Diseases 0.000 description 1
- 210000000777 hematopoietic system Anatomy 0.000 description 1
- 230000008588 hemolysis Effects 0.000 description 1
- 229920000669 heparin Polymers 0.000 description 1
- ZFGMDIBRIDKWMY-PASTXAENSA-N heparin Chemical compound CC(O)=N[C@@H]1[C@@H](O)[C@H](O)[C@@H](COS(O)(=O)=O)O[C@@H]1O[C@@H]1[C@@H](C(O)=O)O[C@@H](O[C@H]2[C@@H]([C@@H](OS(O)(=O)=O)[C@@H](O[C@@H]3[C@@H](OC(O)[C@H](OS(O)(=O)=O)[C@H]3O)C(O)=O)O[C@@H]2O)CS(O)(=O)=O)[C@H](O)[C@H]1O ZFGMDIBRIDKWMY-PASTXAENSA-N 0.000 description 1
- 229960001008 heparin sodium Drugs 0.000 description 1
- 210000003701 histiocyte Anatomy 0.000 description 1
- 230000010365 information processing Effects 0.000 description 1
- 230000010354 integration Effects 0.000 description 1
- 230000031700 light absorption Effects 0.000 description 1
- 239000004973 liquid crystal related substance Substances 0.000 description 1
- 210000005074 megakaryoblast Anatomy 0.000 description 1
- 210000003593 megakaryocyte Anatomy 0.000 description 1
- 210000004379 membrane Anatomy 0.000 description 1
- 239000012528 membrane Substances 0.000 description 1
- 230000028161 membrane depolarization Effects 0.000 description 1
- QSHDDOUJBYECFT-UHFFFAOYSA-N mercury Chemical compound [Hg] QSHDDOUJBYECFT-UHFFFAOYSA-N 0.000 description 1
- 229910052753 mercury Inorganic materials 0.000 description 1
- 210000005033 mesothelial cell Anatomy 0.000 description 1
- 206010061289 metastatic neoplasm Diseases 0.000 description 1
- 238000002156 mixing Methods 0.000 description 1
- 210000003003 monocyte-macrophage precursor cell Anatomy 0.000 description 1
- 230000001537 neural effect Effects 0.000 description 1
- 230000007935 neutral effect Effects 0.000 description 1
- 238000010606 normalization Methods 0.000 description 1
- 238000012758 nuclear staining Methods 0.000 description 1
- 238000003199 nucleic acid amplification method Methods 0.000 description 1
- 210000000056 organ Anatomy 0.000 description 1
- 239000002245 particle Substances 0.000 description 1
- 210000004303 peritoneum Anatomy 0.000 description 1
- XAEFZNCEHLXOMS-UHFFFAOYSA-M potassium benzoate Chemical compound [K+].[O-]C(=O)C1=CC=CC=C1 XAEFZNCEHLXOMS-UHFFFAOYSA-M 0.000 description 1
- 108090000623 proteins and genes Proteins 0.000 description 1
- 102000004169 proteins and genes Human genes 0.000 description 1
- 230000004044 response Effects 0.000 description 1
- 238000013341 scale-up Methods 0.000 description 1
- 230000001568 sexual effect Effects 0.000 description 1
- 238000009751 slip forming Methods 0.000 description 1
- 239000000243 solution Substances 0.000 description 1
- 238000005507 spraying Methods 0.000 description 1
- 238000003756 stirring Methods 0.000 description 1
- -1 urine Substances 0.000 description 1
- 210000003741 urothelium Anatomy 0.000 description 1
- 210000003462 vein Anatomy 0.000 description 1
- 210000001835 viscera Anatomy 0.000 description 1
Images


Classifications
-
- G—PHYSICS
- G01—MEASURING; TESTING
- G01N—INVESTIGATING OR ANALYSING MATERIALS BY DETERMINING THEIR CHEMICAL OR PHYSICAL PROPERTIES
- G01N15/00—Investigating characteristics of particles; Investigating permeability, pore-volume, or surface-area of porous materials
- G01N15/10—Investigating individual particles
- G01N15/14—Electro-optical investigation, e.g. flow cytometers
- G01N15/1434—Electro-optical investigation, e.g. flow cytometers using an analyser being characterised by its optical arrangement
-
- G—PHYSICS
- G01—MEASURING; TESTING
- G01N—INVESTIGATING OR ANALYSING MATERIALS BY DETERMINING THEIR CHEMICAL OR PHYSICAL PROPERTIES
- G01N15/00—Investigating characteristics of particles; Investigating permeability, pore-volume, or surface-area of porous materials
- G01N15/10—Investigating individual particles
- G01N15/14—Electro-optical investigation, e.g. flow cytometers
- G01N15/1456—Electro-optical investigation, e.g. flow cytometers without spatial resolution of the texture or inner structure of the particle, e.g. processing of pulse signals
- G01N15/1459—Electro-optical investigation, e.g. flow cytometers without spatial resolution of the texture or inner structure of the particle, e.g. processing of pulse signals the analysis being performed on a sample stream
-
- G—PHYSICS
- G01—MEASURING; TESTING
- G01N—INVESTIGATING OR ANALYSING MATERIALS BY DETERMINING THEIR CHEMICAL OR PHYSICAL PROPERTIES
- G01N15/00—Investigating characteristics of particles; Investigating permeability, pore-volume, or surface-area of porous materials
- G01N15/10—Investigating individual particles
- G01N15/14—Electro-optical investigation, e.g. flow cytometers
- G01N15/1429—Electro-optical investigation, e.g. flow cytometers using an analyser being characterised by its signal processing
-
- G01N15/01—
-
- G—PHYSICS
- G01—MEASURING; TESTING
- G01N—INVESTIGATING OR ANALYSING MATERIALS BY DETERMINING THEIR CHEMICAL OR PHYSICAL PROPERTIES
- G01N15/00—Investigating characteristics of particles; Investigating permeability, pore-volume, or surface-area of porous materials
- G01N15/10—Investigating individual particles
- G01N2015/1006—Investigating individual particles for cytology
-
- G—PHYSICS
- G01—MEASURING; TESTING
- G01N—INVESTIGATING OR ANALYSING MATERIALS BY DETERMINING THEIR CHEMICAL OR PHYSICAL PROPERTIES
- G01N15/00—Investigating characteristics of particles; Investigating permeability, pore-volume, or surface-area of porous materials
- G01N15/10—Investigating individual particles
- G01N15/14—Electro-optical investigation, e.g. flow cytometers
- G01N2015/1488—Methods for deciding
-
- G—PHYSICS
- G16—INFORMATION AND COMMUNICATION TECHNOLOGY [ICT] SPECIALLY ADAPTED FOR SPECIFIC APPLICATION FIELDS
- G16H—HEALTHCARE INFORMATICS, i.e. INFORMATION AND COMMUNICATION TECHNOLOGY [ICT] SPECIALLY ADAPTED FOR THE HANDLING OR PROCESSING OF MEDICAL OR HEALTHCARE DATA
- G16H10/00—ICT specially adapted for the handling or processing of patient-related medical or healthcare data
- G16H10/40—ICT specially adapted for the handling or processing of patient-related medical or healthcare data for data related to laboratory analysis, e.g. patient specimen analysis
Definitions
- the present invention relates to a cell analysis method and a cell analysis device.
- Patent Document 1 describes a method of analyzing data obtained by measuring blood cell cells with a flow cytometer in a data processing system equipped with a processor and classifying the cells according to the type. Patent Document 1 describes that when cells cannot be classified by optical information measured by a flow cytometer, information on cell volume and conductivity is further used.
- Patent Document 1 does not disclose a system capable of processing a significantly increased amount of information within the required processing capacity.
- the present invention in a configuration for analyzing data obtained from a plurality of cells contained in a sample, it is possible to satisfy the required processing capacity of cell data with a significantly increased amount of information. It is an object of the present invention to provide a cell analysis method and a cell analysis apparatus.
- the cell analysis method is a cell including a host processor (3001, 4831, 6001, 8111) and a parallel processing processor (3002, 4833, 6002, 8112).
- the analyzer (4000, 4000', 4000'')
- data about each of the plurality of cells in the sample is acquired under the control of the host processor (3001, 4831, 6001, 8111), and the parallel processing processor (3002). , 4833, 6002, 8112), including performing a parallel process on the data and generating information about the cell type for each of the plurality of cells based on the result of the parallel process.
- cells are measured by a measurement unit (400, 400a, 500, 500a, 700), and the measurement unit (400, 400a, 500,
- a parallel processing processor (3002, 4833, 6002, 8112) connected to the 500a, 700) without an internet or intranet performs parallel processing of data on cells based on the measurement, and based on the result of the parallel processing, Includes generating information about the cell type of the cell.
- the cell analysis method is a measurement unit (400, 400a, 500, 500a,) mounted on a cell analyzer (4000, 4000', 4000'').
- the sample is aspirated by 700), data on the cells in the aspirated sample is generated, and parallel processing on the data is performed by a parallel processing processor (3002) mounted on a cell analyzer (4000, 4000', 4000'').
- a parallel processing processor 3002 mounted on a cell analyzer (4000, 4000', 4000'').
- 4833, 6002, 8112 and generate information about the cell type of the cell based on the result of the parallel processing performed by the parallel processing processor (3002, 4833, 6002, 8112).
- the cell analyzer includes a measurement unit (400, 400a, 500, 500a, 700) for measuring a plurality of cells contained in a sample, and a plurality of cells.
- a processor (3001, 4831, 6001, 8111) for performing information processing related to analysis, a parallel processing processor (3002, 4833, 6002, 8112), and a measurement unit (400, 400a, 500, 500a, 700) are provided. Data on each of the plurality of cells is acquired, the parallel processing processor (3002, 4833, 6002, 8112) executes the parallel processing on the data, and the processor (3001, 4831, 6001, 8111) is the result of the parallel processing. Includes processing information about each cell type of a plurality of cells generated on the basis of.
- FIG. 1A shows an example of conventional leukocyte classification.
- FIG. 1 (b) shows an example of leukocyte classification of this method.
- FIG. 2A shows an example of irradiating cells flowing through a flow cell with light.
- FIG. 2B shows an example of sampling a forward scattered light signal, a side scattered light signal, and a fluorescent signal.
- FIG. 2C shows an example of waveform data obtained by sampling.
- FIG. 3 shows an example of a training data generation method.
- FIG. 4 shows an example of a label value.
- FIG. 5 shows an example of an analysis method of analytical data.
- FIG. 6 shows an example of the appearance of the cell analyzer.
- FIG. 7 shows an example of a block diagram of the measurement unit.
- FIG. 8 shows an example of a sample suction unit and a sample preparation unit.
- FIG. 9 shows a configuration example of the optical system of the FCM detection unit.
- FIG. 10 shows a configuration example of the processing unit.
- FIG. 11 shows a configuration example of a parallel processing processor.
- FIG. 12 shows an example of mounting a parallel processing processor in a measurement unit.
- FIG. 13 shows another implementation example of the parallel processing processor in the measurement unit.
- FIG. 14 shows another implementation example of the parallel processing processor in the measurement unit.
- FIG. 15 shows another implementation example of the parallel processing processor in the measurement unit.
- FIG. 16 shows an outline of an operation in which a processor executes arithmetic processing of matrix data using a parallel processing processor.
- FIG. 17A shows a formula for calculating the product of matrices.
- FIG. 17B shows an example of arithmetic processing executed in parallel by a parallel processing processor.
- FIG. 17A shows a formula for calculating the product of matrices.
- FIG. 17B shows an example of arithmetic processing executed in parallel by a parallel
- FIG. 18 shows how the arithmetic processing is executed by the parallel processing processor.
- FIG. 19A shows an example of waveform data of forward scattered light as waveform data input to the deep learning algorithm.
- FIG. 19B shows an outline of the matrix operation between the waveform data and the filter.
- FIG. 20 shows an example of a sample analysis operation by a cell analyzer.
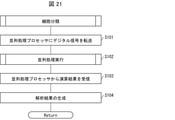
- FIG. 21 shows an example of a cell analysis process.
- FIG. 22 shows an example of parallel processing.
- FIG. 23 shows another example of the block diagram of the measurement unit.
- FIG. 24 shows an example of a block diagram of the processing unit.
- FIG. 25 shows an outline of an operation in which a processor executes arithmetic processing of matrix data using a parallel processing processor.
- FIG. 26 shows another example of the block diagram of the measurement unit.
- FIG. 27 shows another example of the block diagram of the processing unit.
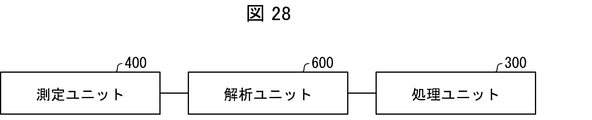
- FIG. 28 shows a configuration example of the measurement unit, the processing unit, and the analysis unit.
- FIG. 29 shows another example of the block diagram of the measurement unit.
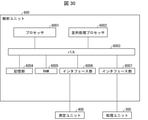
- FIG. 30 shows an example of a block diagram of the analysis unit.
- FIG. 31 shows an outline of an operation in which a processor executes arithmetic processing of matrix data using a parallel processing processor.
- FIG. 32 shows another example of the block diagram of the processing unit.
- FIG. 33 shows another example of the block diagram of the measurement unit.
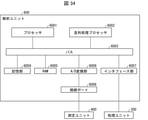
- FIG. 34 shows another example of the block diagram of the analysis unit.
- FIG. 35 shows an example of a block diagram of the measurement unit.
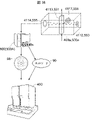
- FIG. 36 shows a schematic example of the optical system of the flow cytometer.
- FIG. 36 shows a schematic example of the optical system of the flow cytometer.
- FIG. 37 shows a schematic example of the sample preparation unit of the measurement unit.
- FIG. 38 shows a schematic example of a waveform data analysis system.
- FIG. 39 shows an example of a block diagram of the vendor side device.
- FIG. 40 shows an example of a block diagram of the measurement unit.
- FIG. 41 shows another example of the block diagram of the analysis unit.
- FIG. 42 shows an example of a functional block diagram of a deep learning device.
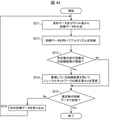
- FIG. 43 shows an example of a flowchart of the operation of the processing unit for generating training data.
- FIG. 44 shows a schematic diagram for explaining a neural network.
- FIG. 44A shows a schematic diagram showing an outline of the neural network.
- FIG. 44B shows a schematic diagram showing operations at each node.
- FIG. 44 (c) shows a schematic diagram showing operations between nodes.
- FIG. 44A shows a schematic diagram showing an outline of the neural network.
- FIG. 44B shows a schematic diagram showing operations at each node.
- FIG. 45 shows a mixed matrix of the determination result by the reference method and the determination result using the deep learning algorithm.
- FIG. 46 (a) shows the ROC curve of neutrophils.
- FIG. 46 (b) shows the ROC curve of lymphocytes.
- FIG. 46 (c) shows the ROC curve of a monocyte.
- FIG. 47 (a) shows the ROC curve of eosinophils.
- FIG. 47 (b) shows the ROC curve of basophils.
- FIG. 47 (c) shows the ROC curve of the ROC curve of the control blood (CONT).
- FIG. 48 shows a configuration example of a cell analyzer as an image analyzer.
- FIG. 49 shows a configuration example of the processing unit.
- FIG. 50 shows an example of a method of generating training data.
- FIG. 51 shows an example of a label value.
- FIG. 52 shows an example of an image analysis method.
- FIG. 53 shows an embodiment of the analysis result.
- a cell analyzer including a host processor and a parallel processing processor
- data regarding each of the cells is acquired based on control by the host processor
- parallel processing regarding the data is executed by the parallel processing processor.
- a cell analysis method comprising generating information about a cell type for each of the cells based on the results of the parallel treatment.
- processing related to cell data is performed by a parallel processing processor provided separately from the host processor. Can be executed in parallel. Therefore, for example, even when cells are classified by a deep learning algorithm using a huge amount of data, the data processing is completed only by the cell analyzer. For example, it is not necessary to send cell data to an analysis server that stores a deep learning algorithm via the Internet or an intranet. Therefore, according to this analysis method, it is not necessary to send a large amount of data from the cell analyzer to the analysis server and acquire the analysis result returned from the analysis server, while improving the cell classification accuracy. The processing capacity of the cell analyzer can be maintained.
- FIG. 1A is a diagram schematically showing the leukocyte classification of the conventional method
- FIG. 1B is a diagram schematically showing the leukocyte classification of the present method.
- FSC indicates an analog signal indicating the signal intensity of the forward scattered light
- SSC indicates an analog signal of the side scattered light
- SFL indicates the signal intensity of the side fluorescence. Shows an analog signal.
- FIG. 1 (a) in the conventional method, individual cells contained in a sample are measured with a flow cytometer, and the pulses of each analog signal of forward scattered light, side scattered light, and side fluorescence are measured.
- the peak height of is acquired as the forward scattered light intensity, the lateral scattered light intensity, and the lateral fluorescence intensity.
- the cells are classified into specific types based on the forward scattered light intensity, the lateral scattered light intensity, and the lateral fluorescence intensity.
- the result of classifying the cells is displayed as a scattergram as shown in FIG. 1 (a).
- the horizontal axis indicates the lateral scattered light
- the vertical axis indicates the intensity of the lateral fluorescence.
- FIG. 1 (a) the type of blood cell was determined based only on the information of the peak height of the analog waveform.
- FIG. 1 (b) the entire waveform of the analog signal acquired from one cell by the flow cytometer is analyzed. The cells are classified by analyzing as the data of.
- FIG. 1B shows a waveform obtained by drawing an analog signal obtained by a flow cytometer, but as will be described later, the data regarding the cells in the sample in the present embodiment A / D-convert the analog signal.
- This digital data group is matrix data, and in this embodiment, it is, for example, one-row and multiple-column matrix data (that is, one-dimensional array data).
- the pre-training deep learning algorithm 50 shown in FIG. 1 (b) is used to learn waveform data for each cell type. Then, by inputting the waveform data of the cell whose cell type is unknown contained in the sample into the trained deep learning algorithm 60, the determination result of the cell type is derived from the deep learning algorithm 60 for each cell.
- the deep learning algorithms 50 and 60 are one of the artificial intelligence algorithms, and are composed of a neural network including a multi-layered intermediate layer.
- a large amount of matrix operations included in the deep learning algorithm 60 are performed by using a parallel processing processor mounted on the cell analyzer. , Execute in parallel processing.
- the cell analyzer includes a parallel processing processor capable of executing parallel processing and an execution instruction processor (hereinafter, simply referred to as a processor) that causes the parallel processing processor to execute parallel processing.
- individual cells in a biological sample used for analysis for the purpose of determining the cell type are also referred to as "cells to be analyzed”.
- the biological sample may contain multiple cells to be analyzed.
- the plurality of cells may include a plurality of types of cells to be analyzed.
- the biological sample may contain, for example, peripheral blood such as venous blood, arterial blood, urine, blood and body fluids other than urine.
- peripheral blood such as venous blood, arterial blood, urine, blood and body fluids other than urine.
- Body fluids other than blood and urine may include spinal fluid, ascites, pleural effusion, cerebrospinal fluid and the like.
- body fluids other than blood and urine may be simply referred to as "body fluids”.
- the blood sample is not limited as long as the number of cells can be counted and the cell type can be determined.
- the blood is preferably peripheral blood.
- the blood may be peripheral blood collected using an anticoagulant such as ethylenediamine tetraacetate sodium salt or potassium salt) and heparin sodium.
- Peripheral blood may be taken from an artery or a vein.
- the cell type to be determined in this embodiment is based on the cell type based on the morphological classification, and differs depending on the type of the biological sample.
- the cell types to be determined in the present embodiment include, for example, erythrocytes, nucleated cells such as leukocytes, platelets and the like. Is included. Nucleated cells include, for example, neutrophils, lymphocytes, monocytes, eosinophils, basophils. Neutrophils include, for example, lobulated nucleus neutrophils and rod-shaped nucleus neutrophils.
- the nucleated cells may include, for example, at least one selected from the group consisting of immature granulocytes and abnormal cells. Such cells are also included in the cell type to be determined in this embodiment. Immature granulocytes can include, for example, cells such as metamyelocytes, myelocytes, promyelocytes, myeloblasts and the like.
- nucleated cells may contain abnormal cells that are not contained in the peripheral blood of a healthy person.
- abnormal cells are cells that appear when suffering from a given disease, such as tumor cells.
- certain diseases include, for example, myelodystrophy syndrome, acute myeloblastic leukemia, acute myeloblastic leukemia, acute premyelocytic leukemia, acute myelomonocytic leukemia, acute monocytic leukemia.
- Leukemia acute giant nuclear blast leukemia, acute myeloid leukemia, acute lymphocytic leukemia, lymphoblastic leukemia, chronic myeloid leukemia, or chronic lymphocytic leukemia, hodgkin lymphoma, non-hodgkin lymphoma, etc. It can be a disease selected from the group consisting of malignant lymphoma of leukemia and multiple myeloma.
- abnormal cells include, for example, lymphoblasts, plasma cells, atypical erythroblasts, reactive erythroblasts, pre-erythroblasts, basic erythroblasts, polychromatic erythroblasts, orthochromatic erythroblasts. , Pre-major erythroblasts, basic erythroblasts, polychromatic giant erythroblasts, and erythroblasts that are nucleated erythroblasts such as orthochromatic giant erythroblasts, and giant nuclei containing micromegacariosites. It may contain cells that are not normally found in the peripheral blood of healthy individuals such as erythroblasts.
- the cell type to be determined in the present embodiment may include, for example, erythrocytes, leukocytes, transitional epithelium, epithelial cells such as squamous epithelium and the like.
- the abnormal cells may include bacteria, filamentous fungi, fungi such as yeast, tumor cells and the like.
- the cell type may include, for example, red blood cells, leukocytes, and large cells.
- large cell refers to a cell detached from the peritoneum of the body cavity or the viscera, which is larger than a leukocyte, and corresponds to, for example, a mesothelial cell, a histiocyte, a tumor cell, or the like.
- the cell type to be determined in this embodiment may include mature blood cell cells and immature blood cell lineage cells as normal cells.
- Mature blood cell cells include, for example, erythrocytes, nucleated cells such as leukocytes, platelets and the like.
- Nucleated cells such as leukocytes include, for example, neutrophils, lymphocytes, plasma cells, monocytes, eosinophils, and basophils.
- Neutrophils include, for example, lobulated nucleus neutrophils and rod-shaped nucleus neutrophils.
- Immature hematopoietic cells include, for example, hematopoietic stem cells, immature granulocyte cells, immature lymphocytic cells, immature monocytic cells, immature erythrocyte cells, megakaryocytic cells, mesenchymal. Includes cells and the like.
- Immature granulocytes can include, for example, cells such as metamyelocytes, myelocytes, promyelocytes, myeloblasts and the like.
- Immature lymphocytic cells include, for example, lymphoblasts.
- Immature monoblastic cells include monoblasts and the like.
- Immature erythroblasts include, for example, pre-erythroblasts, basic erythroblasts, polychromatic erythroblasts, orthochromatic erythroblasts, pre-giant erythroblasts, basic giant erythroblasts, etc. Includes polychromatic giant erythroblasts and nucleated red blood cells such as orthochromatic giant erythroblasts. Megakaryocyte cells include, for example, megakaryoblasts and the like.
- Examples of the abnormal cells that can be contained in the bone marrow include the above-mentioned myeloid atypical syndrome, acute myeloblastic leukemia, acute myeloblastic leukemia, acute premyelocytic leukemia, acute myelomonocytic leukemia, and acute monosphere.
- Leukemias such as sexual leukemia, erythrocyte leukemia, acute giant nuclear blast leukemia, acute myeloid leukemia, acute lymphocytic leukemia, lymphoblastic leukemia, chronic myeloid leukemia, or chronic lymphocytic leukemia, hodgkin lymphoma, non-hodgkin
- malignant lymphoma such as lymphoma, hematopoietic tumor cells selected from the group consisting of multiple myeloma, and metastatic tumor cells of malignant tumors developed in organs other than bone marrow.
- FIG. 1 illustrates forward scattered light signals, side scattered light signals, and side fluorescent signals, which are optical signals obtained by irradiating cells flowing through a flow cell with light, as signals obtained from cells. , It is not particularly limited as long as it is a signal that represents the characteristics of cells and can classify cells by type.
- the signal obtained from the cell may be any of a signal representing the morphological characteristics of the cell, a signal representing the chemical characteristics, a signal representing the physical characteristics, and a signal representing the genetic characteristics, but the morphology of the cells is preferable. It is a signal that represents a scientific feature.
- the signal representing the morphological characteristics of the cell is preferably an optical signal obtained from the cell.
- the optical signal is preferably an optical signal obtained as an optical response by irradiating a cell with light.
- the optical signal may include at least one selected from a signal based on light scattering, a signal based on light absorption, a signal based on transmitted light, and a signal based on fluorescence.
- the signal based on light scattering may include a scattered light signal generated by light irradiation and a light loss signal generated by light irradiation.
- the scattered light signal becomes a different parameter indicating the characteristics of the cell depending on the light receiving angle of the scattered light with respect to the traveling direction of the irradiation light.
- the forward scattered light signal is used as a parameter representing the size of the cell.
- the laterally scattered light signal is used as a parameter to represent the complexity of the cell's nucleus.
- the "forward” of the forward scattered light is intended to be the traveling direction of the light emitted from the light source.
- the "forward” may include a front low angle where the light receiving angle is around 0 to 5 degrees and / or a front high angle where the light receiving angle is around 5 to 20 degrees when the angle of the irradiation light is 0 degrees.
- “Side” is not restricted as long as it does not overlap with “forward”.
- the “side” may include a light receiving angle of around 25 to 155 degrees, preferably around 45 to 135 degrees, and more preferably around 90 degrees, where the angle of the irradiation light is 0 degrees.
- a signal based on light scattering may include polarization or depolarization as a component of the signal. For example, by irradiating a cell with light and receiving the scattered light generated through the polarizing plate, it is possible to receive only the scattered light polarized at a specific angle. Further, by irradiating the cells with light through the polarizing plate and receiving the generated scattered light through the polarizing plate that transmits only the polarization at an angle different from that of the polarizing plate for irradiation, only the depolarized scattered light can be received. ..
- the light loss signal represents the loss amount of the light receiving amount based on the fact that the light receiving amount in the light receiving portion decreases due to the light being irradiated to the cells and scattered.
- the light loss signal is preferably obtained as a light loss (axial light loss) in the optical axis direction of the irradiation light.
- the light loss signal can be expressed as a ratio of the light receiving amount when the cell flows through the flow cell when the light receiving amount in the light receiving portion is 100% in a state where the cell does not flow through the flow cell.
- Axial light loss is used as a parameter indicating the size of a cell like the forward scattered light signal, but the signal obtained differs depending on whether the cell has translucency or not.
- the fluorescence-based signal may be fluorescence excited by irradiating cells labeled with a fluorescent substance with light, or autofluorescence generated from unstained cells.
- the fluorescent substance may be a fluorescent dye that binds to a nucleic acid or a membrane protein, or may be a labeled antibody obtained by modifying an antibody that binds to a specific protein of a cell with a fluorescent dye.
- the optical signal may be acquired in the form of image data obtained by irradiating the cells with light and imaging the irradiated cells.
- Image data can be obtained by imaging individual cells flowing through a flow path with an image sensor such as a TDI camera or a CCD camera using a so-called imaging flow cytometer.
- image data of cells may be obtained by applying a sample containing cells or a measurement sample on a slide glass, spraying or instilling the sample, and imaging the slide glass with an image pickup element.
- the signal obtained from the cell is not limited to the optical signal, but may be an electrical signal obtained from the cell.
- the electrical signal for example, a direct current may be applied to the flow cell, and the change in impedance caused by the cell flowing through the flow cell may be used as the electrical signal.
- the electrical signal thus obtained is a parameter that reflects the volume of the cell.
- the electrical signal may be a change in impedance when a radio frequency is applied to cells flowing through the flow cell as an electrical signal.
- the electrical signal thus obtained is a parameter that reflects the conductivity of the cell.
- the signal obtained from the cell may be a combination of at least two or more types of signals obtained from the above-mentioned cell.
- the combination may be, for example, a combination of at least two of a plurality of optical signals, such as a forward scattered light signal, a side scattered light signal, and a fluorescent signal, or a scattered light signal having a different angle, for example, a low angle scattered light signal.
- high angle scattered light signals may be combined.
- an optical signal and an electrical signal may be combined, and the type and number of the combined signals are not particularly limited.
- the determination of the cell type is not limited to the method using the deep learning algorithm. From individual cells passing through a predetermined position in the flow path, signal intensities are obtained for each cell at multiple time points while the cell is passing through the predetermined position, and a plurality of acquired individual cells are obtained.
- the cell type may be determined based on the result of recognizing the signal strength at the time point as a pattern.
- the pattern may be recognized as a numerical pattern of signal strength at a plurality of time points, or may be recognized as a shape pattern when the signal strength at a plurality of time points is plotted as a graph.
- the cell type can be determined by comparing the numerical pattern of the cell to be analyzed with the numerical pattern whose cell type is already known. For comparison between the numerical pattern of the cell to be analyzed and the numerical pattern of the control, for example, Spearman's rank correlation, z-score, or the like can be used.
- the cell type can be determined by comparing the graph-shaped pattern of the cell to be analyzed with the graph-shaped pattern for which the cell type is already known. For comparison between the graph shape pattern of the cell to be analyzed and the graph shape pattern whose cell type is already known, for example, geometric shape pattern matching may be used, or a feature data represented by SIFT Descriptor may be used. A scripter may be used.
- FIG. 2 is a schematic diagram for explaining the waveform data used in this analysis method.
- FIG. 2A when a sample containing cell C is flowed through the flow cell FC and the cells C flowing through the flow cell FC are irradiated with light, forward scattered light FSC is generated forward in the traveling direction of the light.
- lateral scattered light SSC and lateral fluorescent SFL are generated laterally with respect to the traveling direction of light.
- the forward scattered light is received by the first light receiving unit D1, and a signal corresponding to the amount of received light is output.
- the laterally scattered light is received by the second light receiving unit D2, and a signal corresponding to the amount of light received is output.
- the lateral fluorescence is received by the third light receiving unit D3, and a signal corresponding to the amount of received light is output.
- analog signals representing changes in the signal over time are output from the light receiving units D1 to D3.
- the analog signal corresponding to the forward scattered light is called “forward scattered light signal”
- the analog signal corresponding to the side scattered light is called “side scattered light signal”
- the analog signal corresponding to side fluorescence is called “fluorescent signal”.
- One pulse of each analog signal corresponds to one cell.
- FIG. 2B is a diagram schematically showing conversion to a digital signal by the A / D conversion unit.
- the level of the analog signal may be converted into a digital signal as it is, but if necessary, processing such as noise reduction, baseline correction, and normalization may be performed.
- the A / D conversion unit reaches a time when the level of the forward scattered light signal among the analog signals input from the light receiving units D1 to D3 reaches a level set as a predetermined threshold value.
- the forward scattered light signal, the side scattered light signal, and the fluorescent signal are sampled.
- the A / D converter has each at a predetermined sampling rate (for example, sampling of 1024 points at intervals of 10 nanoseconds, sampling of 128 points at intervals of 80 nanoseconds, sampling of 64 points at intervals of 160 nanoseconds, etc.). Sampling analog signals.
- FIG. 2C is a diagram schematically showing waveform data obtained by sampling.
- matrix data having a value digitally indicating an analog signal level at a plurality of time points as an element can be obtained.
- the A / D conversion unit generates a digital signal of forward scattered light, a digital signal of laterally scattered light, and a digital signal of lateral fluorescence corresponding to one cell.
- the A / D conversion is repeated until the number of digitally signalized cells reaches a predetermined number, or until a predetermined time elapses from the start of flowing the sample into the flow cell. As a result, as shown in FIG.
- a digital signal obtained by combining the waveform data of N cells contained in one sample can be obtained.
- the set is called a digital signal.
- Each waveform data generated by the A / D conversion unit may be given an index for identifying each cell.
- an integer from 1 to N is given in the order of the generated waveform data, and the waveform data of the forward scattered light, the waveform data of the side scattered light, and the waveform data of the side fluorescence obtained from the same cell are given. , Each is given the same index.
- Waveform data can be analyzed as a set to classify cell types.
- FIG. 3 is a schematic diagram showing an example of a training data generation method used for training a deep learning algorithm for determining a cell type.
- the training data 75 measures the sample with a flow cytometer, and the analog signal 70a of the forward scattered light (FSC), the analog signal 70b of the side scattered light (SSC), and the side fluorescence obtained for the cells contained in the sample. It is waveform data generated based on the analog signal 70c of (SFL). The method for acquiring waveform data is as described above.
- the training data 75 is, for example, a cell in which a sample is measured by a flow cytometer and the cells contained in the sample are analyzed based on a conventional scattergram, and as a result, it is determined that there is a high possibility of a specific cell type.
- Waveform data can be used.
- a blood sample is measured with a flow cytometer, and waveform data of forward scattered light, side scattered light, and fluorescence of individual cells contained in the sample are accumulated. Based on lateral scattered light intensity (pulse height of lateral scattered light signal) and fluorescence intensity (pulse height of fluorescent signal), cells are neutrophils, lymphocytes, monocytes, eosinophils, basophils.
- Training data can be obtained by assigning a label value corresponding to the classified cell type to the waveform data of the cell. For example, determine the mode, mean or median of lateral scattered light intensity and lateral fluorescence intensity of cells contained in a population of neutrophils, identify representative cells based on those values, and identify them. Training data can be obtained by assigning the label value "1" corresponding to the neutrophil to the waveform data of the cells of.
- the method of generating training data is not limited to this, for example, training is performed by collecting only specific cells with a cell sorter, measuring the cells with a flow cytometer, and assigning a cell label value to the obtained waveform data. Data may be obtained.
- the analog signals 70a, 70b, and 70c indicate a forward scattered light signal, a side scattered light signal, and a side fluorescence signal when the neutrophil is measured by the flow cytometer, respectively.
- waveform data 72a of the forward scattered light signal, waveform data 72b of the side scattered light signal, and waveform data 72c of the side fluorescent signal are obtained.
- Adjacent cells within each of the waveform data 72a, 72b, 72c store signal levels at intervals corresponding to the sampling rate, for example, at intervals of 10 nanoseconds.
- the waveform data 72a, 72b, 72c are combined with a label value 77 indicating the type of cell from which the data is based, and three waveform data corresponding to each cell, in other words, three signal intensities (forward scattered light signal).
- the data of intensity, signal intensity of laterally scattered light, and signal intensity of lateral fluorescence) are input to the deep learning algorithm 50 as training data 75 so as to be a set.
- the waveform data 72a, 72b, and 72c are given "1" as the label value 77 indicating that they are neutrophils, and the training data. 75 is generated.
- FIG. 4 shows an example of the label value 77. Since the training data 75 is generated for each cell type, the label value 77 is assigned differently depending on the cell type.
- the neural network 50 is preferably a convolutional neural network having a convolutional layer.
- the number of nodes of the input layer 50a in the neural network 50 corresponds to the number of elements of the array included in the waveform data of the input training data 75.
- the number of elements in the sequence is equal to the sum of the number of elements of the forward scattered light, the side scattered light, and the lateral fluorescence waveform data 72a, 72b, and 72c corresponding to one cell.
- the waveform data 72a, 72b, 72c are input to the input layer 50a of the neural network 50.
- the label value 77 of each waveform data of the training data 75 is input to the output layer 50b of the neural network to train the neural network 50.
- Reference numeral 50c in FIG. 3 indicates an intermediate layer.
- FIG. 5 shows an example of a method for analyzing waveform data of cells to be analyzed.
- the analog signal 80a of the forward scattered light, the analog signal 80b of the side scattered light, and the analog signal 80c of the side fluorescence obtained from the cells to be analyzed by the flow cytometer are obtained by the above method.
- the analysis data 85 composed of the waveform data to be generated is generated.
- the analysis data 85 and the training data 75 have at least the same acquisition conditions.
- the acquisition conditions are the conditions for measuring the cells contained in the sample with a flow cytometer, for example, the preparation conditions of the measurement sample, the flow velocity when the measurement sample is passed through the flow cell, the intensity of the light applied to the flow cell, the scattered light and the scattered light. Includes the amplification factor of the light receiving part that receives fluorescence.
- the acquisition condition further includes a sampling rate at the time of A / D conversion of the analog signal.
- an analog signal 80a for forward scattered light, an analog signal 80b for side scattered light, and an analog signal 80c for side fluorescence are obtained.
- these analog signals 80a, 80b, and 80c are A / D converted as described above, the time points at which the signal intensities are acquired are synchronized for each cell, and the waveform data 82a of the forward scattered light signal and the side scattered light signal are synchronized.
- the waveform data 82b and the waveform data 82c of the lateral fluorescence signal are obtained.
- the waveform data 82a, 82b, 82c are combined so that the data of the three signal intensities of each cell (the signal intensity of the forward scattered light, the signal intensity of the side scattered light, and the signal intensity of the side fluorescence) are set as a set. Then, it is input to the deep learning algorithm 60 as the analysis data 85.
- the analysis result 83 is output from the output layer 60b as classification information regarding the cell type corresponding to the analysis data 85.
- Reference numeral 60c in FIG. 5 indicates an intermediate layer.
- the classification information regarding a cell type is, for example, the probability that a cell belongs to each of a plurality of cell types. Further, it is determined that the cell to be analyzed for which the analysis data 85 has been acquired belongs to the classification having the highest value in this probability, and the label value 82 or the like, which is an identifier indicating the cell type, is included in the analysis result 83. You may.
- the analysis result 83 may be data in which the label value is replaced with information indicating the cell type (for example, a character string).
- the deep learning algorithm 60 outputs the label value “1” having the highest probability that the analysis target cell for which the analysis data 85 has been acquired belongs, and further, “1” corresponding to this label value is output.
- An example is shown in which the character data "neutrophil" is output as the analysis result 83.
- the label value may be output by the deep learning algorithm 60, but another computer program may output the most preferable label value based on the probability calculated by the deep learning algorithm 60.
- the cell waveform data of the present embodiment, or the analog signal of the cell that is the source thereof, can be acquired by the first cell analyzer 4000 or the second cell analyzer 4000'.
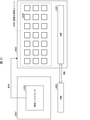
- FIG. 6A shows an example of the appearance of the cell analyzer 4000.
- FIG. 6B shows an example of the appearance of the cell analyzer 4000'.
- the cell analyzer 4000 controls the setting and measurement of the measurement conditions of the sample in the measurement unit 400 and the measurement unit 400, and analyzes the analysis result of the cell data by the deep learning algorithm 60.
- a processing unit 300 for this purpose is provided.
- the cell analyzer 4000 controls the setting and measurement of the measurement conditions of the sample in the measurement unit 500 and the measurement unit 500, and analyzes the analysis result of the cell data by the deep learning algorithm 60.
- a processing unit 300 is provided for this purpose.
- the measuring units 400 and 500 and the processing unit 300 may be connected by wire or wirelessly so as to be able to communicate with each other. Although the configuration examples of the measurement units 400 and 500 are shown below, the present embodiment is not limited to the following examples and is not interpreted.
- the processing unit 300 may be shared with the vendor-side device 100 described later.
- Measurement unit and processing unit configuration A configuration example will be described when the measurement unit 400 is a blood analyzer including an FCM detection unit which is a flow cytometer for detecting cells in a blood sample, and more specifically, a blood cell counter.
- FIG. 7 shows an example of a block diagram of the measurement unit 400.
- the measurement unit 400 includes an FCM detection unit 410 for detecting blood cells, an analog processing unit 420 for processing an analog signal output from the FCM detection unit 410, a measurement unit control unit 480, and a sample preparation unit 440.
- a device mechanism unit 430 and a sample suction unit 450 are provided.
- FIG. 8 is a schematic diagram for explaining the sample suction unit 450 and the sample preparation unit 440.
- the sample suction unit 450 includes a nozzle 451 for sucking a blood sample (whole blood) from the blood collection tube T, and a pump 452 for applying negative pressure / positive pressure to the nozzle.
- the nozzle 451 is inserted into the blood collection tube T by being moved up and down by the device mechanism unit 430.
- the device mechanism unit 430 may include a hand member that overturns and stirs the blood collection tube T before suctioning blood from the blood collection tube T.
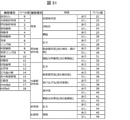
- the sample preparation unit 440 includes five reaction chambers 440a to 440e.
- the reaction chambers 440a to 440e are used in the DIFF, RET, WPC, PLT-F, and WNR measurement channels, respectively.
- a hemolytic agent container containing a hemolytic agent which is a reagent corresponding to each measurement channel
- a staining liquid container containing a staining liquid are connected via a flow path.
- a measurement channel is composed of one reaction chamber and reagents (hemolytic agent and stain solution) connected to the reaction chamber.
- the DIFF measurement channel is composed of a DIFF hemolytic agent and a DIFF stain, which are reagents for DIFF measurement, and a DIFF reaction chamber 440a.
- measurement channels are similarly configured. Although one measurement channel is illustrated here with one hemolyzing agent and one staining solution, one measurement channel does not necessarily have to include both the hemolyzing agent and the staining solution, and a plurality of measurement channels may be provided. One reagent may be shared by the measurement channel.
- the nozzle 451 that sucks the blood sample accesses the reaction chamber corresponding to the measurement channel corresponding to the order from above in the reaction chambers 440a to 440e by moving horizontally and vertically by the device mechanism unit 430, and sucks the blood sample. Discharge.
- the sample preparation unit 440 supplies the corresponding hemolytic agent and staining solution to the reaction chamber into which the blood sample is discharged, and prepares the measurement sample by mixing the blood sample, the hemolytic agent, and the staining solution in the reaction chamber.
- the prepared measurement sample is supplied to the FCM detection unit 410 from the reaction chamber via the flow path, and the cells are measured by the flow cytometry method.
- FIG. 9 shows a configuration example of the optical system of the FCM detection unit 410.
- the light source 4111 irradiates the flow cell 4113 with light when the cells contained in the measurement sample pass through the flow cell (sheath flow cell) 4113 provided in the flow cytometer. Then, the scattered light and fluorescence emitted from the cells in the flow cell 4113 by this light are detected.
- the light emitted from the laser diode which is the light source 4111, is applied to the cells passing through the flow cell 4113 via the irradiation lens system 4112.
- the light source 4111 of the flow cytometer is not particularly limited, and a light source 4111 having a wavelength suitable for exciting the fluorescent dye is selected.
- a light source 4111 for example, a semiconductor laser light source including a red semiconductor laser light source and / or a blue semiconductor laser light source, an argon laser light source, a gas laser light source such as a helium-neon laser, a mercury arclamp, and the like are used.
- a semiconductor laser light source is suitable because it is much cheaper than a gas laser light source.
- the forward scattered light emitted from the particles passing through the flow cell 4113 is received by the forward scattered light receiving element 4116 via the condenser lens 4114 and the pinhole portion 4115.
- the forward scattered light receiving element 4116 is a photodiode.
- the side scattered light is received by the side scattered light receiving element 4121 via the condenser lens 4117, the dichroic mirror 4118, the bandpass filter 4119, and the pinhole portion 4120.
- the side scattered light receiving element 4121 is a photodiode.
- the lateral fluorescence is received by the lateral fluorescence light receiving element 4122 via the condenser lens 4117 and the dichroic mirror 4118.
- the side fluorescence light receiving element 4122 is an avalanche photodiode.
- a photomultiplier tube may be used as the forward scattered light receiving element 4116, the side scattered light receiving element 4121, and the side fluorescent light receiving element 4122.
- the light receiving signals output from the light receiving elements 4116, 4121 and 4122 are input to the analog processing unit 420 via the amplifiers 4151, 4152 and 4153, respectively.
- the analog processing unit 420 performs processing such as noise removal and smoothing on the analog signal input from the FCM detection unit 410, and transfers the processed analog signal to the measurement unit control unit 480. Output.
- the measurement unit control unit 480 includes an A / D conversion unit 482, a processor 4831, a RAM 4834, a storage unit 4835, a bus controller 4850, a parallel processing processor 4833, and an interface unit 489 connected to the processing unit 300. ing. Further, the measurement unit control unit 480 includes an interface unit 484 interposed between the A / D conversion unit 482 and an interface unit 488 interposed between the device mechanism unit 430. As shown in FIG. 7, in this configuration example, the parallel processing processor 4833 is mounted on the cell analyzer 4000 in a form incorporated inside the measurement unit 400.
- the processor 4831 is connected to the interface unit 489, the interface unit 488, the interface unit 484, the RAM 4834, and the storage unit 4835 via the bus 485.
- the processor 4831 is connected to the parallel processing processor 4833 via the bus 485.
- the processing unit 300 is connected to each unit of the measurement unit 400 via the interface unit 489 and the bus 485.
- the bus 485 is, for example, a transmission line having a data transfer speed of several hundred MB / s or more.
- the bus 485 may be configured by, for example, a transmission line having a data transfer rate of 1 GB / s or more.
- the bus 485 transfers data based on, for example, the PCI-Express or the PCI-X standard.
- the A / D conversion unit 482 converts the analog signal output from the analog processing unit 420 into a digital signal.
- the A / D conversion unit 482 converts an analog signal from the start of measurement of the sample to the end of measurement into a digital signal.
- the A / D conversion unit 482 performs each. Converts the analog signal from the start of measurement to the end of measurement into a digital signal.
- the A / D conversion unit 482 for example, as described with reference to FIG.
- three types of analog signals correspond to a plurality of corresponding analog signals. It is input via the signal transmission path 421.
- the A / D conversion unit 482 converts each of the analog signals input from the plurality of signal transmission paths 421 into digital signals.
- Each signal transmission path 421 is configured to transmit, for example, an analog signal as a differential signal.
- the A / D conversion unit 482 has a predetermined sampling rate (for example, sampling of 1024 points at intervals of 10 nanoseconds, sampling of 128 points at intervals of 80 nanoseconds, or sampling of 160 nanoseconds).
- the analog signal is sampled at intervals (sampling of 64 points, etc.).
- the A / D conversion unit 482 performs sampling processing on three types of analog signals corresponding to each cell, and for each cell, the waveform data of the forward scattered light signal, the waveform data of the side scattered light signal, and the fluorescence. Generates signal waveform data.
- the A / D conversion unit 482 assigns an index to each of the generated waveform data. As shown in FIG.
- the generated waveform data becomes a digital signal in which waveform data of N cells contained in one sample can be continuously formed.
- three digital signals corresponding to three types of analog signals (forward scattered light signal, side scattered light signal and fluorescent signal) obtained from N cells are generated.
- the A / D conversion unit 482 may calculate the peak value from the pulse of the analog signal in addition to generating the waveform data from the analog signal.
- the A / D conversion unit 482 inputs the generated digital signal to the bus 485.
- the bus controller 4850 transmits the digital signal output from the A / D conversion unit 482 to the RAM 4834 by, for example, DMA (Direct Memory Access) transfer.
- the RAM 4834 stores a digital signal.
- the processor 4831 uses the parallel processing processor 4833 to perform analysis processing of the waveform data included in the generated digital signal according to the deep learning algorithm 60. That is, the processor 4831 is programmed to execute the analysis processing of the waveform data included in the digital signal according to the deep learning algorithm 60.
- the analysis software 4832 for analyzing cell data based on the deep learning algorithm 60 may be stored in the storage unit 4835. In this case, the processor 4831 executes the data analysis process based on the deep learning algorithm 60 by executing the analysis software 4832 stored in the storage unit 4835.
- the processor 4831 is, for example, a CPU (Central Processing Unit).
- the processor 4831 is, for example, Core i9, Core i7, Core i5 manufactured by Intel, Ryzen 9, Ryzen manufactured by AMD. 7, Ryzen 5, Ryzen 3 and the like may be used.
- the processor 4831 controls the parallel processing processor 4833.
- the parallel processing processor 4833 executes, for example, parallel processing related to matrix operations according to the control of the processor 4831. That is, the processor 4831 is the master processor of the parallel processing processor 4833, and the parallel processing processor 4833 is a slave processor of the processor 4831.
- Processor 4831 is also referred to as a host processor or main processor.
- the parallel processing processor 4833 executes a plurality of arithmetic processes in parallel, which are at least a part of the processes related to the analysis of waveform data.
- the parallel processing processor 4833 is, for example, a GPU (Graphics Processing Unit), an FPGA (Field Programmable Gate Array), or an ASIC (Application Specific Integrated Circuit).
- the parallel processing processor 4833 may be pre-programmed with arithmetic processing related to the trained deep learning algorithm 60, for example.
- the parallel processing processor 4833 is an ASIC
- the parallel processing processor 4833 may, for example, preliminarily incorporate a circuit for executing arithmetic processing related to the trained deep learning algorithm 60, or may be incorporated in such an embedded circuit.
- a programmable module may be built-in.
- the parallel processing processor 4833 for example, GeForce, Quadro, TITAN, Jetson or the like manufactured by NVIDIA may be used.
- Jetson series for example, Jetson Nano, Jetson Tx2, Jetson Xavier, and Jetson AGX Xavier are used.
- the processor 4831 executes, for example, a calculation process related to the control of the measurement unit 400.
- the processor 4831 executes, for example, a calculation process relating to a control signal transmitted / received between the device mechanism unit 430, the sample preparation unit 440, and the sample suction unit 450.
- the processor 4831 executes, for example, a calculation process related to transmission / reception of information to / from the processing unit 300.
- the processor 4831 executes, for example, reading program data from the storage unit 4835, expanding the program to the RAM 4834, and transmitting / receiving data to / from the RAM 4834.
- Each of the above-mentioned processes executed by the processor 4831 is required to be executed in a predetermined order, for example.
- the processes required for controlling the device mechanism unit 430, the sample preparation unit 440, and the sample suction unit 450 are A, B, and C, it may be required to execute B, A, and C in this order. Since the processor 4831 often executes continuous processing depending on such an order, even if the number of arithmetic units (sometimes referred to as "processor core”, “core”, etc.) is increased, the processing is not necessarily performed. It doesn't increase the speed.
- the parallel processing processor 4833 executes a large amount of routine calculation processing such as an operation of matrix data including a large amount of elements.
- the parallel processing processor 4833 executes parallel processing in which at least a part of the processing for analyzing waveform data according to the deep learning algorithm 60 is parallelized.
- the deep learning algorithm 60 includes, for example, a large number of matrix operations.
- the deep learning algorithm 60 may include, for example, at least 100 matrix operations and may also include at least 1000 matrix operations.
- the parallel processing processor 4833 has a plurality of arithmetic units, and each of these arithmetic units can execute a matrix operation at the same time.
- the parallel processing processor 4833 can execute the matrix operation by each of the plurality of arithmetic units in parallel as the parallel processing.
- the matrix operation included in the deep learning algorithm 60 can be divided into a plurality of arithmetic processes that are not order-dependent from each other.
- the arithmetic processing divided in this way can be executed in parallel by each of the plurality of arithmetic units.
- These arithmetic units may be referred to as a "processor core", a "core”, or the like.
- SIMD Single Instruction Multiple Data
- the parallel processing processor 4833 is suitable for such SIMD operation, for example.
- Such a parallel processing processor 4833 may be referred to as a vector processor.
- the processor 4831 is suitable for executing various and complicated processes.
- the parallel processing processor 4833 is suitable for executing a large amount of stylized processing in parallel. By executing a large number of stylized processes in parallel, the TAT (Turn Around Time) required for the calculation process is shortened.
- the target of parallel processing executed by the parallel processing processor 4833 is not limited to matrix operations.
- the parallel processing processor 4833 executes the learning processing according to the deep learning algorithm 50
- the differential calculation or the like related to the learning processing may be the target of the parallel processing.
- the number of arithmetic units of the processor 4831 is, for example, dual cores (number of cores: 2), quad cores (number of cores: 4), and octacores (number of cores: 8).
- the parallel processing processor 4833 has, for example, at least 10 arithmetic units (number of cores: 10), and can execute 10 matrix operations in parallel.
- the parallel processing processor 4833 may have, for example, dozens of arithmetic units.
- the parallel processing processor 4833 may have, for example, at least 100 arithmetic units (number of cores: 100) and can execute 100 matrix operations in parallel.
- the parallel processing processor 4833 may have, for example, hundreds of arithmetic units.
- the parallel processing processor 4833 may have, for example, at least 1000 arithmetic units (number of cores: 1000) and can execute 1000 matrix operations in parallel.
- the parallel processing processor 4833 may have, for example, thousands of arithmetic units.
- FIG. 11 shows a configuration example of the parallel processing processor 4833.
- the parallel processing processor 4833 includes a plurality of arithmetic units 4836 and a RAM 4837. Each of the arithmetic units 4836 executes arithmetic processing of matrix data in parallel.
- the RAM 4837 stores data related to arithmetic processing executed by the arithmetic unit 4836.
- the RAM 4837 is a memory having a capacity of at least 1 gigabyte.
- the RAM 4837 may be a memory having a capacity of 2 gigabytes, 4 gigabytes, 6 gigabytes, 8 gigabytes, or 10 gigabytes or more.
- the arithmetic unit 4836 acquires data from the RAM 4837 and executes arithmetic processing.
- the arithmetic unit 4836 may be referred to as a "processor core", a "core”, or the like.
- FIGS. 12 to 14 show an example of mounting the parallel processing processor 4833 on the measurement unit 400.
- 12 to 14 show an example in which the parallel processing processor 4833 is mounted on the cell analyzer 4000 in a form of being incorporated inside the measurement unit 400.
- 12 and 13 show a mounting example in which the processor 4831 and the parallel processing processor 4833 are provided as separate bodies.
- the processor 4831 is mounted on the substrate 4838, for example.
- the parallel processing processor 4833 is mounted on the graphic board 4830, for example, and the graphic board 4830 is connected to the board 4838 via the connector 4839.
- the processor 4831 is connected to the parallel processing processor 4833 via the bus 485.
- FIG. 12 to 14 show an example in which the parallel processing processor 4833 is mounted on the cell analyzer 4000 in a form of being incorporated inside the measurement unit 400.
- 12 and 13 show a mounting example in which the processor 4831 and the parallel processing processor 4833 are provided as separate bodies.
- the processor 4831 is mounted on the substrate 4838, for example.
- the parallel processing processor 4833 may be mounted directly on the substrate 4838 and connected to the processor 4831 via the bus 485, for example.
- FIG. 14 shows a mounting example in which the processor 4831 and the parallel processing processor 4833 are integrally provided. As shown in FIG. 14, the parallel processing processor 4833 may be built in, for example, the processor 4831 mounted on the board 4838.
- FIG. 15 shows another example of mounting the parallel processing processor 4833 on the measurement unit 400.
- FIG. 15 shows an example in which a parallel processing processor 4833 is mounted on the measurement unit 400 by an external device 4800 connected to the measurement unit 400.
- the parallel processing processor 4833 is mounted on, for example, an external device 4800 which is a USB (Universal Serial Bus) device, and the USB device is connected to the bus 485 via the interface unit 487 so that the parallel processing processor 4833 becomes a cell. It is mounted on the analyzer 4000.
- the USB device may be a small device such as a USB dongle.
- the interface unit 487 is, for example, a USB interface having a transfer rate of several hundred Mbps, and more preferably a USB interface having a transfer rate of several Gbps to several tens of Gbps or more.
- a Neural Compute Stick 2 manufactured by Intel may be used as the external device 4800 on which the parallel processing processor 4833 is mounted.
- a plurality of parallel processing processors 4833 may be mounted on the cell analyzer 4000. Since the number of arithmetic units 4836 in the parallel processing processor 4833 mounted on one USB device may be smaller than that of the GPU or the like, the number of cores can be increased by adding a plurality of USB devices connected to the measurement unit 400. It is possible to scale up.
- FIGS. 16, 17 and 18 show an outline of arithmetic processing executed by the parallel processing processor 4833 under the control of the analysis software 4832 running on the processor 4831.
- FIG. 16 shows a configuration example of a parallel processing processor 4833 that executes arithmetic processing.
- the parallel processing processor 4833 has a plurality of arithmetic units 4836 and RAM 4837.
- the processor 4831 that executes the analysis software 4832 can instruct the parallel processing processor 4833 to execute at least a part of the arithmetic processing required for analyzing the waveform data by the deep learning algorithm 60 on the parallel processing processor 4833.
- the processor 4831 instructs the parallel processing processor 4833 to execute arithmetic processing related to waveform data analysis based on the deep learning algorithm.
- All or at least a part of the waveform data corresponding to the signal detected by the FCM detection unit 410 is stored in the RAM 4834.
- the data stored in the RAM 4834 is transferred to the RAM 4837 of the parallel processing processor 4833.
- the data stored in the RAM 4834 is transferred to the RAM 4738 by, for example, a DMA (Direct Memory Access) method.
- Each of the plurality of arithmetic units 4836 of the parallel processing processor 4833 executes arithmetic processing on the data stored in the RAM 4837 in parallel.
- Each of the plurality of arithmetic units 4836 acquires necessary data from the RAM 4837 and executes arithmetic processing.
- the data corresponding to the calculation result is stored in the RAM 4837 of the parallel processing processor 4833.
- the data corresponding to the calculation result is transferred from RAM 4837 to RAM 4834, for example, by the DMA method.
- FIG. 17 shows an outline of the matrix operation executed by the parallel processing processor 4833.
- the parallel processing processor 4833 executes a plurality of arithmetic processings related to matrix operations in parallel.
- FIG. 17A shows a formula for calculating the product of matrices.
- the matrix c is obtained by the product of the matrix a of n rows and n columns and the matrix b of n rows and n columns.
- the formula is described in a multi-layered loop syntax.
- FIG. 17B shows an example of arithmetic processing executed in parallel by the parallel processing processor 4833.
- the calculation formula illustrated in FIG. 17A is divided into n ⁇ n arithmetic processes, which is the number of combinations of the loop variable i in the first layer and the loop variable j in the second layer, for example. Can be done. Since each of the arithmetic processes divided in this way is an arithmetic process that does not depend on each other, they can be executed in parallel.
- FIG. 18 is a conceptual diagram showing that a plurality of arithmetic processes exemplified in FIG. 17 (b) are executed in parallel by the parallel processing processor 4833.
- each of the plurality of arithmetic processes is assigned to any of the plurality of arithmetic units 4836 included in the parallel processing processor 4833.
- Each of the arithmetic units 4836 executes the assigned arithmetic processing in parallel with each other. That is, each of the arithmetic units 4836 simultaneously executes the divided arithmetic processing.
- the parallel processing processor 4833 By the calculation by the parallel processing processor 4833 exemplified in FIGS. 17 and 18, for example, information regarding the probability that the cell corresponding to the waveform data belongs to each of a plurality of cell types is obtained. Based on the result of the calculation, the processor 4831 that executes the analysis software 4832 analyzes the cell type of the cell corresponding to the waveform data. The calculation result is stored in the RAM 4837 of the parallel processing processor 4833, and is transferred from the RAM 4738 to the RAM 4834. The processor 4831 transmits the analysis result based on the calculation result stored in the RAM 4834 to the processing unit 300 via the bus 485 and the interface unit 489.
- the calculation of the probability that a cell belongs to each of a plurality of cell types may be performed by a processor other than the parallel processing processor 4833.
- the calculation result by the parallel processing processor 4833 is transferred from the RAM 4738 to the RAM 4834, and the processor 4831 relates to the probability that the cell corresponding to each waveform data belongs to each of the plurality of cell types based on the calculation result read from the RAM 4834. Information may be calculated.
- the calculation result by the parallel processing processor 4833 is transferred from the RAM 4738 to the processing unit 300, and the processor mounted on the processing unit 300 provides information on the probability that the cells corresponding to the respective waveform data belong to each of the plurality of cell types. You may calculate.
- the processes shown in FIGS. 17 and 18 are applied to, for example, arithmetic processing (also referred to as filter processing) related to the convolution layer in the deep learning algorithm 60.
- arithmetic processing also referred to as filter processing
- FIG. 19 shows an outline of the arithmetic processing related to the convolution layer.
- FIG. 19A shows an example of waveform data of forward scattered light (FSC) as waveform data input to the deep learning algorithm 60.
- the waveform data of this embodiment is one-dimensional matrix data as shown in FIG.
- waveform data is an array of elements arranged in a row.
- the number of elements of the waveform data is n (n is an integer of 1 or more).
- a a plurality of filters are shown. The filter is generated by the learning process of the deep learning algorithm 50.
- Each of the plurality of filters is one-dimensional matrix data representing the characteristics of the waveform data.
- the filter shown in (a) is matrix data of 1 row and 3 columns, but the number of columns is not limited to 3.
- FIG. 19B shows an outline of the matrix operation between the waveform data and the filter.
- the matrix operation is executed while shifting each filter by one for each element of the waveform data.
- the calculation of the matrix operation is executed by the following equation 1.
- the subscript of x is a variable indicating the row number and column number of the waveform data.
- the subscript of h is a variable indicating the row number and the column number of the filter.
- the parallel processing processor 4833 executes the matrix operation represented by the equation 1 in parallel by each of the plurality of calculation units 4836. Classification information regarding the cell type of each cell is generated based on the arithmetic processing executed by the parallel processing processor 4833. The generated classification information is transmitted to the processing unit 300 used for generating and displaying the test result of the sample based on the classification information.
- the measurement unit 400 can process the waveform data and the identification information in association with each other. Specifically, the measurement unit 400 can generate the analysis result of the waveform data (that is, the classification information regarding the cell type of each cell) in association with the identification information. For example, the measurement unit 400 associates the classification information and the identification information regarding the cell type of each cell and transmits them to the processing unit 300.
- the identification information includes, for example, (1) identification information of a biological sample corresponding to waveform data, (2) identification information of cells corresponding to waveform data (for example, the index described above), and (3) identification of a patient corresponding to waveform data.
- identification information of the biological sample corresponding to the waveform data includes information on the time when the measurement order for the biological sample is registered, information on the time when the analyzer identifies the biological sample, and the analyzer measures the biological sample.
- information to identify whether the biological sample is an emergency sample or a normal sample and information to identify whether the biological sample is a remeasurement or a new measurement. May contain information.
- the measurement unit 400 receives an inspection order from the LIS (Laboratory Information System) or the processing unit 300, for example, at least one of the above identification information (1) to (6) or one of them is received from the LIS or the processing unit 300. You can get the combination.
- at least one of the illustrated (1) to (6) is transmitted to the processing unit 300 in association with the classification information, and is provided to the user as an inspection result via the processing unit 300.
- the plurality of combinations of (1) to (6) exemplified may be transmitted to the processing unit 300 in association with the classification information.
- the measurement unit 400 can also generate, for example, at least one of the above identification information (1) to (6) or a combination thereof.
- the processing unit 300 may perform the correspondence between the waveform data and the identification information (at least one of the above (1) to (6) or a combination thereof).
- the processing unit 300 acquires, for example, identification information of a biological sample and identification information of a patient when receiving a test order from LIS.
- the processing unit 300 instructs the measurement unit 400 to perform the measurement corresponding to the inspection order.
- the processing unit 300 acquires the result (that is, waveform data) corresponding to the measurement instruction from the measurement unit 400
- the processing unit 300 associates the result (that is, the waveform data) with the identification information.
- the processing unit 300 is connected to the processor 4831 via the interface unit 489 and the bus 485, and can receive the analysis result by the processor 4831 and the parallel processing processor 4833.
- the interface unit 489 is, for example, a USB interface.
- FIG. 10 is a diagram showing the configuration of the processing unit 300.
- the processing unit 300 includes a processor 3001, a bus 3003, a storage unit 3004, an interface unit 3006, a display unit 3015, and an operation unit 3016.
- the processing unit 300 is configured by a personal computer that is general in terms of hardware, and functions as a processing unit of the cell analyzer 4000 by executing a dedicated program stored in the storage unit 3004.
- the processor 3001 is a CPU and can execute a program stored in the storage unit 3004.
- the storage unit 3004 includes a hard disk device.
- the storage unit 3004 stores at least a program 60 for processing cell classification information transmitted from the measurement unit 400 and generating a test result of a sample.
- the test result of the sample means the result of counting the blood cells contained in the sample based on the analysis result 83 of the classification information 82 of the individual cells obtained by the measurement unit 400.
- the display unit 3015 includes a computer screen.
- the display unit 3015 is connected to the processor 3001 via the interface unit 3006 and the bus 3003.
- the display unit 3015 can receive the image signal input from the processor 3001 and display the analysis result 83 received from the measurement unit 400 and the inspection result obtained by the processor 3001 analyzing the analysis result 83.
- the operation unit 3016 includes a pointing device including a keyboard, a mouse, or a touch panel.
- a user such as a doctor or a laboratory engineer can input a measurement order to the cell analyzer 4000 and input a measurement instruction according to the measurement order.
- the operation unit 3016 can also receive an instruction to display the inspection result from the user.
- the user can operate the operation unit 3016 to browse various information regarding the test result, for example, graphs, charts, and flag information given to the sample.
- the above-mentioned measurement unit 400 is connected to the processing unit 300 via the interface unit 3006.
- the processor 4831 of the measurement unit 400 can transmit the classification information of individual cells generated by the deep learning algorithm 60 to the processor 3001 of the processing unit 300 in association with the identification information of the sample.
- the processor 3001 stores the cell analysis result 83 received from the measurement unit 400 in the storage unit 3004 in association with the identification information of the sample.
- the processor 3001 of the processing unit 300 receives a measurement order and a measurement instruction from the user via the operation unit 3016, the processor 3001 transmits a measurement command to the measurement unit 400 (step S1).
- the processor 4831 of the measurement unit 400 Upon receiving the measurement command, the processor 4831 of the measurement unit 400 starts the measurement of the sample.
- the processor 4831 causes the sample suction unit 450 to suck the sample from the blood collection tube T (step S10).
- the processor 4831 causes the sample suction unit 450 to dispense the sucked sample into any of the reaction chambers 440a to 440e of the sample preparation unit 440.
- the measurement command transmitted from the processing unit 300 in step S1 includes information on the measurement channel for which measurement is requested by the measurement order.
- the processor 4831 controls the sample suction unit 450 to discharge the sample into the reaction chamber of the corresponding measurement channel based on the information of the measurement channel included in the measurement command.
- the processor 4831 causes the sample preparation unit 440 to prepare a measurement sample (step S11). Specifically, the sample preparation unit 440 receives a command from the processor 4831, supplies a reagent (hemolytic agent and a staining solution) to the reaction chamber into which the sample is discharged, and mixes the sample and the reagent. This prepares a measurement sample in which the erythrocytes are hemolyzed with a hemolytic agent and the cells targeted by the measurement channel, such as leukocytes and reticulocytes, are stained by staining in the reaction chamber.
- a reagent hemolytic agent and a staining solution
- the processor 4831 causes the FCM detection unit 410 to measure the prepared measurement sample (step S12). Specifically, the processor 4831 controls the device mechanism unit 430 to send the measurement sample in the reaction chamber of the sample preparation unit 440 to the FCM detection unit 410.
- the reaction chamber and the FCM detection unit 410 are connected by a flow path, and the measurement sample sent from the reaction chamber flows through the flow cell 4113 and is irradiated with laser light by the light source 4111 (see FIG. 9).
- the cells contained in the measurement sample pass through the flow cell 4113, the cells are irradiated with light, and the forward scattered light, the side scattered light, and the side fluorescence generated from the cells are detected by the light receiving elements 4116, 4121, and 4122, respectively.
- An analog signal corresponding to the light receiving intensity is output.
- the analog signal is output to the A / D conversion unit 482 via the analog processing unit 420.
- the A / D conversion unit 482 generates a digital signal including waveform data of individual cells by sampling an analog signal at a predetermined rate (step S13).
- the method of generating the waveform data and the digital signal is as described above.
- the processor 4831 takes in the digital signal generated by the A / D conversion unit 482 into the RAM 4834.
- the processor 4831 controls the bus controller 4850, and the digital signal generated by the A / D conversion unit 482 is taken into the RAM 4834 by DMA transfer. By DMA transfer, the digital signal is transferred directly to RAM 4834 without going through the processor 4831.
- the processor 4831 captures the digital signal of the forward scattered light signal, the digital signal of the side scattered light, and the digital signal of the fluorescent signal acquired from the cells contained in the sample to be inspected into the RAM 4834.
- the digital signal is stored in the RAM 4834.
- the processor 4831 uses the deep learning algorithm 60 to execute cell classification based on the waveform data included in the generated digital signal (step S14). The processing of S14 will be described later.
- the processor 4831 transmits the analysis result 83 including the classification information 82 of the individual cells obtained as a result of S14 to the processing unit 300 in association with the identification information of the sample (step S15).
- the analysis result 83 for example, the analysis result 83 of a plurality of cells contained in one sample is associated with the identification information of the sample and sent to the processing unit 300.
- the processor 3001 of the processing unit 300 receives the analysis result 83 from the measurement unit (step S2), the processor 3001 analyzes the analysis result 83 using the program stored in the storage unit 3004 and generates the test result of the sample (step S3). ).
- the processor 3001 acquires the counting result regarding the measurement item according to the measurement channel based on the analysis result 83, and stores it in the storage unit 3004 together with the identification information of the sample.
- the measurement item according to the measurement channel is an item for which the counting result is required by the measurement order.
- the measurement item according to the DIFF channel is the number of leukocyte 5 classifications, that is, monocytes, neutrophils, lymphocytes, eosinophils, and basophils.
- the measurement item according to the RET channel is the number of reticulocytes.
- the measurement item according to PLT-F is the number of platelets.
- the measurement item according to WPC is the number of hematopoietic progenitor cells.
- the measurement item according to WNR is the number of leukocytes and nucleated red blood cells.
- the counting result is not limited to the items for which measurement is required (also referred to as a reportable item) as listed above, and may include counting results of other cells that can be measured by the same measurement channel. For example, if the measurement channel is DIFF, as shown in FIG. 4, in addition to the leukocyte 5 classification, immature granulocytes (IG) and abnormal cells are also included in the counting results. Further, the processor 3001 generates a sample test result by analyzing the obtained counting result and stores it in the storage unit 3004. The analysis of the counting result includes, for example, determining whether the counting result is within the normal value range, no abnormal cells are detected, and whether the deviation from the previous test result is within the allowable range.
- the processor 3001 displays the generated inspection result on the display unit 3015 (step S4).
- the cell classification process in step S14 is a process performed by the processor 4831 according to the operation of the analysis software 4832.
- the processor 4831 transfers the digital signal captured in the RAM 4834 in step S13 to the parallel processing processor 4833 (S101). As shown in FIG. 16, processor 4831 transfers a digital signal from RAM 4834 to RAM 4837 by DMA transfer.
- the processor 4831 controls, for example, the bus controller 4850 to transfer a digital signal from the RAM 4834 to the RAM 4738 by DMA.
- the processor 4831 instructs the parallel processing processor 4833 to execute parallel processing on the waveform data included in the digital signal (S102).
- the processor 4831 instructs the execution of the parallel processing, for example, by calling the kernel function of the parallel processing processor 4833.
- the processing executed by the parallel processing processor 4833 will be described later in the flowchart illustrated in FIG.
- the processor 4831 instructs the parallel processing processor 4833 to execute the matrix operation related to the deep learning algorithm 60, for example.
- the digital signal is decomposed into a plurality of waveform data and sequentially input to the deep learning algorithm 60.
- the index corresponding to each cell contained in the digital signal is not input to the deep learning algorithm 60.
- the waveform data input to the deep learning algorithm 60 is calculated by the parallel processing processor 4833.
- Processor 4831 receives the calculation result executed by the parallel processing processor 4833 (S103).
- the calculation result is DMA-transferred from RAM 4837 to RAM 4834, for example, as shown in FIG.
- the processor 4831 generates an analysis result of the cell type of each measured cell based on the calculation result by the parallel processing processor 4833 (S104).
- FIG. 22 shows an operation example of arithmetic processing of the parallel processing processor 4833 executed based on the instruction of the processor 4831 according to the operation of the analysis software 4832.
- the processor 4831 that executes the analysis software 4832 causes the parallel processing processor 4833 to execute the assignment of arithmetic processing to the arithmetic unit 4836 (S110).
- the processor 4831 causes the parallel processing processor 4833 to execute the assignment of arithmetic processing to the arithmetic unit 4836, for example, by calling the kernel function of the parallel processing processor 4833.
- the matrix operation related to the deep learning algorithm 60 is divided into a plurality of operation processes, and each of the divided operation processes is assigned to the operation unit 4836.
- a plurality of waveform data are sequentially input to the deep learning algorithm 60.
- the matrix operation corresponding to the waveform data is divided into a plurality of arithmetic processes and assigned to the arithmetic unit 4836.
- Each arithmetic processing is processed in parallel by a plurality of arithmetic units 4836 (S111).
- the arithmetic processing is executed for a plurality of waveform data.
- the calculation result generated by being processed in parallel by the plurality of calculation units 4836 is transferred from the RAM 48 37 to the RAM 4834 (S112).
- the calculation result is transferred from RAM 4738 to RAM 4834 by DMA.
- FIG. 23 shows another example of the block diagram of the measurement unit 400.
- the measurement unit 400 shown in FIG. 23 does not include an A / D conversion unit 482, a processor 4831, a RAM 4834, a storage unit 4835, and a parallel processing processor 4833, and is provided with a connection port 4201. It has the same configuration and function as the measurement unit 400 described in FIG. 7 and its related description.
- a connection cable 4202 is connected to the connection port 4201.
- FIG. 24 shows an example of a block diagram of the processing unit 300.
- the processing unit 300 includes a processor 3001, a parallel processing processor 3002, a storage unit 3004, a RAM 3005, an interface unit 3006, an A / D conversion unit 3008, a bus controller 4850, and an interface unit 3009. Is connected to bus 3003. That is, in the example of FIG. 24, the parallel processing processor 3002 is mounted on the cell analyzer 4000 in a form of being incorporated inside the processing unit 300.
- the bus 3003 is, for example, a transmission line having a data transfer speed of several hundred MB / s or more. Bus 3003 may be a transmission line having a data transfer speed of 1 GB / s or more.
- Bus 3003 transfers data based on, for example, PCI-Express or PCI-X standard.
- the configurations of the processor 3001, the parallel processing processor 3002, the storage unit 3004, and the RAM 3005, and the processing executed by them are the processor 4831, the parallel processing processor 4833, the storage unit 4835, and the RAM 4834 described in FIGS. 11 to 19 above. It is the same as the configuration and processing of.
- the A / D conversion unit 3008 samples the analog signal output from the measurement unit 400 as described above, and generates a digital signal including the waveform data of the cells. The method of generating a digital signal is as described above. In the example of FIGS.
- the connection cable 4202 includes, for example, a number of transmission paths corresponding to the type of analog signal transmitted from the measurement unit 400 to the processing unit 300.
- the connection cable 4202 is composed of twisted pair cables and has a number of pairs of wiring corresponding to the type of analog signal transmitted to the processing unit 300.
- the transmission path from the connection port 3007 to the A / D converter 3008 may also have a number of wires corresponding to the type of analog signal transmitted to the processing unit 300.
- an analog signal is transmitted as a differential signal.
- the processor 3001 and the parallel processing processor 3002 have the same configurations and functions as the above-mentioned processor 4831 and parallel processing processor 4833.
- the parallel processing processor 3002 includes a plurality of arithmetic units 3200 and RAM 3201. Analysis software 3100 that analyzes the cell type of the measured cell is executed on the processor 3001.
- the parallel processing processor 3002 does not need to be directly connected to the bus 3003.
- the parallel processing processor 3002 is mounted on a USB device, and the USB device is connected to the bus 3003 via an interface unit (not shown) for processing. It may be mounted on the cell analyzer 4000 as part of the unit 300.
- This USB device may be a small device such as a USB dongle.
- the processing unit 300 is connected to the interface unit 489 of the measurement unit 400 via the interface unit 3006.
- the processing unit 300 transmits control signals of the device mechanism unit 430 and the sample preparation unit 440 to the measurement unit 400 via the interface unit 3006.
- the interface unit 3006 is, for example, a USB interface.
- the processing unit 300 is connected to the interface unit 3006 via the connection port 3007 connected to the A / D conversion unit 3008 and the connection cable 4202 connected to the connection port 3007. It is connected to the connection port 4201 of the measurement unit 400.
- the connection port 4201 is connected to the analog processing unit 420.
- the analog signal output from the connection port 4201 to the processing unit 300 is a signal obtained by processing the output of the FCM detection unit 410 of the measurement unit 400 by the analog processing unit 420.
- the analog processing unit 420 performs processing including noise reduction on the analog signal input from the FCM detection unit 410.
- the analog signal processed by the analog processing unit 420 is transmitted to the processing unit 300 via the connection port 4201 and the connection cable 4202.
- connection cable 4202 is configured, for example, with a length of 1 meter or less in order to reduce noise during signal transmission.
- the analog signal is transmitted to the processing unit 300 as a differential signal, for example, via the connection cable 4202.
- the processing unit 300 may include a plurality of connection ports 3007.
- the processing unit 300 may acquire analog signals from the plurality of measurement units 400 via the plurality of connection ports 3007.
- the analog signal transmitted from the measurement unit 400 via the connection cable 4202 is converted into a digital signal by the A / D conversion unit 3008 of the processing unit 300.
- the A / D converter 3008 for example, as described with reference to FIG. 2, has a predetermined sampling rate (eg, sampling of 1024 points at intervals of 10 nanoseconds, sampling of 128 points at intervals of 80 nanoseconds, or 160.
- the transmitted analog signal is sampled at nanosecond intervals (sampling of 64 points, etc.) to generate waveform data for each cell.
- the waveform data is stored in the storage unit 3004 or the RAM 3005 via the bus 3003.
- the waveform data is transferred to the RAM 3005 by, for example, DMA.
- the processor 3001 and the parallel processing processor 3002 execute arithmetic processing on the waveform data stored in the storage unit 3004 or the RAM 3005.
- the analysis software 3100 operating on the processor 3001 has the same function as the analysis software 4832 shown in FIG. By executing the analysis software 3100, the processor 3001 generates classification information regarding the cell type of the measured cells by the same operation as in FIG. 16, FIG. 17, FIG. 18, FIG. 21, FIG. 22 and the related description thereof. ..
- step S13 digital signal generation
- step S14 cell classification
- step S15 transmission of classification information
- the processor 3001 can process the waveform data and the identification information in association with each other. Specifically, the processor 3001 can associate the analysis result of the waveform data (that is, the classification information regarding the cell type of each cell) with the identification information.
- the identification information includes, for example, (1) identification information of a biological sample corresponding to waveform data, (2) identification information of cells corresponding to waveform data, (3) identification information of a patient corresponding to waveform data, and (4) waveform. Examples include the identification information of the test corresponding to the data, (5) the identification information of the cell analyzer in which the waveform data was measured, and (6) the identification information of the inspection-related facility in which the waveform data was measured.
- the processor 3001 can acquire at least one of the above identification information (1) to (6) or a combination thereof from LIS.
- at least one of (1) to (6) exemplified is associated with the classification information and provided to the user as an inspection result.
- the plurality of combinations of (1) to (6) exemplified may be associated with the classification information and provided to the user as an inspection result.
- FIG. 26 shows another example of the block diagram of the measurement unit 400.
- the measurement unit 400 shown in FIG. 26 does not include a processor 4831, a RAM 4834, a storage unit 4835, and a parallel processing processor 4833, and is an interface for transmitting a digital signal generated by the A / D conversion unit 482 to the processing unit 300. It has the same configuration and function as the measurement unit 400 described in FIGS. 6, 7 and related descriptions, except that the unit 4851 and the transmission line 4852 are provided.
- the interface unit 4851 is, for example, an interface as a dedicated line having a communication band of 1 gigabit / sec or more.
- the interface unit 4851 is an interface compliant with Gigabit Ethernet, USB3.0, or Thunderbolt 3.
- the transmission line 4852 is, for example, a LAN cable.
- the transmission line 4852 is a USB cable compliant with USB3.0.
- the transmission line 4852 is, for example, a dedicated transmission line for transmitting a digital signal between the measurement unit 400 and the processing unit 300.
- FIG. 27 shows another example of the block diagram of the processing unit 300.
- the processing unit 300 shown in FIG. 27 has the processing unit 300 described in FIG. 24 and its related description, except that it does not include the A / D conversion unit 3008 and the connection port 3007, and includes the interface unit 3010. It has a similar configuration and function.
- the processing unit 300 may be connected to a plurality of measurement units 400 via a plurality of interface units 3010 and a plurality of interface units 3006.
- the processor 3001 and the parallel processing processor 3002 have the same configurations and functions as the processor 3001 and the parallel processing processor 3002 described in FIG. 25 and its related description.
- the parallel processing processor 3002 does not necessarily have to be directly connected to the bus 3003, and may be mounted on a USB device, for example, and the USB device may be connected to the bus 3003 via an interface unit (not shown). good.
- This USB device may be a small device such as a USB dongle.
- the analysis software 3100 operating on the processor 3001 has the same function as the analysis software 4832 shown in FIG.
- the analysis software 3100 analyzes the cell type of the measured cell by the same operation as in FIG. 16, FIG. 17, FIG. 18, FIG. 21, FIG. 22 and related descriptions thereof.
- step S14 (cell classification) is performed in the processing unit 300 in the flowchart shown in FIG. 20.
- Step S15 transmission of classification information
- the processing of FIGS. 21 and 22 is performed by the processor 3001 of the processing unit 300 and the parallel processing processor 3002.
- the analog signals (forward scattered light signal, side scattered light signal, side fluorescent signal) of the cells generated by the FCM detection unit 410 are the A / D conversion unit in the measurement unit 400. It is converted into a digital signal at 482.
- the digital signal is sent to the processing unit 300 via the interface unit 484, the bus 485, the interface unit 4851, and the transmission line 4852.
- the transmission line 4852 is a dedicated transmission line for transmitting a digital signal between the measurement unit 400 and the processing unit 300 as described above.
- the measurement unit 400 and the processing unit 300 are connected one-to-one via a transmission line 4852.
- the transmission line 4852 is a transmission line that does not intervene in the transmission of data related to devices other than, for example, the components constituting the cell analyzer 4000 (for example, the measurement unit 400 and the processing unit 300).
- the transmission line 4852 is, for example, a transmission line different from the intranet or the Internet.
- an analysis unit 600 is provided between the measurement unit 400 and the processing unit 300. That is, in the configuration of FIGS. 28, 29, 30, 31, and 32, the cell analyzer 4000 includes a measurement unit 400, a processing unit 300, and an analysis unit 600. The analysis unit 600 analyzes the cell type of the measured cell. As will be described later, in this configuration example, the parallel processing processor 6002 is mounted on the cell analyzer 4000 in a form of being incorporated in the analysis unit 600.
- the configuration of the measurement unit 400 exemplified in FIG. 29 has the same configuration and function as the measurement unit 400 described in FIG. 26 and its related description.
- An analysis unit 600 is provided between the measurement unit 400 and the processing unit 300.
- the analysis unit 600 may be connected to a plurality of measurement units 400.
- the analysis unit 600 may be connected to a plurality of processing units 300.
- the interface unit 4851 is, for example, an interface having a communication band of 1 gigabit / sec or more.
- the interface unit 4851 is an interface compliant with Gigabit Ethernet, USB3.0, or Thunderbolt 3.
- the transmission line 4852 is, for example, a LAN cable.
- the transmission line 4852 is a USB cable compliant with USB3.0.
- the transmission line 4852 is a dedicated transmission line for transmitting a digital signal between the measurement unit 400 and the processing unit 300 as described above.
- the measurement unit 400 and the processing unit 300 are connected one-to-one via a transmission line 4852.
- FIG. 30 shows a configuration example of the analysis unit 600.
- the analysis unit 600 includes, for example, a processor 6001, a parallel processing processor 6002, a bus 6003, a storage unit 6004, a RAM 6005, an interface unit 6006, and an interface unit 6007, which are connected to the bus 6003.
- the bus 6003 is, for example, a transmission line having a data transfer speed of several hundred MB / s or more.
- Bus 3003 may be a transmission line having a data transfer speed of 1 GB / s or more.
- Bus 3003 transfers data based on, for example, PCI-Express or PCI-X standard.
- the analysis unit 600 may be connected to a plurality of measurement units 400 via a plurality of interface units 6006. When a plurality of measurement units 400 are provided, the analysis unit 600 may be connected to each of the measurement units 400 (for example, the plurality of measurement units 400 and the plurality of analysis units 600 are connected one-to-one). Ru).
- the processor 6001 and the parallel processing processor 6002 have the same configurations and functions as the above-mentioned processor 4831 and the parallel processing processor 4833.
- the parallel processing processor 6002 includes a plurality of arithmetic units 6200 and RAM 6201.
- the analysis software 6100 that analyzes the cell type of the measured cell runs on the processor 6001.
- the analysis software 6100 running on the processor 6001 has the same functions as the analysis software 4832 shown in FIG.
- the analysis software 6100 analyzes the cell type of the measured cell by the same operation as in FIG. 16, FIG. 17, FIG. 18, FIG. 21, FIG. 22 and related descriptions thereof.
- the analysis software 6100 transmits the measured cell classification information to the processing unit 300 via the interface unit 6007.
- the interface unit 6007 is, for example, Ethernet (registered trademark) or USB.
- the interface unit 6007 may be an interface capable of wireless communication (for example, WiFi (registered trademark), Bluetooth (registered trademark)).
- FIG. 32 shows a configuration example of the processing unit 300.
- the processing unit 300 shown in FIG. 32 does not have to include the parallel processing processor 3002 like the processing unit 300 shown in FIGS. 24 and 27. Further, the analysis software 3100 shown in FIGS. 24 and 27 may not be running on the processor 3001 shown in FIG. 32.
- the processing unit 300 receives the analysis result by the analysis unit 600 via the interface unit 3006.
- the interface unit 3006 is, for example, Ethernet or USB.
- the interface unit 3006 may be an interface capable of wireless communication (for example, WiFi, Bluetooth).
- the analog signals (forward scattered light signal, side scattered light signal, side fluorescent signal) of the cells generated by the FCM detection unit 410 are in the measurement unit 400. It is converted into a digital signal by the A / D conversion unit 482 of.
- the waveform data is sent to the analysis unit 600 via the interface unit 484, the bus 485, the interface unit 4851, and the transmission line 4852.
- the interface unit 4851 is a dedicated interface for connecting the measurement unit 400 and the analysis unit 600, and connects the measurement unit 400 and the analysis unit 600 on a one-to-one basis.
- the transmission line 4852 is a transmission line that does not intervene in the transmission of data related to devices other than, for example, the components constituting the cell analyzer 4000 (for example, the measurement unit 400 and the processing unit 300).
- Transmission and 4852 are, for example, separate transmission lines from the intranet or the Internet.
- step S14 cell classification
- step S15 transmission of classification information
- the cell analyzer of the configuration example 5 is also configured to include the measurement unit 400, the processing unit 300, and the analysis unit 600, as in the configuration example 4 described above.
- the measurement unit 400 shown in FIG. 33 has the same functions and configurations as the measurement unit 400 described in FIG. 23 and its related description.
- the measurement unit 400 shown in FIG. 33 is connected to the analysis unit 600 via the connection cable 4202.
- the connection cable 4202 is composed of twisted pair cables and has a number of pairs of wiring corresponding to the type of analog signal transmitted to the processing unit 300.
- the connection cable 4202 is configured, for example, with a length of 1 meter or less in order to reduce noise during signal transmission.
- the measurement unit 400 transmits an analog signal to the analysis unit 600 via the connection cable 4202.
- the analysis unit 600 shown in FIG. 34 has the same functions and configurations as the analysis unit 600 described in FIG. 30 and its related description. That is, in the example of FIG. 34, the parallel processing processor 6002 is mounted on the cell analyzer 4000 in a form incorporated in the analysis unit 600.
- the analysis unit 600 shown in FIG. 34 further includes a connection port 6008 and an A / D conversion unit 6009.
- the analog signal transmitted from the analysis unit 600 via the connection cable 4202 is input to the A / D conversion unit 6009 via the connection port 6008.
- the A / D conversion unit 6009 converts an analog signal into a digital signal by the same processing as the A / D conversion unit 482.
- the analysis unit 600 may be connected to a plurality of measurement units 400 via a plurality of connection ports 6008. When a plurality of measurement units 400 are provided, the analysis unit 600 may be connected to each of the measurement units 400 (for example, the plurality of measurement units 400 and the plurality of analysis units 600 are connected one-to-one). Ru).
- the processor 6001 and the parallel processing processor 6002 have the same configurations and functions as the above-mentioned processor 4831 and the parallel processing processor 4833.
- the analysis software 6100 that analyzes the cell type of the measured cell runs on the processor 6001.
- the analysis software 6100 running on the processor 6001 has the same functions as the analysis software 4832 shown in FIG.
- the analysis software 6100 analyzes the cell type of the measured cell by the same operation as in FIG. 16, FIG. 17, FIG. 18, FIG. 21, FIG. 22 and related descriptions thereof.
- the analysis software 6100 transmits the analysis result of the measured cell type of the cell to the processing unit 300 via the interface unit 6007.
- the interface unit 6007 is, for example, Ethernet or USB.
- the interface unit 6007 may be an interface capable of wireless communication (for example, WiFi, Bluetooth).
- step S13 digital signal generation
- step S14 cell classification
- step S15 classification information
- a digital signal is generated (step S13) in the A / D conversion unit 6009 of the analysis unit 600
- cell classification based on the digital signal is performed by the processor 6001 and the parallel processing processor 6002
- the classification information is obtained. It is transmitted from the analysis unit 600 to the processing unit 300 (step S15).
- the processing of FIGS. 21 and 22 is performed by the processor 6001 of the analysis unit 600 and the parallel processing processor 6002.
- the data size of the waveform data and the digital signal will be described.
- the analog signal of forward scattered light (FSC), the analog signal of laterally scattered light (SSC), and the analog signal of lateral fluorescence (SFL) one cell is at regular intervals. Sampling is done at multiple time points. Examples of sampling rates include 1024 point sampling at 10 nanosecond intervals, 128 point sampling at 80 nanosecond intervals, 64 point sampling at 160 nanosecond intervals, and the like.
- the amount of data is, for example, 2 bytes per sampling.
- FSC, SSC, SFL are measured for at least 100 cells.
- FSC, SSC, and SFL may be measured in one measurement, for example, for at least 1000 cells.
- FSC, SSC, and SFL may be measured for, for example, about 10,000 to about 140000 cells in one measurement.
- the capacity of the digital signal is, for example, several hundred megabytes to several gigabytes per sample, and is at least one gigabyte depending on the number of cells, the sampling rate, and the number of measurement channels.
- analysis using the deep learning algorithm 60 inside the cell analyzer 4000 or 4000'as described above is performed.
- the process is complete and no digital signal is transmitted over the internet or intranet to the analytical server installed outside the cell analyzer 4000 or 4000'. Therefore, it is possible to avoid a decrease in processing capacity due to an increase in communication load that occurs when a digital signal is transmitted from the cell analyzer 4000 or 4000'to the analysis server.
- FIG. 35 is an example of a block diagram of the measurement unit 500.
- the measurement unit 500 includes an amplifier circuit 550 and an amplifier circuit 550 that amplify the output signals (output signals amplified by the preamplifier) of the sample distribution unit 501, the sample preparation unit 502, the optical detection unit 505, and the optical detection unit 505.
- Filter circuit 506 that filters the output signal from, A / D converter 507 that converts the output signal (analog signal) of the filter circuit 506 into a digital signal, processor 4831, parallel processing processor 4833, RAM4834, bus controller Includes 4850, storage device 511a, and LAN (Local Area Network) adapter 512.
- the processor 4831, the parallel processing processor 4833, the RAM 4834, the bus controller 4850, the storage device 511a, and the LAN adapter 512 are connected to the bus 508.
- the analysis software based on the deep learning algorithm 60 and the deep learning algorithm 60 is stored in the storage device 511a.
- the processor 4831 performs predetermined arithmetic processing on the digital signal output from the A / D conversion unit 507, as described based on the example of the first cell analyzer 4000.
- Processor 4831 uses the parallel processing processor 4833 to analyze the waveform data.
- the configuration example of the processor 4831 and the parallel processing processor 4833 and the operation of the parallel processing processor 4833 are the same as those in FIGS. 11 to 19 and the related description described above.
- the processing unit 300 is connected to the measurement unit 500 via a LAN cable, for example, via a LAN adapter 512, and the processing unit 300 generates inspection results based on the measurement data acquired by the measurement unit 500. ..
- the optical detection unit 505, the amplifier circuit 550, the filter circuit 506, the A / D conversion unit 507, the processor 4831, the parallel processing processor 4833, and the storage device 511a constitute an optical measurement unit 510 that measures a measurement sample and generates measurement data. is doing.
- FIG. 36 is a diagram showing the configuration of the optical detection unit 505 of the measurement unit 500.
- the condenser lens 552 concentrates the laser light radiated from the semiconductor laser light source 551 as a light source on the flow cell 551, and the condenser lens 554 forward-scatters the forward scattered light emitted from the formed components in the measurement sample. Condenses light on the light receiving unit 555. Further, the other condenser lens 556 concentrates the laterally scattered light and the fluorescence emitted from the formed component on the dichroic mirror 557.
- the dichroic mirror 557 reflects the side-scattered light to the side-scattered light receiving unit 558, and transmits the fluorescence toward the fluorescence light-receiving unit 559. These optical signals reflect the characteristics of the formed components in the measurement sample. Then, the forward scattered light receiving unit 555, the side scattered light receiving unit 558, and the fluorescent light receiving unit 559 convert the optical signal into an electric signal, and output the forward scattered light signal, the side scattered light signal, and the fluorescence signal, respectively. These outputs are amplified by the preamplifier and then used for the next stage processing.
- each of the forward scattered light receiving unit 555, the side scattered light receiving unit 558, and the fluorescent light receiving unit 559 can switch between low-sensitivity output and high-sensitivity output by switching the drive voltage. This sensitivity switching is performed by the processor 4831 described later.
- a photodiode is used as the forward scattered light receiving unit 555, and a photomultiplier tube may be used as the side scattered light receiving unit 558 and the fluorescence receiving unit 55, or the side scattered light receiving unit 558 and A photodiode may be used as the fluorescence light receiving unit 559.
- the fluorescence signal output from the fluorescence light receiving unit 559 is amplified by the preamplifier and then given to the two branching signal channels.
- the two signal channels are connected to the amplifier circuit 550 described above in FIG. 35, respectively.
- the fluorescence input to one signal channel is amplified with high sensitivity by the amplifier circuit 550.
- FIG. 37 is a diagram showing a schematic functional configuration of the sample preparation unit 502 and the optical detection unit 505 shown in FIG. 35.
- the sample distribution unit 501 shown in FIGS. 35 and 37 includes a suction tube 517 and a syringe pump.
- the sample distribution unit 501 sucks the sample (urine or body fluid) 00b through the suction tube 517 and dispenses it to the sample preparation unit 502.
- the sample preparation unit 502 includes a reaction tank 512u and a reaction tank 512b.
- the sample distribution unit 501 distributes the quantified measurement sample to each of the reaction tank 512u and the reaction tank 512b.
- the distributed biological sample is mixed with the first reagent 519u as a diluent and the third reagent 518u containing the dye.
- the formed component in the sample is stained with the dye contained in the third reagent 518u.
- the biological sample is urine
- the sample prepared in this reaction tank 512u is used as a first measurement sample for analyzing relatively large urinary formations such as erythrocytes, leukocytes, epithelial cells, and tumor cells. .
- the sample prepared in the reaction tank 512u is used as a third measurement sample for analyzing red blood cells in the body fluid.
- the distributed biological sample is mixed with the second reagent 519b as a diluent and the fourth reagent 518b containing the dye.
- the second reagent 519b has a hemolytic effect.
- the dye contained in the fourth reagent 518b stains the formed components in the sample.
- the biological sample is urine
- the sample prepared in this reaction tank 512b becomes a second measurement sample for analyzing bacteria in urine.
- the sample prepared in the reaction tank 512b becomes a fourth measurement sample for analyzing nucleated cells (white blood cells and large cells) and bacteria in the body fluid.
- a tube extends from the reaction tank 512u to the flow cell 551 of the optical detection unit 505, and the measurement sample prepared in the reaction tank 512u can be supplied to the flow cell 551.
- a solenoid valve 521u is provided at the outlet of the reaction tank 512u.
- a tube is also extended from the reaction tank 512b, and this tube is connected in the middle of the tube extending from the reaction tank 2u. As a result, the measurement sample prepared in the reaction vessel 512b can be supplied to the flow cell 551. Further, a solenoid valve 521b is provided at the outlet of the reaction tank 512u.
- the tube extending from the reaction tanks 512u and 512b to the flow cell 551 is branched in front of the flow cell 551, and the branch destination is connected to the syringe pump 520a. Further, a solenoid valve 521c is provided between the syringe pump 520a and the branch point.
- the tube is further branched on the way from the connection point of the tube extending from each of the reaction tanks 512u and 512b to the branch point, and the branch destination is connected to the syringe pump 520b. Further, a solenoid valve 521d is provided between the branch point of the tube extending to the syringe pump 520b and the connection point.
- a sheath liquid accommodating unit 522 for accommodating the sheath liquid is connected to the sample preparation unit 502, and this sheath liquid accommodating unit 522 is connected to the flow cell 551 by a tube.
- a compressor 522a is connected to the sheath liquid accommodating portion 522, and when the compressor 522a is driven, compressed air is supplied to the sheath liquid accommodating portion 522, and the sheath liquid is supplied from the sheath liquid accommodating portion 522 to the flow cell 551.
- the two types of suspensions (measurement samples) prepared in each of the reaction tanks 512u and 512b are the suspensions of the reaction tank 512u (the first measurement sample when the biological sample is urine.
- the biological sample is the body fluid.
- the third measurement sample. Is guided to the optical detection unit 505 to form a thin flow wrapped in the sheath liquid in the flow cell 551, and the laser beam is irradiated there.
- the suspension of the reaction tank 512b (the second measurement sample when the biological sample is urine.
- the fourth measurement sample when the biological sample is body fluid) is guided to the optical detection unit 505 and is thin in the flow cell 551. It forms a flow and is irradiated with laser light.
- Such an operation is automatically performed by operating the solenoid valves 521a, 521b, 521c, 521d, the drive unit 503, and the like under the control of the processor 4831 (control unit).
- the first reagent to the fourth reagent will be described in detail.
- the first reagent 519u is a reagent containing a buffer as a main component, and contains an osmotic pressure compensating agent so that a stable fluorescent signal can be obtained without hemolyzing erythrocytes, so that it is suitable for classification measurement.
- the osmotic pressure is adjusted to 100 to 600 mOsm / kg.
- the first reagent 519u preferably does not have a hemolytic effect on red blood cells in urine.
- the second reagent 519b has a hemolytic action unlike the first reagent 519u. This is to enhance the passage of the fourth reagent 518b, which will be described later, to the cell membrane of the bacterium, and to accelerate the staining. It is also to shrink impurities such as mucous threads and red blood cell debris.
- the second reagent 519b contains a surfactant to obtain hemolytic action. Various surfactants such as anions, nonions, and cations are used, but cationic surfactants are particularly suitable. Since the surfactant can damage the cell membrane of the bacterium, the dye contained in the fourth reagent 518b can efficiently stain the nucleic acid of the bacterium. As a result, the measurement of bacteria can be performed in a short time staining process.
- the second reagent 519b may acquire a hemolytic action by being adjusted to an acidity or a low pH instead of a surfactant.
- the low pH means that the pH is lower than that of the first reagent 19u.
- the first reagent 519u is in the range of neutral or weakly acidic to weakly alkaline
- the second reagent 19b is acidic or strongly acidic.
- the pH of the first reagent 519u is 6.0 to 8.0
- the pH of the second reagent 519b is lower than that, preferably 2.0 to 6.0.
- the second reagent 519b may contain a surfactant and may be adjusted to a low pH.
- the second reagent 519b may acquire a hemolytic action by setting the osmotic pressure to be lower than that of the first reagent 19u.
- the first reagent 519u does not contain a surfactant.
- the first reagent 519u may contain a surfactant, but it is necessary to adjust the type and concentration so as not to hemolyze the erythrocytes. Therefore, it is preferable that the first reagent 519u does not contain the same surfactant as the second reagent 519b, or even if it contains the same surfactant, the concentration is lower than that of the second reagent 519b.
- the third reagent 518u is a staining reagent used for measuring urinary formed components (erythrocytes, leukocytes, epithelial cells, cylinders, etc.).
- a dye for film staining is selected in order to stain formed components having no nucleic acid.
- the third reagent 518u preferably contains an osmotic pressure compensating agent for the purpose of preventing erythrocyte hemolysis and for obtaining stable fluorescence intensity, and is adjusted to 100 to 600 mOsm / kg so as to have an osmotic pressure suitable for classification measurement. ing.
- the cell membrane and nucleus (membrane) of the urinary formation are stained with the third reagent 18u.
- a condensed benzene derivative is used as a dyeing reagent containing a dye for film dyeing, and for example, a cyanine dye can be used.
- the third reagent 18u stains not only the cell membrane but also the nuclear membrane.
- the third reagent 518u in nucleated cells such as leukocytes and epithelium, the staining intensity in the cytoplasm (cell membrane) and the staining intensity in the nucleus (nuclear envelope) are combined, and the staining is higher than that in urinary formation without nucleic acid. The strength increases.
- the third reagent the reagent described in JP-A-5891733 can be used. US 5891733 is incorporated herein by reference.
- the third reagent 518u is mixed with urine or body fluid together with the first reagent 519u.
- the fourth reagent 518b is a staining reagent that can accurately measure bacteria even if it is a sample containing impurities of the same size as bacteria and fungi.
- the fourth reagent 518b is described in detail in European Application Publication No. 1136563.
- a dye that stains nucleic acid is preferably used.
- a staining reagent containing a dye for nuclear staining for example, a cyanine-based dye of US Pat. No. 7,309,581 can be used.
- the fourth reagent 518b is mixed with urine or a sample together with the second reagent 519b. Publication No. 1136563 and US Pat. No. 7,309,581 are incorporated herein by reference.
- the third reagent 518u contains a dye that stains the cell membrane
- the fourth reagent 518b contains a dye that stains nucleic acid. Since the urinary formations include those that do not have nuclei such as red blood cells, the third reagent 518u contains a dye that stains the cell membrane, so that those that do not have such nuclei are also included. It is possible to detect urinary formations. Further, since the second reagent can damage the cell membrane of the bacterium, the dye contained in the fourth reagent 18b can efficiently stain the nucleic acid of the bacterium and the fungus. As a result, the measurement of bacteria can be performed in a short time staining process.
- the first waveform data analysis system includes a deep learning device 100A.
- the vendor side device 100 operates as a deep learning device 100A.
- the deep learning device 100A causes the neural network 50 to learn using the training data, and provides the user with the deep learning algorithm 60 trained by the training data.
- the deep learning algorithm 60 composed of the trained neural network is provided from the deep learning device 100A to the measurement unit 400 through the recording medium 98 or the communication network 99.
- the measurement unit 400 analyzes the waveform data of the cell to be analyzed by using the deep learning algorithm 60 composed of the trained neural network.
- the deep learning device 100A is composed of, for example, a general-purpose computer, and performs deep learning processing based on a flowchart described later.
- the measurement unit 400 performs waveform data analysis processing based on a flowchart described later.
- the recording medium 98 is a computer-readable and non-temporary tangible recording medium such as a DVD-ROM or a USB memory.
- the deep learning device 100A is connected to the measurement unit 400a or the measurement unit 500a.
- the configuration of the measuring unit 400a or the measuring unit 500a is the same as that of the measuring unit 400 or the measuring unit 500 described above, respectively.
- the deep learning device 100A acquires waveform data for training acquired by the measurement unit 400a or the measurement unit 500a.
- the method of generating waveform data for training is as described above.
- the measuring unit 400a or the measuring unit 500a includes flow cells 4113 and 551, respectively.
- the measuring unit 400a or the measuring unit 500a sends the biological sample to the flow cells 4113 and 551.
- the biological sample supplied to the flow cells 4113 and 551 is irradiated with light from the light sources 4112 and 553, and the forward scattered light, the lateral scattered light, and the lateral fluorescence emitted from the cells in the biological sample are emitted from the light detection unit (4116). 4121, 4122, 555, 558, 559) are detected.
- the measuring unit 400a or the measuring unit 500a is derived from the forward scattered light signal, the side scattered light signal, and the side fluorescent signal obtained by detecting the light by the light detection unit (4116, 4121, 4122, 555, 558, 559). Waveform data is generated, and the waveform data is transmitted to the vendor side device 100.
- FIG. 39 illustrates a block diagram of the vendor side device 100 (deep learning device 100A).
- the vendor side device 100 includes a processing unit 10 (10A), an input unit 16, and an output unit 17.
- the processing unit 10 transmits data between, for example, a CPU 11 that performs data processing described later, a memory 12 used for a work area for data processing, a storage unit 13 that records a program and processing data described later, and each unit. It includes a bus 14, an interface unit (I / F unit) 15 for inputting / outputting data to / from an external device, and a GPU 19.
- the input unit 16 and the output unit 17 are connected to the processing unit 10 via the interface unit 15.
- the input unit 16 is an input device such as a keyboard or a mouse
- the output unit 17 is a display device such as a liquid crystal display.
- the GPU 19 functions as an accelerator that assists the arithmetic processing (for example, parallel arithmetic processing) performed by the CPU 11.
- the processing performed by the CPU 11 means that the processing performed by the CPU 11 using the GPU 19 as an accelerator is also included.
- the GPU 19 has the same function as the above-mentioned parallel processing processor 4833.
- a chip which is preferable for the calculation of the neural network may be mounted. Examples of such a chip include FPGA, ASIC, Myriad X (Intel) and the like.
- the processing unit 10 stores, for example, an execution format of the deep learning algorithm 50 composed of the program according to the present embodiment and the neural network before training in order to perform the processing of each step described with reference to FIG. 43 below. It is recorded in advance in the unit 13.
- the execution format is, for example, a format generated by being converted by a compiler from a programming language.
- the processing unit 10 uses the program recorded in the storage unit 13 to perform training processing of the neural network 50 before training.
- the processing performed by the processing unit 10 means the processing performed by the CPU 11 based on the program and the neural network 50 stored in the storage unit 13 or the memory 12.
- the CPU 11 temporarily stores necessary data (intermediate data in the middle of processing, etc.) using the memory 12 as a work area, and appropriately records data to be stored for a long period of time, such as a calculation result, in the storage unit 13.
- the configuration of the measurement unit 400 or 500 that processes the waveform data based on the algorithm provided by the vendor-side device 100 is the same as the configuration described above. Further, the measurement unit 400 or 500 may also have the function of the vendor side device 100 (deep learning device 100A) and may train the neural network 50 using the training data. In this case, the vendor side device 100 (deep learning device 100A) becomes unnecessary.
- the measurement unit control unit 480 uses, for example, a deep learning algorithm 60 composed of the program according to the present embodiment and the trained neural network in order to perform the processing of each step described in the following waveform data analysis processing. It is recorded in advance in the storage unit 4835 in an execution format.
- the execution format is, for example, a format generated by being converted by a compiler from a programming language.
- the measurement unit control unit 480 performs processing using the program recorded in the storage unit 4835 and the deep learning algorithm 60.
- the measurement unit control unit 480 may update the program and the deep learning algorithm 60 recorded in the storage unit 4835 via, for example, the LAN adapter 481 and the communication network.
- the above-mentioned analysis unit 600 may transmit the digital signal received from the measurement unit 400 and the analysis result to the deep learning device 100A via the interface unit 6011.
- the analysis unit 600 transmits waveform data and classification information corresponding to the waveform data to the deep learning device 100A via the Internet, for example.
- the deep learning device 100A performs learning processing based on the waveform data transmitted from the analysis unit 600 and the classification information corresponding to the waveform data, and updates the deep learning algorithm 60.
- the deep learning device 100A transmits the updated deep learning algorithm 60 to the analysis unit 600.
- the analysis unit 600 updates the algorithm stored in the storage unit 6004 by the deep learning algorithm 60 transmitted from the deep learning device 100A. For example, the analysis unit 600 transmits the waveform data to the deep learning device 100A in parallel while the waveform data transmitted from the measurement unit 400 is being processed by the processor 6001 and the parallel processing processor 6002. The analysis unit 600 transmits the classification information to the deep learning device 100A as soon as the analysis of the waveform data, that is, the generation of the classification information is completed.
- the processing performed by the measurement unit control unit 480 is actually based on the program stored in the storage unit 4835 or the RAM 4834 and the deep learning algorithm 60, and is actually the processor 4831 and the parallel processing processor 4833. Means the processing performed by.
- the processor 4831 temporarily stores necessary data (intermediate data during processing, measurement results, analysis results, etc.) using the RAM 4834 as a work area, and appropriately records data to be stored for a long period of time such as calculation results in the storage unit 4835.
- FIG. 42 shows an example of a functional block of the deep learning device 100A that performs deep learning.
- the processing unit 10A of the deep learning device 100A includes a training data generation unit 101, a training data input unit 102, and an algorithm update unit 103.
- These functional blocks are realized by installing a program for causing a computer to execute a deep learning process in the storage unit 13 or the memory 12 of the processing unit 10A shown in FIG. 39, and executing this program by the CPU 11 and the GPU 19.
- the training data database (DB) 104 and the algorithm database (DB) 105 are recorded in the storage unit 13 or the memory 12 of the processing unit 10A.
- the training waveform data 76a, 76b, 76c are acquired in advance by, for example, the measurement units 400 and 500, and are stored in advance in the storage unit 13 or the memory 12 of the processing unit 10A.
- the deep learning algorithm 50 is stored in the algorithm database 105 in advance.
- the processing unit 10A of the deep learning device 100A performs the processing shown in FIG. 43.
- the training data generation unit 101 performs the processing of steps S211, S214 and S216 shown in FIG. 43.
- the training data input unit 102 performs the processing of step S212.
- the processing of steps S213 and S215 is performed by the algorithm update unit 103.
- the processing unit 10A acquires training waveform data 72a, 72b, 72c.
- the training waveform data 72a is the waveform data of the forward scattered light
- the waveform data 72b for training is the waveform data of the side scattered light
- the waveform data 72c for training is the waveform data of the lateral fluorescence.
- the acquisition of the waveform data 72a, 72b, 72c for training is, for example, by the operation of the operator, whether it is fetched from the measurement units 400, 500, from the recording medium 98, or via the I / F unit 15 via the communication network. It is done.
- the training waveform data 72a, 72b, 72c When the training waveform data 72a, 72b, 72c are acquired, information on which cell type the training waveform data 72a, 72b, 72c indicates is also acquired.
- the information indicating which cell type is indicated is associated with the training waveform data 72a, 72b, 72c, and may be input by the operator from the input unit 16.
- step S211th the processing unit 10A generates training data 75 from the acquired waveform data 72a, 72b, 72c and the label value 77.
- step S212 the processing unit 10A inputs the training data 75 to the neural network 50 and acquires the trial result.
- the trial result is accumulated every time a plurality of training data 75 are input to the neural network 50.
- step S213 the processing unit 10A uses a predetermined number of trial results. Judge whether or not is accumulated. When the trial result is accumulated a predetermined number of times (YES), the processing unit 10A proceeds to the process of step S214, and when the trial result is not accumulated a predetermined number of times (NO), the processing unit 10A proceeds to the process of step S215. Proceed to processing.
- step S214 the processing unit 10A updates the connection weight w of the neural network 50 using the training results accumulated in step S212.
- the connection weight w of the neural network 50 is updated at the stage where the trial results for a predetermined number of times are accumulated.
- the process of updating the bond weight w is specifically a process of performing a calculation by the gradient descent method shown in (Equation 12) and (Equation 13) described later.
- step S215 the processing unit 10A determines whether or not the neural network 50 has been trained with the specified number of training data 75. When the training is performed with the specified number of training data 75 (YES), the deep learning process is terminated.
- the processing unit 10A proceeds from step S215 to step S216, and processes the next training waveform data from step S211 to step S215. I do.
- the neural network 50 is trained to obtain the deep learning algorithm 60.
- the structure of the neural network 50 is illustrated in FIG. 44 (a).
- the neural network 50 includes an input layer 50a, an output layer 50b, and an intermediate layer 50c between the input layer 50a and the output layer 50b, and the intermediate layer 50c is composed of a plurality of layers.
- the number of layers constituting the intermediate layer 50c can be, for example, 5 layers or more, preferably 50 layers or more, and more preferably 100 layers or more.
- a plurality of nodes 89 arranged in a layer are connected between layers.
- the information propagates from the input side layer 50a to the output side layer 50b in only one direction indicated by the arrow D in the figure.
- FIG. 44 (b) is a schematic diagram showing operations at each node.
- Each node 89 receives a plurality of inputs and calculates one output (z).
- the node 89 receives four inputs.
- the total input (u) received by the node 89 is represented by the following (Equation 2) as an example.
- one-dimensional matrix data is used as the training data 75 and the analysis data 85. Therefore, when the variable of the arithmetic expression corresponds to the two-dimensional matrix data, the variable is the one-dimensional matrix data. Performs the conversion process to correspond to.
- Each input is weighted differently.
- b is a value called bias.
- the output (z) of the node is the output of the predetermined function f with respect to the total input (u) represented by (Equation 2), and is represented by the following (Equation 3).
- the function f is called an activation function.
- FIG. 44 (c) is a schematic diagram showing operations between nodes.
- the nodes that output the result (z) represented by (Equation 3) are arranged in layers for the total input (u) of each node 89 represented by (Equation 2). ..
- the output of the node of the previous layer becomes the input of the node of the next layer.
- the output of the node 89a in the layer on the left side in the figure is the input of the node 89b in the layer on the right side in the figure.
- Each node 89b receives an output from the node 89a, respectively.
- Each connection between each node 89a and each node 89b is weighted differently.
- the outputs of the plurality of nodes 89a are x1 to x4
- the inputs to each of the three nodes 89b are represented by the following (Equation 4-1) to (Equation 4-3).
- the generalization of these (Equation 4-1) to (Equation 4-3) is (Equation 4-4).
- i 1, ... I
- j 1, ...
- the function expressed by using the neural network is y (x: w)
- the function y (x: w) changes when the parameter w of the neural network is changed. Adjusting the function y (x: w) so that the neural network selects a more suitable parameter w for the input x is called neural network training or learning.
- a plurality of sets of inputs and outputs of a function expressed using a neural network are given. Assuming that the desired output for a given input x is d, the set of inputs and outputs is given ⁇ (x1, d1), (x2, d2), ..., (Xn, dn) ⁇ .
- the set of each set represented by (x, d) is called training data.
- the set of waveform data forward scattered light waveform data, side scattered light waveform data, fluorescence waveform data
- FIG. 3 is the training data shown in FIG.
- Neural network learning means that the output y (xn: w) of the neural network when the input xn is given is as close as possible to the output dn for any set of input / output (xn, dn). It means adjusting the weight w.
- the error function is the closeness of the training data to the function expressed using the neural network. It is a scale to measure. The error function is also called the loss function.
- the error function E (w) used in the cell type analysis method according to the embodiment is represented by the following (Equation 7). (Equation 7) is called cross entropy. The method of calculating the cross entropy of (Equation 7) will be described.
- an activation function for classifying the input x into a finite number of classes according to the content is used.
- the output yK (that is, uk (L) ) of the node k of the output layer L represents the probability that the given input x belongs to the class CK.
- the input x is classified into the class having the maximum probability expressed by (Equation 9).
- the function represented by the neural network is regarded as a model of the posterior probability of each class, and the likelihood of the weight w with respect to the training data is calculated under such a probability model. Evaluate and select a weight w that maximizes the likelihood.
- the target output dn by the softmax function of (Equation 8) is set to 1 only when the output is a correct class, and is set to 0 when the output is not.
- the posterior distribution is expressed by the following (Equation 10).
- the error function of (Equation 7) is derived.
- Learning means minimizing the error function E (w) calculated based on the training data with respect to the neural network parameter w.
- the error function E (w) is represented by (Equation 7).
- Minimizing the error function E (w) with respect to the parameter w has the same meaning as finding the local minimum point of the function E (w).
- the parameter w is the weight of the connection between the nodes.
- the minimum point of the weight w is obtained by an iterative calculation in which the parameter w is repeatedly updated starting from an arbitrary initial value.
- An example of such a calculation is the gradient descent method.
- Equation 12 the vector represented by the following (Equation 12) is used.
- the process of moving the value of the current parameter w in the negative gradient direction that is, ⁇ E
- the operation by the gradient descent method is expressed by the following (Equation 13).
- the value t means the number of times the parameter w is moved.
- symbol I is a constant that determines the magnitude of the update amount of the parameter w, and is called a learning coefficient.
- the gradient descent method performed only for some training data is called the stochastic gradient descent method.
- a stochastic gradient descent method is used.
- waveform data of cells in blood collected from 8 healthy subjects were pooled as digital signals.
- Neutrophils NEUT
- lymphocytes LYMPH
- monocytes MONO
- EO eosinophil
- BASO basophils
- IG immature granulocytes
- Classification was performed manually, and each waveform data was annotated (labeled) by cell type.
- the time when the signal intensity of the forward scattered light exceeded the threshold was set as the measurement start time, and the acquisition time of the waveform data of the forward scattered light, the side scattered light, and the side fluorescence was synchronized to generate the training data.
- the control blood was also annotated with control blood-derived cells (CONT). Training data was input to the deep learning algorithm and trained.
- waveform data for analysis was acquired by Sysmex XN-1000 in the same manner as the training data. Waveform data derived from control blood was mixed to create analytical data. This analysis data was input to the constructed deep learning algorithm, and data for each cell type was acquired.
- the result is shown in FIG. 45 as a mixed matrix.
- the horizontal axis shows the judgment result by the deep learning algorithm constructed, and the vertical axis shows the judgment result by human (reference method).
- the judgment result by the constructed deep learning algorithm showed a concordance rate of 98.8% with the judgment result by the reference method, although there was some confusion between basophils and lymphocytes and between basophils and ghosts. ..
- FIG. 46 (a) is a neutrophil
- FIG. 46 (b) is a lymphocyte
- FIG. 46 (c) is a monocyte
- FIG. 47 (a) is a neutrophil
- FIG. 47 (b) is favorable.
- the base sphere, FIG. 47 (c) shows the ROC curve of control blood (CONT).
- Sensitivity and specificity were 99.5% and 99.6% for neutrophils, 99.4% and 99.5% for lymphocytes, and 98.5% and 99.9% for monocytes, respectively.
- Acid spheres were 97.9% and 99.8%
- basophils were 71.0% and 81.4%, respectively
- control blood (CONT) was 99.8% and 99.6%, all of which were good. Showed good results.
- the third cell analyzer 4000'' which is an image analyzer, estimates the cell type of the imaged cell by analyzing the captured image data.
- FIG. 48 shows a configuration example of the cell analyzer 4000''.
- the cell analyzer 4000'' shown in FIG. 48 includes a measurement unit 700 and a treatment unit 800, and measures and analyzes a sample 901 prepared by pretreatment by the pretreatment device 900.
- the measuring unit 700 includes a flow cell 710, a light source 720 to 723, a condenser lens 730 to 733, a dichroic mirror 740 to 741, a condenser lens 750, an optical unit 751, a condenser lens 752, and an image pickup unit 760. And have.
- the sample 701 is flowed through the flow path 711 of the flow cell 710.
- the light sources 720 to 723 irradiate the sample 701 flowing through the flow cell 710 with light.
- the light sources 720 to 723 are composed of, for example, a semiconductor laser light source. Light having wavelengths ⁇ 11 to ⁇ 14 is emitted from the light sources 720 to 723, respectively.
- the condenser lenses 730 to 733 concentrate the light having wavelengths ⁇ 11 to ⁇ 14 emitted from the light sources 720 to 723, respectively.
- the dichroic mirror 740 transmits light of wavelength ⁇ 11 and refracts light of wavelength ⁇ 12.
- the dichroic mirror 741 transmits light having wavelengths ⁇ 11 and ⁇ 12 and refracts light having wavelength ⁇ 13.
- the number of semiconductor laser light sources included in the measurement unit 700 is not limited as long as it is 1 or more.
- the number of semiconductor laser light sources can be selected from, for example, 1, 2, 3, 4, 5 or 6.
- the condenser lens 750 collects the fluorescence generated from the sample 701 flowing through the flow path 711 of the flow cell 710 and the transmitted light transmitted through the sample 701 flowing through the flow path 711 of the flow cell 710.
- the optical unit 751 has, for example, a configuration in which four dichroic mirrors are combined. The four dichroic mirrors of the optical unit 751 reflect fluorescence and transmitted light at slightly different angles and separate them on the light receiving surface of the image pickup unit 760.
- the condenser lens 752 collects fluorescence and transmitted light.
- the image pickup unit 760 is composed of a TDI (Time Delay Integration) camera.
- the imaging unit 760 can image fluorescence and transmitted light, and output a fluorescent image corresponding to fluorescence and a bright field image corresponding to transmitted light to the processing unit 800 as an imaging signal.
- TDI Time Delay Integration
- the processing unit 800 includes a processing unit 811, a storage unit 812, an interface unit 816, and a bus 815 as hardware configurations.
- the processing unit 811, the storage unit 812, and the interface unit 816 are connected to the bus 815.
- Image data (for example, a fluorescent image or a bright field image) composed of an image pickup signal captured by the image pickup unit 760 of the measurement unit 700 is stored in the storage unit 812 via the interface unit 816.
- the processing unit 811 reads the image data from the storage unit 812 and analyzes the image data.
- FIG. 49 shows a configuration example of the processing unit 811.
- the processing unit 811 includes, for example, a processor 8111, a parallel processing processor 8112, and a RAM 8113.
- the processor 8111, the parallel processing processor 8112, and the RAM 8113 have the same configurations and functions as the above-mentioned processor 4831, parallel processing processor 4833, and RAM 4834, respectively.
- the image data captured by the image pickup unit 760 is analyzed by the processor 8111 and the parallel processing processor 8112.
- the parallel processing processor 8112 executes arithmetic processing of matrix data related to image data in parallel by a plurality of arithmetic units, for example, by the processing exemplified in FIGS. 16, 17 and 18.
- processing unit 811 (processor 8111, parallel processing processor 8112, RAM 8113) do not necessarily have to be provided in the processing unit 800, but may be provided in the measurement unit 700.
- the training image used for training the deep learning algorithm is preferably captured in RGB color, CMY color, or the like.
- the shade or brightness of each primary color such as red, green and blue or cyan, magenta, and yellow is represented by a 24-bit value (8 bits x 3 colors).
- the training image may include at least one hue and a shade or brightness of that hue, but more preferably include at least two hues and a shade or brightness of the hue, respectively.
- Information including a hue and the shade or brightness of the hue is also referred to as a color tone.
- the color tone information of each pixel in the training image is converted from, for example, RGB color to a format including luminance information and hue information.
- a format including luminance information and hue information YUV (YCbCr, YPbPr, YIQ, etc.) and the like can be mentioned.
- conversion to the YCbCr format will be described as an example.
- the training image captured in RGB color is converted into image data based on brightness, image data based on the first hue (for example, blue system), and image data based on the second hue (for example, red system), respectively. ..
- the conversion from RGB to YCbCr can be performed by a known method. For example, from RGB to YCbCr, the international standard ITU-R BT.
- the image data based on the brightness, the image data based on the first hue, and the image data based on the second hue can be represented as gradation value matrix data as shown in FIG. 50 (hereinafter, color tone matrix data 72y, Also referred to as 72kb and 72cr).
- the image data based on the luminance, the image data based on the first hue, and the image data based on the second hue are represented by, for example, 256 gradations from 0 to 255 gradations, respectively.
- the training image is converted with the three primary colors of red R, green G, and blue B, and the three primary colors of cyan C, magenta M, and yellow Y, instead of the brightness, the first hue, and the second hue. You may.
- the color tone vector data 74 is generated by combining the three gradation values of the luminance 72y, the first hue 72cc, and the second hue 72cr for each pixel. ..
- each color tone vector data 74 generated from the training image has a label value indicating that the lobation nucleus neutrophil is a lobation nucleus neutrophil. "1" is given as 77, and the training data becomes 75.
- the training data 75 is represented by 3 pixels ⁇ 3 pixels for convenience, but in reality, there is color tone vector data for each pixel when the training image is captured.
- FIG. 51 shows an example of the label value 77.
- a different label value 77 is given depending on the cell type and the presence or absence of the characteristics of each cell.
- the neural network 50 is preferably a convolutional neural network.
- the number of nodes of the input layer 50a in the neural network 50 is the number of pixels of the input training data 75 and the number of brightness and hue contained in the image (for example, in the above example, the brightness 72y, the first hue 72cc, and the second hue). It corresponds to the product with 3) of hue 72cr.
- the color tone vector data 74 is input to the input layer 50a of the neural network 50 as a set 76 thereof.
- the neural network 50 is trained by using the label value 77 of each pixel of the training data 75 as the output layer 50b of the neural network.
- the neural network 50 extracts feature quantities for morphological cell types and cell characteristics based on the training data 75.
- the output layer 50b of the neural network outputs a result reflecting these features.
- Reference numeral 50c in FIG. 50 indicates an intermediate layer.
- the deep learning algorithm 60 having the neural network 60 thus trained is to identify which of the plurality of cell types belonging to a predetermined cell group and morphologically classified corresponds to the cell to be analyzed. Used as a classifier.
- FIG. 52 shows an example of an image analysis method.
- analysis data 81 is generated from an analysis image obtained by imaging a cell to be analyzed.
- the analysis image is an image of the cells to be analyzed.
- the image pickup in the image pickup apparatus is performed in RGB color, CMY color, or the like.
- the shade or brightness of each primary color such as red, green and blue or cyan, magenta, and yellow is represented by a 24-bit value (8 bits x 3 colors).
- the image for analysis may include at least one hue and a shade or brightness of the hue, but more preferably contains at least two hues and a shade or brightness of the hue, respectively.
- Information including a hue and the shade or brightness of the hue is also referred to as a color tone.
- RGB color training image is converted into image data based on brightness, image data based on a first hue (for example, blue system), and image data based on a second hue (for example, red system).
- the conversion from RGB to YCbCr can be performed by a known method. For example, from RGB to YCbCr, the international standard ITU-R BT. It can be converted according to 601.
- the image data corresponding to each of the brightness, the first hue, and the second hue can be represented as matrix data of gradation values as shown in FIG. 52 (hereinafter, also referred to as color tone matrix data 79y, 79cc, 79cr). say).
- Luminance, first hue and second hue 72Cr are represented by 256 gradations from 0 to 255, respectively.
- the training image is converted with the three primary colors of red R, green G, and blue B, and the three primary colors of cyan C, magenta M, and yellow Y. You may.
- the color tone vector data 80 is generated by combining the three gradation values of the luminance 79y, the first hue 79cc, and the second hue 79cr for each pixel.
- a set of color tone vector data 80 generated from one analysis image is generated as analysis data 81.
- the imaging conditions and the generation conditions of the vector data input from each image to the neural network are the same.
- the analysis data 81 is input to the input layer 60a of the neural network 60 constituting the trained deep learning algorithm 60.
- the deep learning algorithm extracts a feature amount from the analysis data 81 and outputs the result from the output layer 60b of the neural network 60.
- the value output from the output layer 60b is the probability that the cells to be analyzed included in the analysis image belong to each of the morphological cell classifications and characteristics input as training data.
- the value is output.
- the label value itself or data in which the label value is replaced with information indicating the presence or absence of morphological cell type or cell characteristics (for example, terms, etc.) is output as the analysis result 83 regarding the cell morphology.
- the label value “1” is output from the analysis data 81 as the most likely label value 82 by the discriminator, and the character data “lobation nucleus neutrophil” corresponding to this label value is the cell data. It is output as the analysis result 83 regarding the morphology.
- Reference numeral 60c in FIG. 52 indicates an intermediate layer.
- each functional block of the training data generation unit 101, the training data input unit 102, the algorithm update unit 103, the analysis data generation unit 201, the analysis data input unit 202, and the analysis unit 203 is a single processor 4831. And run on a single parallel processor 4833, but each of these functional blocks does not necessarily have to be run on a single processor and a parallel processor, but is distributed across multiple processors and multiple parallel processors. It may be executed.
- a program for performing the processing of each step described with reference to FIG. 43 is recorded in advance in the storage unit 4835.
- the program may be installed on the measurement unit control unit 480 from a computer-readable, non-temporary tangible recording medium 98, such as a DVD-ROM or USB memory.
- the measurement unit control unit 480 may be connected to the communication network 99, and a program may be downloaded and installed from, for example, an external server (not shown) via the communication network 99.
- FIG. 53 shows an embodiment of the analysis result.
- FIG. 53 shows the cell types with the label values shown in FIG. 4 and the cell numbers of each cell number type contained in the biological sample measured by flow cytometry. Instead of displaying the number of cells, or together with the display of the number of cells, the ratio (for example,%) of each cell type to the total number of counted cells may be output.
- the cell number count can be obtained by coefficienting the number of label values (the number of the same label values) corresponding to each output cell type.
- a warning indicating that the biological sample contains abnormal cells may be output in the output result.
- FIG. 53 shows an example in which an exclamation mark is attached to the section of abnormal cells as a warning, but the present invention is not limited to this.
- the distribution of each cell tumor may be scattergrammed and output.
- the highest value when the signal intensity is acquired can be plotted with, for example, the lateral fluorescence intensity on the vertical axis and the lateral scattered light intensity on the horizontal axis.
Abstract
Provided are a cell analysis method and a cell analysis device which can process cell data of a significantly increased information amount with required processing capacity in a configuration for analyzing data obtained from a plurality of cells included in a specimen. In the cell analysis device which includes a host processor and a parallel processing processor, the cell analysis method comprises: acquiring data pertaining to each of the plurality of cells included in the specimen on the basis of a control by the host processor; executing parallel processing for the data by means of the parallel processing processor; and generating information about the cell type for each of the plurality of cells on the basis of the result of the parallel processing.
Description
本発明は、細胞分析方法及び細胞分析装置に関する。
The present invention relates to a cell analysis method and a cell analysis device.
特許文献1には、血球細胞をフローサイトメータによって測定して得られたデータを、プロセッサを搭載したデータ処理システムにおいて解析し、細胞を種別に応じて分類する方法が記載されている。特許文献1では、フローサイトメータによって測定した光学的な情報で細胞を分類できない場合に、さらに細胞の体積と導電率の情報を用いることが記載されている。
Patent Document 1 describes a method of analyzing data obtained by measuring blood cell cells with a flow cytometer in a data processing system equipped with a processor and classifying the cells according to the type. Patent Document 1 describes that when cells cannot be classified by optical information measured by a flow cytometer, information on cell volume and conductivity is further used.
細胞の分類精度を向上するために細胞の分類に用いる情報量を増やすと、複数の細胞を含む血液や尿などの検体においては、一つの細胞から得られる情報量が増えることで検体単位でのデータ容量は膨大なものとなる。例えば、深層学習アルゴリズムを用いて個々の細胞の分類を行うには、細胞毎の特徴を抽出するために個々の細胞から取得する情報量を大幅に増やす必要がある。特許文献1には、大幅に増加した情報量を、要求された処理能力の範囲内で処理可能なシステムは開示されていない。
If the amount of information used for cell classification is increased in order to improve the accuracy of cell classification, the amount of information obtained from one cell will increase in samples such as blood and urine containing multiple cells, so that the amount of information can be obtained on a sample-by-sample basis. The data capacity will be enormous. For example, in order to classify individual cells using a deep learning algorithm, it is necessary to significantly increase the amount of information acquired from each cell in order to extract the characteristics of each cell. Patent Document 1 does not disclose a system capable of processing a significantly increased amount of information within the required processing capacity.
本発明の一態様は、検体に含まれる複数の細胞から得られたデータを分析する構成において、大幅に増加する情報量の細胞のデータを、要求された処理能力の要求を満たすことが可能な細胞分析方法、細胞分析装置を提供することを目的とする。
In one aspect of the present invention, in a configuration for analyzing data obtained from a plurality of cells contained in a sample, it is possible to satisfy the required processing capacity of cell data with a significantly increased amount of information. It is an object of the present invention to provide a cell analysis method and a cell analysis apparatus.
上記の課題を解決するために、本発明の一態様に係る細胞分析方法は、ホストプロセッサ(3001、4831、6001、8111)と、並列処理プロセッサ(3002、4833、6002、8112)とを含む細胞分析装置(4000、4000’、4000'')において、ホストプロセッサ(3001、4831、6001、8111)による制御に基づいて、検体中の複数の細胞の各々に関するデータを取得し、並列処理プロセッサ(3002、4833、6002、8112)によって、前記データに関する並列処理を実行し、並列処理の結果に基づき、複数の細胞の各々について細胞種別に関する情報を生成する、ことを含む。
In order to solve the above problems, the cell analysis method according to one aspect of the present invention is a cell including a host processor (3001, 4831, 6001, 8111) and a parallel processing processor (3002, 4833, 6002, 8112). In the analyzer (4000, 4000', 4000''), data about each of the plurality of cells in the sample is acquired under the control of the host processor (3001, 4831, 6001, 8111), and the parallel processing processor (3002). , 4833, 6002, 8112), including performing a parallel process on the data and generating information about the cell type for each of the plurality of cells based on the result of the parallel process.
上記の課題を解決するために、本発明の別の態様に係る細胞分析方法は、測定ユニット(400、400a、500、500a、700)によって細胞を測定し、測定ユニット(400、400a、500、500a、700)とインターネットまたはイントラネットを介さずに接続された並列処理プロセッサ(3002、4833、6002、8112)によって、前記測定に基づく細胞に関するデータの並列処理を実行し、並列処理の結果に基づき、前記細胞の細胞種別に関する情報を生成する、ことを含む。
In order to solve the above-mentioned problems, in the cell analysis method according to another aspect of the present invention, cells are measured by a measurement unit (400, 400a, 500, 500a, 700), and the measurement unit (400, 400a, 500, A parallel processing processor (3002, 4833, 6002, 8112) connected to the 500a, 700) without an internet or intranet performs parallel processing of data on cells based on the measurement, and based on the result of the parallel processing, Includes generating information about the cell type of the cell.
上記の課題を解決するために、本発明の別の態様に係る細胞分析方法は、細胞分析装置(4000、4000’、4000'')に搭載された測定ユニット(400、400a、500、500a、700)によって検体を吸引し、吸引された検体中の細胞に関するデータを生成し、前記データに関する並列処理を、細胞分析装置(4000、4000’、4000'')に搭載された並列処理プロセッサ(3002、4833、6002、8112)で実行し、並列処理プロセッサ(3002、4833、6002、8112)が実行する並列処理の結果に基づき、細胞の細胞種別に関する情報を生成する、ことを含む。
In order to solve the above problems, the cell analysis method according to another aspect of the present invention is a measurement unit (400, 400a, 500, 500a,) mounted on a cell analyzer (4000, 4000', 4000''). The sample is aspirated by 700), data on the cells in the aspirated sample is generated, and parallel processing on the data is performed by a parallel processing processor (3002) mounted on a cell analyzer (4000, 4000', 4000''). , 4833, 6002, 8112) and generate information about the cell type of the cell based on the result of the parallel processing performed by the parallel processing processor (3002, 4833, 6002, 8112).
上記の課題を解決するために、本発明の一態様に係る細胞分析装置は、検体に含まれる複数の細胞を測定する測定ユニット(400、400a、500、500a、700)と、複数の細胞の分析に関する情報処理を行うプロセッサ(3001、4831、6001、8111)と、並列処理プロセッサ(3002、4833、6002、8112)と、を備え、測定ユニット(400、400a、500、500a、700)は、複数の細胞の各々に関するデータを取得し、並列処理プロセッサ(3002、4833、6002、8112)は、前記データに関する並列処理を実行し、プロセッサ(3001、4831、6001、8111)は、並列処理の結果に基づいて生成された、複数の細胞の各々の細胞種別に関する情報を処理する、ことを含む。
In order to solve the above problems, the cell analyzer according to one aspect of the present invention includes a measurement unit (400, 400a, 500, 500a, 700) for measuring a plurality of cells contained in a sample, and a plurality of cells. A processor (3001, 4831, 6001, 8111) for performing information processing related to analysis, a parallel processing processor (3002, 4833, 6002, 8112), and a measurement unit (400, 400a, 500, 500a, 700) are provided. Data on each of the plurality of cells is acquired, the parallel processing processor (3002, 4833, 6002, 8112) executes the parallel processing on the data, and the processor (3001, 4831, 6001, 8111) is the result of the parallel processing. Includes processing information about each cell type of a plurality of cells generated on the basis of.
複数の細胞を大容量のデータに基づいて分析しつつ、処理能力の要求を満たすことが可能となる。
It is possible to meet the processing capacity requirements while analyzing multiple cells based on a large amount of data.
以下、本発明の概要及び実施の形態を、添付の図面を参照して詳細に説明する。なお、以下の説明及び図面において、同じ符号は同じ又は類似の構成要素を示すこととし、よって、同じ又は類似の構成要素に関する説明を省略する。
Hereinafter, the outline and embodiments of the present invention will be described in detail with reference to the accompanying drawings. In the following description and drawings, the same reference numerals indicate the same or similar components, and thus the description of the same or similar components will be omitted.
[1.細胞の分析方法]
本実施形態は、ホストプロセッサと、並列処理プロセッサとを含む細胞分析装置において、前記ホストプロセッサによる制御に基づいて細胞の各々に関するデータを取得し、前記並列処理プロセッサで前記データに関する並列処理を実行し、前記並列処理の結果に基づき、前記細胞の各々について細胞種別に関する情報を生成する、ことを含む細胞分析方法を開示する。 [1. Cell analysis method]
In the present embodiment, in a cell analyzer including a host processor and a parallel processing processor, data regarding each of the cells is acquired based on control by the host processor, and parallel processing regarding the data is executed by the parallel processing processor. Discloses a cell analysis method comprising generating information about a cell type for each of the cells based on the results of the parallel treatment.
本分析方法によれば、1検体あたり数百メガバイトから数ギガバイトに及ぶ膨大な容量のデータを分析する場合であっても、ホストプロセッサとは別に設けられた並列処理プロセッサによって細胞のデータに関する処理を並列で実行できる。そのため、例えば膨大な容量のデータを用いる深層学習アルゴリズムによって細胞を分類する場合であっても、細胞分析装置のみでデータの処理が完結する。例えば、深層学習アルゴリズムを格納した分析用サーバに、インターネットまたはイントラネットを介して細胞のデータを送信する必要がない。したがって、本分析方法によれば、細胞分析装置から分析用サーバに大容量のデータを送信し、分析用サーバから返ってくる分析結果を取得する必要がなく、細胞の分類精度を向上しながらも細胞分析装置の処理能力を維持することができる。
According to this analysis method, even when analyzing a huge amount of data ranging from hundreds of megabytes to several gigabytes per sample, processing related to cell data is performed by a parallel processing processor provided separately from the host processor. Can be executed in parallel. Therefore, for example, even when cells are classified by a deep learning algorithm using a huge amount of data, the data processing is completed only by the cell analyzer. For example, it is not necessary to send cell data to an analysis server that stores a deep learning algorithm via the Internet or an intranet. Therefore, according to this analysis method, it is not necessary to send a large amount of data from the cell analyzer to the analysis server and acquire the analysis result returned from the analysis server, while improving the cell classification accuracy. The processing capacity of the cell analyzer can be maintained.
図1を用いて、本実施形態の概要の例を説明する。図1(a)は従来法の白血球分類を模式的に表す図であり、図1(b)は本法の白血球分類を模式的に示す図である。図1(a)、図1(b)において、FSCは前方散乱光の信号強度を示すアナログ信号を示し、SSCは側方散乱光のアナログ信号を示し、SFLは側方蛍光の信号強度を示すアナログ信号を示す。図1(a)に図示されるように、従来法では、検体に含まれる個々の細胞をフローサイトメータで測定し、前方散乱光、側方散乱光、側方蛍光のそれぞれのアナログ信号のパルスのピーク高さを前方散乱光強度、側方散乱光強度、側方蛍光強度として取得する。次に、細胞を前方散乱光強度、側方散乱光強度、側方蛍光強度に基づき、特定の種別に分類する。細胞を分類した結果は図1(a)に示すようなスキャッタグラムとして表示される。図1(a)のスキャッタグラムにおいて、横軸は側方散乱光、縦軸は側方蛍光の強度を示す。
An example of the outline of the present embodiment will be described with reference to FIG. FIG. 1A is a diagram schematically showing the leukocyte classification of the conventional method, and FIG. 1B is a diagram schematically showing the leukocyte classification of the present method. In FIGS. 1 (a) and 1 (b), FSC indicates an analog signal indicating the signal intensity of the forward scattered light, SSC indicates an analog signal of the side scattered light, and SFL indicates the signal intensity of the side fluorescence. Shows an analog signal. As shown in FIG. 1 (a), in the conventional method, individual cells contained in a sample are measured with a flow cytometer, and the pulses of each analog signal of forward scattered light, side scattered light, and side fluorescence are measured. The peak height of is acquired as the forward scattered light intensity, the lateral scattered light intensity, and the lateral fluorescence intensity. Next, the cells are classified into specific types based on the forward scattered light intensity, the lateral scattered light intensity, and the lateral fluorescence intensity. The result of classifying the cells is displayed as a scattergram as shown in FIG. 1 (a). In the scattergram of FIG. 1 (a), the horizontal axis indicates the lateral scattered light, and the vertical axis indicates the intensity of the lateral fluorescence.
従来の白血球分類は、図1(a)に示されるように、アナログ波形のピーク高さの情報のみに基づいて血球の種別を判定していた。これに対して、本実施形態の方法では、検体中の細胞に関するデータとして、図1(b)に示されるように、1つの細胞からフローサイトメータによって取得されるアナログ信号の波形全体を解析対象のデータとして分析することで細胞を分類する。図1(b)にはフローサイトメータによって得られるアナログ信号を描画した波形を示しているが、後述するように、本実施形態において検体中の細胞に関するデータは、このアナログ信号をA/D変換することによって得られる複数時点の信号強度を示す値を要素とするデジタルデータ(後述する波形データ)を意図している。このデジタルデータ群は行列データであり、本実施形態では、例えば、一行複数列の行列データ(すなわち、一次元の配列データ)である。
In the conventional leukocyte classification, as shown in FIG. 1 (a), the type of blood cell was determined based only on the information of the peak height of the analog waveform. On the other hand, in the method of the present embodiment, as the data regarding the cells in the sample, as shown in FIG. 1 (b), the entire waveform of the analog signal acquired from one cell by the flow cytometer is analyzed. The cells are classified by analyzing as the data of. FIG. 1B shows a waveform obtained by drawing an analog signal obtained by a flow cytometer, but as will be described later, the data regarding the cells in the sample in the present embodiment A / D-convert the analog signal. It is intended to be digital data (waveform data described later) having a value indicating a signal strength at a plurality of time points obtained as an element. This digital data group is matrix data, and in this embodiment, it is, for example, one-row and multiple-column matrix data (that is, one-dimensional array data).
本実施形態では、図1(b)に示される訓練前の深層学習アルゴリズム50に、細胞種別毎の波形データを学習させる。そして、検体に含まれる細胞種別が未知の細胞の波形データを訓練済みの深層学習アルゴリズム60に入力することで、深層学習アルゴリズム60から、細胞の各々について細胞種別の判定結果を導く。深層学習アルゴリズム50、60は、人工知能アルゴリズムの一つであり、多層の中間層を含むニューラルネットワークで構成される。本実施形態では、訓練済みの深層学習アルゴリズム60に従って波形データの分析に関する処理を実行するにあたり、深層学習アルゴリズム60に多量に含まれる行列演算を、細胞分析装置に搭載された並列処理プロセッサを用いて、並列処理で実行する。細胞分析装置は、並列処理を実行可能な並列処理プロセッサと、並列処理プロセッサに並列処理を実行させる実行命令プロセッサ(以下、単にプロセッサという)とを備える。
In this embodiment, the pre-training deep learning algorithm 50 shown in FIG. 1 (b) is used to learn waveform data for each cell type. Then, by inputting the waveform data of the cell whose cell type is unknown contained in the sample into the trained deep learning algorithm 60, the determination result of the cell type is derived from the deep learning algorithm 60 for each cell. The deep learning algorithms 50 and 60 are one of the artificial intelligence algorithms, and are composed of a neural network including a multi-layered intermediate layer. In the present embodiment, in executing the processing related to the analysis of waveform data according to the trained deep learning algorithm 60, a large amount of matrix operations included in the deep learning algorithm 60 are performed by using a parallel processing processor mounted on the cell analyzer. , Execute in parallel processing. The cell analyzer includes a parallel processing processor capable of executing parallel processing and an execution instruction processor (hereinafter, simply referred to as a processor) that causes the parallel processing processor to execute parallel processing.
以下、細胞種別を判定する目的で分析に供される生体試料中の個々の細胞を「分析対象の細胞」ともいう。言い換えると、生体試料は、複数個の分析対象の細胞を含みうる。複数個の細胞は、分析対象となる複数種別の細胞を含みうる。
Hereinafter, individual cells in a biological sample used for analysis for the purpose of determining the cell type are also referred to as "cells to be analyzed". In other words, the biological sample may contain multiple cells to be analyzed. The plurality of cells may include a plurality of types of cells to be analyzed.
生体試料として、被検者から採取された生体試料を挙げることができる。例えば、生体試料は、例えば、静脈血、動脈血等の末梢血、尿、血液及び尿以外の体液を含み得る。血液及び尿以外の体液として、骨髄液、腹水、胸水、脳脊髄液等を含みうる。以下、血液及び尿以外の体液を単に「体液」という場合がある。血液試料は、細胞数の計数及び細胞種別の判定ができる状態である限り、制限されない。血液は、好ましくは末梢血である。例えば、血液は、エチレンジアミン四酢酸塩ナトリウム塩又はカリウム塩)、ヘパリンナトリウム等の抗凝固剤を使用して採血された末梢血を挙げることができる。末梢血は、動脈から採取されても静脈から採取されてもよい。
As a biological sample, a biological sample collected from a subject can be mentioned. For example, the biological sample may contain, for example, peripheral blood such as venous blood, arterial blood, urine, blood and body fluids other than urine. Body fluids other than blood and urine may include spinal fluid, ascites, pleural effusion, cerebrospinal fluid and the like. Hereinafter, body fluids other than blood and urine may be simply referred to as "body fluids". The blood sample is not limited as long as the number of cells can be counted and the cell type can be determined. The blood is preferably peripheral blood. For example, the blood may be peripheral blood collected using an anticoagulant such as ethylenediamine tetraacetate sodium salt or potassium salt) and heparin sodium. Peripheral blood may be taken from an artery or a vein.
本実施形態において判定しようとする細胞種別は、形態学的な分類に基づく細胞種別を基準とするものであり、生体試料の種類に応じて異なる。生体試料が血液である場合であって、血液が健常者から採血されたものである場合、本実施形態において判定しようとする細胞種別には、例えば、赤血球、白血球等の有核細胞、血小板等が含まれる。有核細胞には、例えば、好中球、リンパ球、単球、好酸球、好塩基球が含まれる。好中球には、例えば、分葉核好中球及び桿状核好中球が含まれる。一方、血液が非健常者から採血されたものである場合、有核細胞には、例えば、幼若顆粒球及び異常細胞からなる群から選択される少なくとも一種が含まれる場合がある。このような細胞も本実施形態において判定しようとする細胞種別に含まれる。幼若顆粒球には、例えば、後骨髄球、骨髄球、前骨髄球、骨髄芽球等の細胞が含まれ得る。
The cell type to be determined in this embodiment is based on the cell type based on the morphological classification, and differs depending on the type of the biological sample. When the biological sample is blood and the blood is collected from a healthy person, the cell types to be determined in the present embodiment include, for example, erythrocytes, nucleated cells such as leukocytes, platelets and the like. Is included. Nucleated cells include, for example, neutrophils, lymphocytes, monocytes, eosinophils, basophils. Neutrophils include, for example, lobulated nucleus neutrophils and rod-shaped nucleus neutrophils. On the other hand, when the blood is collected from an unhealthy person, the nucleated cells may include, for example, at least one selected from the group consisting of immature granulocytes and abnormal cells. Such cells are also included in the cell type to be determined in this embodiment. Immature granulocytes can include, for example, cells such as metamyelocytes, myelocytes, promyelocytes, myeloblasts and the like.
また、有核細胞には、正常細胞の他、健常人の末梢血には含まれない異常細胞が含まれていてもよい。異常細胞の例は、所定の疾患に罹患した際に出現する細胞であり、例えば腫瘍細胞である。造血系の場合、所定の疾患は、例えば、骨髄異型性症候群、急性骨髄芽球性白血病、急性骨髄芽球性白血病、急性前骨髄球性白血病、急性骨髄単球性白血病、急性単球性白血病、赤白血病、急性巨核芽球性白血病、急性骨髄性白血病、急性リンパ球性白血病、リンパ芽球性白血病、慢性骨髄性白血病、又は慢性リンパ球性白血病等の白血病、ホジキンリンパ腫、非ホジキンリンパ腫等の悪性リンパ腫、及び多発性骨髄腫よりなる群から選択される疾患であり得る。
In addition to normal cells, nucleated cells may contain abnormal cells that are not contained in the peripheral blood of a healthy person. Examples of abnormal cells are cells that appear when suffering from a given disease, such as tumor cells. In the case of the hematopoietic system, certain diseases include, for example, myelodystrophy syndrome, acute myeloblastic leukemia, acute myeloblastic leukemia, acute premyelocytic leukemia, acute myelomonocytic leukemia, acute monocytic leukemia. , Leukemia, acute giant nuclear blast leukemia, acute myeloid leukemia, acute lymphocytic leukemia, lymphoblastic leukemia, chronic myeloid leukemia, or chronic lymphocytic leukemia, hodgkin lymphoma, non-hodgkin lymphoma, etc. It can be a disease selected from the group consisting of malignant lymphoma of leukemia and multiple myeloma.
さらに、異常細胞には、例えば、リンパ芽球、形質細胞、異型リンパ球、反応性リンパ球、前赤芽球、好塩基性赤芽球、多染性赤芽球、正染性赤芽球、前巨赤芽球、好塩基性巨赤芽球、多染性巨赤芽球、及び正染性巨赤芽球等の有核赤血球である赤芽球、及びミクロメガカリオサイトを含む巨核球等の健常人の末梢血では通常認められない細胞が含まれ得る。
Further, abnormal cells include, for example, lymphoblasts, plasma cells, atypical erythroblasts, reactive erythroblasts, pre-erythroblasts, basic erythroblasts, polychromatic erythroblasts, orthochromatic erythroblasts. , Pre-major erythroblasts, basic erythroblasts, polychromatic giant erythroblasts, and erythroblasts that are nucleated erythroblasts such as orthochromatic giant erythroblasts, and giant nuclei containing micromegacariosites. It may contain cells that are not normally found in the peripheral blood of healthy individuals such as erythroblasts.
また、生体試料が尿である場合、本実施形態において判定しようとする細胞種別には、例えば、赤血球、白血球、移行上皮、扁平上皮等の上皮細胞等が含まれ得る。異常細胞としては、例えば、細菌、糸状菌、酵母等の真菌、腫瘍細胞等が含まれ得る。
Further, when the biological sample is urine, the cell type to be determined in the present embodiment may include, for example, erythrocytes, leukocytes, transitional epithelium, epithelial cells such as squamous epithelium and the like. Examples of the abnormal cells may include bacteria, filamentous fungi, fungi such as yeast, tumor cells and the like.
生体試料が腹水、胸水、髄液等の通常血液成分を含まない体液である場合、細胞種別には、例えば、赤血球、白血球、大型細胞を含みうる。ここでいう「大型細胞」とは、体腔内膜又は内臓の腹膜から剥がれた細胞で白血球より大きいものを指し、例えば、中皮細胞、組織球、腫瘍細胞等が該当する。
When the biological sample is a body fluid that does not normally contain blood components such as ascites, pleural effusion, and cerebrospinal fluid, the cell type may include, for example, red blood cells, leukocytes, and large cells. The term "large cell" as used herein refers to a cell detached from the peritoneum of the body cavity or the viscera, which is larger than a leukocyte, and corresponds to, for example, a mesothelial cell, a histiocyte, a tumor cell, or the like.
生体試料が骨髄液である場合、本実施形態において判定しようとする細胞種別には、正常な細胞として、成熟した血球細胞と幼若な血球系細胞を含みうる。成熟した血球細胞には、例えば、赤血球、白血球等の有核細胞、血小板等が含まれる。白血球等の有核細胞には、例えば、好中球、リンパ球、形質細胞、単球、好酸球、好塩基球が含まれる。好中球には、例えば、分葉核好中球及び桿状核好中球が含まれる。幼若な血球系細胞には、例えば、造血系幹細胞、幼若顆粒球系細胞、幼若リンパ球系細胞、幼若単球系細胞、幼若赤血球系細胞、巨核球系細胞、間葉系細胞等が含まれる。幼若顆粒球には、例えば、後骨髄球、骨髄球、前骨髄球、骨髄芽球等の細胞が含まれ得る。幼若リンパ球系細胞には、例えば、リンパ芽球等が含まれる。幼若単球系細胞には、単芽球等が含まれる。幼若赤血球系細胞には、例えば、前赤芽球、好塩基性赤芽球、多染性赤芽球、正染性赤芽球、前巨赤芽球、好塩基性巨赤芽球、多染性巨赤芽球、及び正染性巨赤芽球等の有核赤血球が含まれる。巨核球系細胞には、例えば、巨核芽球等が含まれる。
When the biological sample is bone marrow fluid, the cell type to be determined in this embodiment may include mature blood cell cells and immature blood cell lineage cells as normal cells. Mature blood cell cells include, for example, erythrocytes, nucleated cells such as leukocytes, platelets and the like. Nucleated cells such as leukocytes include, for example, neutrophils, lymphocytes, plasma cells, monocytes, eosinophils, and basophils. Neutrophils include, for example, lobulated nucleus neutrophils and rod-shaped nucleus neutrophils. Immature hematopoietic cells include, for example, hematopoietic stem cells, immature granulocyte cells, immature lymphocytic cells, immature monocytic cells, immature erythrocyte cells, megakaryocytic cells, mesenchymal. Includes cells and the like. Immature granulocytes can include, for example, cells such as metamyelocytes, myelocytes, promyelocytes, myeloblasts and the like. Immature lymphocytic cells include, for example, lymphoblasts. Immature monoblastic cells include monoblasts and the like. Immature erythroblasts include, for example, pre-erythroblasts, basic erythroblasts, polychromatic erythroblasts, orthochromatic erythroblasts, pre-giant erythroblasts, basic giant erythroblasts, etc. Includes polychromatic giant erythroblasts and nucleated red blood cells such as orthochromatic giant erythroblasts. Megakaryocyte cells include, for example, megakaryoblasts and the like.
骨髄に含まれ得る異常細胞としては、例えば、上述した骨髄異型性症候群、急性骨髄芽球性白血病、急性骨髄芽球性白血病、急性前骨髄球性白血病、急性骨髄単球性白血病、急性単球性白血病、赤白血病、急性巨核芽球性白血病、急性骨髄性白血病、急性リンパ球性白血病、リンパ芽球性白血病、慢性骨髄性白血病、又は慢性リンパ球性白血病等の白血病、ホジキンリンパ腫、非ホジキンリンパ腫等の悪性リンパ腫、及び多発性骨髄腫よりなる群から選択される造血系腫瘍細胞、骨髄以外の器官に発生した悪性腫瘍の転移腫瘍細胞を挙げることができる。
Examples of the abnormal cells that can be contained in the bone marrow include the above-mentioned myeloid atypical syndrome, acute myeloblastic leukemia, acute myeloblastic leukemia, acute premyelocytic leukemia, acute myelomonocytic leukemia, and acute monosphere. Leukemias such as sexual leukemia, erythrocyte leukemia, acute giant nuclear blast leukemia, acute myeloid leukemia, acute lymphocytic leukemia, lymphoblastic leukemia, chronic myeloid leukemia, or chronic lymphocytic leukemia, hodgkin lymphoma, non-hodgkin Examples thereof include malignant lymphoma such as lymphoma, hematopoietic tumor cells selected from the group consisting of multiple myeloma, and metastatic tumor cells of malignant tumors developed in organs other than bone marrow.
図1には、細胞から得られる信号として、フローセルを流れる細胞に光を照射して得られる光学的信号である前方散乱光信号、側方散乱光信号、側方蛍光信号を例示しているが、細胞の特徴を表し、細胞を種別ごとに分類できる信号であれば特に制限されない。
FIG. 1 illustrates forward scattered light signals, side scattered light signals, and side fluorescent signals, which are optical signals obtained by irradiating cells flowing through a flow cell with light, as signals obtained from cells. , It is not particularly limited as long as it is a signal that represents the characteristics of cells and can classify cells by type.
細胞から得られる信号としては、細胞の形態学的特徴を表す信号、化学的特徴を表す信号、物理的特徴を表す信号、遺伝学的特徴を表す信号のいずれでもよいが、好ましくは細胞の形態学的特徴を表す信号である。細胞の形態学的特徴を表す信号は、好ましくは、細胞から得られる光学的信号である。
The signal obtained from the cell may be any of a signal representing the morphological characteristics of the cell, a signal representing the chemical characteristics, a signal representing the physical characteristics, and a signal representing the genetic characteristics, but the morphology of the cells is preferable. It is a signal that represents a scientific feature. The signal representing the morphological characteristics of the cell is preferably an optical signal obtained from the cell.
光学的信号は、好ましくは、細胞に光を照射することで光学的な応答として得られる光信号である。光信号は、光散乱に基づく信号、光吸収に基づく信号、透過光に基づく信号、及び蛍光に基づく信号から選択される少なくとも一種を含み得る。
The optical signal is preferably an optical signal obtained as an optical response by irradiating a cell with light. The optical signal may include at least one selected from a signal based on light scattering, a signal based on light absorption, a signal based on transmitted light, and a signal based on fluorescence.
光散乱に基づく信号は、光照射によって生じる散乱光信号および光照射によって生じる光損失信号を含み得る。散乱光信号は、照射光の進行方向に対する散乱光の受光角度に応じて、細胞の特徴を示す異なるパラメータとなる。前方散乱光信号は、細胞の大きさを表すパラメータとして用いられる。側方散乱光信号は、細胞の核の複雑さを表すパラメータとして用いられる。
The signal based on light scattering may include a scattered light signal generated by light irradiation and a light loss signal generated by light irradiation. The scattered light signal becomes a different parameter indicating the characteristics of the cell depending on the light receiving angle of the scattered light with respect to the traveling direction of the irradiation light. The forward scattered light signal is used as a parameter representing the size of the cell. The laterally scattered light signal is used as a parameter to represent the complexity of the cell's nucleus.
前方散乱光の「前方」は、光源から発せられた光の進行方向を意図する。「前方」には、照射光の角度を0度とした場合に受光角度が0から5度付近である前方低角、及び/又は受光角度5から20度付近である前方高角を含み得る。「側方」は、「前方」と重ならない限り制限されない。「側方」には、照射光の角度を0度とした場合、受光角度が25度から155度付近、好ましくは45度から135度付近、より好ましくは90度付近を含み得る。
The "forward" of the forward scattered light is intended to be the traveling direction of the light emitted from the light source. The "forward" may include a front low angle where the light receiving angle is around 0 to 5 degrees and / or a front high angle where the light receiving angle is around 5 to 20 degrees when the angle of the irradiation light is 0 degrees. "Side" is not restricted as long as it does not overlap with "forward". The "side" may include a light receiving angle of around 25 to 155 degrees, preferably around 45 to 135 degrees, and more preferably around 90 degrees, where the angle of the irradiation light is 0 degrees.
光散乱に基づく信号は、偏光または偏光解消を信号の成分として含んでもよい。例えば、細胞に光を照射して生じる散乱光を偏光板を通して受光することで、特定角度に偏光した散乱光のみを受光することができる。また、偏光板を通して光を細胞に照射し、生じた散乱光を照射用の偏光板と異なる角度の偏光のみを透過する偏光板を通して受光することで、偏光解消散乱光のみを受光することができる。
A signal based on light scattering may include polarization or depolarization as a component of the signal. For example, by irradiating a cell with light and receiving the scattered light generated through the polarizing plate, it is possible to receive only the scattered light polarized at a specific angle. Further, by irradiating the cells with light through the polarizing plate and receiving the generated scattered light through the polarizing plate that transmits only the polarization at an angle different from that of the polarizing plate for irradiation, only the depolarized scattered light can be received. ..
光損失信号は、光が細胞に照射されて散乱することで受光部における受光量が減少することに基づく、受光量の損失量を表す。光損失信号は、好ましくは、照射光の光軸方向における光損失(軸方向光損失)として得られる。光損失信号は、細胞がフローセルを流れていない状態で受光部における受光量を100%としたときの、細胞がフローセルを流れた時の受光量の割合として表すことができる。軸方向光損失は、前方散乱光信号と同様に細胞の大きさを表すパラメータとして用いられるが、細胞が透光性を有する場合とそうでない場合とで得られる信号は異なる。
The light loss signal represents the loss amount of the light receiving amount based on the fact that the light receiving amount in the light receiving portion decreases due to the light being irradiated to the cells and scattered. The light loss signal is preferably obtained as a light loss (axial light loss) in the optical axis direction of the irradiation light. The light loss signal can be expressed as a ratio of the light receiving amount when the cell flows through the flow cell when the light receiving amount in the light receiving portion is 100% in a state where the cell does not flow through the flow cell. Axial light loss is used as a parameter indicating the size of a cell like the forward scattered light signal, but the signal obtained differs depending on whether the cell has translucency or not.
蛍光に基づく信号は、蛍光物質によって標識した細胞に対して光を照射することで励起される蛍光であってもよいし、非染色の細胞から生じる自家蛍光であってもよい。蛍光物質は、核酸や膜タンパクに結合する蛍光色素であってもよいし、細胞の特定のタンパク質に結合する抗体を蛍光色素で修飾した標識抗体であってもよい。
The fluorescence-based signal may be fluorescence excited by irradiating cells labeled with a fluorescent substance with light, or autofluorescence generated from unstained cells. The fluorescent substance may be a fluorescent dye that binds to a nucleic acid or a membrane protein, or may be a labeled antibody obtained by modifying an antibody that binds to a specific protein of a cell with a fluorescent dye.
光学的信号は、細胞に対して光を照射し、照射された細胞を撮像することによって得られる画像データの形式で取得してもよい。画像データは、いわゆるイメージングフローサイトメータによって、流路を流れる個々の細胞をTDIカメラやCCDカメラ等の撮像素子によって撮像することで得ることができる。または、スライドガラス上に細胞を含む検体または測定試料を塗布し、散布し、または点着し、スライドガラスを撮像素子によって撮像することで細胞の画像データを得てもよい。
The optical signal may be acquired in the form of image data obtained by irradiating the cells with light and imaging the irradiated cells. Image data can be obtained by imaging individual cells flowing through a flow path with an image sensor such as a TDI camera or a CCD camera using a so-called imaging flow cytometer. Alternatively, image data of cells may be obtained by applying a sample containing cells or a measurement sample on a slide glass, spraying or instilling the sample, and imaging the slide glass with an image pickup element.
細胞から得られる信号は、光学的信号に限られず、細胞から得られる電気的信号であってもよい。電気的信号は、例えば、フローセルに直流電流を印加し、細胞がフローセルを流れることによって生じるインピーダンスの変化を電気的信号として用いてもよい。このようにして得られる電気的信号は細胞の容積を反映するパラメータとなる。または、電気的信号は、フローセルを流れる細胞に無線周波を印加したときのインピーダンスの変化を電気的信号としてもよい。このようにして得られる電気的信号は細胞の伝導度を反映するパラメータとなる。
The signal obtained from the cell is not limited to the optical signal, but may be an electrical signal obtained from the cell. As the electrical signal, for example, a direct current may be applied to the flow cell, and the change in impedance caused by the cell flowing through the flow cell may be used as the electrical signal. The electrical signal thus obtained is a parameter that reflects the volume of the cell. Alternatively, the electrical signal may be a change in impedance when a radio frequency is applied to cells flowing through the flow cell as an electrical signal. The electrical signal thus obtained is a parameter that reflects the conductivity of the cell.
細胞から得られる信号は、上述の細胞から得られる信号のうち少なくとも2種類以上の信号を組み合わせてもよい。複数の信号を組み合わせることで、細胞の特徴を多面的に分析することができ、より高精度な細胞の分類が可能になる。組み合わせは、例えば、複数の光学的信号、例えば前方散乱光信号、側方散乱光信号、蛍光信号のうち少なくとも2つを組み合わせてもよいし、角度の異なる散乱光信号、例えば低角度散乱光信号と高角度散乱光信号を組み合わせてもよい。または光学的信号と電気的信号を組み合わせてもよく、組み合わせる信号の種類および数は特に制限されない。
The signal obtained from the cell may be a combination of at least two or more types of signals obtained from the above-mentioned cell. By combining multiple signals, cell characteristics can be analyzed from multiple perspectives, enabling more accurate cell classification. The combination may be, for example, a combination of at least two of a plurality of optical signals, such as a forward scattered light signal, a side scattered light signal, and a fluorescent signal, or a scattered light signal having a different angle, for example, a low angle scattered light signal. And high angle scattered light signals may be combined. Alternatively, an optical signal and an electrical signal may be combined, and the type and number of the combined signals are not particularly limited.
本実施形態における、細胞の分析方法において、細胞種別の判定は、深層学習アルゴリズムを使用する方法に限られない。流路内の所定位置を通過する個々の細胞から、前記細胞毎に、前記細胞が前記所定位置を通過している間の複数の時点において信号強度を取得し、取得した個々の細胞に関する複数の時点における信号強度をパターンとして認識した結果に基づいて細胞種別を判定してもよい。パターンは、複数時点の信号強度の数値パターンとして認識してもよく、複数時点の信号強度をグラフとしてプロットした場合の形状パターンとして認識してもよい。数値パターンとして認識する場合には、分析対象である細胞の数値パターンと、既に細胞種別が既知である数値パターンとを比較することにより、細胞種別を判定することができる。分析対象である細胞の数値パターンと対照の数値パターンとの比較は、例えばスピアマンの順位相関、zスコア等を用いることができる。分析対象である細胞のグラフ形状のパターンと、既に細胞種別が既知であるグラフ形状のパターンとを比較することにより、細胞種別を判定することができる。分析対象である細胞のグラフ形状のパターンと、既に細胞種別が既知であるグラフ形状のパターンとの比較は、例えば、幾何学形状パターンマッチングを用いてもよいし、SIFT Descriptorに代表されるフィーチャーディスクリプターを用いてもよい。
In the cell analysis method in the present embodiment, the determination of the cell type is not limited to the method using the deep learning algorithm. From individual cells passing through a predetermined position in the flow path, signal intensities are obtained for each cell at multiple time points while the cell is passing through the predetermined position, and a plurality of acquired individual cells are obtained. The cell type may be determined based on the result of recognizing the signal strength at the time point as a pattern. The pattern may be recognized as a numerical pattern of signal strength at a plurality of time points, or may be recognized as a shape pattern when the signal strength at a plurality of time points is plotted as a graph. When recognizing as a numerical pattern, the cell type can be determined by comparing the numerical pattern of the cell to be analyzed with the numerical pattern whose cell type is already known. For comparison between the numerical pattern of the cell to be analyzed and the numerical pattern of the control, for example, Spearman's rank correlation, z-score, or the like can be used. The cell type can be determined by comparing the graph-shaped pattern of the cell to be analyzed with the graph-shaped pattern for which the cell type is already known. For comparison between the graph shape pattern of the cell to be analyzed and the graph shape pattern whose cell type is already known, for example, geometric shape pattern matching may be used, or a feature data represented by SIFT Descriptor may be used. A scripter may be used.
<細胞の分析方法の概要>
次に、図2、図3~図5に示す例を用いて訓練データ75の生成方法及び波形データの分析方法を説明する。 <Outline of cell analysis method>
Next, a method of generating thetraining data 75 and a method of analyzing the waveform data will be described with reference to the examples shown in FIGS. 2 and 3 to 5.
次に、図2、図3~図5に示す例を用いて訓練データ75の生成方法及び波形データの分析方法を説明する。 <Outline of cell analysis method>
Next, a method of generating the
<波形データ>
図2は、本分析方法において用いられる波形データを説明するための模式図である。図2(a)に示すように、細胞Cを含む検体をフローセルFCに流し、フローセルFCを流れる細胞Cに光を照射すると、光の進行方向に対して前方に前方散乱光FSCが生じる。同様に、光の進行方向に対して側方に側方散乱光SSCと側方蛍光SFLが生じる。前方散乱光は、第1受光部D1によって受光され、受光量に応じた信号が出力される。側方散乱光は、第2受光部D2によって受光され、受光量に応じた信号が出力される。側方蛍光は、第3受光部D3によって受光され、受光量に応じた信号が出力される。これにより、受光部D1~D3から、時間経過に伴う信号の変化を表すアナログ信号が出力される。前方散乱光に対応するアナログ信号を「前方散乱光信号」、側方散乱光に対応するアナログ信号を「側方散乱光信号」、側方蛍光に対応するアナログ信号を「蛍光信号」という。各アナログ信号の1つのパルスが一つの細胞に対応する。 <Waveform data>
FIG. 2 is a schematic diagram for explaining the waveform data used in this analysis method. As shown in FIG. 2A, when a sample containing cell C is flowed through the flow cell FC and the cells C flowing through the flow cell FC are irradiated with light, forward scattered light FSC is generated forward in the traveling direction of the light. Similarly, lateral scattered light SSC and lateral fluorescent SFL are generated laterally with respect to the traveling direction of light. The forward scattered light is received by the first light receiving unit D1, and a signal corresponding to the amount of received light is output. The laterally scattered light is received by the second light receiving unit D2, and a signal corresponding to the amount of light received is output. The lateral fluorescence is received by the third light receiving unit D3, and a signal corresponding to the amount of received light is output. As a result, analog signals representing changes in the signal over time are output from the light receiving units D1 to D3. The analog signal corresponding to the forward scattered light is called "forward scattered light signal", the analog signal corresponding to the side scattered light is called "side scattered light signal", and the analog signal corresponding to side fluorescence is called "fluorescent signal". One pulse of each analog signal corresponds to one cell.
アナログ信号は、A/D変換部に入力され、デジタル信号に変換される。図2(b)はA/D変換部によるデジタル信号への変換を模式的に示す図である。ここでは説明を簡略化するためアナログ信号をA/D変換部に直接入力するような図としている。アナログ信号のレベルをそのままデジタル信号に変換してもよいが、必要に応じて、ノイズ除去、ベースライン補正、正規化等の処理を行ってもよい。図2(b)に示すように、A/D変換部は、受光部D1~D3から入力されるアナログ信号のうち、前方散乱光信号のレベルが所定の閾値として設定されたレベルに至った時点を始点として、前方散乱光信号、側方散乱光信号、蛍光信号のサンプリングを行う。A/D変換部は、所定のサンプリングレート(例えば、10ナノ秒間隔で1024ポイントのサンプリング、80ナノ秒間隔で128ポイントのサンプリング、又は160ナノ秒間隔で64ポイントのサンプリング等)で、それぞれのアナログ信号をサンプリングする。
The analog signal is input to the A / D converter and converted into a digital signal. FIG. 2B is a diagram schematically showing conversion to a digital signal by the A / D conversion unit. Here, in order to simplify the explanation, the figure is such that the analog signal is directly input to the A / D conversion unit. The level of the analog signal may be converted into a digital signal as it is, but if necessary, processing such as noise reduction, baseline correction, and normalization may be performed. As shown in FIG. 2B, the A / D conversion unit reaches a time when the level of the forward scattered light signal among the analog signals input from the light receiving units D1 to D3 reaches a level set as a predetermined threshold value. As a starting point, the forward scattered light signal, the side scattered light signal, and the fluorescent signal are sampled. The A / D converter has each at a predetermined sampling rate (for example, sampling of 1024 points at intervals of 10 nanoseconds, sampling of 128 points at intervals of 80 nanoseconds, sampling of 64 points at intervals of 160 nanoseconds, etc.). Sampling analog signals.
図2(c)は、サンプリングによって得られる波形データを模式的に示す図である。サンプリングによって、一つの細胞に対応する波形データとして、複数の時点におけるアナログ信号レベルをデジタルに示す値を要素とする行列データが得られる。このようにしてA/D変換部は、一つの細胞に対応する前方散乱光のデジタル信号、側方散乱光のデジタル信号、側方蛍光のデジタル信号を生成する。A/D変換は、デジタル信号化された細胞数が所定数に達するまで、または検体をフローセルに流し始めてから所定時間が経過するまで繰り返される。これにより、図2(c)に示すように、一つの検体に含まれるN個の細胞の波形データを合体したデジタル信号が得られる。各細胞に対するサンプリングデータの集合(図2の例ではt=0nsからt=10240nsまで10ナノ秒毎に1024個のデジタル値の集合)を波形データと呼び、一つの検体から得られた波形データの集合をデジタル信号と呼ぶ。
FIG. 2C is a diagram schematically showing waveform data obtained by sampling. By sampling, as waveform data corresponding to one cell, matrix data having a value digitally indicating an analog signal level at a plurality of time points as an element can be obtained. In this way, the A / D conversion unit generates a digital signal of forward scattered light, a digital signal of laterally scattered light, and a digital signal of lateral fluorescence corresponding to one cell. The A / D conversion is repeated until the number of digitally signalized cells reaches a predetermined number, or until a predetermined time elapses from the start of flowing the sample into the flow cell. As a result, as shown in FIG. 2C, a digital signal obtained by combining the waveform data of N cells contained in one sample can be obtained. The set of sampling data for each cell (in the example of FIG. 2, a set of 1024 digital values every 10 nanoseconds from t = 0ns to t = 10240ns) is called waveform data, and the waveform data obtained from one sample is called waveform data. The set is called a digital signal.
A/D変換部によって生成された各々の波形データには、各々の細胞を識別するためのインデックスが付与されてもよい。インデックスは、例えば、生成された波形データの順に1~Nの整数が付与され、同じ細胞から得られた前方散乱光の波形データ、側方散乱光の波形データ、側方蛍光の波形データには、それぞれ、同一のインデックスが付与される。
Each waveform data generated by the A / D conversion unit may be given an index for identifying each cell. For the index, for example, an integer from 1 to N is given in the order of the generated waveform data, and the waveform data of the forward scattered light, the waveform data of the side scattered light, and the waveform data of the side fluorescence obtained from the same cell are given. , Each is given the same index.
一つの波形データは一つの細胞に対応するので、インデックスは測定された細胞に対応する。同じ細胞に対応する波形データに同一のインデックスが付与されることで、後述する深層学習アルゴリズムは、個々の細胞に対応する前方散乱光の波形データと、側方散乱光の波形データと、蛍光の波形データを1セットとして解析し、細胞の種別を分類できる。
Since one waveform data corresponds to one cell, the index corresponds to the measured cell. By assigning the same index to the waveform data corresponding to the same cell, the deep learning algorithm described later can be used for the waveform data of the forward scattered light, the waveform data of the lateral scattered light, and the fluorescence corresponding to the individual cells. Waveform data can be analyzed as a set to classify cell types.
<訓練データの生成>
図3は、細胞の種別を判定するための深層学習アルゴリズムを訓練するために使用される訓練データの生成方法の一例を示す模式図である。訓練データ75は、検体をフローサイトメータによって測定し、検体に含まれる細胞について得られた前方散乱光(FSC)のアナログ信号70a、側方散乱光(SSC)のアナログ信号70b、及び側方蛍光(SFL)のアナログ信号70cに基づいて生成される波形データである。波形データの取得方法は、上述のとおりである。 <Generation of training data>
FIG. 3 is a schematic diagram showing an example of a training data generation method used for training a deep learning algorithm for determining a cell type. Thetraining data 75 measures the sample with a flow cytometer, and the analog signal 70a of the forward scattered light (FSC), the analog signal 70b of the side scattered light (SSC), and the side fluorescence obtained for the cells contained in the sample. It is waveform data generated based on the analog signal 70c of (SFL). The method for acquiring waveform data is as described above.
図3は、細胞の種別を判定するための深層学習アルゴリズムを訓練するために使用される訓練データの生成方法の一例を示す模式図である。訓練データ75は、検体をフローサイトメータによって測定し、検体に含まれる細胞について得られた前方散乱光(FSC)のアナログ信号70a、側方散乱光(SSC)のアナログ信号70b、及び側方蛍光(SFL)のアナログ信号70cに基づいて生成される波形データである。波形データの取得方法は、上述のとおりである。 <Generation of training data>
FIG. 3 is a schematic diagram showing an example of a training data generation method used for training a deep learning algorithm for determining a cell type. The
訓練データ75は、例えば、フローサイトメータによって検体を測定し、その検体に含まれる細胞を従来法のスキャッタグラムに基づいて解析した結果、特定の細胞種別である可能性が高いと判断された細胞の波形データを用いることができる。血球計数装置を用いる例で説明すると、まず、血液検体をフローサイトメータで測定し、検体に含まれる個々の細胞の前方散乱光、側方散乱光、蛍光の波形データを蓄積しておく。側方散乱光強度(側方散乱光信号のパルスの高さ)と蛍光強度(蛍光信号のパルス高さ)に基づいて、細胞を好中球、リンパ球、単球、好酸球、好塩基球、幼若顆粒球、異常細胞の集団に分類する。分類された細胞種別に対応するラベル値をその細胞の波形データに付与することで、訓練データが得られる。例えば、好中球の集団に含まれる細胞の側方散乱光強度および側方蛍光強度の最頻値、平均値または中央値を求め、それらの値に基づいて代表的な細胞を特定し、それらの細胞の波形データに好中球に対応するラベル値「1」を付与することで訓練データを得ることができる。訓練データの生成方法はこれに限らず、例えばセルソータによって特定の細胞だけを回収しておき、その細胞をフローサイトメータによって測定し、得られた波形データに細胞のラベル値を付与することによって訓練データを得てもよい。
The training data 75 is, for example, a cell in which a sample is measured by a flow cytometer and the cells contained in the sample are analyzed based on a conventional scattergram, and as a result, it is determined that there is a high possibility of a specific cell type. Waveform data can be used. To explain using an example using a blood cell counter, first, a blood sample is measured with a flow cytometer, and waveform data of forward scattered light, side scattered light, and fluorescence of individual cells contained in the sample are accumulated. Based on lateral scattered light intensity (pulse height of lateral scattered light signal) and fluorescence intensity (pulse height of fluorescent signal), cells are neutrophils, lymphocytes, monocytes, eosinophils, basophils. Classify into a population of spheres, immature granulocytes, and abnormal cells. Training data can be obtained by assigning a label value corresponding to the classified cell type to the waveform data of the cell. For example, determine the mode, mean or median of lateral scattered light intensity and lateral fluorescence intensity of cells contained in a population of neutrophils, identify representative cells based on those values, and identify them. Training data can be obtained by assigning the label value "1" corresponding to the neutrophil to the waveform data of the cells of. The method of generating training data is not limited to this, for example, training is performed by collecting only specific cells with a cell sorter, measuring the cells with a flow cytometer, and assigning a cell label value to the obtained waveform data. Data may be obtained.
アナログ信号70a、70b、70cは、フローサイトメータによって好中球が測定されたときの前方散乱光信号、側方散乱光信号、側方蛍光信号をそれぞれ示す。これらのアナログ信号が、上述したようにA/D変換されると、前方散乱光信号の波形データ72a、側方散乱光信号の波形データ72b、側方蛍光信号の波形データ72cが得られる。波形データ72a、72b、72cそれぞれの内部で隣り合うセルは、サンプリングレートに対応する間隔、例えば10ナノ秒間隔での信号レベルを格納している。波形データ72a、72b、72cは、データの元となった細胞の種別を表すラベル値77と組み合わされて、各細胞に対応する3つの波形データ、言い換えれば3つの信号強度(前方散乱光の信号強度、側方散乱光の信号強度、及び側方蛍光の信号強度)のデータがセットとなるように訓練データ75として深層学習アルゴリズム50に入力される。図3の例では訓練データの元となった細胞が好中球であるため、波形データ72a、72b、72cに好中球であることを示すラベル値77として「1」が付与され、訓練データ75が生成される。図4にラベル値77の例を示す。訓練データ75は、細胞種別毎に生成されるため、ラベル値は、細胞種別に応じて異なるラベル値77が付与される。
The analog signals 70a, 70b, and 70c indicate a forward scattered light signal, a side scattered light signal, and a side fluorescence signal when the neutrophil is measured by the flow cytometer, respectively. When these analog signals are A / D converted as described above, waveform data 72a of the forward scattered light signal, waveform data 72b of the side scattered light signal, and waveform data 72c of the side fluorescent signal are obtained. Adjacent cells within each of the waveform data 72a, 72b, 72c store signal levels at intervals corresponding to the sampling rate, for example, at intervals of 10 nanoseconds. The waveform data 72a, 72b, 72c are combined with a label value 77 indicating the type of cell from which the data is based, and three waveform data corresponding to each cell, in other words, three signal intensities (forward scattered light signal). The data of intensity, signal intensity of laterally scattered light, and signal intensity of lateral fluorescence) are input to the deep learning algorithm 50 as training data 75 so as to be a set. In the example of FIG. 3, since the cell that is the source of the training data is neutrophil, the waveform data 72a, 72b, and 72c are given "1" as the label value 77 indicating that they are neutrophils, and the training data. 75 is generated. FIG. 4 shows an example of the label value 77. Since the training data 75 is generated for each cell type, the label value 77 is assigned differently depending on the cell type.
<深層学習の概要>
図3を例として、ニューラルネットワークの訓練の概要を説明する。ニューラルネットワーク50は、畳み込み層を有する畳み込みニューラルネットワークであることが好ましい。ニューラルネットワーク50における入力層50aのノード数は、入力される訓練データ75の波形データに含まれる配列の要素数に対応している。配列の要素数は、1つの細胞に対応する前方散乱光、側方散乱光、側方蛍光の波形データ72a、72b、72cの要素数の総和に等しい。図3の例では、波形データ72a、72b、72cのそれぞれが1024個の要素を含んでいるため、入力層50aのノード数は、1024×3=3072個となる。波形データ72a、72b、72cは、ニューラルネットワーク50の入力層50aに入力される。訓練データ75の各波形データのラベル値77は、ニューラルネットワークの出力層50bに入力され、ニューラルネットワーク50を訓練する。図3の符号50cは、中間層を示す。 <Overview of deep learning>
The outline of the training of the neural network will be described by taking FIG. 3 as an example. Theneural network 50 is preferably a convolutional neural network having a convolutional layer. The number of nodes of the input layer 50a in the neural network 50 corresponds to the number of elements of the array included in the waveform data of the input training data 75. The number of elements in the sequence is equal to the sum of the number of elements of the forward scattered light, the side scattered light, and the lateral fluorescence waveform data 72a, 72b, and 72c corresponding to one cell. In the example of FIG. 3, since each of the waveform data 72a, 72b, and 72c contains 1024 elements, the number of nodes of the input layer 50a is 1024 × 3 = 3072. The waveform data 72a, 72b, 72c are input to the input layer 50a of the neural network 50. The label value 77 of each waveform data of the training data 75 is input to the output layer 50b of the neural network to train the neural network 50. Reference numeral 50c in FIG. 3 indicates an intermediate layer.
図3を例として、ニューラルネットワークの訓練の概要を説明する。ニューラルネットワーク50は、畳み込み層を有する畳み込みニューラルネットワークであることが好ましい。ニューラルネットワーク50における入力層50aのノード数は、入力される訓練データ75の波形データに含まれる配列の要素数に対応している。配列の要素数は、1つの細胞に対応する前方散乱光、側方散乱光、側方蛍光の波形データ72a、72b、72cの要素数の総和に等しい。図3の例では、波形データ72a、72b、72cのそれぞれが1024個の要素を含んでいるため、入力層50aのノード数は、1024×3=3072個となる。波形データ72a、72b、72cは、ニューラルネットワーク50の入力層50aに入力される。訓練データ75の各波形データのラベル値77は、ニューラルネットワークの出力層50bに入力され、ニューラルネットワーク50を訓練する。図3の符号50cは、中間層を示す。 <Overview of deep learning>
The outline of the training of the neural network will be described by taking FIG. 3 as an example. The
<波形データの分析方法>
図5に分析対象である細胞の波形データを分析する方法の例を示す。波形データの分析方法では、分析対象の細胞からフローサイトメータによって取得した前方散乱光のアナログ信号80a、側方散乱光のアナログ信号80b、及び側方蛍光のアナログ信号80cから、上述の方法によって得られる波形データからなる分析データ85が生成される。 <Analysis method of waveform data>
FIG. 5 shows an example of a method for analyzing waveform data of cells to be analyzed. In the waveform data analysis method, theanalog signal 80a of the forward scattered light, the analog signal 80b of the side scattered light, and the analog signal 80c of the side fluorescence obtained from the cells to be analyzed by the flow cytometer are obtained by the above method. The analysis data 85 composed of the waveform data to be generated is generated.
図5に分析対象である細胞の波形データを分析する方法の例を示す。波形データの分析方法では、分析対象の細胞からフローサイトメータによって取得した前方散乱光のアナログ信号80a、側方散乱光のアナログ信号80b、及び側方蛍光のアナログ信号80cから、上述の方法によって得られる波形データからなる分析データ85が生成される。 <Analysis method of waveform data>
FIG. 5 shows an example of a method for analyzing waveform data of cells to be analyzed. In the waveform data analysis method, the
分析データ85と訓練データ75は、少なくとも取得条件を同じにすることが好ましい。取得条件とは、検体に含まれる細胞をフローサイトメータによって測定するための条件、例えば測定試料の調製条件、測定試料をフローセルに流すときの流速、フローセルに照射される光の強度、散乱光及び蛍光を受光する受光部の増幅率などを含む。取得条件は、さらに、アナログ信号をA/D変換するときのサンプリングレートも含む。
It is preferable that the analysis data 85 and the training data 75 have at least the same acquisition conditions. The acquisition conditions are the conditions for measuring the cells contained in the sample with a flow cytometer, for example, the preparation conditions of the measurement sample, the flow velocity when the measurement sample is passed through the flow cell, the intensity of the light applied to the flow cell, the scattered light and the scattered light. Includes the amplification factor of the light receiving part that receives fluorescence. The acquisition condition further includes a sampling rate at the time of A / D conversion of the analog signal.
分析対象の細胞がフローセルを流れると、前方散乱光のアナログ信号80a、側方散乱光のアナログ信号80b、及び側方蛍光のアナログ信号80cが得られる。これらのアナログ信号80a、80b、80cが上述したようにA/D変換されると、細胞毎に、信号強度を取得した時点が同期され、前方散乱光信号の波形データ82a、側方散乱光信号の波形データ82b、側方蛍光信号の波形データ82cとなる。波形データ82a、82b、82cは、各細胞の3つの信号強度(前方散乱光の信号強度、側方散乱光の信号強度、及び側方蛍光の信号強度)のデータがセットとなるように組み合わされて、分析データ85として深層学習アルゴリズム60に入力される。
When the cell to be analyzed flows through the flow cell, an analog signal 80a for forward scattered light, an analog signal 80b for side scattered light, and an analog signal 80c for side fluorescence are obtained. When these analog signals 80a, 80b, and 80c are A / D converted as described above, the time points at which the signal intensities are acquired are synchronized for each cell, and the waveform data 82a of the forward scattered light signal and the side scattered light signal are synchronized. The waveform data 82b and the waveform data 82c of the lateral fluorescence signal are obtained. The waveform data 82a, 82b, 82c are combined so that the data of the three signal intensities of each cell (the signal intensity of the forward scattered light, the signal intensity of the side scattered light, and the signal intensity of the side fluorescence) are set as a set. Then, it is input to the deep learning algorithm 60 as the analysis data 85.
分析データ85を訓練済みの深層学習アルゴリズム60を構成するニューラルネットワーク60の入力層60aに入力すると、出力層60bから、分析データ85に対応する細胞の種別に関する分類情報として分析結果83が出力される。図5の符号60cは、中間層を示す。細胞種別に関する分類情報とは、例えば、細胞が複数の細胞種別の各々に属する確率である。さらに、この確率の中で、値が最も高い分類に、分析データ85を取得した分析対象の細胞が属すると判断し、その細胞種別を表す識別子であるラベル値82等が分析結果83に含まれてもよい。分析結果83は、ラベル値そのものの他、ラベル値を細胞種別を示す情報(例えば文字列)に置き換えたデータであってもよい。図5では分析データ85に基づいて、深層学習アルゴリズム60が分析データ85を取得した分析対象の細胞が属する確率が最も高かったラベル値「1」を出力し、さらに、このラベル値に対応する「好中球」という文字データが分析結果83として出力される例を示している。ラベル値の出力は、深層学習アルゴリズム60が行ってもよいが、他のコンピュータプログラムが、深層学習アルゴリズム60が算出した確率に基づいて、最も好ましいラベル値を出力してもよい。
When the analysis data 85 is input to the input layer 60a of the neural network 60 constituting the trained deep learning algorithm 60, the analysis result 83 is output from the output layer 60b as classification information regarding the cell type corresponding to the analysis data 85. .. Reference numeral 60c in FIG. 5 indicates an intermediate layer. The classification information regarding a cell type is, for example, the probability that a cell belongs to each of a plurality of cell types. Further, it is determined that the cell to be analyzed for which the analysis data 85 has been acquired belongs to the classification having the highest value in this probability, and the label value 82 or the like, which is an identifier indicating the cell type, is included in the analysis result 83. You may. In addition to the label value itself, the analysis result 83 may be data in which the label value is replaced with information indicating the cell type (for example, a character string). In FIG. 5, based on the analysis data 85, the deep learning algorithm 60 outputs the label value “1” having the highest probability that the analysis target cell for which the analysis data 85 has been acquired belongs, and further, “1” corresponding to this label value is output. An example is shown in which the character data "neutrophil" is output as the analysis result 83. The label value may be output by the deep learning algorithm 60, but another computer program may output the most preferable label value based on the probability calculated by the deep learning algorithm 60.
[2.細胞分析装置と細胞分析装置における生体試料の測定]
本実施形態の細胞の波形データ、またはその元となる細胞のアナログ信号は、第1の細胞分析装置4000又は第2の細胞分析装置4000’において取得され得る。図6の(a)は、細胞分析装置4000の外観の例を示す。図6の(b)は、細胞分析装置4000’の外観の例を示す。図6の(a)において、細胞分析装置4000は、測定ユニット400と、測定ユニット400における試料の測定条件の設定や測定を制御したり、深層学習アルゴリズム60による細胞のデータの分析結果を分析するための処理ユニット300を備える。図6の(b)において、細胞分析装置4000’は、測定ユニット500と、測定ユニット500における試料の測定条件の設定や測定を制御したり、深層学習アルゴリズム60による細胞のデータの分析結果を分析するための処理ユニット300を備える。測定ユニット400、500と処理ユニット300は相互に通信可能に有線、又は無線で接続されうる。以下に、測定ユニット400、500の構成例を示すが、本実施形態は、以下の例示に限定されて解釈されるものではない。処理ユニット300は、後述するベンダ側装置100と共用されてもよい。 [2. Measurement of biological samples in cell analyzers and cell analyzers]
The cell waveform data of the present embodiment, or the analog signal of the cell that is the source thereof, can be acquired by thefirst cell analyzer 4000 or the second cell analyzer 4000'. FIG. 6A shows an example of the appearance of the cell analyzer 4000. FIG. 6B shows an example of the appearance of the cell analyzer 4000'. In FIG. 6A, the cell analyzer 4000 controls the setting and measurement of the measurement conditions of the sample in the measurement unit 400 and the measurement unit 400, and analyzes the analysis result of the cell data by the deep learning algorithm 60. A processing unit 300 for this purpose is provided. In FIG. 6B, the cell analyzer 4000'controls the setting and measurement of the measurement conditions of the sample in the measurement unit 500 and the measurement unit 500, and analyzes the analysis result of the cell data by the deep learning algorithm 60. A processing unit 300 is provided for this purpose. The measuring units 400 and 500 and the processing unit 300 may be connected by wire or wirelessly so as to be able to communicate with each other. Although the configuration examples of the measurement units 400 and 500 are shown below, the present embodiment is not limited to the following examples and is not interpreted. The processing unit 300 may be shared with the vendor-side device 100 described later.
本実施形態の細胞の波形データ、またはその元となる細胞のアナログ信号は、第1の細胞分析装置4000又は第2の細胞分析装置4000’において取得され得る。図6の(a)は、細胞分析装置4000の外観の例を示す。図6の(b)は、細胞分析装置4000’の外観の例を示す。図6の(a)において、細胞分析装置4000は、測定ユニット400と、測定ユニット400における試料の測定条件の設定や測定を制御したり、深層学習アルゴリズム60による細胞のデータの分析結果を分析するための処理ユニット300を備える。図6の(b)において、細胞分析装置4000’は、測定ユニット500と、測定ユニット500における試料の測定条件の設定や測定を制御したり、深層学習アルゴリズム60による細胞のデータの分析結果を分析するための処理ユニット300を備える。測定ユニット400、500と処理ユニット300は相互に通信可能に有線、又は無線で接続されうる。以下に、測定ユニット400、500の構成例を示すが、本実施形態は、以下の例示に限定されて解釈されるものではない。処理ユニット300は、後述するベンダ側装置100と共用されてもよい。 [2. Measurement of biological samples in cell analyzers and cell analyzers]
The cell waveform data of the present embodiment, or the analog signal of the cell that is the source thereof, can be acquired by the
<第1の細胞分析装置と測定試料の調製>
(測定ユニット及び処理ユニットの構成)
測定ユニット400が、血液試料中の細胞を検出するためのフローサイトメータであるFCM検出部を備える血液分析装置、より具体的には血球計数装置である場合の構成例を説明する。 <Preparation of first cell analyzer and measurement sample>
(Measurement unit and processing unit configuration)
A configuration example will be described when themeasurement unit 400 is a blood analyzer including an FCM detection unit which is a flow cytometer for detecting cells in a blood sample, and more specifically, a blood cell counter.
(測定ユニット及び処理ユニットの構成)
測定ユニット400が、血液試料中の細胞を検出するためのフローサイトメータであるFCM検出部を備える血液分析装置、より具体的には血球計数装置である場合の構成例を説明する。 <Preparation of first cell analyzer and measurement sample>
(Measurement unit and processing unit configuration)
A configuration example will be described when the
(構成例1)
図7から図19を参照し、測定ユニット400及び処理ユニット300の構成例を説明する。図7は、測定ユニット400のブロック図の例を示す。図7に示されるように、測定ユニット400は、血球を検出するFCM検出部410、FCM検出部410から出力されるアナログ信号を処理するアナログ処理部420、測定ユニット制御部480、試料調製部440、装置機構部430及び検体吸引部450を備えている。 (Configuration Example 1)
A configuration example of themeasurement unit 400 and the processing unit 300 will be described with reference to FIGS. 7 to 19. FIG. 7 shows an example of a block diagram of the measurement unit 400. As shown in FIG. 7, the measurement unit 400 includes an FCM detection unit 410 for detecting blood cells, an analog processing unit 420 for processing an analog signal output from the FCM detection unit 410, a measurement unit control unit 480, and a sample preparation unit 440. , A device mechanism unit 430 and a sample suction unit 450 are provided.
図7から図19を参照し、測定ユニット400及び処理ユニット300の構成例を説明する。図7は、測定ユニット400のブロック図の例を示す。図7に示されるように、測定ユニット400は、血球を検出するFCM検出部410、FCM検出部410から出力されるアナログ信号を処理するアナログ処理部420、測定ユニット制御部480、試料調製部440、装置機構部430及び検体吸引部450を備えている。 (Configuration Example 1)
A configuration example of the
図8は、検体吸引部450と試料調製部440を説明するための模式図である。検体吸引部450は、採血管Tから血液検体(全血)を吸引するためのノズル451と、ノズルに陰圧/陽圧を付与するためのポンプ452を備える。ノズル451は、装置機構部430によって上下移動されることで採血管Tに挿入される。ノズル451が採血管Tに挿入された状態でポンプ452が陰圧を付与すると、ノズル451を介して血液検体が吸引される。なお、装置機構部430は、採血管Tからの血液の吸引前に採血管Tを転倒攪拌するハンド部材を備えてもよい。
FIG. 8 is a schematic diagram for explaining the sample suction unit 450 and the sample preparation unit 440. The sample suction unit 450 includes a nozzle 451 for sucking a blood sample (whole blood) from the blood collection tube T, and a pump 452 for applying negative pressure / positive pressure to the nozzle. The nozzle 451 is inserted into the blood collection tube T by being moved up and down by the device mechanism unit 430. When the pump 452 applies negative pressure while the nozzle 451 is inserted into the blood collection tube T, the blood sample is sucked through the nozzle 451. The device mechanism unit 430 may include a hand member that overturns and stirs the blood collection tube T before suctioning blood from the blood collection tube T.
試料調製部440は、5つの反応チャンバ440a~440eを備える。反応チャンバ440a~440eは、それぞれ、DIFF、RET、WPC、PLT-F、WNRの測定チャネルにおいて用いられる。各反応チャンバには、各測定チャネルに対応する試薬である溶血剤を収容した溶血剤容器と染色液を収容した染色液容器が流路を介して接続されている。一つの反応チャンバとそれに接続された試薬(溶血剤及び染色液)によって、測定チャネルが構成されている。例えば、DIFF測定チャネルは、DIFF測定用試薬であるDIFF溶血剤およびDIFF染色液と、DIFF反応チャンバ440aによって構成されている。他の測定チャネルも同様に構成されている。なお、ここでは一つの測定チャネルが溶血剤と染色液を一つずつ備えた構成を例示しているが、一つの測定チャネルが必ずしも溶血剤と染色液の両方を備えなくてもよく、複数の測定チャネルによって一つの試薬が共用されてもよい。
The sample preparation unit 440 includes five reaction chambers 440a to 440e. The reaction chambers 440a to 440e are used in the DIFF, RET, WPC, PLT-F, and WNR measurement channels, respectively. In each reaction chamber, a hemolytic agent container containing a hemolytic agent, which is a reagent corresponding to each measurement channel, and a staining liquid container containing a staining liquid are connected via a flow path. A measurement channel is composed of one reaction chamber and reagents (hemolytic agent and stain solution) connected to the reaction chamber. For example, the DIFF measurement channel is composed of a DIFF hemolytic agent and a DIFF stain, which are reagents for DIFF measurement, and a DIFF reaction chamber 440a. Other measurement channels are similarly configured. Although one measurement channel is illustrated here with one hemolyzing agent and one staining solution, one measurement channel does not necessarily have to include both the hemolyzing agent and the staining solution, and a plurality of measurement channels may be provided. One reagent may be shared by the measurement channel.
血液検体を吸引したノズル451は、装置機構部430による水平・上下移動によって、反応チャンバ440a~440eのうち、オーダーに対応する測定チャネルに対応する反応チャンバに上方からアクセスし、吸引した血液検体を吐出する。試料調製部440は、血液検体が吐出された反応チャンバに、対応する溶血剤と染色液を供給し、反応チャンバ内で血液検体と溶血剤と染色液を混合することで測定試料を調製する。調製された測定試料は、流路を介して反応チャンバからFCM検出部410に供給され、フローサイトメトリー法による細胞の測定が行われる。
The nozzle 451 that sucks the blood sample accesses the reaction chamber corresponding to the measurement channel corresponding to the order from above in the reaction chambers 440a to 440e by moving horizontally and vertically by the device mechanism unit 430, and sucks the blood sample. Discharge. The sample preparation unit 440 supplies the corresponding hemolytic agent and staining solution to the reaction chamber into which the blood sample is discharged, and prepares the measurement sample by mixing the blood sample, the hemolytic agent, and the staining solution in the reaction chamber. The prepared measurement sample is supplied to the FCM detection unit 410 from the reaction chamber via the flow path, and the cells are measured by the flow cytometry method.
図9は、FCM検出部410の光学系の構成例を示している。図9に示すように、フローサイトメータによる測定では、測定試料に含まれる細胞がフローサイトメータ内に備えられたフローセル(シースフローセル)4113を通過する際に、光源4111がフローセル4113に光を照射し、この光によってフローセル4113内の細胞から発せられる散乱光及び蛍光を検出する。
FIG. 9 shows a configuration example of the optical system of the FCM detection unit 410. As shown in FIG. 9, in the measurement by the flow cytometer, the light source 4111 irradiates the flow cell 4113 with light when the cells contained in the measurement sample pass through the flow cell (sheath flow cell) 4113 provided in the flow cytometer. Then, the scattered light and fluorescence emitted from the cells in the flow cell 4113 by this light are detected.
図9において、光源4111であるレーザダイオードから出射された光は、照射レンズ系4112を介してフローセル4113内を通過する細胞に照射される。
In FIG. 9, the light emitted from the laser diode, which is the light source 4111, is applied to the cells passing through the flow cell 4113 via the irradiation lens system 4112.
本実施形態において、フローサイトメータの光源4111は特に限定されず、蛍光色素の励起に好適な波長の光源4111が選択される。そのような光源4111としては、例えば赤色半導体レーザ光源及び/又は青色半導体レーザ光源を含む半導体レーザ光源、アルゴンレーザ光源、ヘリウム-ネオンレーザ等の気体レーザ光源、水銀アークランプなどが使用される。特に半導体レーザ光源は、気体レーザ光源に比べて非常に安価であるので好適である。
In the present embodiment, the light source 4111 of the flow cytometer is not particularly limited, and a light source 4111 having a wavelength suitable for exciting the fluorescent dye is selected. As such a light source 4111, for example, a semiconductor laser light source including a red semiconductor laser light source and / or a blue semiconductor laser light source, an argon laser light source, a gas laser light source such as a helium-neon laser, a mercury arclamp, and the like are used. In particular, a semiconductor laser light source is suitable because it is much cheaper than a gas laser light source.
図9に示されるように、フローセル4113を通過する粒子から発せられる前方散乱光は、集光レンズ4114とピンホール部4115を介して前方散乱光受光素子4116によって受光される。前方散乱光受光素子4116はフォトダイオードである。側方散乱光は、集光レンズ4117、ダイクロイックミラー4118、バンドパスフィルタ4119、及びピンホール部4120を介して側方散乱光受光素子4121によって受光される。側方散乱光受光素子4121は、フォトダイオードである。側方蛍光は、集光レンズ4117及びダイクロイックミラー4118を介して側方蛍光受光素子4122によって受光される。側方蛍光受光素子4122は、アバランシェフォトダイオードである。なお、前方散乱光受光素子4116、側方散乱光受光素子4121、側方蛍光受光素子4122として光電子増倍管を用いてもよい。
As shown in FIG. 9, the forward scattered light emitted from the particles passing through the flow cell 4113 is received by the forward scattered light receiving element 4116 via the condenser lens 4114 and the pinhole portion 4115. The forward scattered light receiving element 4116 is a photodiode. The side scattered light is received by the side scattered light receiving element 4121 via the condenser lens 4117, the dichroic mirror 4118, the bandpass filter 4119, and the pinhole portion 4120. The side scattered light receiving element 4121 is a photodiode. The lateral fluorescence is received by the lateral fluorescence light receiving element 4122 via the condenser lens 4117 and the dichroic mirror 4118. The side fluorescence light receiving element 4122 is an avalanche photodiode. A photomultiplier tube may be used as the forward scattered light receiving element 4116, the side scattered light receiving element 4121, and the side fluorescent light receiving element 4122.
各受光素子4116、4121及び4122から出力された受光信号は、それぞれ、アンプ4151、4152及び4153を介してアナログ処理部420に入力される。
The light receiving signals output from the light receiving elements 4116, 4121 and 4122 are input to the analog processing unit 420 via the amplifiers 4151, 4152 and 4153, respectively.
図7に戻って、アナログ処理部420は、FCM検出部410から入力されるアナログ信号に対してノイズ除去、平滑化等の処理を行い、処理後のアナログ信号を測定ユニット制御部480に対して出力する。
Returning to FIG. 7, the analog processing unit 420 performs processing such as noise removal and smoothing on the analog signal input from the FCM detection unit 410, and transfers the processed analog signal to the measurement unit control unit 480. Output.
測定ユニット制御部480は、A/D変換部482と、プロセッサ4831と、RAM4834と、記憶部4835と、バスコントローラ4850と、並列処理プロセッサ4833と、処理ユニット300と接続するインタフェース部489とを備えている。さらに、測定ユニット制御部480は、A/D変換部482との間に介在するインタフェース部484と、装置機構部430との間に介在するインタフェース部488とを備えている。図7に示されるように、本構成例では、並列処理プロセッサ4833は、測定ユニット400の内部に組み込まれる形で細胞分析装置4000に搭載されている。
The measurement unit control unit 480 includes an A / D conversion unit 482, a processor 4831, a RAM 4834, a storage unit 4835, a bus controller 4850, a parallel processing processor 4833, and an interface unit 489 connected to the processing unit 300. ing. Further, the measurement unit control unit 480 includes an interface unit 484 interposed between the A / D conversion unit 482 and an interface unit 488 interposed between the device mechanism unit 430. As shown in FIG. 7, in this configuration example, the parallel processing processor 4833 is mounted on the cell analyzer 4000 in a form incorporated inside the measurement unit 400.
プロセッサ4831は、バス485を介して、インタフェース部489、インタフェース部488、インタフェース部484、RAM4834、記憶部4835と接続されている。プロセッサ4831は、バス485を介して並列処理プロセッサ4833と接続されている。処理ユニット300は、インタフェース部489とバス485を介して測定ユニット400の各部に接続されている。バス485は、例えば、数百MB/s以上のデータ転送速度を有する伝送路である。バス485は、例えば、1GB/s以上のデータ転送速度を有する伝送路で構成してもよい。バス485は、例えば、PCI-Express又はPCI-X規格に基づいてデータ転送を行う。
The processor 4831 is connected to the interface unit 489, the interface unit 488, the interface unit 484, the RAM 4834, and the storage unit 4835 via the bus 485. The processor 4831 is connected to the parallel processing processor 4833 via the bus 485. The processing unit 300 is connected to each unit of the measurement unit 400 via the interface unit 489 and the bus 485. The bus 485 is, for example, a transmission line having a data transfer speed of several hundred MB / s or more. The bus 485 may be configured by, for example, a transmission line having a data transfer rate of 1 GB / s or more. The bus 485 transfers data based on, for example, the PCI-Express or the PCI-X standard.
A/D変換部482は、アナログ処理部420から出力されたアナログ信号をデジタル信号に変換する。A/D変換部482は、検体の測定開始から測定終了までのアナログ信号をデジタル信号に変換する。ある測定チャネルでの測定によって複数種類のアナログ信号(例えば、前方散乱光強度、側方散乱光強度および蛍光強度にそれぞれ対応するアナログ信号)が生成される場合、A/D変換部482は、それぞれのアナログ信号の測定開始から測定終了までをデジタル信号に変換する。A/D変換部482には、例えば、図9を参照して説明したように、3種類のアナログ信号(すなわち前方散乱光信号、側方散乱光信号および蛍光信号)が、それぞれ対応する複数の信号伝送経路421を介して入力される。A/D変換部482は、複数の信号伝送経路421から入力されたアナログ信号のそれぞれをデジタル信号に変換する。それぞれの信号伝送経路421は、例えば、アナログ信号を差動信号として伝送するように構成されている。
The A / D conversion unit 482 converts the analog signal output from the analog processing unit 420 into a digital signal. The A / D conversion unit 482 converts an analog signal from the start of measurement of the sample to the end of measurement into a digital signal. When a plurality of types of analog signals (for example, analog signals corresponding to forward scattered light intensity, side scattered light intensity, and fluorescence intensity, respectively) are generated by measurement in a certain measurement channel, the A / D conversion unit 482 performs each. Converts the analog signal from the start of measurement to the end of measurement into a digital signal. In the A / D conversion unit 482, for example, as described with reference to FIG. 9, three types of analog signals (that is, a forward scattered light signal, a side scattered light signal, and a fluorescent signal) correspond to a plurality of corresponding analog signals. It is input via the signal transmission path 421. The A / D conversion unit 482 converts each of the analog signals input from the plurality of signal transmission paths 421 into digital signals. Each signal transmission path 421 is configured to transmit, for example, an analog signal as a differential signal.
A/D変換部482は、図2を参照して説明したように、所定のサンプリングレート(例えば、10ナノ秒間隔で1024ポイントのサンプリング、80ナノ秒間隔で128ポイントのサンプリング、又は160ナノ秒間隔で64ポイントのサンプリング等)で、アナログ信号をサンプリングする。A/D変換部482は、各細胞に対応する3種類のアナログ信号に対してサンプリング処理を実行することで、各細胞について前方散乱光信号の波形データ、側方散乱光信号の波形データおよび蛍光信号の波形データを生成する。A/D変換部482は、生成した波形データのそれぞれにインデックスを付与する。生成された波形データは、図2(c)に示すように、一つの検体に含まれるN個の細胞の波形データが連続してできるデジタル信号になる。これによりN個の細胞から得られる3種類のアナログ信号(前方散乱光信号、側方散乱光信号および蛍光信号)に対応する3つのデジタル信号が生成される。
As described with reference to FIG. 2, the A / D conversion unit 482 has a predetermined sampling rate (for example, sampling of 1024 points at intervals of 10 nanoseconds, sampling of 128 points at intervals of 80 nanoseconds, or sampling of 160 nanoseconds). The analog signal is sampled at intervals (sampling of 64 points, etc.). The A / D conversion unit 482 performs sampling processing on three types of analog signals corresponding to each cell, and for each cell, the waveform data of the forward scattered light signal, the waveform data of the side scattered light signal, and the fluorescence. Generates signal waveform data. The A / D conversion unit 482 assigns an index to each of the generated waveform data. As shown in FIG. 2C, the generated waveform data becomes a digital signal in which waveform data of N cells contained in one sample can be continuously formed. As a result, three digital signals corresponding to three types of analog signals (forward scattered light signal, side scattered light signal and fluorescent signal) obtained from N cells are generated.
A/D変換部482は、アナログ信号から波形データを生成することに加えて、アナログ信号のパルスからピーク値を計算してもよい。
The A / D conversion unit 482 may calculate the peak value from the pulse of the analog signal in addition to generating the waveform data from the analog signal.
A/D変換部482は、生成したデジタル信号をバス485に入力する。バスコントローラ4850は、A/D変換部482から出力されたデジタル信号を、例えば、DMA(Direct Memory Access)転送によって、RAM4834に送信する。RAM4834は、デジタル信号を記憶する。
The A / D conversion unit 482 inputs the generated digital signal to the bus 485. The bus controller 4850 transmits the digital signal output from the A / D conversion unit 482 to the RAM 4834 by, for example, DMA (Direct Memory Access) transfer. The RAM 4834 stores a digital signal.
プロセッサ4831は、並列処理プロセッサ4833を用いて、深層学習アルゴリズム60に従って、生成されたデジタル信号に含まれる波形データの分析処理を実行する。すなわちプロセッサ4831は、深層学習アルゴリズム60にしたがってデジタル信号に含まれる波形データの分析処理を実行するようにプログラムされている。深層学習アルゴリズム60に基づいて細胞のデータを分析するための解析ソフトウェア4832は、記憶部4835に格納されていてもよい。この場合、プロセッサ4831は、記憶部4835に格納されている解析ソフトウェア4832を実行することにより、深層学習アルゴリズム60に基づくデータの分析処理を実行する。プロセッサ4831は、例えば、CPU(Central Processing Unit)である。プロセッサ4831は、例えばインテル社製のCore i9、Core i7、Core i5、AMD社製のRyzen 9、Ryzen
7、Ryzen 5、Ryzen 3などを用いてもよい。 Theprocessor 4831 uses the parallel processing processor 4833 to perform analysis processing of the waveform data included in the generated digital signal according to the deep learning algorithm 60. That is, the processor 4831 is programmed to execute the analysis processing of the waveform data included in the digital signal according to the deep learning algorithm 60. The analysis software 4832 for analyzing cell data based on the deep learning algorithm 60 may be stored in the storage unit 4835. In this case, the processor 4831 executes the data analysis process based on the deep learning algorithm 60 by executing the analysis software 4832 stored in the storage unit 4835. The processor 4831 is, for example, a CPU (Central Processing Unit). The processor 4831 is, for example, Core i9, Core i7, Core i5 manufactured by Intel, Ryzen 9, Ryzen manufactured by AMD.
7,Ryzen 5, Ryzen 3 and the like may be used.
7、Ryzen 5、Ryzen 3などを用いてもよい。 The
7,
プロセッサ4831は、並列処理プロセッサ4833を制御する。並列処理プロセッサ4833は、プロセッサ4831による制御に応じて、例えば行列演算に関する並列処理を実行する。つまり、プロセッサ4831は、並列処理プロセッサ4833のマスタプロセッサであり、並列処理プロセッサ4833は、プロセッサ4831のスレーブプロセッサである。プロセッサ4831は、ホストプロセッサまたはメインプロセッサとも呼ばれる。
The processor 4831 controls the parallel processing processor 4833. The parallel processing processor 4833 executes, for example, parallel processing related to matrix operations according to the control of the processor 4831. That is, the processor 4831 is the master processor of the parallel processing processor 4833, and the parallel processing processor 4833 is a slave processor of the processor 4831. Processor 4831 is also referred to as a host processor or main processor.
並列処理プロセッサ4833は、波形データの分析に関する処理の少なくとも一部である複数の演算処理を並列に実行する。並列処理プロセッサ4833は、例えば、GPU(Graphics Processing Unit)、FPGA(Field Programmable Gate Array)、ASIC(Application Specific Integrated Circuit)である。並列処理プロセッサ4833がFPGAである場合、並列処理プロセッサ4833は、例えば、訓練済みの深層学習アルゴリズム60に関する演算処理が予めプログラムされていてもよい。並列処理プロセッサ4833がASICである場合、並列処理プロセッサ4833は、例えば、訓練済みの深層学習アルゴリズム60に関する演算処理を実行するための回路が予め組み込まれていてもよいし、そのような組み込み回路に加えてプログラマブルなモジュールが内蔵されていてもよい。並列処理プロセッサ4833は、例えば、NVIDIA社製のGeForce,Quadro,TITAN,Jetsonなどを用いてもよい。Jetsonシリーズであれば、例えば、Jetson Nano、Jetson Tx2、Jetson Xavier、Jetson AGX Xavierが用いられる。
The parallel processing processor 4833 executes a plurality of arithmetic processes in parallel, which are at least a part of the processes related to the analysis of waveform data. The parallel processing processor 4833 is, for example, a GPU (Graphics Processing Unit), an FPGA (Field Programmable Gate Array), or an ASIC (Application Specific Integrated Circuit). When the parallel processing processor 4833 is an FPGA, the parallel processing processor 4833 may be pre-programmed with arithmetic processing related to the trained deep learning algorithm 60, for example. When the parallel processing processor 4833 is an ASIC, the parallel processing processor 4833 may, for example, preliminarily incorporate a circuit for executing arithmetic processing related to the trained deep learning algorithm 60, or may be incorporated in such an embedded circuit. In addition, a programmable module may be built-in. As the parallel processing processor 4833, for example, GeForce, Quadro, TITAN, Jetson or the like manufactured by NVIDIA may be used. In the case of the Jetson series, for example, Jetson Nano, Jetson Tx2, Jetson Xavier, and Jetson AGX Xavier are used.
プロセッサ4831は、例えば、測定ユニット400の制御に関する計算処理を実行する。プロセッサ4831は、例えば、装置機構部430、試料調製部440、検体吸引部450との間で送受信される制御信号に関する計算処理を実行する。プロセッサ4831は、例えば、処理ユニット300との間での情報の送受信に関する計算処理を実行する。プロセッサ4831は、例えば、記憶部4835からのプログラムデータの読み出し、RAM4834へのプログラムの展開、RAM4834との間のデータの送受信に関する処理を実行する。プロセッサ4831により実行される上述の各処理は、例えば、所定の順番に実行することが求められる。例えば、装置機構部430、試料調製部440、検体吸引部450の制御に要する処理がA、B及びCとすると、B、A、Cの順で実行することが求められることがある。プロセッサ4831はこのような順序に依存する連続的な処理を実行することが多いため、演算ユニット(「プロセッサコア」、「コア」等と呼ばれることがある)の数を増したとしても、必ずしも処理速度が高まるものではない。
The processor 4831 executes, for example, a calculation process related to the control of the measurement unit 400. The processor 4831 executes, for example, a calculation process relating to a control signal transmitted / received between the device mechanism unit 430, the sample preparation unit 440, and the sample suction unit 450. The processor 4831 executes, for example, a calculation process related to transmission / reception of information to / from the processing unit 300. The processor 4831 executes, for example, reading program data from the storage unit 4835, expanding the program to the RAM 4834, and transmitting / receiving data to / from the RAM 4834. Each of the above-mentioned processes executed by the processor 4831 is required to be executed in a predetermined order, for example. For example, if the processes required for controlling the device mechanism unit 430, the sample preparation unit 440, and the sample suction unit 450 are A, B, and C, it may be required to execute B, A, and C in this order. Since the processor 4831 often executes continuous processing depending on such an order, even if the number of arithmetic units (sometimes referred to as "processor core", "core", etc.) is increased, the processing is not necessarily performed. It doesn't increase the speed.
一方、並列処理プロセッサ4833は、例えば、多量の要素を含む行列データの演算のように、定型的で多量な計算処理を実行する。本実施形態では、並列処理プロセッサ4833は、深層学習アルゴリズム60に従って波形データを分析する処理の少なくとも一部を並列化した並列処理を実行する。深層学習アルゴリズム60には、例えば、多量の行列演算が含まれる。深層学習アルゴリズム60には、例えば、少なくとも100の行列演算が含まれることがあり、また、少なくとも1000の行列演算が含まれることもある。並列処理プロセッサ4833は、複数の演算ユニットを有し、これらの演算ユニットの各々が同時に行列演算を実行可能である。つまり、並列処理プロセッサ4833は、並列処理として、複数の演算ユニットの各々による行列演算を並列に実行することができる。例えば、深層学習アルゴリズム60に含まれる行列演算は、互いに順序依存が無い複数の演算処理に分割することができる。このように分割された演算処理は、複数の演算ユニットの各々で並列に実行可能となる。これらの演算ユニットは、「プロセッサコア」、「コア」等と呼ばれることがある。
On the other hand, the parallel processing processor 4833 executes a large amount of routine calculation processing such as an operation of matrix data including a large amount of elements. In the present embodiment, the parallel processing processor 4833 executes parallel processing in which at least a part of the processing for analyzing waveform data according to the deep learning algorithm 60 is parallelized. The deep learning algorithm 60 includes, for example, a large number of matrix operations. The deep learning algorithm 60 may include, for example, at least 100 matrix operations and may also include at least 1000 matrix operations. The parallel processing processor 4833 has a plurality of arithmetic units, and each of these arithmetic units can execute a matrix operation at the same time. That is, the parallel processing processor 4833 can execute the matrix operation by each of the plurality of arithmetic units in parallel as the parallel processing. For example, the matrix operation included in the deep learning algorithm 60 can be divided into a plurality of arithmetic processes that are not order-dependent from each other. The arithmetic processing divided in this way can be executed in parallel by each of the plurality of arithmetic units. These arithmetic units may be referred to as a "processor core", a "core", or the like.
このような並列処理を実行することにより、測定ユニット400全体としての演算処理を高速化することが可能となる。深層学習アルゴリズム60に含まれる行列演算のような処理は、例えば、「単一命令複数データ処理」(SIMD:Single Instruction Multiple Data)と呼ばれることがある。並列処理プロセッサ4833は、例えばこのようなSIMD演算に適している。このような並列処理プロセッサ4833は、ベクトルプロセッサと呼ばれることがある。
By executing such parallel processing, it is possible to speed up the arithmetic processing of the measurement unit 400 as a whole. Processing such as matrix operation included in the deep learning algorithm 60 may be referred to as, for example, "single instruction multiple data processing" (SIMD: Single Instruction Multiple Data). The parallel processing processor 4833 is suitable for such SIMD operation, for example. Such a parallel processing processor 4833 may be referred to as a vector processor.
上述のように、プロセッサ4831は、多様かつ複雑な処理を実行することに適している。一方、並列処理プロセッサ4833は、定型化された多量の処理を並列に実行することに適している。定型化された多量の処理を並列に実行することにより、計算処理に要するTAT(Turn Around Time)が短縮される。
As mentioned above, the processor 4831 is suitable for executing various and complicated processes. On the other hand, the parallel processing processor 4833 is suitable for executing a large amount of stylized processing in parallel. By executing a large number of stylized processes in parallel, the TAT (Turn Around Time) required for the calculation process is shortened.
なお、並列処理プロセッサ4833が実行する並列処理の対象は、行列演算に限られない。例えば、並列処理プロセッサ4833が深層学習アルゴリズム50に従って学習処理を実行するときは、学習処理に関する微分演算等が並列処理の対象となり得る。
The target of parallel processing executed by the parallel processing processor 4833 is not limited to matrix operations. For example, when the parallel processing processor 4833 executes the learning processing according to the deep learning algorithm 50, the differential calculation or the like related to the learning processing may be the target of the parallel processing.
プロセッサ4831の演算ユニットの数は、例えば、デュアルコア(コア数:2)、クアッドコア(コア数:4)、オクタコア(コア数:8)である。一方、並列処理プロセッサ4833は、演算ユニットを、例えば、少なくとも10個有し(コア数:10)、10の行列演算を並列に実行し得る。並列処理プロセッサ4833は、例えば、演算ユニットを数十個有するものもある。また、並列処理プロセッサ4833は、演算ユニットを、例えば、少なくとも100個有し(コア数:100)、100の行列演算を並列に実行し得るものもある。並列処理プロセッサ4833は、例えば、演算ユニットを数百個有するものもある。また、並列処理プロセッサ4833は、演算ユニットを、例えば、少なくとも1000個有し(コア数:1000)、1000の行列演算を並列に実行し得るものもある。並列処理プロセッサ4833は、例えば、演算ユニットを数千個有するものもある。
The number of arithmetic units of the processor 4831 is, for example, dual cores (number of cores: 2), quad cores (number of cores: 4), and octacores (number of cores: 8). On the other hand, the parallel processing processor 4833 has, for example, at least 10 arithmetic units (number of cores: 10), and can execute 10 matrix operations in parallel. The parallel processing processor 4833 may have, for example, dozens of arithmetic units. Further, the parallel processing processor 4833 may have, for example, at least 100 arithmetic units (number of cores: 100) and can execute 100 matrix operations in parallel. The parallel processing processor 4833 may have, for example, hundreds of arithmetic units. Further, the parallel processing processor 4833 may have, for example, at least 1000 arithmetic units (number of cores: 1000) and can execute 1000 matrix operations in parallel. The parallel processing processor 4833 may have, for example, thousands of arithmetic units.
図11は、並列処理プロセッサ4833の構成例を示す。並列処理プロセッサ4833は、複数の演算ユニット4836、及びRAM4837を含む。演算ユニット4836の各々は、行列データの演算処理を並列に実行する。RAM4837は、演算ユニット4836が実行する演算処理に関するデータを記憶する。RAM4837は、少なくとも1ギガバイトの容量を有するメモリである。RAM4837は、2ギガバイト、4ギガバイト、6ギガバイト、8ギガバイト、又は10ギガバイト以上の容量を有するメモリであってもよい。演算ユニット4836は、RAM4837からデータを取得し、演算処理を実行する。演算ユニット4836は、「プロセッサコア」、「コア」等と呼ばれることがある。
FIG. 11 shows a configuration example of the parallel processing processor 4833. The parallel processing processor 4833 includes a plurality of arithmetic units 4836 and a RAM 4837. Each of the arithmetic units 4836 executes arithmetic processing of matrix data in parallel. The RAM 4837 stores data related to arithmetic processing executed by the arithmetic unit 4836. The RAM 4837 is a memory having a capacity of at least 1 gigabyte. The RAM 4837 may be a memory having a capacity of 2 gigabytes, 4 gigabytes, 6 gigabytes, 8 gigabytes, or 10 gigabytes or more. The arithmetic unit 4836 acquires data from the RAM 4837 and executes arithmetic processing. The arithmetic unit 4836 may be referred to as a "processor core", a "core", or the like.
図12~図14は、測定ユニット400への並列処理プロセッサ4833の搭載例を示す。図12~図14は、並列処理プロセッサ4833が測定ユニット400の内部に組み込まれる形で細胞分析装置4000に搭載されている例を示す。図12及び図13は、プロセッサ4831と並列処理プロセッサ4833とを別体として設ける搭載例を示す。図12に示すように、プロセッサ4831は、例えば、基板4838に搭載される。並列処理プロセッサ4833は、例えば、グラフィックボード4830に搭載され、グラフィックボード4830がコネクタ4839を介して基板4838に接続される。プロセッサ4831は、バス485を介して並列処理プロセッサ4833と接続される。図13に示すように、並列処理プロセッサ4833は、例えば、基板4838に直に搭載され、バス485を介してプロセッサ4831に接続されてもよい。図14は、プロセッサ4831と並列処理プロセッサ4833とを一体として設ける搭載例を示す。図14に示すように、並列処理プロセッサ4833は、例えば、基板4838に搭載されたプロセッサ4831に内蔵されてもよい。
FIGS. 12 to 14 show an example of mounting the parallel processing processor 4833 on the measurement unit 400. 12 to 14 show an example in which the parallel processing processor 4833 is mounted on the cell analyzer 4000 in a form of being incorporated inside the measurement unit 400. 12 and 13 show a mounting example in which the processor 4831 and the parallel processing processor 4833 are provided as separate bodies. As shown in FIG. 12, the processor 4831 is mounted on the substrate 4838, for example. The parallel processing processor 4833 is mounted on the graphic board 4830, for example, and the graphic board 4830 is connected to the board 4838 via the connector 4839. The processor 4831 is connected to the parallel processing processor 4833 via the bus 485. As shown in FIG. 13, the parallel processing processor 4833 may be mounted directly on the substrate 4838 and connected to the processor 4831 via the bus 485, for example. FIG. 14 shows a mounting example in which the processor 4831 and the parallel processing processor 4833 are integrally provided. As shown in FIG. 14, the parallel processing processor 4833 may be built in, for example, the processor 4831 mounted on the board 4838.
図15は、測定ユニット400への並列処理プロセッサ4833の他の搭載例を示す。図15は、測定ユニット400に接続される外付け装置4800によって、測定ユニット400に並列処理プロセッサ4833を搭載する例を示す。並列処理プロセッサ4833は、例えば、USB(Universal Serial Bus)デバイスである外付け装置4800に実装され、このUSBデバイスがインタフェース部487を介してバス485に接続されることで、並列処理プロセッサ4833が細胞分析装置4000に搭載される。USBデバイスは、例えば、USBドングルのような小型デバイスでもよい。インタフェース部487は、例えば、数百Mbpsの転送速度を有するUSBインタフェースであり、より好ましくは、数Gbps~数10Gbps以上の転送速度を有するUSBインタフェースである。並列処理プロセッサ4833が実装された外付け装置4800として、例えば、Intel社製 Neural Compute Stick 2が用いられてもよい。
FIG. 15 shows another example of mounting the parallel processing processor 4833 on the measurement unit 400. FIG. 15 shows an example in which a parallel processing processor 4833 is mounted on the measurement unit 400 by an external device 4800 connected to the measurement unit 400. The parallel processing processor 4833 is mounted on, for example, an external device 4800 which is a USB (Universal Serial Bus) device, and the USB device is connected to the bus 485 via the interface unit 487 so that the parallel processing processor 4833 becomes a cell. It is mounted on the analyzer 4000. The USB device may be a small device such as a USB dongle. The interface unit 487 is, for example, a USB interface having a transfer rate of several hundred Mbps, and more preferably a USB interface having a transfer rate of several Gbps to several tens of Gbps or more. As the external device 4800 on which the parallel processing processor 4833 is mounted, for example, a Neural Compute Stick 2 manufactured by Intel may be used.
並列処理プロセッサ4833が実装された複数のUSBデバイスをインタフェース部487に接続することで、複数の並列処理プロセッサ4833を細胞分析装置4000に搭載してもよい。一つのUSBデバイスに実装される並列処理プロセッサ4833は、演算ユニット4836の数がGPU等に比べて少ないことがあるため、測定ユニット400に接続するUSBデバイスを複数に増設することにより、コア数のスケールアップが可能となる。
By connecting a plurality of USB devices on which the parallel processing processor 4833 is mounted to the interface unit 487, a plurality of parallel processing processors 4833 may be mounted on the cell analyzer 4000. Since the number of arithmetic units 4836 in the parallel processing processor 4833 mounted on one USB device may be smaller than that of the GPU or the like, the number of cores can be increased by adding a plurality of USB devices connected to the measurement unit 400. It is possible to scale up.
図16、図17および図18は、プロセッサ4831上で動作する解析ソフトウェア4832の制御に基づいて、並列処理プロセッサ4833で実行される演算処理の概要を示す。図16は、演算処理を実行する並列処理プロセッサ4833の構成例を示す。並列処理プロセッサ4833は、複数の演算ユニット4836、RAM4837を有する。解析ソフトウェア4832を実行するプロセッサ4831は、並列処理プロセッサ4833に命令し、波形データを深層学習アルゴリズム60で分析する場合に要する少なくとも一部の演算処理を並列処理プロセッサ4833に実行させることができる。プロセッサ4831は、並列処理プロセッサ4833に対して、深層学習アルゴリズムに基づく波形データ分析に関する演算処理の実行を命令する。FCM検出部410で検出された信号に対応する波形データの全部又は少なくとも一部は、RAM4834に記憶される。RAM4834に記憶されたデータは、並列処理プロセッサ4833のRAM4837に転送される。RAM4834に記憶されたデータは、例えば、DMA(Direct Memory Access)方式によりRAM4837に転送される。並列処理プロセッサ4833の複数の演算ユニット4836の各々は、RAM4837に記憶されたデータに対する演算処理を並列に実行する。複数の演算ユニット4836の各々は、必要なデータをRAM4837から取得して演算処理を実行する。演算結果に対応するデータは、並列処理プロセッサ4833のRAM4837に記憶される。演算結果に対応するデータは、RAM4837からRAM4834に、例えばDMA方式で、転送される。
FIGS. 16, 17 and 18 show an outline of arithmetic processing executed by the parallel processing processor 4833 under the control of the analysis software 4832 running on the processor 4831. FIG. 16 shows a configuration example of a parallel processing processor 4833 that executes arithmetic processing. The parallel processing processor 4833 has a plurality of arithmetic units 4836 and RAM 4837. The processor 4831 that executes the analysis software 4832 can instruct the parallel processing processor 4833 to execute at least a part of the arithmetic processing required for analyzing the waveform data by the deep learning algorithm 60 on the parallel processing processor 4833. The processor 4831 instructs the parallel processing processor 4833 to execute arithmetic processing related to waveform data analysis based on the deep learning algorithm. All or at least a part of the waveform data corresponding to the signal detected by the FCM detection unit 410 is stored in the RAM 4834. The data stored in the RAM 4834 is transferred to the RAM 4837 of the parallel processing processor 4833. The data stored in the RAM 4834 is transferred to the RAM 4738 by, for example, a DMA (Direct Memory Access) method. Each of the plurality of arithmetic units 4836 of the parallel processing processor 4833 executes arithmetic processing on the data stored in the RAM 4837 in parallel. Each of the plurality of arithmetic units 4836 acquires necessary data from the RAM 4837 and executes arithmetic processing. The data corresponding to the calculation result is stored in the RAM 4837 of the parallel processing processor 4833. The data corresponding to the calculation result is transferred from RAM 4837 to RAM 4834, for example, by the DMA method.
図17は、並列処理プロセッサ4833が実行する行列演算の概要を示す。波形データを深層学習アルゴリズム60に従って分析するにあたり、行列の積の計算(行列演算)が実行される。並列処理プロセッサ4833は、例えば、行列演算に関する複数の演算処理を並列に実行する。図17の(a)は、行列の積の計算式を示す。(a)に示す計算式では、n行n列の行列aとn行n列の行列bとの積により、行列cを求める。図17に例示されるように、計算式は、多階層のループ構文で記述される。図17の(b)は、並列処理プロセッサ4833で並列に実行される演算処理の例を示す。図17(a)に例示された計算式は、例えば、1階層目のループ用変数iと、2階層目のループ用変数jとの組合せ数であるn×n個の演算処理に分割することができる。このように分割された演算処理の各々は、互いに依存しない演算処理であるため、並列に実行し得る。
FIG. 17 shows an outline of the matrix operation executed by the parallel processing processor 4833. In analyzing the waveform data according to the deep learning algorithm 60, the calculation of the product of the matrix (matrix operation) is executed. The parallel processing processor 4833, for example, executes a plurality of arithmetic processings related to matrix operations in parallel. FIG. 17A shows a formula for calculating the product of matrices. In the calculation formula shown in (a), the matrix c is obtained by the product of the matrix a of n rows and n columns and the matrix b of n rows and n columns. As illustrated in FIG. 17, the formula is described in a multi-layered loop syntax. FIG. 17B shows an example of arithmetic processing executed in parallel by the parallel processing processor 4833. The calculation formula illustrated in FIG. 17A is divided into n × n arithmetic processes, which is the number of combinations of the loop variable i in the first layer and the loop variable j in the second layer, for example. Can be done. Since each of the arithmetic processes divided in this way is an arithmetic process that does not depend on each other, they can be executed in parallel.
図18は、図17の(b)に例示された複数の演算処理が、並列処理プロセッサ4833で並列に実行されることを示す概念図である。図18に示すように、複数の演算処理の各々は、並列処理プロセッサ4833が備える複数の演算ユニット4836のいずれかに割り当てられる。演算ユニット4836の各々は、割り当てられた演算処理を、互いに並列に実行する。つまり、演算ユニット4836の各々は、分割された演算処理を同時に実行する。
FIG. 18 is a conceptual diagram showing that a plurality of arithmetic processes exemplified in FIG. 17 (b) are executed in parallel by the parallel processing processor 4833. As shown in FIG. 18, each of the plurality of arithmetic processes is assigned to any of the plurality of arithmetic units 4836 included in the parallel processing processor 4833. Each of the arithmetic units 4836 executes the assigned arithmetic processing in parallel with each other. That is, each of the arithmetic units 4836 simultaneously executes the divided arithmetic processing.
図17および図18に例示された並列処理プロセッサ4833による演算によって、例えば、波形データに対応する細胞が複数の細胞種別の各々に属する確率に関する情報が求められる。演算の結果に基づいて、解析ソフトウェア4832を実行するプロセッサ4831は、波形データに対応する細胞の細胞種に関する解析を行う。演算結果は、並列処理プロセッサ4833のRAM4837に記憶され、RAM4837からRAM4834に転送される。プロセッサ4831は、RAM4834に記憶された演算結果に基づいて解析した結果を、バス485及びインタフェース部489を介して処理ユニット300に送信する。
By the calculation by the parallel processing processor 4833 exemplified in FIGS. 17 and 18, for example, information regarding the probability that the cell corresponding to the waveform data belongs to each of a plurality of cell types is obtained. Based on the result of the calculation, the processor 4831 that executes the analysis software 4832 analyzes the cell type of the cell corresponding to the waveform data. The calculation result is stored in the RAM 4837 of the parallel processing processor 4833, and is transferred from the RAM 4738 to the RAM 4834. The processor 4831 transmits the analysis result based on the calculation result stored in the RAM 4834 to the processing unit 300 via the bus 485 and the interface unit 489.
細胞が複数の細胞種別の各々に属する確率の演算は、並列処理プロセッサ4833とは別のプロセッサが行ってもよい。例えば、並列処理プロセッサ4833による演算結果がRAM4837からRAM4834に転送され、プロセッサ4831が、RAM4834から読み出した演算結果に基づいて、各々の波形データに対応する細胞が複数の細胞種別の各々に属する確率に関する情報を演算してもよい。また、並列処理プロセッサ4833による演算結果をRAM4837から処理ユニット300に転送され、処理ユニット300に搭載されたプロセッサが、各々の波形データに対応する細胞が複数の細胞種別の各々に属する確率に関する情報を演算してもよい。
The calculation of the probability that a cell belongs to each of a plurality of cell types may be performed by a processor other than the parallel processing processor 4833. For example, the calculation result by the parallel processing processor 4833 is transferred from the RAM 4738 to the RAM 4834, and the processor 4831 relates to the probability that the cell corresponding to each waveform data belongs to each of the plurality of cell types based on the calculation result read from the RAM 4834. Information may be calculated. Further, the calculation result by the parallel processing processor 4833 is transferred from the RAM 4738 to the processing unit 300, and the processor mounted on the processing unit 300 provides information on the probability that the cells corresponding to the respective waveform data belong to each of the plurality of cell types. You may calculate.
本実施形態では、図17及び図18に示された処理は、例えば、深層学習アルゴリズム60における畳み込み層に関する演算処理(フィルタ処理とも呼ばれる)に適用される。
In the present embodiment, the processes shown in FIGS. 17 and 18 are applied to, for example, arithmetic processing (also referred to as filter processing) related to the convolution layer in the deep learning algorithm 60.
図19に、畳み込み層に関する演算処理の概要を示す。図19の(a)は、深層学習アルゴリズム60に入力される波形データとして、前方散乱光(FSC)の波形データの例を示す。本実施形態の波形データは、図2に示すように一次元の行列データである。より単純に言えば、波形データは要素を一列に並べた配列である。ここでは、説明の便宜上、波形データの要素数はn(nは1以上の整数)とする。(a)には、複数のフィルタが示されている。フィルタは、深層学習アルゴリズム50の学習処理により生成される。複数のフィルタの各々は、波形データの特徴を表す一次元の行列データである。(a)に示すフィルタは、1行3列の行列データであるが、列数は3に限られない。深層学習アルゴリズム60に入力される波形データと、各々のフィルタとを行列演算することで、波形データに関する細胞種別に対応する特徴が計算される。図19の(b)は、波形データとフィルタとの行列演算の概要を示す。(b)に示されるように、各フィルタを波形データの各要素に対して1つずらしながら行列演算が実行される。行列演算の計算は、下記の式1により実行される。
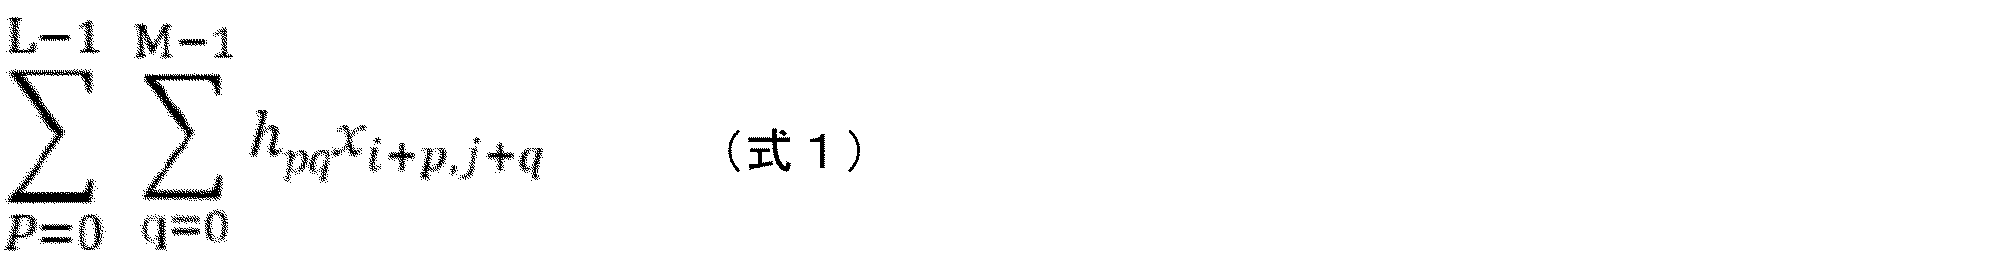
式1において、xの添え字は、波形データの行番号及び列番号を示す変数である。hの添え字は、フィルタの行番号及び列番号を示す変数である。図19に示す例の場合、波形データは一次元の行列データであり、フィルタは、1行3列の行列データであるから、L=1、M=3、p=0、q=0,1,2、i=0、j=0,1,…n-1である。
FIG. 19 shows an outline of the arithmetic processing related to the convolution layer. FIG. 19A shows an example of waveform data of forward scattered light (FSC) as waveform data input to the deep learning algorithm 60. The waveform data of this embodiment is one-dimensional matrix data as shown in FIG. In simpler terms, waveform data is an array of elements arranged in a row. Here, for convenience of explanation, the number of elements of the waveform data is n (n is an integer of 1 or more). In (a), a plurality of filters are shown. The filter is generated by the learning process of the deep learning algorithm 50. Each of the plurality of filters is one-dimensional matrix data representing the characteristics of the waveform data. The filter shown in (a) is matrix data of 1 row and 3 columns, but the number of columns is not limited to 3. By performing a matrix calculation between the waveform data input to the deep learning algorithm 60 and each filter, the characteristics corresponding to the cell types related to the waveform data are calculated. FIG. 19B shows an outline of the matrix operation between the waveform data and the filter. As shown in (b), the matrix operation is executed while shifting each filter by one for each element of the waveform data. The calculation of the matrix operation is executed by the following equation 1.
In Equation 1, the subscript of x is a variable indicating the row number and column number of the waveform data. The subscript of h is a variable indicating the row number and the column number of the filter. In the case of the example shown in FIG. 19, since the waveform data is one-dimensional matrix data and the filter is 1-row 3-column matrix data, L = 1, M = 3, p = 0, q = 0,1. , 2, i = 0, j = 0, 1, ... n-1.
並列処理プロセッサ4833は、式1で表される行列演算を、複数の演算ユニット4836の各々によって並列に実行する。並列処理プロセッサ4833が実行した演算処理に基づき、各細胞の細胞種別に関する分類情報が生成される。生成された分類情報は、分類情報に基づく検体の検査結果の生成および表示に用いられる処理ユニット300に送信される。
The parallel processing processor 4833 executes the matrix operation represented by the equation 1 in parallel by each of the plurality of calculation units 4836. Classification information regarding the cell type of each cell is generated based on the arithmetic processing executed by the parallel processing processor 4833. The generated classification information is transmitted to the processing unit 300 used for generating and displaying the test result of the sample based on the classification information.
測定ユニット400は、波形データと識別情報とを対応付けて処理することができる。具体的には、測定ユニット400は、波形データの分析結果(即ち、各細胞の細胞種別に関する分類情報)と識別情報とを対応付けて生成することができる。測定ユニット400は、例えば、各細胞の細胞種別に関する分類情報と識別情報とを対応付けて、処理ユニット300に送信する。識別情報は、例えば、(1)波形データに対応する生体試料の識別情報、(2)波形データに対応する細胞の識別情報(例えば上述のインデックス)、(3)波形データに対応する患者の識別情報、(4)波形データに対応する検査の識別情報、(5)波形データが測定された細胞分析装置の識別情報、(6)波形データが測定された病院や検査施設などの施設(以下、「検査関連施設」という。)の識別情報、が挙げられる。なお、(1)波形データに対応する生体試料の識別情報は、生体試料に対する測定オーダーが登録された時刻に関する情報、分析装置が生体試料を識別した時刻に関する情報、分析装置が生体試料の測定を開始した時刻に関する情報、生体試料が緊急検体か通常検体かを識別するための情報、生体試料が再計測か新規計測かを識別するための情報などの、並列処理の優先順位を決定するための情報を含み得る。測定ユニット400は、例えば、LIS(Laboratory Information System)又は処理ユニット300から検査オーダーを受領する際に、LIS又は処理ユニット300から、上記識別情報(1)~(6)の少なくとも一つ又はそれらの組み合わせを取得できる。例えば、例示された(1)~(6)の少なくとも一つが、分類情報に対応付けられて処理ユニット300に送信され、処理ユニット300を介してユーザに検査結果として提供される。例示された(1)~(6)の複数の組み合わせが、分類情報と対応付けられて処理ユニット300に送信されてもよい。測定ユニット400は、例えば、上記識別情報(1)~(6)の少なくとも一つ又はそれらの組み合わせを自ら生成することもできる。
The measurement unit 400 can process the waveform data and the identification information in association with each other. Specifically, the measurement unit 400 can generate the analysis result of the waveform data (that is, the classification information regarding the cell type of each cell) in association with the identification information. For example, the measurement unit 400 associates the classification information and the identification information regarding the cell type of each cell and transmits them to the processing unit 300. The identification information includes, for example, (1) identification information of a biological sample corresponding to waveform data, (2) identification information of cells corresponding to waveform data (for example, the index described above), and (3) identification of a patient corresponding to waveform data. Information, (4) identification information of the test corresponding to the waveform data, (5) identification information of the cell analyzer on which the waveform data was measured, (6) facilities such as hospitals and inspection facilities where the waveform data was measured (hereinafter, Identification information of (referred to as "inspection-related facility"). In addition, (1) the identification information of the biological sample corresponding to the waveform data includes information on the time when the measurement order for the biological sample is registered, information on the time when the analyzer identifies the biological sample, and the analyzer measures the biological sample. To prioritize parallel processing, such as information about the start time, information to identify whether the biological sample is an emergency sample or a normal sample, and information to identify whether the biological sample is a remeasurement or a new measurement. May contain information. When the measurement unit 400 receives an inspection order from the LIS (Laboratory Information System) or the processing unit 300, for example, at least one of the above identification information (1) to (6) or one of them is received from the LIS or the processing unit 300. You can get the combination. For example, at least one of the illustrated (1) to (6) is transmitted to the processing unit 300 in association with the classification information, and is provided to the user as an inspection result via the processing unit 300. The plurality of combinations of (1) to (6) exemplified may be transmitted to the processing unit 300 in association with the classification information. The measurement unit 400 can also generate, for example, at least one of the above identification information (1) to (6) or a combination thereof.
波形データと上記識別情報(上記(1)~(6)の少なくとも一つ又はそれらの組み合わせ)との対応付けは、処理ユニット300が行ってもよい。処理ユニット300は、例えば、LISから検査オーダーを受領した際に、生体試料の識別情報や、患者の識別情報を取得する。処理ユニット300は、上記検査オーダーに対応する測定を測定ユニット400に指示する。処理ユニット300は、当該測定指示に対応する結果(即ち、波形データ)を測定ユニット400から取得した際、その結果(即ち、波形データ)と上記識別情報とを対応付ける。
The processing unit 300 may perform the correspondence between the waveform data and the identification information (at least one of the above (1) to (6) or a combination thereof). The processing unit 300 acquires, for example, identification information of a biological sample and identification information of a patient when receiving a test order from LIS. The processing unit 300 instructs the measurement unit 400 to perform the measurement corresponding to the inspection order. When the processing unit 300 acquires the result (that is, waveform data) corresponding to the measurement instruction from the measurement unit 400, the processing unit 300 associates the result (that is, the waveform data) with the identification information.
図6に戻り、処理ユニット300は、インタフェース部489、及びバス485を介してプロセッサ4831と接続されており、プロセッサ4831及び並列処理プロセッサ4833による分析結果を受信することができる。インタフェース部489は、例えば、USBインタフェースである。
Returning to FIG. 6, the processing unit 300 is connected to the processor 4831 via the interface unit 489 and the bus 485, and can receive the analysis result by the processor 4831 and the parallel processing processor 4833. The interface unit 489 is, for example, a USB interface.
図10は、処理ユニット300の構成を示す図である。処理ユニット300は、プロセッサ3001と、バス3003と、記憶部3004と、インタフェース部3006と、表示部3015と、操作部3016とを備える。処理ユニット300は、ハードウェアとしては一般的なパーソナルコンピュータによって構成されており、記憶部3004に格納された専用のプログラムを実行することで、細胞分析装置4000の処理ユニットとして機能する。
FIG. 10 is a diagram showing the configuration of the processing unit 300. The processing unit 300 includes a processor 3001, a bus 3003, a storage unit 3004, an interface unit 3006, a display unit 3015, and an operation unit 3016. The processing unit 300 is configured by a personal computer that is general in terms of hardware, and functions as a processing unit of the cell analyzer 4000 by executing a dedicated program stored in the storage unit 3004.
プロセッサ3001はCPUであり、記憶部3004に記憶されたプログラムを実行することが可能である。
The processor 3001 is a CPU and can execute a program stored in the storage unit 3004.
記憶部3004は、ハードディスク装置を備える。記憶部3004には、少なくとも、測定ユニット400から送信される細胞の分類情報を処理して、検体の検査結果を生成するためのプログラム60が格納されている。なお、検体の検査結果とは、後述するように、測定ユニット400によって得られた個々の細胞の分類情報82を分析結果83に基づいて、検体に含まれる血球を計数した結果を意味する。
The storage unit 3004 includes a hard disk device. The storage unit 3004 stores at least a program 60 for processing cell classification information transmitted from the measurement unit 400 and generating a test result of a sample. As will be described later, the test result of the sample means the result of counting the blood cells contained in the sample based on the analysis result 83 of the classification information 82 of the individual cells obtained by the measurement unit 400.
表示部3015は、コンピュータスクリーンを備える。表示部3015はインタフェース部3006とバス3003を介してプロセッサ3001に接続されている。表示部3015は、プロセッサ3001から入力される画像信号を受けて、測定ユニット400から受領した分析結果83と、プロセッサ3001が分析結果83を分析して得られる検査結果を表示することができる。
The display unit 3015 includes a computer screen. The display unit 3015 is connected to the processor 3001 via the interface unit 3006 and the bus 3003. The display unit 3015 can receive the image signal input from the processor 3001 and display the analysis result 83 received from the measurement unit 400 and the inspection result obtained by the processor 3001 analyzing the analysis result 83.
操作部3016は、キーボード、マウスまたはタッチパネルを含むポインティングデバイスを備える。医師や検査技師等のユーザは、操作部3016を操作することで、細胞分析装置4000に測定オーダーを入力し、測定オーダーにしたがって測定指示を入力することができる。操作部3016は、ユーザから検査結果を表示する指示を受け付けることもできる。ユーザは、操作部3016を操作し、検査結果に関する様々な情報、例えば、グラフ、チャート、検体に付与されたフラグ情報を閲覧することができる。
The operation unit 3016 includes a pointing device including a keyboard, a mouse, or a touch panel. By operating the operation unit 3016, a user such as a doctor or a laboratory engineer can input a measurement order to the cell analyzer 4000 and input a measurement instruction according to the measurement order. The operation unit 3016 can also receive an instruction to display the inspection result from the user. The user can operate the operation unit 3016 to browse various information regarding the test result, for example, graphs, charts, and flag information given to the sample.
上述の測定ユニット400は、インタフェース部3006を介して処理ユニット300に接続されている。測定ユニット400のプロセッサ4831は、深層学習アルゴリズム60によって生成した個々の細胞の分類情報を、検体の識別情報と関連付けて、処理ユニット300のプロセッサ3001に送信することができる。プロセッサ3001は、測定ユニット400から受信した細胞の分析結果83を、検体の識別情報と関連付けて記憶部3004に格納する。
The above-mentioned measurement unit 400 is connected to the processing unit 300 via the interface unit 3006. The processor 4831 of the measurement unit 400 can transmit the classification information of individual cells generated by the deep learning algorithm 60 to the processor 3001 of the processing unit 300 in association with the identification information of the sample. The processor 3001 stores the cell analysis result 83 received from the measurement unit 400 in the storage unit 3004 in association with the identification information of the sample.
<細胞分析装置の動作>
図20~図22を参照し、細胞分析装置4000による検体の分析動作を説明する。 <Operation of cell analyzer>
The analysis operation of the sample by thecell analyzer 4000 will be described with reference to FIGS. 20 to 22.
図20~図22を参照し、細胞分析装置4000による検体の分析動作を説明する。 <Operation of cell analyzer>
The analysis operation of the sample by the
処理ユニット300のプロセッサ3001は、操作部3016を介してユーザから測定オーダーと測定指示を受け付けると、測定ユニット400に対して測定コマンドを送信する(ステップS1)。
When the processor 3001 of the processing unit 300 receives a measurement order and a measurement instruction from the user via the operation unit 3016, the processor 3001 transmits a measurement command to the measurement unit 400 (step S1).
測定ユニット400のプロセッサ4831は、測定コマンドを受信すると、検体の測定を開始する。プロセッサ4831は、検体吸引部450に、採血管Tから検体を吸引させる(ステップS10)。次に、プロセッサ4831は、検体吸引部450に、吸引した検体を試料調製部440のいずれかの反応チャンバ440a~440eに分注させる。ステップS1において処理ユニット300から送信される測定コマンドには、測定オーダーによって測定が要求されている測定チャネルの情報が含まれている。プロセッサ4831は、測定コマンドに含まれる測定チャネルの情報に基づいて、対応する測定チャネルの反応チャンバに検体を吐出するよう検体吸引部450を制御する。
Upon receiving the measurement command, the processor 4831 of the measurement unit 400 starts the measurement of the sample. The processor 4831 causes the sample suction unit 450 to suck the sample from the blood collection tube T (step S10). Next, the processor 4831 causes the sample suction unit 450 to dispense the sucked sample into any of the reaction chambers 440a to 440e of the sample preparation unit 440. The measurement command transmitted from the processing unit 300 in step S1 includes information on the measurement channel for which measurement is requested by the measurement order. The processor 4831 controls the sample suction unit 450 to discharge the sample into the reaction chamber of the corresponding measurement channel based on the information of the measurement channel included in the measurement command.
プロセッサ4831は、試料調製部440に測定試料を調製させる(ステップS11)。具体的には、試料調製部440は、プロセッサ4831からの命令を受けて、検体が吐出された反応チャンバに試薬(溶血剤および染色液)を供給し、検体と試薬を混合する。これにより反応チャンバ内で、赤血球が溶血剤により溶血され、かつ白血球や網状赤血球などの、測定チャネルがターゲットとする細胞が染色的によって染色された測定試料が調製される。
The processor 4831 causes the sample preparation unit 440 to prepare a measurement sample (step S11). Specifically, the sample preparation unit 440 receives a command from the processor 4831, supplies a reagent (hemolytic agent and a staining solution) to the reaction chamber into which the sample is discharged, and mixes the sample and the reagent. This prepares a measurement sample in which the erythrocytes are hemolyzed with a hemolytic agent and the cells targeted by the measurement channel, such as leukocytes and reticulocytes, are stained by staining in the reaction chamber.
プロセッサ4831は、FCM検出部410に、調製した測定試料を測定させる(ステップS12)。具体的に、プロセッサ4831は、装置機構部430を制御して、試料調製部440の反応チャンバ内にある測定試料をFCM検出部410へ送液する。反応チャンバとFCM検出部410は流路で接続されており、反応チャンバから送液された測定試料はフローセル4113内を流れて光源4111によってレーザ光が照射される(図9参照)。測定試料に含まれる細胞がフローセル4113を通過すると、光が細胞に照射され、細胞から生じた前方散乱光、側方散乱光、側方蛍光が、それぞれ受光素子4116、4121、4122によって検出され、受光強度に応じたアナログ信号が出力される。アナログ信号は、アナログ処理部420を介してA/D変換部482に出力される。
The processor 4831 causes the FCM detection unit 410 to measure the prepared measurement sample (step S12). Specifically, the processor 4831 controls the device mechanism unit 430 to send the measurement sample in the reaction chamber of the sample preparation unit 440 to the FCM detection unit 410. The reaction chamber and the FCM detection unit 410 are connected by a flow path, and the measurement sample sent from the reaction chamber flows through the flow cell 4113 and is irradiated with laser light by the light source 4111 (see FIG. 9). When the cells contained in the measurement sample pass through the flow cell 4113, the cells are irradiated with light, and the forward scattered light, the side scattered light, and the side fluorescence generated from the cells are detected by the light receiving elements 4116, 4121, and 4122, respectively. An analog signal corresponding to the light receiving intensity is output. The analog signal is output to the A / D conversion unit 482 via the analog processing unit 420.
A/D変換部482は、アナログ信号を所定レートでサンプリングすることで、個々の細胞の波形データを含むデジタル信号を生成する(ステップS13)。波形データおよびデジタル信号の生成方法はすでに述べたとおりである。プロセッサ4831は、A/D変換部482によって生成されたデジタル信号をRAM4834に取り込む。例えば、プロセッサ4831は、バスコントローラ4850を制御し、A/D変換部482によって生成されたデジタル信号をDMA転送によってRAM4834に取り込ませる。DMA転送により、デジタル信号は、プロセッサ4831を介さずに直接RAM4834に転送される。具体的には、プロセッサ4831は、検査対象の検体に含まれる細胞から取得された前方散乱光信号のデジタル信号、側方散乱光のデジタル信号および蛍光信号のデジタル信号をRAM4834に取り込む。デジタル信号はRAM4834に格納される。
The A / D conversion unit 482 generates a digital signal including waveform data of individual cells by sampling an analog signal at a predetermined rate (step S13). The method of generating the waveform data and the digital signal is as described above. The processor 4831 takes in the digital signal generated by the A / D conversion unit 482 into the RAM 4834. For example, the processor 4831 controls the bus controller 4850, and the digital signal generated by the A / D conversion unit 482 is taken into the RAM 4834 by DMA transfer. By DMA transfer, the digital signal is transferred directly to RAM 4834 without going through the processor 4831. Specifically, the processor 4831 captures the digital signal of the forward scattered light signal, the digital signal of the side scattered light, and the digital signal of the fluorescent signal acquired from the cells contained in the sample to be inspected into the RAM 4834. The digital signal is stored in the RAM 4834.
プロセッサ4831は、深層学習アルゴリズム60を用いて、生成したデジタル信号に含まれる波形データに基づく細胞分類を実行する(ステップS14)。S14の処理については後述する。
The processor 4831 uses the deep learning algorithm 60 to execute cell classification based on the waveform data included in the generated digital signal (step S14). The processing of S14 will be described later.
プロセッサ4831は、S14の結果として得られた個々の細胞の分類情報82を含む分析結果83を、検体の識別情報と関連付けて処理ユニット300に送信する(ステップS15)。分析結果83は、例えば、一つの検体に含まれる複数の細胞の分析結果83が、それぞれ、検体の識別情報に紐づけられて、処理ユニット300へ送られる。
The processor 4831 transmits the analysis result 83 including the classification information 82 of the individual cells obtained as a result of S14 to the processing unit 300 in association with the identification information of the sample (step S15). As for the analysis result 83, for example, the analysis result 83 of a plurality of cells contained in one sample is associated with the identification information of the sample and sent to the processing unit 300.
処理ユニット300のプロセッサ3001は、測定ユニットから分析結果83を受信すると(ステップS2)、記憶部3004に格納されたプログラムを用いて分析結果83を分析し、検体の検査結果を生成する(ステップS3)。S3の処理では、例えば、個々の細胞の分析結果83に含まれるラベル値に基づいて、細胞種別ごとに細胞の数が計数される。例えば、1つの検体から好中球を示すラベル値「1」が付与された分類情報がN個あれば、検体の検査結果として好中球の数=Nとする計数結果が取得される。
When the processor 3001 of the processing unit 300 receives the analysis result 83 from the measurement unit (step S2), the processor 3001 analyzes the analysis result 83 using the program stored in the storage unit 3004 and generates the test result of the sample (step S3). ). In the treatment of S3, for example, the number of cells is counted for each cell type based on the label value included in the analysis result 83 of each cell. For example, if there are N classification information to which a label value "1" indicating neutrophils is given from one sample, a counting result with the number of neutrophils = N is obtained as a test result of the sample.
プロセッサ3001は、分析結果83に基づいて測定チャネルに応じた測定項目に関する計数結果を取得し、検体の識別情報とともに記憶部3004に格納する。測定チャネルに応じた測定項目とは、測定オーダーによって計数結果が要求されている項目である。例えばDIFFチャネルに応じた測定項目とは白血球5分類、すなわち単球、好中球、リンパ球、好酸球、好塩基球の数である。RETチャネルに応じた測定項目とは網赤血球の数である。PLT-Fに応じた測定項目とは血小板の数である。WPCに応じた測定項目とは造血前駆細胞の数である。WNRに応じた測定項目とは白血球と有核赤血球の数である。計数結果は、上に列挙したような測定が要求されている項目(リポータブル項目ともいう)に限らず、同じ測定チャネルで測定可能な他の細胞の計数結果も含みうる。例えば測定チャネルがDIFFであれば、図4に示すように、白血球5分類に加えて、幼若顆粒球(IG)および異常細胞も計数結果に含まれる。さらにプロセッサ3001は、得られた計数結果を分析することで検体の検査結果を生成し、記憶部3004に格納する。計数結果の分析とは、例えば計数結果が正常値範囲内であるか、異常細胞が検出されていないか、前回の検査結果と比べて乖離が許容範囲内か、などを判断することを含む。
The processor 3001 acquires the counting result regarding the measurement item according to the measurement channel based on the analysis result 83, and stores it in the storage unit 3004 together with the identification information of the sample. The measurement item according to the measurement channel is an item for which the counting result is required by the measurement order. For example, the measurement item according to the DIFF channel is the number of leukocyte 5 classifications, that is, monocytes, neutrophils, lymphocytes, eosinophils, and basophils. The measurement item according to the RET channel is the number of reticulocytes. The measurement item according to PLT-F is the number of platelets. The measurement item according to WPC is the number of hematopoietic progenitor cells. The measurement item according to WNR is the number of leukocytes and nucleated red blood cells. The counting result is not limited to the items for which measurement is required (also referred to as a reportable item) as listed above, and may include counting results of other cells that can be measured by the same measurement channel. For example, if the measurement channel is DIFF, as shown in FIG. 4, in addition to the leukocyte 5 classification, immature granulocytes (IG) and abnormal cells are also included in the counting results. Further, the processor 3001 generates a sample test result by analyzing the obtained counting result and stores it in the storage unit 3004. The analysis of the counting result includes, for example, determining whether the counting result is within the normal value range, no abnormal cells are detected, and whether the deviation from the previous test result is within the allowable range.
プロセッサ3001は、生成した検査結果を表示部3015に表示する(ステップS4)。
The processor 3001 displays the generated inspection result on the display unit 3015 (step S4).
次に図21を参照して、ステップS14の細胞分類の処理について説明する。ステップS14の細胞分類の処理は、解析ソフトウェア4832の動作に応じて、プロセッサ4831が行う処理である。プロセッサ4831は、ステップS13においてRAM4834に取り込まれたデジタル信号を並列処理プロセッサ4833に転送する(S101)。プロセッサ4831は、図16に示されるように、DMA転送によって、RAM4834からRAM4837にデジタル信号を転送する。プロセッサ4831は、例えば、バスコントローラ4850を制御し、RAM4834からRAM4837にデジタル信号をDMA転送させる。
Next, the process of cell classification in step S14 will be described with reference to FIG. 21. The cell classification process in step S14 is a process performed by the processor 4831 according to the operation of the analysis software 4832. The processor 4831 transfers the digital signal captured in the RAM 4834 in step S13 to the parallel processing processor 4833 (S101). As shown in FIG. 16, processor 4831 transfers a digital signal from RAM 4834 to RAM 4837 by DMA transfer. The processor 4831 controls, for example, the bus controller 4850 to transfer a digital signal from the RAM 4834 to the RAM 4738 by DMA.
プロセッサ4831は、並列処理プロセッサ4833に、デジタル信号に含まれる波形データに対する並列処理の実行を指示する(S102)。プロセッサ4831は、例えば、並列処理プロセッサ4833のカーネル関数を呼び出すことで、並列処理の実行を指示する。並列処理プロセッサ4833で実行される処理は、図22に例示されたフローチャートで後述される。プロセッサ4831は、例えば、深層学習アルゴリズム60に関する行列演算の実行を並列処理プロセッサ4833に指示する。デジタル信号は複数の波形データに分解され、順次、深層学習アルゴリズム60に入力される。デジタル信号に含まれる、各細胞に対応するインデックスは深層学習アルゴリズム60には入力されない。深層学習アルゴリズム60に入力された波形データは、並列処理プロセッサ4833によって演算される。
The processor 4831 instructs the parallel processing processor 4833 to execute parallel processing on the waveform data included in the digital signal (S102). The processor 4831 instructs the execution of the parallel processing, for example, by calling the kernel function of the parallel processing processor 4833. The processing executed by the parallel processing processor 4833 will be described later in the flowchart illustrated in FIG. The processor 4831 instructs the parallel processing processor 4833 to execute the matrix operation related to the deep learning algorithm 60, for example. The digital signal is decomposed into a plurality of waveform data and sequentially input to the deep learning algorithm 60. The index corresponding to each cell contained in the digital signal is not input to the deep learning algorithm 60. The waveform data input to the deep learning algorithm 60 is calculated by the parallel processing processor 4833.
プロセッサ4831は、並列処理プロセッサ4833によって実行された演算結果を受領する(S103)。演算結果は、例えば、図16に示されるように、RAM4837からRAM4834にDMA転送される。
Processor 4831 receives the calculation result executed by the parallel processing processor 4833 (S103). The calculation result is DMA-transferred from RAM 4837 to RAM 4834, for example, as shown in FIG.
プロセッサ4831は、並列処理プロセッサ4833による演算結果に基づいて、測定された各々の細胞の細胞種別の解析結果を生成する(S104)。
The processor 4831 generates an analysis result of the cell type of each measured cell based on the calculation result by the parallel processing processor 4833 (S104).
図22は、解析ソフトウェア4832の動作に応じたプロセッサ4831の指示に基づいて実行される並列処理プロセッサ4833の演算処理の動作例を示す。
FIG. 22 shows an operation example of arithmetic processing of the parallel processing processor 4833 executed based on the instruction of the processor 4831 according to the operation of the analysis software 4832.
解析ソフトウェア4832を実行するプロセッサ4831は、並列処理プロセッサ4833に、演算ユニット4836に対する演算処理の割り当てを実行させる(S110)。プロセッサ4831は、例えば、並列処理プロセッサ4833のカーネル関数を呼び出すことで、並列処理プロセッサ4833に、演算ユニット4836への演算処理の割り当てを実行させる。図18に示されるように、例えば、深層学習アルゴリズム60に関する行列演算が複数の演算処理に分割され、分割された各演算処理が演算ユニット4836に割り当てられる。複数の波形データが、順次、深層学習アルゴリズム60に入力される。波形データに対応する行列演算が複数の演算処理に分割され、演算ユニット4836に割り当てられる。
The processor 4831 that executes the analysis software 4832 causes the parallel processing processor 4833 to execute the assignment of arithmetic processing to the arithmetic unit 4836 (S110). The processor 4831 causes the parallel processing processor 4833 to execute the assignment of arithmetic processing to the arithmetic unit 4836, for example, by calling the kernel function of the parallel processing processor 4833. As shown in FIG. 18, for example, the matrix operation related to the deep learning algorithm 60 is divided into a plurality of operation processes, and each of the divided operation processes is assigned to the operation unit 4836. A plurality of waveform data are sequentially input to the deep learning algorithm 60. The matrix operation corresponding to the waveform data is divided into a plurality of arithmetic processes and assigned to the arithmetic unit 4836.
各演算処理は、複数の演算ユニット4836によって並列に処理される(S111)。演算処理は、複数の波形データに対して実行される。
Each arithmetic processing is processed in parallel by a plurality of arithmetic units 4836 (S111). The arithmetic processing is executed for a plurality of waveform data.
複数の演算ユニット4836によって並列に処理されることで生成された演算結果は、RAM4837からRAM4834に転送される(S112)。例えば、演算結果は、RAM4837からRAM4834へ、DMAによって転送される。
The calculation result generated by being processed in parallel by the plurality of calculation units 4836 is transferred from the RAM 48 37 to the RAM 4834 (S112). For example, the calculation result is transferred from RAM 4738 to RAM 4834 by DMA.
(構成例2)
図23及び図24を参照し、測定ユニット400及び処理ユニット300によって構成される細胞分析装置4000の他の構成例を説明する。本構成例では、並列処理プロセッサは、処理ユニット300に設けられる。 (Configuration Example 2)
With reference to FIGS. 23 and 24, another configuration example of thecell analyzer 4000 composed of the measurement unit 400 and the processing unit 300 will be described. In this configuration example, the parallel processing processor is provided in the processing unit 300.
図23及び図24を参照し、測定ユニット400及び処理ユニット300によって構成される細胞分析装置4000の他の構成例を説明する。本構成例では、並列処理プロセッサは、処理ユニット300に設けられる。 (Configuration Example 2)
With reference to FIGS. 23 and 24, another configuration example of the
図23は、測定ユニット400のブロック図の他の例を示す。図23に示す測定ユニット400は、A/D変換部482、プロセッサ4831、RAM4834、記憶部4835、並列処理プロセッサ4833を備えておらず、接続ポート4201が設けられていることを除き、図6、図7及びその関連記載で説明された測定ユニット400と同様の構成及び機能を有する。接続ポート4201には接続ケーブル4202が接続される。
FIG. 23 shows another example of the block diagram of the measurement unit 400. The measurement unit 400 shown in FIG. 23 does not include an A / D conversion unit 482, a processor 4831, a RAM 4834, a storage unit 4835, and a parallel processing processor 4833, and is provided with a connection port 4201. It has the same configuration and function as the measurement unit 400 described in FIG. 7 and its related description. A connection cable 4202 is connected to the connection port 4201.
図24は、処理ユニット300のブロック図の例を示す。図24に示すように、処理ユニット300は、プロセッサ3001、並列処理プロセッサ3002、記憶部3004、RAM3005、インタフェース部3006、A/D変換部3008、バスコントローラ4850、インタフェース部3009を備えており、これらはバス3003に接続されている。つまり図24の例では、並列処理プロセッサ3002が処理ユニット300の内部に組み込まれる形で細胞分析装置4000に搭載されている。バス3003は、例えば、数百MB/s以上のデータ転送速度を有する伝送路である。バス3003は、1GB/s以上のデータ転送速度を有する伝送路であってもよい。バス3003は、例えば、PCI-ExpressやPCI-X規格に基づいてデータ転送を行う。プロセッサ3001、並列処理プロセッサ3002、記憶部3004、RAM3005の構成、及び、それらで実行される処理は、上述の図11~図19で説明されたプロセッサ4831、並列処理プロセッサ4833、記憶部4835、RAM4834の構成及び処理と同様である。A/D変換部3008は、測定ユニット400から出力されたアナログ信号を上述したようにサンプリングし、細胞の波形データを含むデジタル信号を生成する。デジタル信号の生成方法については上述のとおりである。図23及び図24の例では、接続ケーブル4202は、例えば、測定ユニット400から処理ユニット300に伝送されるアナログ信号の種類に対応する数の伝送経路を備える。例えば、接続ケーブル4202は、ツイストペアケーブルで構成され、処理ユニット300に伝送されるアナログ信号の種類に対応する数のペア数の配線を有する。接続ポート3007からA/D変換部3008の伝送経路も、処理ユニット300に伝送されるアナログ信号の種類に対応する数の配線を有してもよい。接続ポート3007からA/D変換部3008の伝送経路では、例えば、アナログ信号は差動信号として伝送される。
FIG. 24 shows an example of a block diagram of the processing unit 300. As shown in FIG. 24, the processing unit 300 includes a processor 3001, a parallel processing processor 3002, a storage unit 3004, a RAM 3005, an interface unit 3006, an A / D conversion unit 3008, a bus controller 4850, and an interface unit 3009. Is connected to bus 3003. That is, in the example of FIG. 24, the parallel processing processor 3002 is mounted on the cell analyzer 4000 in a form of being incorporated inside the processing unit 300. The bus 3003 is, for example, a transmission line having a data transfer speed of several hundred MB / s or more. Bus 3003 may be a transmission line having a data transfer speed of 1 GB / s or more. Bus 3003 transfers data based on, for example, PCI-Express or PCI-X standard. The configurations of the processor 3001, the parallel processing processor 3002, the storage unit 3004, and the RAM 3005, and the processing executed by them are the processor 4831, the parallel processing processor 4833, the storage unit 4835, and the RAM 4834 described in FIGS. 11 to 19 above. It is the same as the configuration and processing of. The A / D conversion unit 3008 samples the analog signal output from the measurement unit 400 as described above, and generates a digital signal including the waveform data of the cells. The method of generating a digital signal is as described above. In the example of FIGS. 23 and 24, the connection cable 4202 includes, for example, a number of transmission paths corresponding to the type of analog signal transmitted from the measurement unit 400 to the processing unit 300. For example, the connection cable 4202 is composed of twisted pair cables and has a number of pairs of wiring corresponding to the type of analog signal transmitted to the processing unit 300. The transmission path from the connection port 3007 to the A / D converter 3008 may also have a number of wires corresponding to the type of analog signal transmitted to the processing unit 300. In the transmission path from the connection port 3007 to the A / D converter 3008, for example, an analog signal is transmitted as a differential signal.
図25に示すように、プロセッサ3001および並列処理プロセッサ3002は、上述のプロセッサ4831および並列処理プロセッサ4833と同様の構成および機能を有する。並列処理プロセッサ3002は、複数の演算ユニット3200、及びRAM3201を含む。プロセッサ3001上で、測定された細胞の細胞種別を解析する解析ソフトウェア3100が実行される。なお、並列処理プロセッサ3002は、バス3003に直接接続される必要はなく、例えば、USBデバイスに実装され、このUSBデバイスがインタフェース部(不図示)を介してバス3003に接続されることで、処理ユニット300の一部として細胞分析装置4000に搭載されてもよい。このUSBデバイスは、例えば、USBドングルのような小型デバイスでもよい。
As shown in FIG. 25, the processor 3001 and the parallel processing processor 3002 have the same configurations and functions as the above-mentioned processor 4831 and parallel processing processor 4833. The parallel processing processor 3002 includes a plurality of arithmetic units 3200 and RAM 3201. Analysis software 3100 that analyzes the cell type of the measured cell is executed on the processor 3001. The parallel processing processor 3002 does not need to be directly connected to the bus 3003. For example, the parallel processing processor 3002 is mounted on a USB device, and the USB device is connected to the bus 3003 via an interface unit (not shown) for processing. It may be mounted on the cell analyzer 4000 as part of the unit 300. This USB device may be a small device such as a USB dongle.
図23及び図24に示すとおり、処理ユニット300は、インタフェース部3006を介して、測定ユニット400のインタフェース部489と接続されている。処理ユニット300は、インタフェース部3006を介して、装置機構部430及び試料調製部440の制御信号を測定ユニット400に送信する。インタフェース部3006は、例えばUSBインタフェースである。
As shown in FIGS. 23 and 24, the processing unit 300 is connected to the interface unit 489 of the measurement unit 400 via the interface unit 3006. The processing unit 300 transmits control signals of the device mechanism unit 430 and the sample preparation unit 440 to the measurement unit 400 via the interface unit 3006. The interface unit 3006 is, for example, a USB interface.
図23及び図24に示す例では、処理ユニット300は、インタフェース部3006の他に、A/D変換部3008に接続される接続ポート3007、接続ポート3007に接続される接続ケーブル4202を介して、測定ユニット400の接続ポート4201と接続される。接続ポート4201はアナログ処理部420と接続される。接続ポート4201から処理ユニット300に出力されるアナログ信号は、上述の通り、測定ユニット400のFCM検出部410の出力がアナログ処理部420によって処理された信号である。アナログ処理部420は、FCM検出部410から入力されたアナログ信号に対してノイズ除去を含む処理を行う。アナログ処理部420で処理されたアナログ信号は、接続ポート4201、接続ケーブル4202を介して、処理ユニット300に伝送される。接続ケーブル4202は、信号伝送中のノイズ低減のため、例えば、1メートル又はそれ以下の長さで構成される。アナログ信号は、例えば、差動信号として、接続ケーブル4202を介して処理ユニット300に伝送される。処理ユニット300は、複数の接続ポート3007を備えてもよい。処理ユニット300は、複数の接続ポート3007を介して、複数の測定ユニット400からアナログ信号を取得してもよい。
In the example shown in FIGS. 23 and 24, the processing unit 300 is connected to the interface unit 3006 via the connection port 3007 connected to the A / D conversion unit 3008 and the connection cable 4202 connected to the connection port 3007. It is connected to the connection port 4201 of the measurement unit 400. The connection port 4201 is connected to the analog processing unit 420. As described above, the analog signal output from the connection port 4201 to the processing unit 300 is a signal obtained by processing the output of the FCM detection unit 410 of the measurement unit 400 by the analog processing unit 420. The analog processing unit 420 performs processing including noise reduction on the analog signal input from the FCM detection unit 410. The analog signal processed by the analog processing unit 420 is transmitted to the processing unit 300 via the connection port 4201 and the connection cable 4202. The connection cable 4202 is configured, for example, with a length of 1 meter or less in order to reduce noise during signal transmission. The analog signal is transmitted to the processing unit 300 as a differential signal, for example, via the connection cable 4202. The processing unit 300 may include a plurality of connection ports 3007. The processing unit 300 may acquire analog signals from the plurality of measurement units 400 via the plurality of connection ports 3007.
測定ユニット400から接続ケーブル4202を介して伝送されたアナログ信号は、処理ユニット300のA/D変換部3008によって、デジタル信号に変換される。A/D変換部3008は、例えば、図2を参照して説明したように、所定のサンプリングレート(例えば、10ナノ秒間隔で1024ポイントのサンプリング、80ナノ秒間隔で128ポイントのサンプリング、又は160ナノ秒間隔で64ポイントのサンプリング等)で、伝送されたアナログ信号をサンプリングし、細胞ごとの波形データを生成する。波形データはバス3003を介して記憶部3004又はRAM3005に記憶される。波形データは、例えば、DMAによりRAM3005に転送される。プロセッサ3001及び並列処理プロセッサ3002は、記憶部3004又はRAM3005に記憶された波形データに対して演算処理を実行する。
The analog signal transmitted from the measurement unit 400 via the connection cable 4202 is converted into a digital signal by the A / D conversion unit 3008 of the processing unit 300. The A / D converter 3008, for example, as described with reference to FIG. 2, has a predetermined sampling rate (eg, sampling of 1024 points at intervals of 10 nanoseconds, sampling of 128 points at intervals of 80 nanoseconds, or 160. The transmitted analog signal is sampled at nanosecond intervals (sampling of 64 points, etc.) to generate waveform data for each cell. The waveform data is stored in the storage unit 3004 or the RAM 3005 via the bus 3003. The waveform data is transferred to the RAM 3005 by, for example, DMA. The processor 3001 and the parallel processing processor 3002 execute arithmetic processing on the waveform data stored in the storage unit 3004 or the RAM 3005.
プロセッサ3001上で動作する解析ソフトウェア3100は、図16に示された解析ソフトウェア4832と同様の機能を有する。プロセッサ3001は、解析ソフトウェア3100を実行することにより、図16、図17、図18、図21、図22およびその関連記載と同様の動作によって、測定された細胞の細胞種別に関する分類情報を生成する。
The analysis software 3100 operating on the processor 3001 has the same function as the analysis software 4832 shown in FIG. By executing the analysis software 3100, the processor 3001 generates classification information regarding the cell type of the measured cells by the same operation as in FIG. 16, FIG. 17, FIG. 18, FIG. 21, FIG. 22 and the related description thereof. ..
この図23、図24に示される構成例2の細胞分析装置4000の場合、図20に示すフローチャートのうち、ステップS13(デジタル信号生成)、ステップS14(細胞分類)が処理ユニット300において行われる。ステップS15(分類情報の送信)は省略される。図21、図22の処理は、処理ユニット300のプロセッサ3001と並列処理プロセッサ3002によって行われる。
In the case of the cell analyzer 4000 of the configuration example 2 shown in FIGS. 23 and 24, in the flowchart shown in FIG. 20, step S13 (digital signal generation) and step S14 (cell classification) are performed in the processing unit 300. Step S15 (transmission of classification information) is omitted. The processing of FIGS. 21 and 22 is performed by the processor 3001 of the processing unit 300 and the parallel processing processor 3002.
プロセッサ3001は、波形データと識別情報とを対応付けて処理することができる。具体的には、プロセッサ3001は、波形データの分析結果(即ち、各細胞の細胞種別に関する分類情報)と識別情報とを対応付けることができる。識別情報は、例えば、(1)波形データに対応する生体試料の識別情報、(2)波形データに対応する細胞の識別情報、(3)波形データに対応する患者の識別情報、(4)波形データに対応する検査の識別情報、(5)波形データが測定された細胞分析装置の識別情報、(6)波形データが測定された検査関連施設の識別情報、が挙げられる。プロセッサ3001は、例えば、LISから検査オーダーを受領する際に、LISから、上記識別情報(1)~(6)の少なくとも一つ又はそれらの組み合わせを取得できる。例えば、例示された(1)~(6)の少なくとも一つが、分類情報に対応付けられて、検査結果としてユーザに提供される。例示された(1)~(6)の複数の組み合わせが、分類情報と対応付けられて、検査結果としてユーザに提供されてもよい。
The processor 3001 can process the waveform data and the identification information in association with each other. Specifically, the processor 3001 can associate the analysis result of the waveform data (that is, the classification information regarding the cell type of each cell) with the identification information. The identification information includes, for example, (1) identification information of a biological sample corresponding to waveform data, (2) identification information of cells corresponding to waveform data, (3) identification information of a patient corresponding to waveform data, and (4) waveform. Examples include the identification information of the test corresponding to the data, (5) the identification information of the cell analyzer in which the waveform data was measured, and (6) the identification information of the inspection-related facility in which the waveform data was measured. For example, when receiving an inspection order from LIS, the processor 3001 can acquire at least one of the above identification information (1) to (6) or a combination thereof from LIS. For example, at least one of (1) to (6) exemplified is associated with the classification information and provided to the user as an inspection result. The plurality of combinations of (1) to (6) exemplified may be associated with the classification information and provided to the user as an inspection result.
(構成例3)
図26及び図27を参照し、測定ユニット400及び処理ユニット300によって構成される細胞分析装置4000の他の構成例を説明する。本構成例においても、並列処理プロセッサ3002は、処理ユニット300の内部に組み込まれる形で細胞分析装置4000に搭載される。 (Configuration Example 3)
With reference to FIGS. 26 and 27, another configuration example of thecell analyzer 4000 composed of the measurement unit 400 and the processing unit 300 will be described. Also in this configuration example, the parallel processing processor 3002 is mounted on the cell analyzer 4000 in a form of being incorporated inside the processing unit 300.
図26及び図27を参照し、測定ユニット400及び処理ユニット300によって構成される細胞分析装置4000の他の構成例を説明する。本構成例においても、並列処理プロセッサ3002は、処理ユニット300の内部に組み込まれる形で細胞分析装置4000に搭載される。 (Configuration Example 3)
With reference to FIGS. 26 and 27, another configuration example of the
図26は、測定ユニット400のブロック図の他の例を示す。図26に示す測定ユニット400は、プロセッサ4831、RAM4834、記憶部4835、並列処理プロセッサ4833を備えておらず、A/D変換部482で生成されたデジタル信号を処理ユニット300に伝送するためのインタフェース部4851と伝送路4852が設けられていることを除き、図6、図7及びその関連記載で説明された測定ユニット400と同様の構成及び機能を有する。インタフェース部4851は、例えば、1ギガビット/秒以上の通信帯域を備える専用回線としてのインタフェースである。例えば、インタフェース部4851は、ギガビットイーサ、USB3.0、またはThunderbolt3に準拠したインタフェースである。インタフェース部4851がギガビットイ―サである場合、伝送路4852は例えばLANケーブルである。インタフェース部4851がUSB3.0である場合、伝送路4852はUSB3.0に準拠したUSBケーブルである。伝送路4852は、例えば、測定ユニット400と処理ユニット300との間でデジタル信号を伝送するための専用の伝送路である。
FIG. 26 shows another example of the block diagram of the measurement unit 400. The measurement unit 400 shown in FIG. 26 does not include a processor 4831, a RAM 4834, a storage unit 4835, and a parallel processing processor 4833, and is an interface for transmitting a digital signal generated by the A / D conversion unit 482 to the processing unit 300. It has the same configuration and function as the measurement unit 400 described in FIGS. 6, 7 and related descriptions, except that the unit 4851 and the transmission line 4852 are provided. The interface unit 4851 is, for example, an interface as a dedicated line having a communication band of 1 gigabit / sec or more. For example, the interface unit 4851 is an interface compliant with Gigabit Ethernet, USB3.0, or Thunderbolt 3. When the interface unit 4851 is a gigabit ether, the transmission line 4852 is, for example, a LAN cable. When the interface unit 4851 is USB3.0, the transmission line 4852 is a USB cable compliant with USB3.0. The transmission line 4852 is, for example, a dedicated transmission line for transmitting a digital signal between the measurement unit 400 and the processing unit 300.
図27は、処理ユニット300のブロック図の他の例を示す。図27に示す処理ユニット300は、A/D変換部3008及び接続ポート3007を備えていないこと、および、インタフェース部3010を備えることを除き、図24及びその関連記載で説明された処理ユニット300と同様の構成及び機能を有する。処理ユニット300は、複数のインタフェース部3010、および、複数のインタフェース部3006を介して、複数の測定ユニット400と接続されてもよい。
FIG. 27 shows another example of the block diagram of the processing unit 300. The processing unit 300 shown in FIG. 27 has the processing unit 300 described in FIG. 24 and its related description, except that it does not include the A / D conversion unit 3008 and the connection port 3007, and includes the interface unit 3010. It has a similar configuration and function. The processing unit 300 may be connected to a plurality of measurement units 400 via a plurality of interface units 3010 and a plurality of interface units 3006.
プロセッサ3001および並列処理プロセッサ3002は、図25およびその関連記載で説明されたプロセッサ3001および並列処理プロセッサ3002と同様の構成および機能を有する。図27において、並列処理プロセッサ3002は、必ずしもバス3003に直接接続される必要はなく、例えば、USBデバイスに実装され、このUSBデバイスがインタフェース部(不図示)を介してバス3003に接続されてもよい。このUSBデバイスは、例えば、USBドングルのような小型デバイスでもよい。
The processor 3001 and the parallel processing processor 3002 have the same configurations and functions as the processor 3001 and the parallel processing processor 3002 described in FIG. 25 and its related description. In FIG. 27, the parallel processing processor 3002 does not necessarily have to be directly connected to the bus 3003, and may be mounted on a USB device, for example, and the USB device may be connected to the bus 3003 via an interface unit (not shown). good. This USB device may be a small device such as a USB dongle.
プロセッサ3001上で動作する解析ソフトウェア3100は、図16に示された解析ソフトウェア4832と同様の機能を有する。解析ソフトウェア3100は、図16、図17、図18、図21、図22およびその関連記載と同様の動作によって、測定された細胞の細胞種別を解析する。
The analysis software 3100 operating on the processor 3001 has the same function as the analysis software 4832 shown in FIG. The analysis software 3100 analyzes the cell type of the measured cell by the same operation as in FIG. 16, FIG. 17, FIG. 18, FIG. 21, FIG. 22 and related descriptions thereof.
この図26、図27に示される構成例3の細胞分析装置4000の場合、図20に示すフローチャートのうち、ステップS14(細胞分類)が処理ユニット300において行われる。ステップS15(分類情報の送信)は省略される。図21、図22の処理は、処理ユニット300のプロセッサ3001と並列処理プロセッサ3002によって行われる。
In the case of the cell analyzer 4000 of the configuration example 3 shown in FIGS. 26 and 27, step S14 (cell classification) is performed in the processing unit 300 in the flowchart shown in FIG. 20. Step S15 (transmission of classification information) is omitted. The processing of FIGS. 21 and 22 is performed by the processor 3001 of the processing unit 300 and the parallel processing processor 3002.
図26、図27の構成では、FCM検出部410において生成された細胞のアナログ信号(前方散乱光信号、側方散乱光信号、側方蛍光信号)は、測定ユニット400内のA/D変換部482においてデジタル信号に変換される。デジタル信号は、インタフェース部484、バス485、インタフェース部4851、伝送路4852を介して、処理ユニット300に送られる。伝送路4852は、上述のとおり測定ユニット400と処理ユニット300との間でデジタル信号を伝送するための専用の伝送路である。、例えば、測定ユニット400と処理ユニット300は、伝送路4852を介して、一対一で接続される。言い換えれば、伝送路4852は、例えば、細胞分析装置4000を構成するコンポーネント(例えば、測定ユニット400および処理ユニット300)以外の装置に関連するデータの伝送が介在しない伝送路である。伝送路4852は、例えば、イントラネット又インターネットとは、別の伝送路である。これにより、測定ユニット400内でA/D変換を行って生成されたデジタル信号を処理ユニット300に送信しても、デジタル信号の伝送の通信速度のボトルネックを回避できる。
In the configurations of FIGS. 26 and 27, the analog signals (forward scattered light signal, side scattered light signal, side fluorescent signal) of the cells generated by the FCM detection unit 410 are the A / D conversion unit in the measurement unit 400. It is converted into a digital signal at 482. The digital signal is sent to the processing unit 300 via the interface unit 484, the bus 485, the interface unit 4851, and the transmission line 4852. The transmission line 4852 is a dedicated transmission line for transmitting a digital signal between the measurement unit 400 and the processing unit 300 as described above. For example, the measurement unit 400 and the processing unit 300 are connected one-to-one via a transmission line 4852. In other words, the transmission line 4852 is a transmission line that does not intervene in the transmission of data related to devices other than, for example, the components constituting the cell analyzer 4000 (for example, the measurement unit 400 and the processing unit 300). The transmission line 4852 is, for example, a transmission line different from the intranet or the Internet. As a result, even if the digital signal generated by performing A / D conversion in the measurement unit 400 is transmitted to the processing unit 300, the bottleneck of the communication speed of the digital signal transmission can be avoided.
(構成例4)
図28、図29、図30、図31、及び図32を参照し、細胞分析装置4000の他の構成例を説明する。 (Configuration Example 4)
With reference to FIGS. 28, 29, 30, 31, and 32, another configuration example of thecell analyzer 4000 will be described.
図28、図29、図30、図31、及び図32を参照し、細胞分析装置4000の他の構成例を説明する。 (Configuration Example 4)
With reference to FIGS. 28, 29, 30, 31, and 32, another configuration example of the
本構成例では、図28に例示されるように、測定ユニット400と処理ユニット300の間に、解析ユニット600が設けられる。つまり、図28、図29、図30、図31、図32の構成において、細胞分析装置4000は、測定ユニット400と、処理ユニット300と、解析ユニット600を備えて構成される。解析ユニット600は、測定された細胞の細胞種別を解析する。後述するとおり、本構成例では並列処理プロセッサ6002は解析ユニット600に組み込まれる形で細胞分析装置4000に搭載される。
In this configuration example, as illustrated in FIG. 28, an analysis unit 600 is provided between the measurement unit 400 and the processing unit 300. That is, in the configuration of FIGS. 28, 29, 30, 31, and 32, the cell analyzer 4000 includes a measurement unit 400, a processing unit 300, and an analysis unit 600. The analysis unit 600 analyzes the cell type of the measured cell. As will be described later, in this configuration example, the parallel processing processor 6002 is mounted on the cell analyzer 4000 in a form of being incorporated in the analysis unit 600.
図29に例示された測定ユニット400の構成は、図26およびその関連記載で説明された測定ユニット400と同様の構成および機能を有する。測定ユニット400と処理ユニット300との間に、解析ユニット600が設けられている。解析ユニット600は、複数の測定ユニット400と接続されてもよい。解析ユニット600は、複数の処理ユニット300と接続されてもよい。インタフェース部4851は、例えば、1ギガビット/秒以上の通信帯域を備えるインタフェースである。例えば、インタフェース部4851は、ギガビットイーサ、USB3.0又はThunderbolt3に準拠したインタフェースである。インタフェース部4851がギガビットイーサである場合、伝送路4852は例えばLANケーブルである。インタフェース部4851がUSB3.0である場合、伝送路4852はUSB3.0に準拠したUSBケーブルである。伝送路4852は、上述のとおり測定ユニット400と処理ユニット300との間でデジタル信号を伝送するための専用の伝送路である。例えば、測定ユニット400と処理ユニット300は、伝送路4852を介して、一対一で接続される。
The configuration of the measurement unit 400 exemplified in FIG. 29 has the same configuration and function as the measurement unit 400 described in FIG. 26 and its related description. An analysis unit 600 is provided between the measurement unit 400 and the processing unit 300. The analysis unit 600 may be connected to a plurality of measurement units 400. The analysis unit 600 may be connected to a plurality of processing units 300. The interface unit 4851 is, for example, an interface having a communication band of 1 gigabit / sec or more. For example, the interface unit 4851 is an interface compliant with Gigabit Ethernet, USB3.0, or Thunderbolt 3. When the interface unit 4851 is Gigabit Ethernet, the transmission line 4852 is, for example, a LAN cable. When the interface unit 4851 is USB3.0, the transmission line 4852 is a USB cable compliant with USB3.0. The transmission line 4852 is a dedicated transmission line for transmitting a digital signal between the measurement unit 400 and the processing unit 300 as described above. For example, the measurement unit 400 and the processing unit 300 are connected one-to-one via a transmission line 4852.
図30は、解析ユニット600の構成例を示す。解析ユニット600は、例えば、プロセッサ6001、並列処理プロセッサ6002、バス6003、記憶部6004、RAM6005、インタフェース部6006、インタフェース部6007を備え、これらはバス6003に接続されている。バス6003は、例えば、数百MB/s以上のデータ転送速度を有する伝送路である。バス3003は、1GB/s以上のデータ転送速度を有する伝送路であってもよい。バス3003は、例えば、PCI-ExpressやPCI-X規格に基づいてデータ転送を行う。解析ユニット600は、複数のインタフェース部6006を介して、複数の測定ユニット400と接続されてもよい。複数の測定ユニット400が設けられている場合、測定ユニット400のそれぞれに解析ユニット600が接続されてもよい(例えば、複数の測定ユニット400と複数の解析ユニット600が、それぞれ、一対一に接続される)。
FIG. 30 shows a configuration example of the analysis unit 600. The analysis unit 600 includes, for example, a processor 6001, a parallel processing processor 6002, a bus 6003, a storage unit 6004, a RAM 6005, an interface unit 6006, and an interface unit 6007, which are connected to the bus 6003. The bus 6003 is, for example, a transmission line having a data transfer speed of several hundred MB / s or more. Bus 3003 may be a transmission line having a data transfer speed of 1 GB / s or more. Bus 3003 transfers data based on, for example, PCI-Express or PCI-X standard. The analysis unit 600 may be connected to a plurality of measurement units 400 via a plurality of interface units 6006. When a plurality of measurement units 400 are provided, the analysis unit 600 may be connected to each of the measurement units 400 (for example, the plurality of measurement units 400 and the plurality of analysis units 600 are connected one-to-one). Ru).
図31に示すように、プロセッサ6001および並列処理プロセッサ6002は、上述のプロセッサ4831および並列処理プロセッサ4833と同様の構成および機能を有する。並列処理プロセッサ6002は、複数の演算ユニット6200、及びRAM6201を含む。プロセッサ6001上で、測定された細胞の細胞種別を解析する解析ソフトウェア6100が動作する。プロセッサ6001上で動作する解析ソフトウェア6100は、図16に示された解析ソフトウェア4832と同様の機能を有する。解析ソフトウェア6100は、図16、図17、図18、図21、図22およびその関連記載と同様の動作によって、測定された細胞の細胞種別を解析する。解析ソフトウェア6100は、測定された細胞の分類情報を、インタフェース部6007を介して処理ユニット300に送信する。インタフェース部6007は、例えば、イーサネット(登録商標)、USBである。インタフェース部6007は、無線通信可能なインタフェース(例えば、WiFi(登録商標)、Bluetooth(登録商標))でもよい。
As shown in FIG. 31, the processor 6001 and the parallel processing processor 6002 have the same configurations and functions as the above-mentioned processor 4831 and the parallel processing processor 4833. The parallel processing processor 6002 includes a plurality of arithmetic units 6200 and RAM 6201. The analysis software 6100 that analyzes the cell type of the measured cell runs on the processor 6001. The analysis software 6100 running on the processor 6001 has the same functions as the analysis software 4832 shown in FIG. The analysis software 6100 analyzes the cell type of the measured cell by the same operation as in FIG. 16, FIG. 17, FIG. 18, FIG. 21, FIG. 22 and related descriptions thereof. The analysis software 6100 transmits the measured cell classification information to the processing unit 300 via the interface unit 6007. The interface unit 6007 is, for example, Ethernet (registered trademark) or USB. The interface unit 6007 may be an interface capable of wireless communication (for example, WiFi (registered trademark), Bluetooth (registered trademark)).
図32は、処理ユニット300の構成例を示す。図32に示された処理ユニット300は、図24および図27に示された処理ユニット300のように並列処理プロセッサ3002を備えなくてもよい。また、図32に示されたプロセッサ3001上では、図24および図27に示された解析ソフトウェア3100が動作していなくてもよい。処理ユニット300は、インタフェース部3006を介して、解析ユニット600による解析結果を受信する。インタフェース部3006は、例えば、イーサネット、USBである。インタフェース部3006は、無線通信可能なインタフェース(例えば、WiFi、Bluetooth)でもよい。
FIG. 32 shows a configuration example of the processing unit 300. The processing unit 300 shown in FIG. 32 does not have to include the parallel processing processor 3002 like the processing unit 300 shown in FIGS. 24 and 27. Further, the analysis software 3100 shown in FIGS. 24 and 27 may not be running on the processor 3001 shown in FIG. 32. The processing unit 300 receives the analysis result by the analysis unit 600 via the interface unit 3006. The interface unit 3006 is, for example, Ethernet or USB. The interface unit 3006 may be an interface capable of wireless communication (for example, WiFi, Bluetooth).
図29、図30、図31、図32の構成では、FCM検出部410において生成された細胞のアナログ信号(前方散乱光信号、側方散乱光信号、側方蛍光信号)は、測定ユニット400内のA/D変換部482においてデジタル信号に変換される。波形データは、インタフェース部484、バス485、インタフェース部4851、伝送路4852を介して、解析ユニット600に送られる。インタフェース部4851は、上述のとおり測定ユニット400と解析ユニット600を接続する専用のインタフェースであり、測定ユニット400と解析ユニット600を一対一で接続する。言い換えれば、伝送路4852は、例えば、細胞分析装置4000を構成するコンポーネント(例えば、測定ユニット400および処理ユニット300)以外の装置に関連するデータの伝送が介在しない伝送路である。伝送と4852は、例えば、イントラネット又インターネットとは、別の伝送路である。これにより、測定ユニット400内でA/D変換を行って生成されたデジタル信号を処理ユニット300に送信しても、デジタル信号の伝送の通信速度のボトルネックを回避できる。
In the configurations of FIGS. 29, 30, 31, and 32, the analog signals (forward scattered light signal, side scattered light signal, side fluorescent signal) of the cells generated by the FCM detection unit 410 are in the measurement unit 400. It is converted into a digital signal by the A / D conversion unit 482 of. The waveform data is sent to the analysis unit 600 via the interface unit 484, the bus 485, the interface unit 4851, and the transmission line 4852. As described above, the interface unit 4851 is a dedicated interface for connecting the measurement unit 400 and the analysis unit 600, and connects the measurement unit 400 and the analysis unit 600 on a one-to-one basis. In other words, the transmission line 4852 is a transmission line that does not intervene in the transmission of data related to devices other than, for example, the components constituting the cell analyzer 4000 (for example, the measurement unit 400 and the processing unit 300). Transmission and 4852 are, for example, separate transmission lines from the intranet or the Internet. As a result, even if the digital signal generated by performing A / D conversion in the measurement unit 400 is transmitted to the processing unit 300, the bottleneck of the communication speed of the digital signal transmission can be avoided.
この図29、図30、図31、図32に示される構成例4の細胞分析装置4000の場合、図20に示すフローチャートのうち、ステップS14(細胞分類)とステップS15(分類情報の送信)が解析ユニット600において行われる。すなわち、ステップS13で生成されたデジタル信号が測定ユニット400から解析ユニット600へ送信され、ステップS15で分類情報が処理ユニット300へ送信される。図21、図22の処理は、解析ユニット600のプロセッサ6001と並列処理プロセッサ6002によって行われる。
In the case of the cell analyzer 4000 of the configuration example 4 shown in FIGS. 29, 30, 31, and 32, in the flowchart shown in FIG. 20, step S14 (cell classification) and step S15 (transmission of classification information) are performed. This is done in the analysis unit 600. That is, the digital signal generated in step S13 is transmitted from the measurement unit 400 to the analysis unit 600, and the classification information is transmitted to the processing unit 300 in step S15. The processing of FIGS. 21 and 22 is performed by the processor 6001 of the analysis unit 600 and the parallel processing processor 6002.
(構成例5)
図28、図33および図34を参照し、細胞分析装置4000の他の構成例を説明する。この構成例5の細胞分析装置も、前述の構成例4と同様、測定ユニット400と、処理ユニット300と、解析ユニット600を備えて構成される。
図33に示される測定ユニット400は、図23およびその関連記載で説明された測定ユニット400と同様の機能及び構成を備える。図33に示される測定ユニット400は、接続ケーブル4202を介して、解析ユニット600と接続される。例えば、接続ケーブル4202は、ツイストペアケーブルで構成され、処理ユニット300に伝送されるアナログ信号の種類に対応する数のペア数の配線を有する。接続ケーブル4202は、信号伝送中のノイズ低減のため、例えば、1メートル又はそれ以下の長さで構成される。測定ユニット400は、接続ケーブル4202を介して、解析ユニット600にアナログ信号を伝送する。 (Configuration Example 5)
With reference to FIGS. 28, 33 and 34, another configuration example of thecell analyzer 4000 will be described. The cell analyzer of the configuration example 5 is also configured to include the measurement unit 400, the processing unit 300, and the analysis unit 600, as in the configuration example 4 described above.
Themeasurement unit 400 shown in FIG. 33 has the same functions and configurations as the measurement unit 400 described in FIG. 23 and its related description. The measurement unit 400 shown in FIG. 33 is connected to the analysis unit 600 via the connection cable 4202. For example, the connection cable 4202 is composed of twisted pair cables and has a number of pairs of wiring corresponding to the type of analog signal transmitted to the processing unit 300. The connection cable 4202 is configured, for example, with a length of 1 meter or less in order to reduce noise during signal transmission. The measurement unit 400 transmits an analog signal to the analysis unit 600 via the connection cable 4202.
図28、図33および図34を参照し、細胞分析装置4000の他の構成例を説明する。この構成例5の細胞分析装置も、前述の構成例4と同様、測定ユニット400と、処理ユニット300と、解析ユニット600を備えて構成される。
図33に示される測定ユニット400は、図23およびその関連記載で説明された測定ユニット400と同様の機能及び構成を備える。図33に示される測定ユニット400は、接続ケーブル4202を介して、解析ユニット600と接続される。例えば、接続ケーブル4202は、ツイストペアケーブルで構成され、処理ユニット300に伝送されるアナログ信号の種類に対応する数のペア数の配線を有する。接続ケーブル4202は、信号伝送中のノイズ低減のため、例えば、1メートル又はそれ以下の長さで構成される。測定ユニット400は、接続ケーブル4202を介して、解析ユニット600にアナログ信号を伝送する。 (Configuration Example 5)
With reference to FIGS. 28, 33 and 34, another configuration example of the
The
図34に示される解析ユニット600は、図30およびその関連記載で説明された解析ユニット600と同様の機能および構成を備える。つまり、図34の例では、解析ユニット600に組み込まれる形で並列処理プロセッサ6002が細胞分析装置4000に搭載されている。図34に示される解析ユニット600は、さらに、接続ポート6008、A/D変換部6009を備える。解析ユニット600から接続ケーブル4202を介して伝送されたアナログ信号は、接続ポート6008を介してA/D変換部6009に入力される。A/D変換部6009は、A/D変換部482と同様の処理により、アナログ信号をデジタル信号に変換する。
The analysis unit 600 shown in FIG. 34 has the same functions and configurations as the analysis unit 600 described in FIG. 30 and its related description. That is, in the example of FIG. 34, the parallel processing processor 6002 is mounted on the cell analyzer 4000 in a form incorporated in the analysis unit 600. The analysis unit 600 shown in FIG. 34 further includes a connection port 6008 and an A / D conversion unit 6009. The analog signal transmitted from the analysis unit 600 via the connection cable 4202 is input to the A / D conversion unit 6009 via the connection port 6008. The A / D conversion unit 6009 converts an analog signal into a digital signal by the same processing as the A / D conversion unit 482.
解析ユニット600は、複数の接続ポート6008を介して、複数の測定ユニット400と接続されてもよい。複数の測定ユニット400が設けられている場合、測定ユニット400のそれぞれに解析ユニット600が接続されてもよい(例えば、複数の測定ユニット400と複数の解析ユニット600が、それぞれ、一対一に接続される)。
The analysis unit 600 may be connected to a plurality of measurement units 400 via a plurality of connection ports 6008. When a plurality of measurement units 400 are provided, the analysis unit 600 may be connected to each of the measurement units 400 (for example, the plurality of measurement units 400 and the plurality of analysis units 600 are connected one-to-one). Ru).
図31に示すように、プロセッサ6001および並列処理プロセッサ6002は、上述のプロセッサ4831および並列処理プロセッサ4833と同様の構成および機能を有する。プロセッサ6001上で、測定された細胞の細胞種別を解析する解析ソフトウェア6100が動作する。プロセッサ6001上で動作する解析ソフトウェア6100は、図16に示された解析ソフトウェア4832と同様の機能を有する。解析ソフトウェア6100は、図16、図17、図18、図21、図22およびその関連記載と同様の動作によって、測定された細胞の細胞種別を解析する。解析ソフトウェア6100は、測定された細胞の細胞種別の解析結果を、インタフェース部6007を介して処理ユニット300に送信する。インタフェース部6007は、例えば、イーサネット、USBである。インタフェース部6007は、無線通信可能なインタフェース(例えば、WiFi、Bluetooth)でもよい。
As shown in FIG. 31, the processor 6001 and the parallel processing processor 6002 have the same configurations and functions as the above-mentioned processor 4831 and the parallel processing processor 4833. The analysis software 6100 that analyzes the cell type of the measured cell runs on the processor 6001. The analysis software 6100 running on the processor 6001 has the same functions as the analysis software 4832 shown in FIG. The analysis software 6100 analyzes the cell type of the measured cell by the same operation as in FIG. 16, FIG. 17, FIG. 18, FIG. 21, FIG. 22 and related descriptions thereof. The analysis software 6100 transmits the analysis result of the measured cell type of the cell to the processing unit 300 via the interface unit 6007. The interface unit 6007 is, for example, Ethernet or USB. The interface unit 6007 may be an interface capable of wireless communication (for example, WiFi, Bluetooth).
この図33、図34に示される構成例5の細胞分析装置4000の場合、図20に示すフローチャートのうち、ステップS13(デジタル信号の生成)、ステップS14(細胞分類)、及びステップS15(分類情報の送信)が解析ユニット600において行われる。すなわち、解析ユニット600のA/D変換部6009においてデジタル信号の生成(ステップS13)が行われ、デジタル信号に基づく細胞分類(ステップS14)がプロセッサ6001と並列処理プロセッサ6002によって行われ、分類情報が解析ユニット600から処理ユニット300へ送信される(ステップS15)。図21、図22の処理は、解析ユニット600のプロセッサ6001と並列処理プロセッサ6002によって行われる。
In the case of the cell analyzer 4000 of the configuration example 5 shown in FIGS. 33 and 34, in the flowchart shown in FIG. 20, step S13 (digital signal generation), step S14 (cell classification), and step S15 (classification information). Is transmitted) in the analysis unit 600. That is, a digital signal is generated (step S13) in the A / D conversion unit 6009 of the analysis unit 600, cell classification based on the digital signal (step S14) is performed by the processor 6001 and the parallel processing processor 6002, and the classification information is obtained. It is transmitted from the analysis unit 600 to the processing unit 300 (step S15). The processing of FIGS. 21 and 22 is performed by the processor 6001 of the analysis unit 600 and the parallel processing processor 6002.
(波形データおよびデジタル信号のデータサイズ)
次に、波形データ及びデジタル信号のデータサイズについて説明する。本実施形態では、例えば、前方散乱光のアナログ信号(FSC)、側方散乱光のアナログ信号(SSC)、側方蛍光のアナログ信号(SFL)のそれぞれに対して、1つの細胞について一定間隔で複数の時点においてサンプリングが行われる。サンプリングレートの例は、10ナノ秒間隔で1024ポイントのサンプリング、80ナノ秒間隔で128ポイントのサンプリング、又は160ナノ秒間隔で64ポイントのサンプリング等を挙げることができる。データ量は、例えば、1サンプリングあたり2バイトとなる。FSC、SSC、SFLの各々について、サンプリングレートに応じた量のデータ(1024ポイントのレートの場合、2バイト×1024=2048バイト)が取得される。このデータ量は、一つの細胞あたりのデータ量である。1回の測定で、例えば、少なくとも100個の細胞について、FSC、SSC、SFLが測定される。また、1回の測定で、例えば、少なくとも1000個の細胞について、FSC、SSC、SFLが測定されることもある。また、1回の測定で、例えば、約10000個~約140000個の細胞について、FSC、SSC、SFLが測定されることもある。よって、例えば、1回の測定で計測される細胞数が100000個で、サンプリングレートが1024の場合、FSC、SSC、SFLの各々のデジタル信号のデータ量は、2バイト×1024×100000=204,800,000バイトとなり、FSC、SSC、SFLの合計で、614,400,000バイトとなる。 (Data size of waveform data and digital signal)
Next, the data size of the waveform data and the digital signal will be described. In the present embodiment, for example, for each of the analog signal of forward scattered light (FSC), the analog signal of laterally scattered light (SSC), and the analog signal of lateral fluorescence (SFL), one cell is at regular intervals. Sampling is done at multiple time points. Examples of sampling rates include 1024 point sampling at 10 nanosecond intervals, 128 point sampling at 80 nanosecond intervals, 64 point sampling at 160 nanosecond intervals, and the like. The amount of data is, for example, 2 bytes per sampling. For each of FSC, SSC, and SFL, an amount of data corresponding to the sampling rate (2 bytes × 1024 = 2048 bytes in the case of a 1024-point rate) is acquired. This amount of data is the amount of data per cell. In one measurement, for example, FSC, SSC, SFL are measured for at least 100 cells. In addition, FSC, SSC, and SFL may be measured in one measurement, for example, for at least 1000 cells. In addition, FSC, SSC, and SFL may be measured for, for example, about 10,000 to about 140000 cells in one measurement. Therefore, for example, when the number of cells measured in one measurement is 100,000 and the sampling rate is 1024, the data amount of each digital signal of FSC, SSC, and SFL is 2 bytes × 1024 × 100,000 = 204, It becomes 800,000 bytes, and the total of FSC, SSC, and SFL becomes 614,400,000 bytes.
更に、FSC、SSC、SFLは、測定チャネル毎に計測される。よって、例えば、1回の測定で計測される細胞数が100000個で、サンプリングレートが1024、測定チャネル数が5の場合、FSC、SSC、SFLの各々のデータ量は、2バイト×1024×100000×5=1,024,000,000バイトとなり、FSC、SSC、SFLの合計で、3,072,000,000バイトとなる。
Furthermore, FSC, SSC, and SFL are measured for each measurement channel. Therefore, for example, when the number of cells measured in one measurement is 100,000, the sampling rate is 1024, and the number of measurement channels is 5, the data amount of each of FSC, SSC, and SFL is 2 bytes × 1024 × 100,000. × 5 = 1,024,000,000 bytes, and the total of FSC, SSC, and SFL is 3,072,000,000 bytes.
以上より、デジタル信号の容量は、例えば、1検体あたり数百メガバイトから数ギガバイトとなり、細胞数、サンプリングレート、測定チャンネル数によっては、少なくとも1ギガバイトとなる。
From the above, the capacity of the digital signal is, for example, several hundred megabytes to several gigabytes per sample, and is at least one gigabyte depending on the number of cells, the sampling rate, and the number of measurement channels.
本実施形態によれば、1検体あたり数百メガバイトから数ギガバイトに及ぶ膨大な容量のデジタル信号を分析するにあたり、上述のとおり細胞分析装置4000又は4000’の内部で深層学習アルゴリズム60を用いた分析処理が完結し、細胞分析装置4000又は4000’の外部に設置された分析用サーバにインターネットまたはイントラネットを介してデジタル信号が送信されることはない。よって、細胞分析装置4000又は4000’から分析用サーバにデジタル信号を送信する場合に生じる通信負荷の増大に伴う処理能力低下を回避することができる。
According to the present embodiment, in analyzing a digital signal having a huge capacity ranging from several hundred megabytes to several gigabytes per sample, analysis using the deep learning algorithm 60 inside the cell analyzer 4000 or 4000'as described above is performed. The process is complete and no digital signal is transmitted over the internet or intranet to the analytical server installed outside the cell analyzer 4000 or 4000'. Therefore, it is possible to avoid a decrease in processing capacity due to an increase in communication load that occurs when a digital signal is transmitted from the cell analyzer 4000 or 4000'to the analysis server.
<第2の細胞分析装置と第2の細胞分析装置における生体試料の測定>
第2の細胞分析装置4000’の構成例として、測定ユニット500が尿試料又は体液試料を測定するためのフローサイトメータを備える尿中有形成分分析装置または体液分析装置である場合のブロック図の例を示す。 <Measurement of biological samples in the second cell analyzer and the second cell analyzer>
As a configuration example of the second cell analyzer 4000', the block diagram of the case where themeasurement unit 500 is a urinary formation analyzer or a body fluid analyzer provided with a flow cytometer for measuring a urine sample or a body fluid sample. An example is shown.
第2の細胞分析装置4000’の構成例として、測定ユニット500が尿試料又は体液試料を測定するためのフローサイトメータを備える尿中有形成分分析装置または体液分析装置である場合のブロック図の例を示す。 <Measurement of biological samples in the second cell analyzer and the second cell analyzer>
As a configuration example of the second cell analyzer 4000', the block diagram of the case where the
図35は、測定ユニット500のブロック図の例である。図35において、測定ユニット500は、検体分配部501、試料調製部502、光学検出部505、光学検出部505の出力信号(プリアンプにより増幅された出力信号)を増幅する増幅回路550、増幅回路550からの出力信号に対してフィルタ処理を行うフィルタ回路506、フィルタ回路506の出力信号(アナログ信号)をデジタル信号に変換するA/D変換部507、プロセッサ4831、並列処理プロセッサ4833、RAM4834、バスコントローラ4850、記憶装置511a、LAN(Local Area Network)アダプタ512を含む。プロセッサ4831、並列処理プロセッサ4833、RAM4834、バスコントローラ4850、記憶装置511a、LANアダプタ512は、バス508に接続されている。深層学習アルゴリズム60および深層学習アルゴリズム60に基づく解析ソフトウェアは記憶装置511aに格納されている。
FIG. 35 is an example of a block diagram of the measurement unit 500. In FIG. 35, the measurement unit 500 includes an amplifier circuit 550 and an amplifier circuit 550 that amplify the output signals (output signals amplified by the preamplifier) of the sample distribution unit 501, the sample preparation unit 502, the optical detection unit 505, and the optical detection unit 505. Filter circuit 506 that filters the output signal from, A / D converter 507 that converts the output signal (analog signal) of the filter circuit 506 into a digital signal, processor 4831, parallel processing processor 4833, RAM4834, bus controller Includes 4850, storage device 511a, and LAN (Local Area Network) adapter 512. The processor 4831, the parallel processing processor 4833, the RAM 4834, the bus controller 4850, the storage device 511a, and the LAN adapter 512 are connected to the bus 508. The analysis software based on the deep learning algorithm 60 and the deep learning algorithm 60 is stored in the storage device 511a.
プロセッサ4831は、第1の細胞分析装置4000の例に基づいて説明したように、A/D変換部507から出力されたデジタル信号に対して所定の演算処理を行う。プロセッサ4831は、並列処理プロセッサ4833を用いて、波形データを分析する。プロセッサ4831及び並列処理プロセッサ4833の構成例及び並列処理プロセッサ4833の動作は、上述の図11~図19及びその関連記載と同様である。
The processor 4831 performs predetermined arithmetic processing on the digital signal output from the A / D conversion unit 507, as described based on the example of the first cell analyzer 4000. Processor 4831 uses the parallel processing processor 4833 to analyze the waveform data. The configuration example of the processor 4831 and the parallel processing processor 4833 and the operation of the parallel processing processor 4833 are the same as those in FIGS. 11 to 19 and the related description described above.
処理ユニット300は、例えば、LANアダプタ512を介して測定ユニット500とLANケーブルにて接続されており、この処理ユニット300により、測定ユニット500で取得された測定データに基づく検査結果の生成が行われる。光学検出部505、増幅回路550、フィルタ回路506、A/D変換部507、プロセッサ4831、並列処理プロセッサ4833、記憶装置511aは、測定試料を測定し、測定データを生成する光学測定部510を構成している。
The processing unit 300 is connected to the measurement unit 500 via a LAN cable, for example, via a LAN adapter 512, and the processing unit 300 generates inspection results based on the measurement data acquired by the measurement unit 500. .. The optical detection unit 505, the amplifier circuit 550, the filter circuit 506, the A / D conversion unit 507, the processor 4831, the parallel processing processor 4833, and the storage device 511a constitute an optical measurement unit 510 that measures a measurement sample and generates measurement data. is doing.
図36は、測定ユニット500の光学検出部505の構成を示す図である。図36において、コンデンサレンズ552は、光源である半導体レーザ光源553から放射されたレーザ光をフローセル551に集光し、集光レンズ554は測定試料中の有形成分から発せられる前方散乱光を前方散乱光受光部555に集光する。また、他の集光レンズ556は有形成分から発せられる側方散乱光と蛍光とをダイクロイックミラー557に集光する。ダイクロイックミラー557は、側方散乱光を側方散乱光受光部558へ反射し、蛍光を蛍光受光部559の方へ透過させる。これらの光信号は、測定試料中の有形成分の特徴を反映する。そして、前方散乱光受光部555、側方散乱光受光部558及び蛍光受光部559は光信号を電気信号に変換し、それぞれ、前方散乱光信号、側方散乱光信号及び蛍光信号を出力する。これらの出力は、プリアンプにより増幅された後、次段の処理に供される。また、前方散乱光受光部555、側方散乱光受光部558及び蛍光受光部559のそれぞれは、駆動電圧を切り替えることにより、低感度出力と高感度出力との切り替えが可能である。この感度の切り替えは、後述のプロセッサ4831により行われる。本実施形態では、前方散乱光受光部555としてフォトダイオードが用いられ、側方散乱光受光部558及び蛍光受部55としてフォトマルチプライヤチューブを用いてもよいし、側方散乱光受光部558及び蛍光受光部559としてフォトダイオードを用いてもよい。なお、蛍光受光部559から出力された蛍光信号は、プリアンプにより増幅された後、分岐する二つの信号チャンネルに与えられる。二つの信号チャンネルは、それぞれ図35にて前述した増幅回路550に接続されている。一方の信号チャンネルに入力された蛍光は、増幅回路550により高感度に増幅される。
FIG. 36 is a diagram showing the configuration of the optical detection unit 505 of the measurement unit 500. In FIG. 36, the condenser lens 552 concentrates the laser light radiated from the semiconductor laser light source 551 as a light source on the flow cell 551, and the condenser lens 554 forward-scatters the forward scattered light emitted from the formed components in the measurement sample. Condenses light on the light receiving unit 555. Further, the other condenser lens 556 concentrates the laterally scattered light and the fluorescence emitted from the formed component on the dichroic mirror 557. The dichroic mirror 557 reflects the side-scattered light to the side-scattered light receiving unit 558, and transmits the fluorescence toward the fluorescence light-receiving unit 559. These optical signals reflect the characteristics of the formed components in the measurement sample. Then, the forward scattered light receiving unit 555, the side scattered light receiving unit 558, and the fluorescent light receiving unit 559 convert the optical signal into an electric signal, and output the forward scattered light signal, the side scattered light signal, and the fluorescence signal, respectively. These outputs are amplified by the preamplifier and then used for the next stage processing. Further, each of the forward scattered light receiving unit 555, the side scattered light receiving unit 558, and the fluorescent light receiving unit 559 can switch between low-sensitivity output and high-sensitivity output by switching the drive voltage. This sensitivity switching is performed by the processor 4831 described later. In the present embodiment, a photodiode is used as the forward scattered light receiving unit 555, and a photomultiplier tube may be used as the side scattered light receiving unit 558 and the fluorescence receiving unit 55, or the side scattered light receiving unit 558 and A photodiode may be used as the fluorescence light receiving unit 559. The fluorescence signal output from the fluorescence light receiving unit 559 is amplified by the preamplifier and then given to the two branching signal channels. The two signal channels are connected to the amplifier circuit 550 described above in FIG. 35, respectively. The fluorescence input to one signal channel is amplified with high sensitivity by the amplifier circuit 550.
(測定試料の調製)
図37は、図35にて示した試料調製部502及び光学検出部505の概略機能構成を示す図である。図35及び図37に示した検体分配部501は、吸引管517とシリンジポンプとを備える。検体分配部501は、検体(尿又は体液)00bを、吸引管517を介して吸引し、試料調製部502へ分注する。試料調製部502は、反応槽512uと反応槽512bとを備えている。検体分配部501は、反応槽512u及び反応槽512bのそれぞれに定量された測定試料を分配する。 (Preparation of measurement sample)
FIG. 37 is a diagram showing a schematic functional configuration of thesample preparation unit 502 and the optical detection unit 505 shown in FIG. 35. The sample distribution unit 501 shown in FIGS. 35 and 37 includes a suction tube 517 and a syringe pump. The sample distribution unit 501 sucks the sample (urine or body fluid) 00b through the suction tube 517 and dispenses it to the sample preparation unit 502. The sample preparation unit 502 includes a reaction tank 512u and a reaction tank 512b. The sample distribution unit 501 distributes the quantified measurement sample to each of the reaction tank 512u and the reaction tank 512b.
図37は、図35にて示した試料調製部502及び光学検出部505の概略機能構成を示す図である。図35及び図37に示した検体分配部501は、吸引管517とシリンジポンプとを備える。検体分配部501は、検体(尿又は体液)00bを、吸引管517を介して吸引し、試料調製部502へ分注する。試料調製部502は、反応槽512uと反応槽512bとを備えている。検体分配部501は、反応槽512u及び反応槽512bのそれぞれに定量された測定試料を分配する。 (Preparation of measurement sample)
FIG. 37 is a diagram showing a schematic functional configuration of the
反応槽512uにおいて、分配された生体試料は、希釈液としての第1試薬519u及び染料を含む第3試薬518uと混合される。第3試薬518uに含まれる色素により、検体中の有形成分が染色される。生体試料が尿の場合、この反応槽512uにおいて調製された試料は、赤血球、白血球、上皮細胞、腫瘍細胞等の比較的大きい尿中有形成分を分析するための第1測定試料として使用される。生体試料が体液の場合、反応槽512uにおいて調製された試料は、体液中の赤血球を分析するための第3測定試料として使用される。
In the reaction tank 512u, the distributed biological sample is mixed with the first reagent 519u as a diluent and the third reagent 518u containing the dye. The formed component in the sample is stained with the dye contained in the third reagent 518u. When the biological sample is urine, the sample prepared in this reaction tank 512u is used as a first measurement sample for analyzing relatively large urinary formations such as erythrocytes, leukocytes, epithelial cells, and tumor cells. .. When the biological sample is a body fluid, the sample prepared in the reaction tank 512u is used as a third measurement sample for analyzing red blood cells in the body fluid.
一方、反応槽512bにおいて、分配された生体試料は、希釈液としての第2試薬519b及び染料を含む第4試薬518bと混合される。後述するように、第2試薬519bは、溶血作用を有する。第4試薬518bに含まれる色素により、検体中の有形成分が染色される。生体試料が尿の場合、この反応槽512bにおいて調製された試料は、尿中の細菌を分析するための第2測定試料となる。生体試料が体液である場合において、反応槽512bにおいて調製された試料は、体液中の有核細胞(白血球及び大型細胞)及び細菌を分析するための第4測定試料となる。
On the other hand, in the reaction tank 512b, the distributed biological sample is mixed with the second reagent 519b as a diluent and the fourth reagent 518b containing the dye. As will be described later, the second reagent 519b has a hemolytic effect. The dye contained in the fourth reagent 518b stains the formed components in the sample. When the biological sample is urine, the sample prepared in this reaction tank 512b becomes a second measurement sample for analyzing bacteria in urine. When the biological sample is a body fluid, the sample prepared in the reaction tank 512b becomes a fourth measurement sample for analyzing nucleated cells (white blood cells and large cells) and bacteria in the body fluid.
反応槽512uからは、光学検出部505のフローセル551へとチューブが延設されており、反応槽512uにおいて調製された測定試料がフローセル551へと供給可能となっている。また、反応槽512uの出口には、電磁弁521uが設けられている。反応槽512bからもチューブが延設されており、このチューブが反応槽2uから延びたチューブの途中に連結されている。これにより、反応槽512bにおいて調製された測定試料がフローセル551へと供給可能となっている。また、反応槽512uの出口には、電磁弁521bが設けられている。
A tube extends from the reaction tank 512u to the flow cell 551 of the optical detection unit 505, and the measurement sample prepared in the reaction tank 512u can be supplied to the flow cell 551. Further, a solenoid valve 521u is provided at the outlet of the reaction tank 512u. A tube is also extended from the reaction tank 512b, and this tube is connected in the middle of the tube extending from the reaction tank 2u. As a result, the measurement sample prepared in the reaction vessel 512b can be supplied to the flow cell 551. Further, a solenoid valve 521b is provided at the outlet of the reaction tank 512u.
反応槽512u、512bからフローセル551まで延設されたチューブは、フローセル551の手前で分岐しており、その分岐先がシリンジポンプ520aに接続されている。また、シリンジポンプ520aと分岐点との間には、電磁弁521cが設けられている。
The tube extending from the reaction tanks 512u and 512b to the flow cell 551 is branched in front of the flow cell 551, and the branch destination is connected to the syringe pump 520a. Further, a solenoid valve 521c is provided between the syringe pump 520a and the branch point.
反応槽512u、512bのそれぞれから延設されたチューブの接続点から、分岐点までの途中で、チューブはさらに分岐しており、その分岐先がシリンジポンプ520bに接続されている。また、シリンジポンプ520bへ延びるチューブの分岐点と、接続点との間には、電磁弁521dが設けられている。
The tube is further branched on the way from the connection point of the tube extending from each of the reaction tanks 512u and 512b to the branch point, and the branch destination is connected to the syringe pump 520b. Further, a solenoid valve 521d is provided between the branch point of the tube extending to the syringe pump 520b and the connection point.
また、試料調製部502には、シース液を収容するシース液収容部522が接続されており、このシース液収容部522がチューブによってフローセル551に接続されている。シース液収容部522にはコンプレッサ522aが接続されており、コンプレッサ522aが駆動されると、シース液収容部522に圧縮空気が供給され、シース液収容部522からフローセル551へとシース液が供給される。
Further, a sheath liquid accommodating unit 522 for accommodating the sheath liquid is connected to the sample preparation unit 502, and this sheath liquid accommodating unit 522 is connected to the flow cell 551 by a tube. A compressor 522a is connected to the sheath liquid accommodating portion 522, and when the compressor 522a is driven, compressed air is supplied to the sheath liquid accommodating portion 522, and the sheath liquid is supplied from the sheath liquid accommodating portion 522 to the flow cell 551. To.
反応槽512u、512bのそれぞれにおいて調製された2種類の懸濁液(測定試料)は、先に反応槽512uの懸濁液(生体試料が尿のときは第1測定試料。生体試料が体液のときは第3測定試料。)が光学検出部505に導かれ、フローセル551においてシース液に包まれた細い流れを形成し、そこに、レーザ光が照射される。その後同様に、反応槽512bの懸濁液(生体試料が尿のときは第2測定試料。生体試料が体液のときは第4測定試料。)が光学検出部505に導かれ、フローセル551において細い流れを形成し、レーザ光が照射される。このような動作は、プロセッサ4831(制御部)の制御により、電磁弁521a、521b、521c、521d及び駆動部503等を動作させることで、自動的に行われる。
The two types of suspensions (measurement samples) prepared in each of the reaction tanks 512u and 512b are the suspensions of the reaction tank 512u (the first measurement sample when the biological sample is urine. The biological sample is the body fluid. In some cases, the third measurement sample.) Is guided to the optical detection unit 505 to form a thin flow wrapped in the sheath liquid in the flow cell 551, and the laser beam is irradiated there. After that, similarly, the suspension of the reaction tank 512b (the second measurement sample when the biological sample is urine. The fourth measurement sample when the biological sample is body fluid) is guided to the optical detection unit 505 and is thin in the flow cell 551. It forms a flow and is irradiated with laser light. Such an operation is automatically performed by operating the solenoid valves 521a, 521b, 521c, 521d, the drive unit 503, and the like under the control of the processor 4831 (control unit).
第1試薬から第4試薬について詳細に説明する。第1試薬519uは、緩衝剤を主成分とする試薬であって、赤血球を溶血させずに安定した蛍光信号を得ることができるように浸透圧補償剤を含有しており、分類測定に適するような浸透圧となるよう100~600mOsm/kgに調整されている。第1試薬519uは、尿中の赤血球に対する溶血作用を有していないことが好ましい。
The first reagent to the fourth reagent will be described in detail. The first reagent 519u is a reagent containing a buffer as a main component, and contains an osmotic pressure compensating agent so that a stable fluorescent signal can be obtained without hemolyzing erythrocytes, so that it is suitable for classification measurement. The osmotic pressure is adjusted to 100 to 600 mOsm / kg. The first reagent 519u preferably does not have a hemolytic effect on red blood cells in urine.
第2試薬519bは、第1試薬519uと異なり、溶血作用を有している。これは、後述する第4試薬518bの細菌の細胞膜への通過性を高めて染色を早く進行させるためである。さらに、粘液糸、赤血球破片などの夾雑物を収縮させるためでもある。第2試薬519bは溶血作用を獲得するために界面活性剤を含む。界面活性剤は、アニオン、ノニオン、カチオンなど種々用いられるが、カチオン系界面活性剤が特に好適である。界面活性剤により細菌の細胞膜にダメージを与えることができるため、第4試薬518bが含有する色素により効率よく細菌の核酸を染色することができる。その結果、細菌の測定を短時間の染色処理で行うことができる。
The second reagent 519b has a hemolytic action unlike the first reagent 519u. This is to enhance the passage of the fourth reagent 518b, which will be described later, to the cell membrane of the bacterium, and to accelerate the staining. It is also to shrink impurities such as mucous threads and red blood cell debris. The second reagent 519b contains a surfactant to obtain hemolytic action. Various surfactants such as anions, nonions, and cations are used, but cationic surfactants are particularly suitable. Since the surfactant can damage the cell membrane of the bacterium, the dye contained in the fourth reagent 518b can efficiently stain the nucleic acid of the bacterium. As a result, the measurement of bacteria can be performed in a short time staining process.
さらに他の実施形態として、第2試薬519bは、界面活性剤ではなく、酸性又は低pHに調整されることで溶血作用を獲得してもよい。低pHとは、第1試薬19uよりもpHが低いことをいう。第1試薬519uが中性若しくは弱酸性~弱アルカリ性の範囲内であるとき、第2試薬19bは酸性又は強酸性である。第1試薬519uのpHが6.0~8.0であるとき、第2試薬519bのpHは、それよりも低いpHであり、好ましくは2.0~6.0である。
As yet another embodiment, the second reagent 519b may acquire a hemolytic action by being adjusted to an acidity or a low pH instead of a surfactant. The low pH means that the pH is lower than that of the first reagent 19u. When the first reagent 519u is in the range of neutral or weakly acidic to weakly alkaline, the second reagent 19b is acidic or strongly acidic. When the pH of the first reagent 519u is 6.0 to 8.0, the pH of the second reagent 519b is lower than that, preferably 2.0 to 6.0.
第2試薬519bは、界面活性剤を含み、かつ、低pHに調整されていてもよい。
The second reagent 519b may contain a surfactant and may be adjusted to a low pH.
さらに他の実施形態として、第2試薬519bは、第1試薬19uよりも低い浸透圧にすることで、溶血作用を獲得してもよい。
As yet another embodiment, the second reagent 519b may acquire a hemolytic action by setting the osmotic pressure to be lower than that of the first reagent 19u.
一方、第1試薬519uは界面活性剤を含んでいない。なお、他の実施形態としては、第1試薬519uは界面活性剤を含んでもよいが、赤血球を溶血させないように種類と濃度を調整する必要がある。よって、第1試薬519uは、第2試薬519bと同じ界面活性剤を含まないか、若しくは同じ界面活性剤を含んでいたとしても、第2試薬519bよりも低濃度であることが好ましい。
On the other hand, the first reagent 519u does not contain a surfactant. In another embodiment, the first reagent 519u may contain a surfactant, but it is necessary to adjust the type and concentration so as not to hemolyze the erythrocytes. Therefore, it is preferable that the first reagent 519u does not contain the same surfactant as the second reagent 519b, or even if it contains the same surfactant, the concentration is lower than that of the second reagent 519b.
第3試薬518uは、尿中有形成分(赤血球、白血球、上皮細胞、円柱等)の測定に用いられる染色試薬である。第3試薬518uが含む染料としては、核酸を有していない有形成分をも染色するために、膜染色をする染料が選ばれる。第3試薬518uは、好ましくは赤血球溶血を防ぐ目的及び安定した蛍光強度を得る目的のために浸透圧補償剤を含み、分類測定に適するような浸透圧となるよう100~600mOsm/kgに調整されている。第3試薬18uによって尿中有形成分の細胞膜、核(膜)が染色される。膜染色する色素を含有する染色試薬としては縮合ベンゼン誘導体が用いられ、例えば、シアニン系色素を用いることができる。なお、第3試薬18uは、細胞膜だけでなく核膜も染色するようになっている。第3試薬518uを用いると、白血球、上皮等の有核細胞では、細胞質(細胞膜)における染色強度と核(核膜)における染色強度とが合わさり、核酸を有しない尿中有形成分よりも染色強度が高くなる。これによって白血球及び上皮等の有核細胞を赤血球等の核酸のない尿中有形成分と弁別することができる。第3試薬として、米国5891733号公報に記載の試薬を用いることができる。米国5891733号公報は、参照により本明細書に組み込まれる。第3試薬518uは、第1試薬519uとともに尿又は体液と混合される。
The third reagent 518u is a staining reagent used for measuring urinary formed components (erythrocytes, leukocytes, epithelial cells, cylinders, etc.). As the dye contained in the third reagent 518u, a dye for film staining is selected in order to stain formed components having no nucleic acid. The third reagent 518u preferably contains an osmotic pressure compensating agent for the purpose of preventing erythrocyte hemolysis and for obtaining stable fluorescence intensity, and is adjusted to 100 to 600 mOsm / kg so as to have an osmotic pressure suitable for classification measurement. ing. The cell membrane and nucleus (membrane) of the urinary formation are stained with the third reagent 18u. A condensed benzene derivative is used as a dyeing reagent containing a dye for film dyeing, and for example, a cyanine dye can be used. The third reagent 18u stains not only the cell membrane but also the nuclear membrane. When the third reagent 518u is used, in nucleated cells such as leukocytes and epithelium, the staining intensity in the cytoplasm (cell membrane) and the staining intensity in the nucleus (nuclear envelope) are combined, and the staining is higher than that in urinary formation without nucleic acid. The strength increases. This makes it possible to discriminate nucleated cells such as leukocytes and epithelium from nucleic acid-free urinary formations such as erythrocytes. As the third reagent, the reagent described in JP-A-5891733 can be used. US 5891733 is incorporated herein by reference. The third reagent 518u is mixed with urine or body fluid together with the first reagent 519u.
第4試薬518bは、細菌及び真菌と同等の大きさの夾雑物が含まれている検体であっても、細菌を精度良く測定しうる染色試薬である。第4試薬518bとしては、欧州出願公開1136563号公報に詳細な説明がある。第4試薬518bに含まれる染料としては核酸を染色する染料が好適に用いられる。核染色する色素を含有する染色試薬としては、例えば、米国特許7309581号のシアニン系色素を用いることができる。第4試薬518bは、第2試薬519bとともに尿又は検体と混合される。欧州出願公開1136563号公報及び米国特許7309581号は、参照により本明細書に組み込まれる。
The fourth reagent 518b is a staining reagent that can accurately measure bacteria even if it is a sample containing impurities of the same size as bacteria and fungi. The fourth reagent 518b is described in detail in European Application Publication No. 1136563. As the dye contained in the fourth reagent 518b, a dye that stains nucleic acid is preferably used. As a staining reagent containing a dye for nuclear staining, for example, a cyanine-based dye of US Pat. No. 7,309,581 can be used. The fourth reagent 518b is mixed with urine or a sample together with the second reagent 519b. Publication No. 1136563 and US Pat. No. 7,309,581 are incorporated herein by reference.
したがって、第3試薬518uは細胞膜を染色する色素を含有し、一方、第4試薬518bは核酸を染色する色素を含有していることが好ましい。尿中有形成分には、赤血球のような核を有しないものが含まれているため、第3試薬518uが細胞膜を染色する色素を含有することにより、このような核を有しないものも含めて尿中有形成分を検出することができる。また、第2試薬は細菌の細胞膜にダメージを与えることができるため、第4試薬18bが含有する色素により効率よく細菌及び真菌の核酸を染色することができる。その結果、細菌の測定を短時間の染色処理で行うことができる。
Therefore, it is preferable that the third reagent 518u contains a dye that stains the cell membrane, while the fourth reagent 518b contains a dye that stains nucleic acid. Since the urinary formations include those that do not have nuclei such as red blood cells, the third reagent 518u contains a dye that stains the cell membrane, so that those that do not have such nuclei are also included. It is possible to detect urinary formations. Further, since the second reagent can damage the cell membrane of the bacterium, the dye contained in the fourth reagent 18b can efficiently stain the nucleic acid of the bacterium and the fungus. As a result, the measurement of bacteria can be performed in a short time staining process.
[3.第1の波形データ分析システム]
<第1の波形データ分析システムの構成>
他の実施形態は、波形データ分析システムに関する。図38を参照すると、第1の波形データ分析システムは、深層学習装置100Aを備える。ベンダ側装置100は深層学習装置100Aとして動作する。深層学習装置100Aは、ニューラルネットワーク50に訓練データを使って学習させ、訓練データによって訓練された深層学習アルゴリズム60をユーザに提供する。学習済みのニューラルネットワークから構成される深層学習アルゴリズム60は、記録媒体98又は通信ネットワーク99を通じて、深層学習装置100Aから測定ユニット400に提供される。測定ユニット400は、学習済みのニューラルネットワークから構成される深層学習アルゴリズム60を用いて分析対象の細胞の波形データの分析を行う。 [3. First waveform data analysis system]
<Structure of the first waveform data analysis system>
Another embodiment relates to a waveform data analysis system. Referring to FIG. 38, the first waveform data analysis system includes adeep learning device 100A. The vendor side device 100 operates as a deep learning device 100A. The deep learning device 100A causes the neural network 50 to learn using the training data, and provides the user with the deep learning algorithm 60 trained by the training data. The deep learning algorithm 60 composed of the trained neural network is provided from the deep learning device 100A to the measurement unit 400 through the recording medium 98 or the communication network 99. The measurement unit 400 analyzes the waveform data of the cell to be analyzed by using the deep learning algorithm 60 composed of the trained neural network.
<第1の波形データ分析システムの構成>
他の実施形態は、波形データ分析システムに関する。図38を参照すると、第1の波形データ分析システムは、深層学習装置100Aを備える。ベンダ側装置100は深層学習装置100Aとして動作する。深層学習装置100Aは、ニューラルネットワーク50に訓練データを使って学習させ、訓練データによって訓練された深層学習アルゴリズム60をユーザに提供する。学習済みのニューラルネットワークから構成される深層学習アルゴリズム60は、記録媒体98又は通信ネットワーク99を通じて、深層学習装置100Aから測定ユニット400に提供される。測定ユニット400は、学習済みのニューラルネットワークから構成される深層学習アルゴリズム60を用いて分析対象の細胞の波形データの分析を行う。 [3. First waveform data analysis system]
<Structure of the first waveform data analysis system>
Another embodiment relates to a waveform data analysis system. Referring to FIG. 38, the first waveform data analysis system includes a
深層学習装置100Aは、例えば汎用コンピュータで構成されており、後述するフローチャートに基づいて、深層学習処理を行う。測定ユニット400は、後述するフローチャートに基づいて、波形データ分析処理を行う。記録媒体98は、例えばDVD-ROMやUSBメモリ等の、コンピュータ読み取り可能であって非一時的な有形の記録媒体である。
The deep learning device 100A is composed of, for example, a general-purpose computer, and performs deep learning processing based on a flowchart described later. The measurement unit 400 performs waveform data analysis processing based on a flowchart described later. The recording medium 98 is a computer-readable and non-temporary tangible recording medium such as a DVD-ROM or a USB memory.
深層学習装置100Aは測定ユニット400a又は測定ユニット500aに接続されている。測定ユニット400a又は測定ユニット500aの構成は、それぞれ上述した測定ユニット400又は測定ユニット500と同様である。深層学習装置100Aは、測定ユニット400a又は測定ユニット500aによって取得された訓練用の波形データを取得する。訓練用の波形データの生成方法は、上述の通りである。
The deep learning device 100A is connected to the measurement unit 400a or the measurement unit 500a. The configuration of the measuring unit 400a or the measuring unit 500a is the same as that of the measuring unit 400 or the measuring unit 500 described above, respectively. The deep learning device 100A acquires waveform data for training acquired by the measurement unit 400a or the measurement unit 500a. The method of generating waveform data for training is as described above.
図38に示すように、測定ユニット400a又は測定ユニット500aは、それぞれフローセル4113、551を備える。測定ユニット400a又は測定ユニット500aは、生体試料をフローセル4113、551に送液する。フローセル4113、551に供給された生体試料に、光源4112、553から光が照射され、生体試料中の細胞から発せられた前方散乱光、側方散乱光、及び側方蛍光を光検出部(4116、4121、4122、555、558、559)が検出する。測定ユニット400a又は測定ユニット500aは、光検出部(4116、4121、4122、555、558、559)が光を検出して得られる前方散乱光信号、側方散乱光信号、及び側方蛍光信号から波形データを生成し、ベンダ側装置100に波形データを送信する。
As shown in FIG. 38, the measuring unit 400a or the measuring unit 500a includes flow cells 4113 and 551, respectively. The measuring unit 400a or the measuring unit 500a sends the biological sample to the flow cells 4113 and 551. The biological sample supplied to the flow cells 4113 and 551 is irradiated with light from the light sources 4112 and 553, and the forward scattered light, the lateral scattered light, and the lateral fluorescence emitted from the cells in the biological sample are emitted from the light detection unit (4116). 4121, 4122, 555, 558, 559) are detected. The measuring unit 400a or the measuring unit 500a is derived from the forward scattered light signal, the side scattered light signal, and the side fluorescent signal obtained by detecting the light by the light detection unit (4116, 4121, 4122, 555, 558, 559). Waveform data is generated, and the waveform data is transmitted to the vendor side device 100.
<深層学習装置のハードウェア構成>
図39に、ベンダ側装置100(深層学習装置100A)のブロック図を例示する。ベンダ側装置100は、処理部10(10A)と、入力部16と、出力部17とを備える。 <Hardware configuration of deep learning device>
FIG. 39 illustrates a block diagram of the vendor side device 100 (deep learning device 100A). The vendor side device 100 includes a processing unit 10 (10A), an input unit 16, and an output unit 17.
図39に、ベンダ側装置100(深層学習装置100A)のブロック図を例示する。ベンダ側装置100は、処理部10(10A)と、入力部16と、出力部17とを備える。 <Hardware configuration of deep learning device>
FIG. 39 illustrates a block diagram of the vendor side device 100 (
処理部10は、例えば、後述するデータ処理を行うCPU11と、データ処理の作業領域に使用するメモリ12と、後述するプログラム及び処理データを記録する記憶部13と、各部の間でデータを伝送するバス14と、外部機器とのデータの入出力を行うインタフェース部(I/F部)15と、GPU19とを備えている。入力部16及び出力部17は、インタフェース部15を介して処理部10に接続されている。例示的には、入力部16はキーボード又はマウス等の入力装置であり、出力部17は液晶ディスプレイ等の表示装置である。GPU19は、CPU11が行う演算処理(例えば、並列演算処理)を補助するアクセラレータとして機能する。すなわち以下の説明においてCPU11が行う処理とは、CPU11がGPU19をアクセラレータとして用いて行う処理も含むことを意味する。GPU19は、上述の並列処理プロセッサ4833と同等の機能を有する。ここで、GPU19に代えて、ニューラルネットワークの計算に好ましい、チップを搭載してもよい。このようなチップとして、例えば、FPGA、ASIC、Myriad X(Intel)等を挙げることができる。
The processing unit 10 transmits data between, for example, a CPU 11 that performs data processing described later, a memory 12 used for a work area for data processing, a storage unit 13 that records a program and processing data described later, and each unit. It includes a bus 14, an interface unit (I / F unit) 15 for inputting / outputting data to / from an external device, and a GPU 19. The input unit 16 and the output unit 17 are connected to the processing unit 10 via the interface unit 15. Illustratively, the input unit 16 is an input device such as a keyboard or a mouse, and the output unit 17 is a display device such as a liquid crystal display. The GPU 19 functions as an accelerator that assists the arithmetic processing (for example, parallel arithmetic processing) performed by the CPU 11. That is, in the following description, the processing performed by the CPU 11 means that the processing performed by the CPU 11 using the GPU 19 as an accelerator is also included. The GPU 19 has the same function as the above-mentioned parallel processing processor 4833. Here, instead of GPU 19, a chip which is preferable for the calculation of the neural network may be mounted. Examples of such a chip include FPGA, ASIC, Myriad X (Intel) and the like.
また、処理部10は、以下の図43で説明する各ステップの処理を行うために、本実施形態に係るプログラム及び訓練前のニューラルネットワークで構成される深層学習アルゴリズム50を、例えば実行形式で記憶部13に予め記録している。実行形式は、例えばプログラミング言語からコンパイラにより変換されて生成される形式である。処理部10は、記憶部13に記録したプログラムを使用して、訓練前のニューラルネットワーク50の訓練処理を行う。
Further, the processing unit 10 stores, for example, an execution format of the deep learning algorithm 50 composed of the program according to the present embodiment and the neural network before training in order to perform the processing of each step described with reference to FIG. 43 below. It is recorded in advance in the unit 13. The execution format is, for example, a format generated by being converted by a compiler from a programming language. The processing unit 10 uses the program recorded in the storage unit 13 to perform training processing of the neural network 50 before training.
以下の説明においては、特に断らない限り、処理部10が行う処理は、記憶部13又はメモリ12に格納されたプログラム及びニューラルネットワーク50に基づいて、CPU11が行う処理を意味する。CPU11はメモリ12を作業領域として必要なデータ(処理途中の中間データ等)を一時記憶し、記憶部13に演算結果等の長期保存するデータを適宜記録する。
In the following description, unless otherwise specified, the processing performed by the processing unit 10 means the processing performed by the CPU 11 based on the program and the neural network 50 stored in the storage unit 13 or the memory 12. The CPU 11 temporarily stores necessary data (intermediate data in the middle of processing, etc.) using the memory 12 as a work area, and appropriately records data to be stored for a long period of time, such as a calculation result, in the storage unit 13.
<分析装置のハードウェア構成>
ベンダ側装置100から提供されたアルゴリズムに基づいて波形データを処理する測定ユニット400又は500の構成は、上述の構成と同等である。また、測定ユニット400又は500は、ベンダ側装置100(深層学習装置100A)の機能を兼備し、訓練データを使ってニューラルネットワーク50を学習させてもよい。この場合、ベンダ側装置100(深層学習装置100A)は不要となる。 <Hardware configuration of analyzer>
The configuration of the measurement unit 400 or 500 that processes the waveform data based on the algorithm provided by the vendor-side device 100 is the same as the configuration described above. Further, the measurement unit 400 or 500 may also have the function of the vendor side device 100 (deep learning device 100A) and may train the neural network 50 using the training data. In this case, the vendor side device 100 (deep learning device 100A) becomes unnecessary.
ベンダ側装置100から提供されたアルゴリズムに基づいて波形データを処理する測定ユニット400又は500の構成は、上述の構成と同等である。また、測定ユニット400又は500は、ベンダ側装置100(深層学習装置100A)の機能を兼備し、訓練データを使ってニューラルネットワーク50を学習させてもよい。この場合、ベンダ側装置100(深層学習装置100A)は不要となる。 <Hardware configuration of analyzer>
The configuration of the
また、測定ユニット制御部480は、以下の波形データ分析処理で説明する各ステップの処理を行うために、本実施形態に係るプログラム及び訓練済みのニューラルネットワークで構成される深層学習アルゴリズム60を、例えば実行形式で記憶部4835に予め記録している。実行形式は、例えばプログラミング言語からコンパイラにより変換されて生成される形式である。測定ユニット制御部480は、記憶部4835に記録したプログラム及び深層学習アルゴリズム60を使用して処理を行う。
Further, the measurement unit control unit 480 uses, for example, a deep learning algorithm 60 composed of the program according to the present embodiment and the trained neural network in order to perform the processing of each step described in the following waveform data analysis processing. It is recorded in advance in the storage unit 4835 in an execution format. The execution format is, for example, a format generated by being converted by a compiler from a programming language. The measurement unit control unit 480 performs processing using the program recorded in the storage unit 4835 and the deep learning algorithm 60.
図40に示すように、測定ユニット制御部480は、例えば、LANアダプタ481を介して、通信ネットワーク経由で、記憶部4835に記録したプログラム及び深層学習アルゴリズム60を更新してもよい。
図41に示すように、上述の解析ユニット600は、測定ユニット400から受信したデジタル信号と解析結果を、インタフェース部6011を介して、深層学習装置100Aに送信してもよい。解析ユニット600は、例えば、インターネットを介して、深層学習装置100Aに、波形データと、波形データに対応する分類情報とを送信する。深層学習装置100Aは、解析ユニット600から送信された波形データと、当該波形データに対応する分類情報とに基づいて学習処理を行い、深層学習アルゴリズム60を更新する。深層学習装置100Aは、更新した深層学習アルゴリズム60を解析ユニット600に送信する。解析ユニット600は、深層学習装置100Aから送信された深層学習アルゴリズム60により、記憶部6004に格納されたアルゴリズムを更新する。解析ユニット600は、例えば、測定ユニット400から伝送された波形データをプロセッサ6001および並列処理プロセッサ6002で処理している間に、並行して、その波形データを深層学習装置100Aに送信する。解析ユニット600は、波形データの解析、つまり分類情報の生成が完了次第、分類情報を深層学習装置100Aに送信する。 As shown in FIG. 40, the measurementunit control unit 480 may update the program and the deep learning algorithm 60 recorded in the storage unit 4835 via, for example, the LAN adapter 481 and the communication network.
As shown in FIG. 41, the above-mentionedanalysis unit 600 may transmit the digital signal received from the measurement unit 400 and the analysis result to the deep learning device 100A via the interface unit 6011. The analysis unit 600 transmits waveform data and classification information corresponding to the waveform data to the deep learning device 100A via the Internet, for example. The deep learning device 100A performs learning processing based on the waveform data transmitted from the analysis unit 600 and the classification information corresponding to the waveform data, and updates the deep learning algorithm 60. The deep learning device 100A transmits the updated deep learning algorithm 60 to the analysis unit 600. The analysis unit 600 updates the algorithm stored in the storage unit 6004 by the deep learning algorithm 60 transmitted from the deep learning device 100A. For example, the analysis unit 600 transmits the waveform data to the deep learning device 100A in parallel while the waveform data transmitted from the measurement unit 400 is being processed by the processor 6001 and the parallel processing processor 6002. The analysis unit 600 transmits the classification information to the deep learning device 100A as soon as the analysis of the waveform data, that is, the generation of the classification information is completed.
図41に示すように、上述の解析ユニット600は、測定ユニット400から受信したデジタル信号と解析結果を、インタフェース部6011を介して、深層学習装置100Aに送信してもよい。解析ユニット600は、例えば、インターネットを介して、深層学習装置100Aに、波形データと、波形データに対応する分類情報とを送信する。深層学習装置100Aは、解析ユニット600から送信された波形データと、当該波形データに対応する分類情報とに基づいて学習処理を行い、深層学習アルゴリズム60を更新する。深層学習装置100Aは、更新した深層学習アルゴリズム60を解析ユニット600に送信する。解析ユニット600は、深層学習装置100Aから送信された深層学習アルゴリズム60により、記憶部6004に格納されたアルゴリズムを更新する。解析ユニット600は、例えば、測定ユニット400から伝送された波形データをプロセッサ6001および並列処理プロセッサ6002で処理している間に、並行して、その波形データを深層学習装置100Aに送信する。解析ユニット600は、波形データの解析、つまり分類情報の生成が完了次第、分類情報を深層学習装置100Aに送信する。 As shown in FIG. 40, the measurement
As shown in FIG. 41, the above-mentioned
以下の説明においては、特に断らない限り、測定ユニット制御部480が行う処理は、記憶部4835又はRAM4834に格納されたプログラム及び深層学習アルゴリズム60に基づいて、実際にはプロセッサ4831及び並列処理プロセッサ4833が行う処理を意味する。プロセッサ4831は、例えば、RAM4834を作業領域として必要なデータ(処理途中の中間データ、測定結果、分析結果等)を一時記憶し、記憶部4835に演算結果等の長期保存するデータを適宜記録する。
In the following description, unless otherwise specified, the processing performed by the measurement unit control unit 480 is actually based on the program stored in the storage unit 4835 or the RAM 4834 and the deep learning algorithm 60, and is actually the processor 4831 and the parallel processing processor 4833. Means the processing performed by. The processor 4831 temporarily stores necessary data (intermediate data during processing, measurement results, analysis results, etc.) using the RAM 4834 as a work area, and appropriately records data to be stored for a long period of time such as calculation results in the storage unit 4835.
<機能ブロック及び処理手順>
(深層学習処理)
図42は、深層学習を行う深層学習装置100Aの機能ブロックの例を示す。図42を参照すると、本実施形態に係る深層学習装置100Aの処理部10Aは、訓練データ生成部101と、訓練データ入力部102と、アルゴリズム更新部103とを備える。これらの機能ブロックは、コンピュータに深層学習処理を実行させるプログラムを、図39に示す処理部10Aの記憶部13又はメモリ12にインストールし、このプログラムをCPU11及びGPU19が実行することにより実現される。訓練データデータベース(DB)104と、アルゴリズムデータベース(DB)105とは、処理部10Aの記憶部13又はメモリ12に記録される。 <Functional block and processing procedure>
(Deep learning process)
FIG. 42 shows an example of a functional block of thedeep learning device 100A that performs deep learning. Referring to FIG. 42, the processing unit 10A of the deep learning device 100A according to the present embodiment includes a training data generation unit 101, a training data input unit 102, and an algorithm update unit 103. These functional blocks are realized by installing a program for causing a computer to execute a deep learning process in the storage unit 13 or the memory 12 of the processing unit 10A shown in FIG. 39, and executing this program by the CPU 11 and the GPU 19. The training data database (DB) 104 and the algorithm database (DB) 105 are recorded in the storage unit 13 or the memory 12 of the processing unit 10A.
(深層学習処理)
図42は、深層学習を行う深層学習装置100Aの機能ブロックの例を示す。図42を参照すると、本実施形態に係る深層学習装置100Aの処理部10Aは、訓練データ生成部101と、訓練データ入力部102と、アルゴリズム更新部103とを備える。これらの機能ブロックは、コンピュータに深層学習処理を実行させるプログラムを、図39に示す処理部10Aの記憶部13又はメモリ12にインストールし、このプログラムをCPU11及びGPU19が実行することにより実現される。訓練データデータベース(DB)104と、アルゴリズムデータベース(DB)105とは、処理部10Aの記憶部13又はメモリ12に記録される。 <Functional block and processing procedure>
(Deep learning process)
FIG. 42 shows an example of a functional block of the
訓練用波形データ76a、76b、76cは、例えば、測定ユニット400、500によって予め取得され、処理部10Aの記憶部13又はメモリ12に予め記憶されている。深層学習アルゴリズム50はアルゴリズムデータベース105に予め格納されている。
The training waveform data 76a, 76b, 76c are acquired in advance by, for example, the measurement units 400 and 500, and are stored in advance in the storage unit 13 or the memory 12 of the processing unit 10A. The deep learning algorithm 50 is stored in the algorithm database 105 in advance.
深層学習装置100Aの処理部10Aは、図43に示す処理を行う。図42に示す各機能ブロックを用いて説明すると、図43に示すステップS211、S214及びS216の処理は、訓練データ生成部101が行う。ステップS212の処理は、訓練データ入力部102が行う。ステップS213、及びS215の処理は、アルゴリズム更新部103が行う。
The processing unit 10A of the deep learning device 100A performs the processing shown in FIG. 43. Explaining using each functional block shown in FIG. 42, the training data generation unit 101 performs the processing of steps S211, S214 and S216 shown in FIG. 43. The training data input unit 102 performs the processing of step S212. The processing of steps S213 and S215 is performed by the algorithm update unit 103.
図43を用いて、処理部10Aが行う深層学習処理の例について説明する。はじめに、処理部10Aは、訓練用波形データ72a、72b、72cを取得する。訓練用の波形データ72aは前方散乱光の波形データであり、訓練用の波形データ72bは側方散乱光の波形データであり、訓練用の波形データ72cは側方蛍光の波形データである。訓練用の波形データ72a、72b、72cの取得は、例えば、オペレータの操作によって、測定ユニット400、500から取り込まれるか、記録媒体98から取り込まれるか、通信ネットワーク経由でI/F部15を介して行われる。訓練用波形データ72a、72b、72cを取得する際に、その訓練用波形データ72a、72b、72cが、いずれの細胞種別を示すものであるかの情報も取得される。いずれの細胞種別を示すものであるかの情報は、訓練用波形データ72a、72b、72cに紐付けられ、またオペレータが入力部16から入力してもよい。
An example of the deep learning process performed by the processing unit 10A will be described with reference to FIG. 43. First, the processing unit 10A acquires training waveform data 72a, 72b, 72c. The training waveform data 72a is the waveform data of the forward scattered light, the waveform data 72b for training is the waveform data of the side scattered light, and the waveform data 72c for training is the waveform data of the lateral fluorescence. The acquisition of the waveform data 72a, 72b, 72c for training is, for example, by the operation of the operator, whether it is fetched from the measurement units 400, 500, from the recording medium 98, or via the I / F unit 15 via the communication network. It is done. When the training waveform data 72a, 72b, 72c are acquired, information on which cell type the training waveform data 72a, 72b, 72c indicates is also acquired. The information indicating which cell type is indicated is associated with the training waveform data 72a, 72b, 72c, and may be input by the operator from the input unit 16.
ステップS211において、処理部10Aは、取得した波形データ72a、72b、72cとラベル値77とから、訓練データ75を生成する。
In step S211th, the processing unit 10A generates training data 75 from the acquired waveform data 72a, 72b, 72c and the label value 77.
ステップS212において、処理部10Aは、訓練データ75をニューラルネットワーク50に入力し、試行結果を取得する。試行結果は複数の訓練データ75をニューラルネットワーク50に入力する度に蓄積される。
In step S212, the processing unit 10A inputs the training data 75 to the neural network 50 and acquires the trial result. The trial result is accumulated every time a plurality of training data 75 are input to the neural network 50.
本実施形態に係る細胞種別の分析方法では、畳み込みニューラルネットワークを使用しており、確率的勾配降下法を用いるため、ステップS213において、処理部10Aは、予め定められた所定の回数分の試行結果が蓄積されているか否かを判断する。試行結果が所定の回数分蓄積されている場合(YES)、処理部10AはステップS214の処理に進み、試行結果が所定の回数分蓄積されていない場合(NO)、処理部10AはステップS215の処理に進む。
In the cell type analysis method according to the present embodiment, a convolutional neural network is used and a stochastic gradient descent method is used. Therefore, in step S213, the processing unit 10A uses a predetermined number of trial results. Judge whether or not is accumulated. When the trial result is accumulated a predetermined number of times (YES), the processing unit 10A proceeds to the process of step S214, and when the trial result is not accumulated a predetermined number of times (NO), the processing unit 10A proceeds to the process of step S215. Proceed to processing.
次に、試行結果が所定の回数分蓄積されている場合、ステップS214において、処理部10Aは、ステップS212において蓄積しておいた訓練結果を用いて、ニューラルネットワーク50の結合重みwを更新する。本実施形態に係る細胞種別の分析方法では、確率的勾配降下法を用いるため、所定の回数分の試行結果が蓄積した段階で、ニューラルネットワーク50の結合重みwを更新する。結合重みwを更新する処理は、具体的には、後述の(式12)及び(式13)に示される、勾配降下法による計算を実施する処理である。
Next, when the trial results are accumulated a predetermined number of times, in step S214, the processing unit 10A updates the connection weight w of the neural network 50 using the training results accumulated in step S212. In the cell type analysis method according to the present embodiment, since the stochastic gradient descent method is used, the connection weight w of the neural network 50 is updated at the stage where the trial results for a predetermined number of times are accumulated. The process of updating the bond weight w is specifically a process of performing a calculation by the gradient descent method shown in (Equation 12) and (Equation 13) described later.
ステップS215において、処理部10Aは、ニューラルネットワーク50を規定数の訓練データ75で訓練したか否かを判断する。規定数の訓練データ75で訓練した場合(YES)には、深層学習処理を終了する。
In step S215, the processing unit 10A determines whether or not the neural network 50 has been trained with the specified number of training data 75. When the training is performed with the specified number of training data 75 (YES), the deep learning process is terminated.
ニューラルネットワーク50を規定数の訓練データ75で訓練していない場合(NO)には、処理部10Aは、ステップS215からステップS216に進み、次の訓練用波形データについてステップS211からステップS215までの処理を行う。
When the neural network 50 is not trained with the specified number of training data 75 (NO), the processing unit 10A proceeds from step S215 to step S216, and processes the next training waveform data from step S211 to step S215. I do.
以上で説明した処理にしたがって、ニューラルネットワーク50を訓練し深層学習アルゴリズム60を得る。
According to the process described above, the neural network 50 is trained to obtain the deep learning algorithm 60.
(ニューラルネットワークの構造)
上述したように、本実施形態において、畳み込みニューラルネットワークを用いる。図44の(a)にニューラルネットワーク50の構造を例示する。ニューラルネットワーク50は、入力層50aと、出力層50bと、入力層50a及び出力層50bの間の中間層50cとを備え、中間層50cが複数の層で構成されている。中間層50cを構成する層の数は、例えば5層以上、好ましくは50層以上、より好ましくは100層以上とすることができる。 (Structure of neural network)
As described above, in this embodiment, a convolutional neural network is used. The structure of theneural network 50 is illustrated in FIG. 44 (a). The neural network 50 includes an input layer 50a, an output layer 50b, and an intermediate layer 50c between the input layer 50a and the output layer 50b, and the intermediate layer 50c is composed of a plurality of layers. The number of layers constituting the intermediate layer 50c can be, for example, 5 layers or more, preferably 50 layers or more, and more preferably 100 layers or more.
上述したように、本実施形態において、畳み込みニューラルネットワークを用いる。図44の(a)にニューラルネットワーク50の構造を例示する。ニューラルネットワーク50は、入力層50aと、出力層50bと、入力層50a及び出力層50bの間の中間層50cとを備え、中間層50cが複数の層で構成されている。中間層50cを構成する層の数は、例えば5層以上、好ましくは50層以上、より好ましくは100層以上とすることができる。 (Structure of neural network)
As described above, in this embodiment, a convolutional neural network is used. The structure of the
ニューラルネットワーク50では、層状に配置された複数のノード89が、層間において結合されている。これにより、情報が入力側の層50aから出力側の層50bに、図中矢印Dに示す一方向のみに伝播する。
In the neural network 50, a plurality of nodes 89 arranged in a layer are connected between layers. As a result, the information propagates from the input side layer 50a to the output side layer 50b in only one direction indicated by the arrow D in the figure.
(各ノードにおける演算)
図44の(b)は、各ノードにおける演算を示す模式図である。各ノード89では、複数の入力を受け取り、1つの出力(z)を計算する。図44の(b)に示す例の場合、ノード89は4つの入力を受け取る。ノード89が受け取る総入力(u)は、例として以下の(式2)で表される。ここで、本実施形態においては、訓練データ75及び分析データ85として一次元の行列データを用いるため、演算式の変数が二次元の行列データに対応する場合には、変数を一次元の行列データに対応するように変換する処理を行う。

各入力には、それぞれ異なる重みが掛けられる。(式2)中、bはバイアスと呼ばれる値である。ノードの出力(z)は、(式2)で表される総入力(u)に対する所定の関数fの出力となり、以下の(式3)で表される。関数fは活性化関数と呼ばれる。

図44の(c)は、ノード間の演算を示す模式図である。ニューラルネットワーク50では、(式2)で表される、各ノード89の総入力(u)に対して、(式3)で表される結果(z)を出力するノードが層状に並べられている。前の層のノードの出力が、次の層のノードの入力となる。図44の(c)に示す例では、図中左側の層のノード89aの出力が、図中右側の層のノード89bの入力となる。各ノード89bは、それぞれ、ノード89aからの出力を受け取る。各ノード89aと各ノード89bとの間の各結合には、異なる重みが掛けられる。複数のノード89aのそれぞれの出力をx1~x4とすると、3つのノード89bのそれぞれに対する入力は、以下の(式4-1)~(式4-3)で表される。
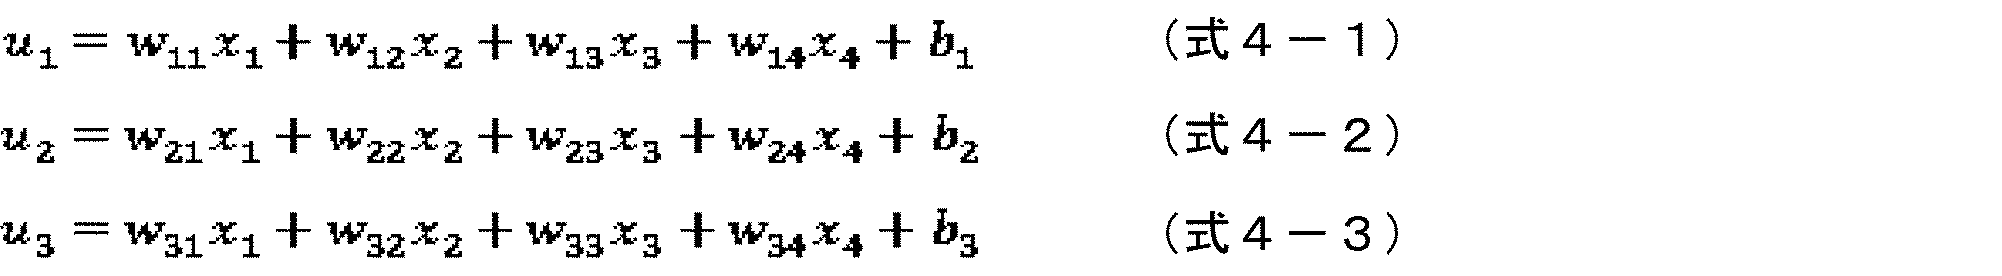
これら(式4-1)~(式4-3)を一般化すると、(式4-4)となる。ここで、i=1、・・・I、j=1、・・・Jである(Iは入力総数、Jは総出力数)。

(式4-4)を活性化関数に適用すると出力が得られる。出力は以下の(式5)で表される。

(活性化関数)
実施形態に係る細胞種別の分析方法では、活性化関数として、正規化線形関数(rectified linear unit function)を用いる。正規化線形関数は以下の(式6)で表される。

(式6)は、z=uの線形関数のうち、u<0の部分をu=0とする関数である。図44の(c)に示す例では、j=1のノードの出力は、(式6)により、以下の式で表される。

(ニューラルネットワークの学習)
ニューラルネットワークを用いて表現される関数をy(x:w)とおくと、関数y(x:w)は、ニューラルネットワークのパラメータwを変化させると変化する。入力xに対してニューラルネットワークがより好適なパラメータwを選択するように、関数y(x:w)を調整することを、ニューラルネットワークの訓練または学習と呼ぶ。ニューラルネットワークを用いて表現される関数の入力と出力との組が複数与えられているとする。ある入力xに対する望ましい出力をdとすると、入出力の組は、{(x1、d1)、(x2、d2)、・・・、(xn、dn)}と与えられる。(x、d)で表される各組の集合を、訓練データと呼ぶ。具体的には、図3に示す、波形データ(前方散乱光波形データ、側方散乱光波形データ、蛍光波形データ)の集合が、図3に示す訓練データである。 (Operation at each node)
FIG. 44 (b) is a schematic diagram showing operations at each node. Eachnode 89 receives a plurality of inputs and calculates one output (z). In the case of the example shown in FIG. 44 (b), the node 89 receives four inputs. The total input (u) received by the node 89 is represented by the following (Equation 2) as an example. Here, in the present embodiment, one-dimensional matrix data is used as the training data 75 and the analysis data 85. Therefore, when the variable of the arithmetic expression corresponds to the two-dimensional matrix data, the variable is the one-dimensional matrix data. Performs the conversion process to correspond to.
Each input is weighted differently. In (Equation 2), b is a value called bias. The output (z) of the node is the output of the predetermined function f with respect to the total input (u) represented by (Equation 2), and is represented by the following (Equation 3). The function f is called an activation function.
FIG. 44 (c) is a schematic diagram showing operations between nodes. In the neural network 50, the nodes that output the result (z) represented by (Equation 3) are arranged in layers for the total input (u) of each node 89 represented by (Equation 2). .. The output of the node of the previous layer becomes the input of the node of the next layer. In the example shown in FIG. 44 (c), the output of the node 89a in the layer on the left side in the figure is the input of the node 89b in the layer on the right side in the figure. Each node 89b receives an output from the node 89a, respectively. Each connection between each node 89a and each node 89b is weighted differently. Assuming that the outputs of the plurality of nodes 89a are x1 to x4, the inputs to each of the three nodes 89b are represented by the following (Equation 4-1) to (Equation 4-3).
The generalization of these (Equation 4-1) to (Equation 4-3) is (Equation 4-4). Here, i = 1, ... I, j = 1, ... J (I is the total number of inputs, J is the total number of outputs).
An output is obtained by applying (Equation 4-4) to the activation function. The output is represented by the following (Equation 5).
(Activation function)
In the cell type analysis method according to the embodiment, a rectified linear unit function is used as the activation function. The rectified linear function is expressed by the following (Equation 6).
(Equation 6) is a function in which the part of u <0 is u = 0 in the linear function of z = u. In the example shown in FIG. 44 (c), the output of the node with j = 1 is represented by the following equation by (Equation 6).
(Neural network learning)
If the function expressed by using the neural network is y (x: w), the function y (x: w) changes when the parameter w of the neural network is changed. Adjusting the function y (x: w) so that the neural network selects a more suitable parameter w for the input x is called neural network training or learning. It is assumed that a plurality of sets of inputs and outputs of a function expressed using a neural network are given. Assuming that the desired output for a given input x is d, the set of inputs and outputs is given {(x1, d1), (x2, d2), ..., (Xn, dn)}. The set of each set represented by (x, d) is called training data. Specifically, the set of waveform data (forward scattered light waveform data, side scattered light waveform data, fluorescence waveform data) shown in FIG. 3 is the training data shown in FIG.
図44の(b)は、各ノードにおける演算を示す模式図である。各ノード89では、複数の入力を受け取り、1つの出力(z)を計算する。図44の(b)に示す例の場合、ノード89は4つの入力を受け取る。ノード89が受け取る総入力(u)は、例として以下の(式2)で表される。ここで、本実施形態においては、訓練データ75及び分析データ85として一次元の行列データを用いるため、演算式の変数が二次元の行列データに対応する場合には、変数を一次元の行列データに対応するように変換する処理を行う。
実施形態に係る細胞種別の分析方法では、活性化関数として、正規化線形関数(rectified linear unit function)を用いる。正規化線形関数は以下の(式6)で表される。
ニューラルネットワークを用いて表現される関数をy(x:w)とおくと、関数y(x:w)は、ニューラルネットワークのパラメータwを変化させると変化する。入力xに対してニューラルネットワークがより好適なパラメータwを選択するように、関数y(x:w)を調整することを、ニューラルネットワークの訓練または学習と呼ぶ。ニューラルネットワークを用いて表現される関数の入力と出力との組が複数与えられているとする。ある入力xに対する望ましい出力をdとすると、入出力の組は、{(x1、d1)、(x2、d2)、・・・、(xn、dn)}と与えられる。(x、d)で表される各組の集合を、訓練データと呼ぶ。具体的には、図3に示す、波形データ(前方散乱光波形データ、側方散乱光波形データ、蛍光波形データ)の集合が、図3に示す訓練データである。 (Operation at each node)
FIG. 44 (b) is a schematic diagram showing operations at each node. Each
In the cell type analysis method according to the embodiment, a rectified linear unit function is used as the activation function. The rectified linear function is expressed by the following (Equation 6).
If the function expressed by using the neural network is y (x: w), the function y (x: w) changes when the parameter w of the neural network is changed. Adjusting the function y (x: w) so that the neural network selects a more suitable parameter w for the input x is called neural network training or learning. It is assumed that a plurality of sets of inputs and outputs of a function expressed using a neural network are given. Assuming that the desired output for a given input x is d, the set of inputs and outputs is given {(x1, d1), (x2, d2), ..., (Xn, dn)}. The set of each set represented by (x, d) is called training data. Specifically, the set of waveform data (forward scattered light waveform data, side scattered light waveform data, fluorescence waveform data) shown in FIG. 3 is the training data shown in FIG.
ニューラルネットワークの学習とは、どのような入出力の組(xn、dn)に対しても、入力xnを与えたときのニューラルネットワークの出力y(xn:w)が、出力dnになるべく近づくように重みwを調整することを意味する。誤差関数(error function)とは、ニューラルネットワークを用いて表現される関数と訓練データとの近さ

を測る尺度である。誤差関数は損失関数(loss function)とも呼ばれる。実施形態に係る細胞種別の分析方法において用いる誤差関数E(w)は、以下の(式7)で表される。(式7)は交差エントロピー(cross entropy)と呼ばれる。

(式7)の交差エントロピーの算出方法を説明する。実施形態に係る細胞種別の分析方法において用いるニューラルネットワーク50の出力層50bでは、すなわちニューラルネットワークの最終層では、入力xを内容に応じて有限個のクラスに分類するための活性化関数を用いる。活性化関数はソフトマックス関数(softmax function)と呼ばれ、以下の(式8)で表される。なお、出力層50bには、クラス数kと同数のノードが並べられているとする。出力層Lの各ノードk(k=1、・・・、K)の総入力uは、前層L-1の出力から、uk(L)で与えられるとする。これにより、出力層のk番目のノードの出力は以下の(式8)で表される。

(式8)がソフトマックス関数である。(式8)で決まる出力y1、・・・、yKの総和は常に1となる。
Neural network learning means that the output y (xn: w) of the neural network when the input xn is given is as close as possible to the output dn for any set of input / output (xn, dn). It means adjusting the weight w. The error function is the closeness of the training data to the function expressed using the neural network.
It is a scale to measure. The error function is also called the loss function. The error function E (w) used in the cell type analysis method according to the embodiment is represented by the following (Equation 7). (Equation 7) is called cross entropy.
The method of calculating the cross entropy of (Equation 7) will be described. In the output layer 50b of the neural network 50 used in the cell type analysis method according to the embodiment, that is, in the final layer of the neural network, an activation function for classifying the input x into a finite number of classes according to the content is used. The activation function is called a softmax function and is expressed by the following (Equation 8). It is assumed that the output layer 50b has the same number of nodes as the number of classes k. It is assumed that the total input u of each node k (k = 1, ..., K) of the output layer L is given by uk (L) from the output of the front layer L-1. As a result, the output of the kth node of the output layer is represented by the following (Equation 8).
(Equation 8) is a softmax function. The sum of the outputs y1, ..., YK determined by (Equation 8) is always 1.
各クラスをC1、・・・、CKと表すと、出力層Lのノードkの出力yK(すなわちuk(L))は、与えられた入力xがクラスCKに属する確率を表す。以下の(式9)を参照されたい。入力xは、(式9)で表される確率が最大になるクラスに分類される。

ニューラルネットワークの学習では、ニューラルネットワークで表される関数を、各クラスの事後確率(posterior probability)のモデルとみなし、そのような確率モデルの下で、訓練データに対する重みwの尤度(likelihood)を評価し、尤度を最大化するような重みwを選択する。
When each class is represented as C1, ..., CK, the output yK (that is, uk (L) ) of the node k of the output layer L represents the probability that the given input x belongs to the class CK. Please refer to the following (Equation 9). The input x is classified into the class having the maximum probability expressed by (Equation 9).
In the training of the neural network, the function represented by the neural network is regarded as a model of the posterior probability of each class, and the likelihood of the weight w with respect to the training data is calculated under such a probability model. Evaluate and select a weight w that maximizes the likelihood.
(式8)のソフトマックス関数による目標出力dnを、出力が正解のクラスである場合のみ1とし、出力がそれ以外の場合は0になるとする。目標出力をdn=[dn1、・・・、dnK]というベクトル形式で表すと、例えば入力xnの正解クラスがC3である場合、目標出力dn3のみが1となり、それ以外の目標出力は0となる。このように符号化すると、事後分布(posterior)は以下の(式10)で表される。

訓練データ{(xn、dn)}(n=1、・・・、N)に対する重みwの尤度L(w)は、以下の(式11)で表される。尤度L(w)の対数をとり符号を反転すると、(式7)の誤差関数が導出される。

学習は、訓練データを基に計算される誤差関数E(w)を、ニューラルネットワークのパラメータwについて最小化することを意味する。実施形態に係る細胞種別の分析方法では、誤差関数E(w)は(式7)で表される。
The target output dn by the softmax function of (Equation 8) is set to 1 only when the output is a correct class, and is set to 0 when the output is not. When the target output is expressed in the vector format of dn = [dn1, ..., dnK], for example, when the correct answer class of the input xn is C3, only the target output dn3 becomes 1 and the other target outputs become 0. .. When encoded in this way, the posterior distribution is expressed by the following (Equation 10).
The likelihood L (w) of the weight w with respect to the training data {(xn, dn)} (n = 1, ..., N) is expressed by the following (Equation 11). By taking the logarithm of the likelihood L (w) and inverting the sign, the error function of (Equation 7) is derived.
Learning means minimizing the error function E (w) calculated based on the training data with respect to the neural network parameter w. In the cell type analysis method according to the embodiment, the error function E (w) is represented by (Equation 7).
誤差関数E(w)をパラメータwについて最小化することは、関数E(w)の局所的な極小点を求めることと同じ意味である。パラメータwはノード間の結合の重みである。重みwの極小点は、任意の初期値を出発点として、パラメータwを繰り返し更新する反復計算によって求められる。このような計算の一例には、勾配降下法(gradient descent method)がある。
Minimizing the error function E (w) with respect to the parameter w has the same meaning as finding the local minimum point of the function E (w). The parameter w is the weight of the connection between the nodes. The minimum point of the weight w is obtained by an iterative calculation in which the parameter w is repeatedly updated starting from an arbitrary initial value. An example of such a calculation is the gradient descent method.
勾配降下法では、次の(式12)で表されるベクトルを用いる。

勾配降下法では、現在のパラメータwの値を負の勾配方向(すなわち-∇E)に移動させる処理を何度も繰り返す。現在の重みをw(t)とし、移動後の重みをw(t+1)とすると、勾配降下法による演算は、以下の(式13)で表される。値tは、パラメータwを移動させた回数を意味する。

記号

は、パラメータwの更新量の大きさを決める定数であり、学習係数と呼ばれる。(式13)で表される演算を繰り返すことにより、値tの増加に伴って誤差関数E(w(t))が減少し、パラメータwは極小点に到達する。
In the gradient descent method, the vector represented by the following (Equation 12) is used.
In the gradient descent method, the process of moving the value of the current parameter w in the negative gradient direction (that is, −∇E) is repeated many times. Assuming that the current weight is w (t) and the weight after movement is w (t + 1) , the operation by the gradient descent method is expressed by the following (Equation 13). The value t means the number of times the parameter w is moved.
symbol
Is a constant that determines the magnitude of the update amount of the parameter w, and is called a learning coefficient. By repeating the operation represented by (Equation 13), the error function E (w (t) ) decreases as the value t increases, and the parameter w reaches the minimum point.
なお、(式13)による演算は、全ての訓練データ(n=1、・・・、N)に対して実施してもよく、一部の訓練データのみに対して実施してもよい。一部の訓練データのみに対して行う勾配降下法は、確率的勾配降下法(stochastic gradient descent)と呼ばれる。実施形態に係る細胞種別の分析方法では、確率的勾配降下法を用いる。
Note that the calculation according to (Equation 13) may be performed on all training data (n = 1, ..., N), or may be performed on only some training data. The gradient descent method performed only for some training data is called the stochastic gradient descent method. In the cell type analysis method according to the embodiment, a stochastic gradient descent method is used.
[4.ディープラーニングモデルの構築]
健常血液試料として健常人から採血した血液を測定し、非健常血液試料としてXN CHECK Lv2(ストレック社のコントロール血液(固定などの処理が行われている))をSysmex XN-1000でそれぞれ測定した。蛍光染色試薬にはシスメックス株式会社製のフルオロセルWDFを用いた。また溶血剤にはシスメックス株式会社製のライザセルWDFを用いた。それぞれの生体試料に含まれる細胞毎に、前方散乱光の測定開始から10ナノ秒間隔で前方散乱光、側方散乱光、及び側方蛍光の波形データを1024ポイントについて取得した。健常血液試料に関しては、8名の健常者から採血した血液中の細胞の波形データをデジタル信号としてプールした。それぞれの細胞の波形データに対して好中球(NEUT)、リンパ球(LYMPH)、単球(MONO)、好酸球(EO)、好塩基球(BASO)、幼若顆粒球(IG)の分類を手動にて実施し、それぞれの波形データに細胞種別のアノテーション(ラベル付け)を付した。前方散乱光の信号強度が閾値を超えた時点を測定開始時点とし、前方散乱光、側方散乱光、側方蛍光の波形データの取得時点を同期させ、訓練データを生成した。またコントロール血液についてもコントロール血液由来細胞(CONT)とアノテーションを行った。深層学習アルゴリズムに訓練データを入力し、学習させた。 [4. Building a deep learning model]
Blood collected from a healthy person was measured as a healthy blood sample, and XN CHECK Lv2 (Control blood of Streck Co., Ltd. (treated such as fixation)) was measured as an unhealthy blood sample with Sysmex XN-1000. Fluorocell WDF manufactured by Sysmex Corporation was used as the fluorescent staining reagent. A riser cell WDF manufactured by Sysmex Corporation was used as the hemolytic agent. For each cell contained in each biological sample, waveform data of forward scattered light, lateral scattered light, and lateral fluorescence were acquired for 1024 points at intervals of 10 nanoseconds from the start of measurement of forward scattered light. For healthy blood samples, waveform data of cells in blood collected from 8 healthy subjects were pooled as digital signals. Neutrophils (NEUT), lymphocytes (LYMPH), monocytes (MONO), eosinophils (EO), basophils (BASO), and immature granulocytes (IG) for the waveform data of each cell. Classification was performed manually, and each waveform data was annotated (labeled) by cell type. The time when the signal intensity of the forward scattered light exceeded the threshold was set as the measurement start time, and the acquisition time of the waveform data of the forward scattered light, the side scattered light, and the side fluorescence was synchronized to generate the training data. The control blood was also annotated with control blood-derived cells (CONT). Training data was input to the deep learning algorithm and trained.
学習した細胞データとは別の健常人の血液細胞についてSysmex XN-1000により訓練データと同様に分析用波形データを取得した。コントロール血液由来の波形データを混合し分析用データを作成した。この分析用データを、構築した深層学習アルゴリズムに入力し、個々の細胞種別のデータを取得した。
For blood cells of healthy people different from the learned cell data, waveform data for analysis was acquired by Sysmex XN-1000 in the same manner as the training data. Waveform data derived from control blood was mixed to create analytical data. This analysis data was input to the constructed deep learning algorithm, and data for each cell type was acquired.
その結果を混合マトリックスとして図45に示す。横軸に構築した深層学習アルゴリズムによる判定結果を示し、縦軸にヒトによる手動(参照法)の判定結果を示す。構築した深層学習アルゴリズムによる判定結果は、好塩基球とリンパ球間、好塩基球とゴースト間で若干の混同を生じたものの、参照法による判手結果と98.8%の一致率を示した。
The result is shown in FIG. 45 as a mixed matrix. The horizontal axis shows the judgment result by the deep learning algorithm constructed, and the vertical axis shows the judgment result by human (reference method). The judgment result by the constructed deep learning algorithm showed a concordance rate of 98.8% with the judgment result by the reference method, although there was some confusion between basophils and lymphocytes and between basophils and ghosts. ..
次に各細胞種別について、ROC解析を行い、感度特異度を評価した。図46の(a)は好中球、図46の(b)はリンパ球、図46の(c)は単球、図47の(a)は好中球、図47の(b)は好塩基球、図47の(c)はコントロール血液(CONT)のROC曲線を示す。感度と特異度は、好中球はそれぞれ99.5%、99.6%、リンパ球はそれぞれ99.4%、99.5%、単球はそれぞれ98.5%、99.9%、好酸球はそれぞれ97.9%、99.8%、好塩基球はそれぞれ71.0%、81.4%、コントロール血液(CONT)は、99.8%、99.6%となり、いずれも良好な成績を示した。
Next, ROC analysis was performed for each cell type to evaluate the sensitivity specificity. 46 (a) is a neutrophil, FIG. 46 (b) is a lymphocyte, FIG. 46 (c) is a monocyte, FIG. 47 (a) is a neutrophil, and FIG. 47 (b) is favorable. The base sphere, FIG. 47 (c), shows the ROC curve of control blood (CONT). Sensitivity and specificity were 99.5% and 99.6% for neutrophils, 99.4% and 99.5% for lymphocytes, and 98.5% and 99.9% for monocytes, respectively. Acid spheres were 97.9% and 99.8%, basophils were 71.0% and 81.4%, respectively, and control blood (CONT) was 99.8% and 99.6%, all of which were good. Showed good results.
以上の結果から、波形データに基づいて生体試料に含まれる細胞から取得される信号に基づいて、深層学習アルゴリズムを用いることにより、高い分類精度で細胞種別を判定することが可能であることが明らかとなった。
From the above results, it is clear that it is possible to determine the cell type with high classification accuracy by using the deep learning algorithm based on the signal acquired from the cells contained in the biological sample based on the waveform data. It became.
さらに、コントロール血液のような非健常血液細胞が健常血液細胞と混じっている場合、従来のスキャッタグラム法では、個々の細胞の種別の判定が困難な場合があった。しかし、本実施形態の深層学習アルゴリズムを使用することにより、非健常血液細胞が健常血液細胞と混じっている場合であっても、個別の細胞の判定が可能であることが示された。
Furthermore, when unhealthy blood cells such as control blood are mixed with healthy blood cells, it may be difficult to determine the type of individual cells by the conventional scattergram method. However, it was shown that by using the deep learning algorithm of the present embodiment, it is possible to determine individual cells even when unhealthy blood cells are mixed with healthy blood cells.
[5.画像分析装置を用いた分析システム]
細胞分析装置として画像分析装置を用いた実施形態を説明する。画像分析装置である第3の細胞分析装置4000''は、撮像された画像データを分析することにより、撮像された細胞の細胞種別を推定する。 [5. Analysis system using image analyzer]
An embodiment using an image analyzer as a cell analyzer will be described. The third cell analyzer 4000'', which is an image analyzer, estimates the cell type of the imaged cell by analyzing the captured image data.
図48に細胞分析装置4000''の構成例を示す。図48に示す細胞分析装置4000''は、測定ユニット700及び処理ユニット800を備えており、前処理装置900による前処理により調製された試料901を測定し、分析を行う。
FIG. 48 shows a configuration example of the cell analyzer 4000''. The cell analyzer 4000'' shown in FIG. 48 includes a measurement unit 700 and a treatment unit 800, and measures and analyzes a sample 901 prepared by pretreatment by the pretreatment device 900.
測定ユニット700は、フローセル710と、光源720~723と、集光レンズ730~733と、ダイクロイックミラー740~741と、集光レンズ750と、光学ユニット751と、集光レンズ752と、撮像部760と、を備えている。フローセル710の流路711には、試料701が流される。
The measuring unit 700 includes a flow cell 710, a light source 720 to 723, a condenser lens 730 to 733, a dichroic mirror 740 to 741, a condenser lens 750, an optical unit 751, a condenser lens 752, and an image pickup unit 760. And have. The sample 701 is flowed through the flow path 711 of the flow cell 710.
光源720~723は、フローセル710を流れる試料701に光を照射する。光源720~723は、例えば半導体レーザ光源により構成される。光源720~723からは、それぞれ波長λ11~λ14の光が出射される。
集光レンズ730~733は、光源720~723から出射された波長λ11~λ14の光をそれぞれ集光する。ダイクロイックミラー740は、波長λ11の光を透過させ、波長λ12の光を屈折させる。ダイクロイックミラー741は、波長λ11及びλ12の光を透過させ、波長λ13の光を屈折させる。こうして、波長λ11~λ14の光が、フローセル710の流路711を流れる試料701に照射される。なお、測定ユニット700が備える半導体レーザ光源の数は1以上であれば制限されない。半導体レーザ光源の数は、例えば、1、2、3、4、5又は6の中から選択することができる。 Thelight sources 720 to 723 irradiate the sample 701 flowing through the flow cell 710 with light. The light sources 720 to 723 are composed of, for example, a semiconductor laser light source. Light having wavelengths λ11 to λ14 is emitted from the light sources 720 to 723, respectively.
Thecondenser lenses 730 to 733 concentrate the light having wavelengths λ11 to λ14 emitted from the light sources 720 to 723, respectively. The dichroic mirror 740 transmits light of wavelength λ11 and refracts light of wavelength λ12. The dichroic mirror 741 transmits light having wavelengths λ11 and λ12 and refracts light having wavelength λ13. In this way, the light having wavelengths λ11 to λ14 is applied to the sample 701 flowing through the flow path 711 of the flow cell 710. The number of semiconductor laser light sources included in the measurement unit 700 is not limited as long as it is 1 or more. The number of semiconductor laser light sources can be selected from, for example, 1, 2, 3, 4, 5 or 6.
集光レンズ730~733は、光源720~723から出射された波長λ11~λ14の光をそれぞれ集光する。ダイクロイックミラー740は、波長λ11の光を透過させ、波長λ12の光を屈折させる。ダイクロイックミラー741は、波長λ11及びλ12の光を透過させ、波長λ13の光を屈折させる。こうして、波長λ11~λ14の光が、フローセル710の流路711を流れる試料701に照射される。なお、測定ユニット700が備える半導体レーザ光源の数は1以上であれば制限されない。半導体レーザ光源の数は、例えば、1、2、3、4、5又は6の中から選択することができる。 The
The
フローセル710を流れる試料701が蛍光色素で染色されている場合、試料701に波長λ11~λ13の光が照射されると、細胞を染色している蛍光色素から蛍光が生じる。例えば、波長λ11、λ12、λ13に各々対応する波長λ21、λ22、λ23の蛍光が生じる。フローセル710を流れる試料701に波長λ14の光が照射されると、この光は細胞を透過する。細胞を透過した波長λ14の透過光は、明視野画像の生成に用いられる。
When the sample 701 flowing through the flow cell 710 is stained with a fluorescent dye, when the sample 701 is irradiated with light having wavelengths λ11 to λ13, fluorescence is generated from the fluorescent dye that stains the cells. For example, fluorescence at wavelengths λ21, λ22, and λ23 corresponding to wavelengths λ11, λ12, and λ13, respectively, occurs. When the sample 701 flowing through the flow cell 710 is irradiated with light having a wavelength of λ14, this light passes through the cells. The transmitted light of wavelength λ14 transmitted through the cells is used to generate a brightfield image.
集光レンズ750は、フローセル710の流路711を流れる試料701から生じた蛍光と、フローセル710の流路711を流れる試料701を透過した透過光とを集光する。光学ユニット751は、例えば、4枚のダイクロイックミラーが組み合わせられた構成を有する。光学ユニット751の4枚のダイクロイックミラーは、蛍光と透過光とを、互いに僅かに異なる角度で反射し、撮像部760の受光面上において分離させる。集光レンズ752は、蛍光と透過光とを集光する。
The condenser lens 750 collects the fluorescence generated from the sample 701 flowing through the flow path 711 of the flow cell 710 and the transmitted light transmitted through the sample 701 flowing through the flow path 711 of the flow cell 710. The optical unit 751 has, for example, a configuration in which four dichroic mirrors are combined. The four dichroic mirrors of the optical unit 751 reflect fluorescence and transmitted light at slightly different angles and separate them on the light receiving surface of the image pickup unit 760. The condenser lens 752 collects fluorescence and transmitted light.
撮像部760は、TDI(Time Delay Integration)カメラにより構成される。撮像部760は、蛍光と透過光とを撮像して、蛍光に対応した蛍光画像と、透過光に対応した明視野画像とを、撮像信号として処理ユニット800に出力できる。
The image pickup unit 760 is composed of a TDI (Time Delay Integration) camera. The imaging unit 760 can image fluorescence and transmitted light, and output a fluorescent image corresponding to fluorescence and a bright field image corresponding to transmitted light to the processing unit 800 as an imaging signal.
処理ユニット800は、ハードウェア構成として、処理部811、記憶部812、インタフェース部816、バス815を備える。処理部811、記憶部812、インタフェース部816は、バス815に接続されている。測定ユニット700の撮像部760が撮像した撮像信号で構成される画像データ(例えば、蛍光画像、明視野画像)は、インタフェース部816を介して、記憶部812に記憶される。処理部811は、記憶部812から画像データを読み出し、画像データを分析する。
The processing unit 800 includes a processing unit 811, a storage unit 812, an interface unit 816, and a bus 815 as hardware configurations. The processing unit 811, the storage unit 812, and the interface unit 816 are connected to the bus 815. Image data (for example, a fluorescent image or a bright field image) composed of an image pickup signal captured by the image pickup unit 760 of the measurement unit 700 is stored in the storage unit 812 via the interface unit 816. The processing unit 811 reads the image data from the storage unit 812 and analyzes the image data.
図49は、処理部811の構成例を示す。処理部811は、例えば、プロセッサ8111、並列処理プロセッサ8112、RAM8113を備える。プロセッサ8111、並列処理プロセッサ8112、RAM8113は、それぞれ、上述したプロセッサ4831、並列処理プロセッサ4833、RAM4834と同様の構成及び機能を有する。プロセッサ8111及び並列処理プロセッサ8112により、撮像部760が撮像した画像データを分析する。並列処理プロセッサ8112は、例えば、図16、図17及び図18に例示された処理により、画像データに関する行列データの演算処理を複数の演算ユニットにより並列に実行する。
FIG. 49 shows a configuration example of the processing unit 811. The processing unit 811 includes, for example, a processor 8111, a parallel processing processor 8112, and a RAM 8113. The processor 8111, the parallel processing processor 8112, and the RAM 8113 have the same configurations and functions as the above-mentioned processor 4831, parallel processing processor 4833, and RAM 4834, respectively. The image data captured by the image pickup unit 760 is analyzed by the processor 8111 and the parallel processing processor 8112. The parallel processing processor 8112 executes arithmetic processing of matrix data related to image data in parallel by a plurality of arithmetic units, for example, by the processing exemplified in FIGS. 16, 17 and 18.
なお、処理部811の機能(プロセッサ8111、並列処理プロセッサ8112、RAM8113)は、必ずしも処理ユニット800が備える必要は無く、測定ユニット700が備えてもよい。
The functions of the processing unit 811 (processor 8111, parallel processing processor 8112, RAM 8113) do not necessarily have to be provided in the processing unit 800, but may be provided in the measurement unit 700.
<訓練データの生成>
以下、本実施形態における訓練データの生成例を説明する。 <Generation of training data>
Hereinafter, an example of generating training data in this embodiment will be described.
以下、本実施形態における訓練データの生成例を説明する。 <Generation of training data>
Hereinafter, an example of generating training data in this embodiment will be described.
深層学習アルゴリズムを訓練するために使用される訓練用画像は、RGBカラー及びCMYカラー等で撮像されることが好ましい。カラー画像は、赤、緑及び青又はシアン、マゼンタ、イエロー等の各原色の濃淡又は輝度を、24ビットの値(8ビット×3色)で表すことが好ましい。訓練用画像は、少なくとも1つの色相と、その色相の濃淡又は輝度とを含んでいればよいが、少なくとも2つの色相と、それぞれ色相の濃淡又は輝度とを含むことがより好ましい。色相とその色相の濃淡又は輝度とを含む情報を色調ともいう。
The training image used for training the deep learning algorithm is preferably captured in RGB color, CMY color, or the like. In the color image, it is preferable that the shade or brightness of each primary color such as red, green and blue or cyan, magenta, and yellow is represented by a 24-bit value (8 bits x 3 colors). The training image may include at least one hue and a shade or brightness of that hue, but more preferably include at least two hues and a shade or brightness of the hue, respectively. Information including a hue and the shade or brightness of the hue is also referred to as a color tone.
訓練用画像における各画素の色調情報が、例えば、RGBカラーから、輝度の情報と色相の情報を含むフォーマットに変換される。輝度の情報と色相の情報を含むフォーマットとして、YUV(YCbCr、YPbPr、YIQ等)等を挙げることができる。ここでは、YCbCrフォーマットへの変換を例として説明する。RGBカラーで撮像された訓練用画像は、輝度に基づく画像データ、第1の色相(例えば青色系)に基づく画像データ及び第2の色相(例えば、赤色系)に基づく画像データにそれぞれ変換される。RGBからYCbCrへの変換は公知の方法により行うことができる。例えば、RGBからYCbCrへは、国際規格ITU-R BT.601にしたがって変換できる。輝度に基づく画像データ、第1の色相に基づく画像データ及び第2の色相に基づく画像データはそれぞれ図50に示すように階調値の行列データとして表すことができる(以下、色調行列データ72y,72cb,72crともいう)。輝度に基づく画像データ、第1の色相に基づく画像データ、第2の色相に基づく画像データは、例えば、それぞれ0から255階調までの256階調で表される。ここで、輝度、第1の色相及び第2の色相に換えて、赤R、緑G、青Bの3原色や、シアンC、マゼンタM、イエローYの色の3原色で訓練用画像を変換してもよい。
The color tone information of each pixel in the training image is converted from, for example, RGB color to a format including luminance information and hue information. As a format including luminance information and hue information, YUV (YCbCr, YPbPr, YIQ, etc.) and the like can be mentioned. Here, conversion to the YCbCr format will be described as an example. The training image captured in RGB color is converted into image data based on brightness, image data based on the first hue (for example, blue system), and image data based on the second hue (for example, red system), respectively. .. The conversion from RGB to YCbCr can be performed by a known method. For example, from RGB to YCbCr, the international standard ITU-R BT. It can be converted according to 601. The image data based on the brightness, the image data based on the first hue, and the image data based on the second hue can be represented as gradation value matrix data as shown in FIG. 50 (hereinafter, color tone matrix data 72y, Also referred to as 72kb and 72cr). The image data based on the luminance, the image data based on the first hue, and the image data based on the second hue are represented by, for example, 256 gradations from 0 to 255 gradations, respectively. Here, the training image is converted with the three primary colors of red R, green G, and blue B, and the three primary colors of cyan C, magenta M, and yellow Y, instead of the brightness, the first hue, and the second hue. You may.
次に、色調行列データ72y,72cb,72crに基づいて、画素ごとに、輝度72y、第1の色相72cb、及び第2の色相72crの3つの階調値を組み合わせた色調ベクトルデータ74を生成する。
Next, based on the color tone matrix data 72y, 72kb, 72cr, the color tone vector data 74 is generated by combining the three gradation values of the luminance 72y, the first hue 72cc, and the second hue 72cr for each pixel. ..
次に、例えば、訓練用画像で分葉核好中球が撮像されていたとして、訓練用画像から生成される各色調ベクトルデータ74には、分葉核好中球であることを示すラベル値77として「1」が付与され、訓練データ75となる。図50では、便宜上、訓練データ75を3画素×3画素で表しているが、実際は訓練用画像を撮像した際の画素の分だけ色調ベクトルデータが存在する。
Next, for example, assuming that the lobation nucleus neutrophil is imaged in the training image, each color tone vector data 74 generated from the training image has a label value indicating that the lobation nucleus neutrophil is a lobation nucleus neutrophil. "1" is given as 77, and the training data becomes 75. In FIG. 50, the training data 75 is represented by 3 pixels × 3 pixels for convenience, but in reality, there is color tone vector data for each pixel when the training image is captured.
図51にラベル値77の例を示す。ラベル値は、細胞種別及び各細胞の特徴の有無に応じて異なるラベル値77が付与される。
FIG. 51 shows an example of the label value 77. As the label value, a different label value 77 is given depending on the cell type and the presence or absence of the characteristics of each cell.
<深層学習の概要>
図50を例として、ニューラルネットワークの訓練の概要を説明する。ニューラルネットワーク50は、畳み込みニューラルネットワークであることが好ましい。ニューラルネットワーク50における入力層50aのノード数は、入力される訓練データ75の画素数と画像に含まれる輝度と色相の数(例えば上記例では、輝度72y、第1の色相72cb、及び第2の色相72crの3つ)との積に対応している。色調ベクトルデータ74はその集合76としてニューラルネットワーク50の入力層50aに入力される。訓練データ75の各画素のラベル値77を、ニューラルネットワークの出力層50bとして、ニューラルネットワーク50を訓練する。 <Overview of deep learning>
The outline of the training of the neural network will be described by taking FIG. 50 as an example. Theneural network 50 is preferably a convolutional neural network. The number of nodes of the input layer 50a in the neural network 50 is the number of pixels of the input training data 75 and the number of brightness and hue contained in the image (for example, in the above example, the brightness 72y, the first hue 72cc, and the second hue). It corresponds to the product with 3) of hue 72cr. The color tone vector data 74 is input to the input layer 50a of the neural network 50 as a set 76 thereof. The neural network 50 is trained by using the label value 77 of each pixel of the training data 75 as the output layer 50b of the neural network.
図50を例として、ニューラルネットワークの訓練の概要を説明する。ニューラルネットワーク50は、畳み込みニューラルネットワークであることが好ましい。ニューラルネットワーク50における入力層50aのノード数は、入力される訓練データ75の画素数と画像に含まれる輝度と色相の数(例えば上記例では、輝度72y、第1の色相72cb、及び第2の色相72crの3つ)との積に対応している。色調ベクトルデータ74はその集合76としてニューラルネットワーク50の入力層50aに入力される。訓練データ75の各画素のラベル値77を、ニューラルネットワークの出力層50bとして、ニューラルネットワーク50を訓練する。 <Overview of deep learning>
The outline of the training of the neural network will be described by taking FIG. 50 as an example. The
ニューラルネットワーク50は、訓練データ75に基づいて、形態学的な細胞種別や細胞の特徴について、特徴量を抽出する。ニューラルネットワークの出力層50bは、これらの特徴量を反映する結果を出力する。
The neural network 50 extracts feature quantities for morphological cell types and cell characteristics based on the training data 75. The output layer 50b of the neural network outputs a result reflecting these features.
図50の符号50cは、中間層を示す。
Reference numeral 50c in FIG. 50 indicates an intermediate layer.
斯くして訓練されたニューラルネットワーク60を有する深層学習アルゴリズム60は、分析対象の細胞が、所定の細胞群に属し形態学的に分類される複数の細胞種別のいずれに該当するかを識別するための識別器として使用される。
The deep learning algorithm 60 having the neural network 60 thus trained is to identify which of the plurality of cell types belonging to a predetermined cell group and morphologically classified corresponds to the cell to be analyzed. Used as a classifier.
<画像の分析方法>
図52に画像の分析方法の例を示す。画像の分析方法では、分析対象の細胞を撮像した分析用画像から分析データ81を生成する。分析用画像は、分析対象の細胞を撮像した画像である。 <Image analysis method>
FIG. 52 shows an example of an image analysis method. In the image analysis method,analysis data 81 is generated from an analysis image obtained by imaging a cell to be analyzed. The analysis image is an image of the cells to be analyzed.
図52に画像の分析方法の例を示す。画像の分析方法では、分析対象の細胞を撮像した分析用画像から分析データ81を生成する。分析用画像は、分析対象の細胞を撮像した画像である。 <Image analysis method>
FIG. 52 shows an example of an image analysis method. In the image analysis method,
例示的には、本実施形態において撮像装置における撮像は、RGBカラー及びCMYカラー等で行われることが好ましい。カラー画像は、赤、緑及び青又はシアン、マゼンタ、イエロー等の各原色の濃淡又は輝度を、24ビットの値(8ビット×3色)で表すことが好ましい。分析用画像は、少なくとも1つの色相と、その色相の濃淡又は輝度とを含んでいればよいが、少なくとも2つの色相と、それぞれ色相の濃淡又は輝度とを含むことがより好ましい。色相とその色相の濃淡又は輝度とを含む情報を色調ともいう。
Illustratively, in the present embodiment, it is preferable that the image pickup in the image pickup apparatus is performed in RGB color, CMY color, or the like. In the color image, it is preferable that the shade or brightness of each primary color such as red, green and blue or cyan, magenta, and yellow is represented by a 24-bit value (8 bits x 3 colors). The image for analysis may include at least one hue and a shade or brightness of the hue, but more preferably contains at least two hues and a shade or brightness of the hue, respectively. Information including a hue and the shade or brightness of the hue is also referred to as a color tone.
例えば、RGBカラーから、輝度の情報と色相の情報を含むフォーマットに変換する。輝度の情報と色相の情報を含むフォーマットとして、YUV(YCbCr、YPbPr、YIQ等)等を挙げることができる。ここでは、YCbCrフォーマットへの変換を例として説明する。ここでは、RGBカラーの訓練用画像は、輝度に基づく画像データ、第1の色相(例えば青色系)に基づく画像データ及び第2の色相(例えば、赤色系)に基づく画像データに変換される。RGBから、YCbCrへの変換は公知の方法により行うことができる。例えば、RGBから、YCbCrへは、国際規格ITU-R BT.601にしたがって変換できる。輝度、第1の色相及び第2の色相の各々に対応する画像データは、それぞれ図52に示すように階調値の行列データとして表すことができる(以下、色調行列データ79y,79cb,79crともいう)。輝度、第1の色相及び第2の色相72Crは、それぞれ0から255階調までの256階調で表される。ここで、輝度、第1の色相、第2の色相に換えて、赤R、緑G、青Bの3原色や、シアンC、マゼンタM、イエローYの色の3原色で訓練用画像を変換してもよい。
For example, convert from RGB color to a format that includes luminance information and hue information. As a format including luminance information and hue information, YUV (YCbCr, YPbPr, YIQ, etc.) and the like can be mentioned. Here, conversion to the YCbCr format will be described as an example. Here, the RGB color training image is converted into image data based on brightness, image data based on a first hue (for example, blue system), and image data based on a second hue (for example, red system). The conversion from RGB to YCbCr can be performed by a known method. For example, from RGB to YCbCr, the international standard ITU-R BT. It can be converted according to 601. The image data corresponding to each of the brightness, the first hue, and the second hue can be represented as matrix data of gradation values as shown in FIG. 52 (hereinafter, also referred to as color tone matrix data 79y, 79cc, 79cr). say). Luminance, first hue and second hue 72Cr are represented by 256 gradations from 0 to 255, respectively. Here, instead of the brightness, the first hue, and the second hue, the training image is converted with the three primary colors of red R, green G, and blue B, and the three primary colors of cyan C, magenta M, and yellow Y. You may.
次に、色調行列79y,79cb,79crに基づいて、画素ごとに、輝度79y、第1の色相79cb、及び第2の色相79crの3つの階調値を組み合わせた色調ベクトルデータ80を生成する。1枚の分析用画像から生成された色調ベクトルデータ80の集合を分析データ81として生成する。
Next, based on the color tone matrices 79y, 79cc, 79cr, the color tone vector data 80 is generated by combining the three gradation values of the luminance 79y, the first hue 79cc, and the second hue 79cr for each pixel. A set of color tone vector data 80 generated from one analysis image is generated as analysis data 81.
分析データ81の生成と訓練データ75の生成は、少なくとも撮像条件や、各画像からニューラルネットワークに入力するベクトルデータの生成条件を同じにすることが好ましい。
For the generation of the analysis data 81 and the training data 75, it is preferable that at least the imaging conditions and the generation conditions of the vector data input from each image to the neural network are the same.
分析データ81を訓練済みの深層学習アルゴリズム60を構成するニューラルネットワーク60の入力層60aに入力する。深層学習アルゴリズムは、分析データ81から特徴量を抽出し、その結果をニューラルネットワーク60の出力層60bから出力する。出力層60bから出力される値は、訓練データとして入力された形態学的な細胞の分類や特徴のそれぞれに、分析用画像に含まれる分析対象の細胞が属する確率である。
The analysis data 81 is input to the input layer 60a of the neural network 60 constituting the trained deep learning algorithm 60. The deep learning algorithm extracts a feature amount from the analysis data 81 and outputs the result from the output layer 60b of the neural network 60. The value output from the output layer 60b is the probability that the cells to be analyzed included in the analysis image belong to each of the morphological cell classifications and characteristics input as training data.
この確率の中で、値が最も高い形態学的分類に、分析用画像に含まれる分析対象の細胞が属すると判断し、その形態学的な細胞種別又は細胞の特徴をと紐付けられたラベル値が出力される。ラベル値そのもの、あるいはラベル値を形態学的な細胞種別又は細胞の特徴の有無を示す情報(例えば用語等)に置き換えたデータが細胞の形態に関する分析結果83として出力される。図52では分析データ81から、識別器によってラベル値「1」が最も可能性が高いラベル値82として出力され、このラベル値に対応する「分葉核好中球」という文字データが、細胞の形態に関する分析結果83として出力される。
A label associated with the morphological cell type or cell characteristics of the cell to be analyzed, which is determined to belong to the morphological classification with the highest value in this probability. The value is output. The label value itself or data in which the label value is replaced with information indicating the presence or absence of morphological cell type or cell characteristics (for example, terms, etc.) is output as the analysis result 83 regarding the cell morphology. In FIG. 52, the label value “1” is output from the analysis data 81 as the most likely label value 82 by the discriminator, and the character data “lobation nucleus neutrophil” corresponding to this label value is the cell data. It is output as the analysis result 83 regarding the morphology.
図52の符号60cは、中間層を示す。
Reference numeral 60c in FIG. 52 indicates an intermediate layer.
[6.その他の形態]
以上、本発明を概要及び特定の実施形態によって説明したが、本発明は上記した概要及び各実施形態に限定されるものではない。 [6. Other forms]
Although the present invention has been described above by outline and specific embodiments, the present invention is not limited to the above outline and each embodiment.
以上、本発明を概要及び特定の実施形態によって説明したが、本発明は上記した概要及び各実施形態に限定されるものではない。 [6. Other forms]
Although the present invention has been described above by outline and specific embodiments, the present invention is not limited to the above outline and each embodiment.
上記の実施形態では、訓練データ生成部101、訓練データ入力部102、アルゴリズム更新部103、分析データ生成部201、分析データ入力部202、及び分析部203の各機能ブロックは、単一のプロセッサ4831及び単一の並列処理プロセッサ4833において実行されているが、これら各機能ブロックは単一のプロセッサ及び並列処理プロセッサにおいて実行される必要は必ずしもなく、複数のプロセッサ及び複数の並列処理プロセッサで分散して実行されてもよい。
In the above embodiment, each functional block of the training data generation unit 101, the training data input unit 102, the algorithm update unit 103, the analysis data generation unit 201, the analysis data input unit 202, and the analysis unit 203 is a single processor 4831. And run on a single parallel processor 4833, but each of these functional blocks does not necessarily have to be run on a single processor and a parallel processor, but is distributed across multiple processors and multiple parallel processors. It may be executed.
上記の実施形態では、図43で説明する各ステップの処理を行うためのプログラムを記憶部4835に予め記録している。これに代えて、プログラムは、例えばDVD-ROMやUSBメモリ等の、コンピュータ読み取り可能であって非一時的な有形の記録媒体98から測定ユニット制御部480にインストールしてもよい。又は、測定ユニット制御部480を通信ネットワーク99と接続し、通信ネットワーク99を介して例えば外部のサーバ(図示せず)からプログラムをダウンロードしてインストールしてもよい。
In the above embodiment, a program for performing the processing of each step described with reference to FIG. 43 is recorded in advance in the storage unit 4835. Alternatively, the program may be installed on the measurement unit control unit 480 from a computer-readable, non-temporary tangible recording medium 98, such as a DVD-ROM or USB memory. Alternatively, the measurement unit control unit 480 may be connected to the communication network 99, and a program may be downloaded and installed from, for example, an external server (not shown) via the communication network 99.
図53に、分析結果の一実施形態を示す。図53では、フローサイトメトリーで測定された生体試料中に含まれる、図4で示したラベル値を付与した細胞種別とそれぞれの細胞数の種別の細胞数が示されている。細胞数の表示に代えて、あるいは細胞数の表示とともに、カウントした細胞数全体における各細胞種別の割合(例えば%)を出力してもよい。細胞数のカウントは、出力された各細胞種別に対応するラベル値の数(同じラベル値の数)を係数することにより求めることができる。また、出力結果には、生体試料中に異常細胞が含まれることを示す警告が出力されてもよい。図53では異常細胞の項に警告として感嘆符が付されている例を示しているがこれに限られない。さらに、各細胞腫の分布をスキャッタグラムそして出力してもよい。スキャッタグラムとして出力する際には、例えば信号強度を取得した際の最も高い値を、例えば、側方蛍光強度を縦軸とし、側方散乱光強度を横軸としてプロットすることができる。
FIG. 53 shows an embodiment of the analysis result. FIG. 53 shows the cell types with the label values shown in FIG. 4 and the cell numbers of each cell number type contained in the biological sample measured by flow cytometry. Instead of displaying the number of cells, or together with the display of the number of cells, the ratio (for example,%) of each cell type to the total number of counted cells may be output. The cell number count can be obtained by coefficienting the number of label values (the number of the same label values) corresponding to each output cell type. In addition, a warning indicating that the biological sample contains abnormal cells may be output in the output result. FIG. 53 shows an example in which an exclamation mark is attached to the section of abnormal cells as a warning, but the present invention is not limited to this. In addition, the distribution of each cell tumor may be scattergrammed and output. When outputting as a scattergram, for example, the highest value when the signal intensity is acquired can be plotted with, for example, the lateral fluorescence intensity on the vertical axis and the lateral scattered light intensity on the horizontal axis.
50 訓練前の深層学習アルゴリズム
60 訓練済み深層学習アルゴリズム
400、400a、500、500a、700 測定ユニット
410 FCM検出部
450 検体吸引部
482、507、3008、6009 A/D変換部
3001、4831、6001、8111 プロセッサ(ホストプロセッサ)
3002、4833、6002、8112 並列処理プロセッサ
4000、4000’、4000'' 細胞分析装置
3200、6200、4836 演算ユニット 50 Pre-traineddeep learning algorithm 60 Trained deep learning algorithm 400, 400a, 500, 500a, 700 Measurement unit 410 FCM detection unit 450 Specimen suction unit 482, 507, 3008, 6009 A / D conversion unit 3001, 4831, 6001, 8111 processor (host processor)
3002, 4833, 6002, 8112Parallel processing processor 4000, 4000', 4000'' Cell analyzer 3200, 6200, 4836 Arithmetic unit
60 訓練済み深層学習アルゴリズム
400、400a、500、500a、700 測定ユニット
410 FCM検出部
450 検体吸引部
482、507、3008、6009 A/D変換部
3001、4831、6001、8111 プロセッサ(ホストプロセッサ)
3002、4833、6002、8112 並列処理プロセッサ
4000、4000’、4000'' 細胞分析装置
3200、6200、4836 演算ユニット 50 Pre-trained
3002, 4833, 6002, 8112
Claims (34)
- ホストプロセッサと、並列処理プロセッサとを含む細胞分析装置において、
前記ホストプロセッサによる制御に基づいて、検体中の複数の細胞の各々に関するデータを取得し、
前記並列処理プロセッサによって、前記データに関する並列処理を実行し、
前記並列処理の結果に基づき、前記複数の細胞の各々について細胞種別に関する情報を生成する、
ことを含む細胞分析方法。 In a cell analyzer that includes a host processor and a parallel processing processor,
Based on the control by the host processor, data about each of the plurality of cells in the sample is acquired, and data is obtained.
The parallel processing processor executes parallel processing on the data,
Based on the result of the parallel processing, information on the cell type is generated for each of the plurality of cells.
Cell analysis methods that include. - 前記並列処理は、人工知能アルゴリズムに従って実行される処理の少なくとも一部である、
請求項1に記載の細胞分析方法。 The parallel processing is at least a part of the processing performed according to the artificial intelligence algorithm.
The cell analysis method according to claim 1. - 前記データを、前記細胞分析装置が備える伝送路を介して前記並列処理プロセッサに伝送する、
請求項1または2に記載の細胞分析方法。 The data is transmitted to the parallel processing processor via a transmission path included in the cell analyzer.
The cell analysis method according to claim 1 or 2. - 前記データを、インターネットまたはイントラネットとは異なる伝送路を介して前記並列処理プロセッサに伝送する、請求項1または2に記載の細胞分析方法。 The cell analysis method according to claim 1 or 2, wherein the data is transmitted to the parallel processing processor via a transmission path different from the Internet or an intranet.
- 前記伝送路は、1ギガビット/秒以上の通信帯域を備える、請求項3に記載の細胞分析方法。 The cell analysis method according to claim 3, wherein the transmission line has a communication band of 1 gigabit / sec or more.
- 前記伝送路はバスであり、前記バスを介して、前記並列処理プロセッサに前記データを伝送する、請求項3に記載の細胞分析方法。 The cell analysis method according to claim 3, wherein the transmission path is a bus, and the data is transmitted to the parallel processing processor via the bus.
- フローサイトメータによって測定された前記複数の細胞に関するアナログ信号から変換された前記データが、前記伝送路を介して前記並列処理プロセッサに伝送される、請求項3から6のいずれか1項に記載の細胞分析方法。 The one according to any one of claims 3 to 6, wherein the data converted from the analog signals relating to the plurality of cells measured by the flow cytometer is transmitted to the parallel processing processor via the transmission path. Cell analysis method.
- 前記情報は、前記細胞種別を識別するための識別子を含む、
請求項1から7のいずれか1項に記載の細胞分析方法。 The information includes an identifier for identifying the cell type.
The cell analysis method according to any one of claims 1 to 7. - 前記情報は、前記細胞が複数の前記細胞種別の各々に属する確率を含む、
請求項1から8のいずれか1項に記載の細胞分析方法。 The information includes the probability that the cell belongs to each of the plurality of cell types.
The cell analysis method according to any one of claims 1 to 8. - 前記細胞種別を識別するための識別子を含む分析結果を、当該分析結果の分析を行う処理ユニットに送信する、
請求項1から9のいずれか1項に記載の細胞分析方法。 An analysis result including an identifier for identifying the cell type is transmitted to a processing unit that analyzes the analysis result.
The cell analysis method according to any one of claims 1 to 9. - 前記細胞が複数の前記細胞種別の各々に属する確率を含む分析結果を、当該分析結果の分析を行う処理ユニットに送信する、
請求項1から10のいずれか1項に記載の細胞分析方法。 An analysis result including the probability that the cell belongs to each of the plurality of cell types is transmitted to a processing unit that analyzes the analysis result.
The cell analysis method according to any one of claims 1 to 10. - 前記並列処理プロセッサは、前記並列処理として、前記データの分析に関する複数の演算処理を並列に実行する、
請求項1から11のいずれか1項に記載の細胞分析方法。 As the parallel processing, the parallel processing processor executes a plurality of arithmetic processes related to the analysis of the data in parallel.
The cell analysis method according to any one of claims 1 to 11. - 前記並列処理プロセッサは、
前記データの分析に関する演算処理を実行可能な演算ユニットを複数有し、
前記並列処理として、前記演算ユニットの各々による前記演算処理を並列に実行する、
請求項1から12のいずれか1項に記載の細胞分析方法。 The parallel processing processor
It has a plurality of arithmetic units capable of executing arithmetic processing related to the analysis of the data, and has a plurality of arithmetic units.
As the parallel processing, the arithmetic processing by each of the arithmetic units is executed in parallel.
The cell analysis method according to any one of claims 1 to 12. - 前記人工知能アルゴリズムは、深層学習アルゴリズムである、
請求項2、または、請求項2を引用する請求項3から13のいずれか1項に記載の細胞分析方法。 The artificial intelligence algorithm is a deep learning algorithm.
The cell analysis method according to claim 2, or any one of claims 3 to 13 quoting claim 2. - 前記並列処理プロセッサは、前記並列処理として、前記データの特徴を抽出するためのフィルタリング処理を並列に実行する、
請求項1から14のいずれか1項に記載の細胞分析方法。 As the parallel processing, the parallel processing processor executes a filtering process for extracting the characteristics of the data in parallel.
The cell analysis method according to any one of claims 1 to 14. - 前記人工知能アルゴリズムは、深層学習アルゴリズムであり、
前記並列処理プロセッサは、前記並列処理として、前記深層学習アルゴリズムにおける畳み込み層における複数の演算処理を並列に実行する、
請求項2、または、請求項2を引用する請求項3から15のいずれか1項に記載の細胞分析方法。 The artificial intelligence algorithm is a deep learning algorithm and is
As the parallel processing, the parallel processing processor executes a plurality of arithmetic processes in the convolution layer in the deep learning algorithm in parallel.
The cell analysis method according to claim 2, or any one of claims 3 to 15 quoting claim 2. - 前記並列処理プロセッサは、単一の命令に従って前記並列処理を実行する、
請求項1から16のいずれか1項に記載の細胞分析方法。 The parallel processing processor executes the parallel processing according to a single instruction.
The cell analysis method according to any one of claims 1 to 16. - 前記データは、前記細胞に光を照射することにより検出される信号に基づくデータである、
請求項1から17のいずれか1項に記載の細胞分析方法。 The data is data based on a signal detected by irradiating the cells with light.
The cell analysis method according to any one of claims 1 to 17. - 前記細胞を測定して得られる信号を所定のレートでサンプリングしたサンプリングデータを前記データとして前記並列処理プロセッサに入力し、
前記並列処理プロセッサは、前記並列処理を実行することにより前記サンプリングデータを分析する、
請求項1から18のいずれか1項に記載の細胞分析方法。 The sampling data obtained by sampling the signal obtained by measuring the cells at a predetermined rate is input to the parallel processing processor as the data.
The parallel processing processor analyzes the sampling data by executing the parallel processing.
The cell analysis method according to any one of claims 1 to 18. - 前記細胞に光を照射して取得された画像データを前記データとして前記並列処理プロセッサに入力し、
前記並列処理プロセッサは、前記並列処理を実行することにより前記画像データを分析する、
請求項1から18のいずれか1項に記載の細胞分析方法。 The image data acquired by irradiating the cells with light is input to the parallel processing processor as the data.
The parallel processing processor analyzes the image data by executing the parallel processing.
The cell analysis method according to any one of claims 1 to 18. - 前記並列処理プロセッサは、前記データの各々について複数の行列演算を実行する、
請求項1から20のいずれか1項に記載の細胞分析方法。 The parallel processing processor performs a plurality of matrix operations on each of the data.
The cell analysis method according to any one of claims 1 to 20. - 前記並列処理プロセッサは、前記データの各々について少なくとも100の行列演算を実行する、
請求項1から21のいずれか1項に記載の細胞分析方法。 The parallel processing processor performs at least 100 matrix operations on each of the data.
The cell analysis method according to any one of claims 1 to 21. - 前記並列処理プロセッサは、前記データの各々について少なくとも1000の行列演算を実行する、
請求項1から22のいずれか1項に記載の細胞分析方法。 The parallel processing processor performs at least 1000 matrix operations on each of the data.
The cell analysis method according to any one of claims 1 to 22. - 前記並列処理プロセッサは、少なくとも100個の前記細胞の各々に対応する前記データを分析する、
請求項1から23のいずれか1項に記載の細胞分析方法。 The parallel processing processor analyzes the data corresponding to each of at least 100 cells.
The cell analysis method according to any one of claims 1 to 23. - 前記並列処理プロセッサは、少なくとも1000個の前記細胞の各々に対応する前記データを分析する、
請求項1から24のいずれか1項に記載の細胞分析方法。 The parallel processing processor analyzes the data corresponding to each of at least 1000 cells.
The cell analysis method according to any one of claims 1 to 24. - 前記並列処理プロセッサは、各々が、少なくとも1ギガバイトの容量を有する前記データを分析する、
請求項1から25のいずれか1項に記載の細胞分析方法。 The parallel processing processor analyzes the data, each having a capacity of at least 1 gigabyte.
The cell analysis method according to any one of claims 1 to 25. - 前記並列処理プロセッサは、
前記データの分析に関する演算処理を実行可能な演算ユニットを少なくとも10個有し、
前記並列処理として、前記演算ユニットの各々による前記演算処理を並列に実行する、
請求項1から26のいずれか1項に記載の細胞分析方法。 The parallel processing processor
It has at least 10 arithmetic units capable of performing arithmetic processing related to the analysis of the data.
As the parallel processing, the arithmetic processing by each of the arithmetic units is executed in parallel.
The cell analysis method according to any one of claims 1 to 26. - 前記並列処理プロセッサは、
前記データの分析に関する演算処理を実行可能な演算ユニットを少なくとも100個有し、
前記並列処理として、前記演算ユニットの各々による前記演算処理を並列に実行する、
請求項1から27のいずれか1項に記載の細胞分析方法。 The parallel processing processor
It has at least 100 arithmetic units capable of performing arithmetic processing related to the analysis of the data.
As the parallel processing, the arithmetic processing by each of the arithmetic units is executed in parallel.
The cell analysis method according to any one of claims 1 to 27. - 前記並列処理プロセッサは、
前記データの分析に関する演算処理を実行可能な演算ユニットを少なくとも1000個有し、
前記並列処理として、前記演算ユニットの各々による前記演算処理を並列に実行する、
請求項1から28のいずれか1項に記載の細胞分析方法。 The parallel processing processor
It has at least 1000 arithmetic units capable of performing arithmetic processing related to the analysis of the data.
As the parallel processing, the arithmetic processing by each of the arithmetic units is executed in parallel.
The cell analysis method according to any one of claims 1 to 28. - 前記並列処理プロセッサは、少なくとも1ギガバイトの容量を有するメモリから読み出された前記データを入力とし、前記並列処理を実行する、
請求項1から29のいずれか1項に記載の細胞分析方法。 The parallel processing processor takes the data read from a memory having a capacity of at least 1 gigabyte as an input and executes the parallel processing.
The cell analysis method according to any one of claims 1 to 29. - 検体中の細胞に関するデータは、細胞から得られる複数種類の信号に基づくデータの組み合わせである、請求項1から30のいずれか1項に記載の細胞分析方法。 The cell analysis method according to any one of claims 1 to 30, wherein the data regarding the cells in the sample is a combination of data based on a plurality of types of signals obtained from the cells.
- 測定ユニットによって細胞を測定し、
前記測定ユニットとインターネットまたはイントラネットを介さずに接続された並列処理プロセッサによって、前記測定に基づく細胞に関するデータの並列処理を実行し、
前記並列処理の結果に基づき、前記細胞の細胞種別に関する情報を生成する、
ことを含む細胞分析方法。 Measure cells with a measuring unit,
A parallel processing processor connected to the measurement unit via the Internet or an intranet executes parallel processing of data related to cells based on the measurement.
Based on the result of the parallel processing, information on the cell type of the cell is generated.
Cell analysis methods that include. - 細胞分析装置に搭載された測定ユニットによって検体を吸引し、
吸引された前記検体中の細胞に関するデータを生成し、
前記データに関する並列処理を、前記細胞分析装置に搭載された並列処理プロセッサで実行し、
前記並列処理プロセッサが実行する前記並列処理の結果に基づき、前記細胞の細胞種別に関する情報を生成する、
ことを含む細胞分析方法。 The sample is aspirated by the measurement unit mounted on the cell analyzer.
Generates data about the cells in the aspirated sample and
The parallel processing related to the data is executed by the parallel processing processor mounted on the cell analyzer, and the parallel processing is performed.
Generates information about the cell type of the cell based on the result of the parallel processing performed by the parallel processing processor.
Cell analysis methods that include. - 検体に含まれる複数の細胞を測定する測定ユニットと、
前記複数の細胞の分析に関する情報処理を行うプロセッサと、
並列処理プロセッサと、を備え、
前記測定ユニットは、前記複数の細胞の各々に関するデータを取得し、
前記並列処理プロセッサは、前記データに関する並列処理を実行し、
前記プロセッサは、前記並列処理の結果に基づいて生成された、前記複数の細胞の各々の細胞種別に関する情報を処理する、
細胞分析装置。 A measurement unit that measures multiple cells contained in a sample,
A processor that processes information related to the analysis of a plurality of cells,
Equipped with a parallel processing processor,
The measurement unit acquires data for each of the plurality of cells and obtains data.
The parallel processing processor executes parallel processing on the data and performs parallel processing.
The processor processes information about each cell type of the plurality of cells generated based on the result of the parallel processing.
Cell analyzer.
Priority Applications (3)
| Application Number | Priority Date | Filing Date | Title |
|---|---|---|---|
| EP21869154.1A EP4215901A1 (en) | 2020-09-18 | 2021-08-30 | Cell analysis method and cell analysis device |
| CN202180049471.XA CN115867637A (en) | 2020-09-18 | 2021-08-30 | Cell analysis method and cell analysis device |
| US18/185,589 US20230314300A1 (en) | 2020-09-18 | 2023-03-17 | Cell analysis method and cell analyzer |
Applications Claiming Priority (2)
| Application Number | Priority Date | Filing Date | Title |
|---|---|---|---|
| JP2020-157930 | 2020-09-18 | ||
| JP2020157930A JP2022051447A (en) | 2020-09-18 | 2020-09-18 | Cell analysis method and cell analysis device |
Related Child Applications (1)
| Application Number | Title | Priority Date | Filing Date |
|---|---|---|---|
| US18/185,589 Continuation US20230314300A1 (en) | 2020-09-18 | 2023-03-17 | Cell analysis method and cell analyzer |
Publications (1)
| Publication Number | Publication Date |
|---|---|
| WO2022059467A1 true WO2022059467A1 (en) | 2022-03-24 |
Family
ID=80776154
Family Applications (1)
| Application Number | Title | Priority Date | Filing Date |
|---|---|---|---|
| PCT/JP2021/031651 WO2022059467A1 (en) | 2020-09-18 | 2021-08-30 | Cell analysis method and cell analysis device |
Country Status (5)
| Country | Link |
|---|---|
| US (1) | US20230314300A1 (en) |
| EP (1) | EP4215901A1 (en) |
| JP (1) | JP2022051447A (en) |
| CN (1) | CN115867637A (en) |
| WO (1) | WO2022059467A1 (en) |
Citations (8)
| Publication number | Priority date | Publication date | Assignee | Title |
|---|---|---|---|---|
| JPH0743307A (en) * | 1993-07-26 | 1995-02-14 | Toa Medical Electronics Co Ltd | Imaging flow sight meter |
| JPH0886736A (en) * | 1994-09-19 | 1996-04-02 | Hitachi Ltd | Method for analyzing particle image |
| US5891733A (en) | 1994-10-20 | 1999-04-06 | Toa Medical Electronics Co., Ltd. | Reagent for analyzing solid components in urine and method for analyzing solid components by employing the same |
| EP1136563A2 (en) | 2000-03-22 | 2001-09-26 | Sysmex Corporation | Method of staining, and detecting and counting bacteria |
| JP2003512605A (en) * | 1999-10-21 | 2003-04-02 | サイトメーション, インコーポレイテッド | Temporary dynamic flow cytometer analysis system |
| US7309581B2 (en) | 2000-11-01 | 2007-12-18 | Sysmex Corporation | Method of staining, detection and counting bacteria, and a diluent for bacterial stain |
| JP2012519848A (en) | 2009-03-04 | 2012-08-30 | ベックマン コールター, インコーポレイテッド | Device-to-device method and system for cell population identification |
| JP6685057B1 (en) * | 2019-07-30 | 2020-04-22 | 株式会社Cybo | Imaging flow cytometer, sorting method, and calibration method |
-
2020
- 2020-09-18 JP JP2020157930A patent/JP2022051447A/en active Pending
-
2021
- 2021-08-30 WO PCT/JP2021/031651 patent/WO2022059467A1/en active Application Filing
- 2021-08-30 EP EP21869154.1A patent/EP4215901A1/en active Pending
- 2021-08-30 CN CN202180049471.XA patent/CN115867637A/en active Pending
-
2023
- 2023-03-17 US US18/185,589 patent/US20230314300A1/en active Pending
Patent Citations (8)
| Publication number | Priority date | Publication date | Assignee | Title |
|---|---|---|---|---|
| JPH0743307A (en) * | 1993-07-26 | 1995-02-14 | Toa Medical Electronics Co Ltd | Imaging flow sight meter |
| JPH0886736A (en) * | 1994-09-19 | 1996-04-02 | Hitachi Ltd | Method for analyzing particle image |
| US5891733A (en) | 1994-10-20 | 1999-04-06 | Toa Medical Electronics Co., Ltd. | Reagent for analyzing solid components in urine and method for analyzing solid components by employing the same |
| JP2003512605A (en) * | 1999-10-21 | 2003-04-02 | サイトメーション, インコーポレイテッド | Temporary dynamic flow cytometer analysis system |
| EP1136563A2 (en) | 2000-03-22 | 2001-09-26 | Sysmex Corporation | Method of staining, and detecting and counting bacteria |
| US7309581B2 (en) | 2000-11-01 | 2007-12-18 | Sysmex Corporation | Method of staining, detection and counting bacteria, and a diluent for bacterial stain |
| JP2012519848A (en) | 2009-03-04 | 2012-08-30 | ベックマン コールター, インコーポレイテッド | Device-to-device method and system for cell population identification |
| JP6685057B1 (en) * | 2019-07-30 | 2020-04-22 | 株式会社Cybo | Imaging flow cytometer, sorting method, and calibration method |
Also Published As
| Publication number | Publication date |
|---|---|
| US20230314300A1 (en) | 2023-10-05 |
| EP4215901A1 (en) | 2023-07-26 |
| JP2022051447A (en) | 2022-03-31 |
| CN115867637A (en) | 2023-03-28 |
Similar Documents
| Publication | Publication Date | Title |
|---|---|---|
| US10365203B2 (en) | Method and apparatus for automated whole blood sample analyses from microscopy images | |
| JP6942148B2 (en) | Performing optical measurements on the sample | |
| JP7352365B2 (en) | Cell analysis method, deep learning algorithm training method, cell analysis device, deep learning algorithm training device, cell analysis program, and deep learning algorithm training program | |
| US8630833B2 (en) | System, method, and article for detecting abnormal cells using multi-dimensional analysis | |
| JP2020180954A (en) | Method, device and computer program for assisting disease analysis, and method, device and program for training computer algorithm | |
| JP2016511424A (en) | Portable blood counting monitor | |
| WO2024001155A1 (en) | Blood cell analysis method and system based on microscopic magnification digital image | |
| EP3382393A1 (en) | Device and method to select an antibody cocktail reagent | |
| US20230221238A1 (en) | Cell analysis method and cell analyzer | |
| CN114729953A (en) | Sample analysis system and method, cell image analyzer, and storage medium | |
| CN114450589A (en) | Method for analyzing red blood cells in blood sample and blood analysis system | |
| WO2022059467A1 (en) | Cell analysis method and cell analysis device | |
| EP4246123A1 (en) | Specimen analyzer, specimen analysis method, and program | |
| JP2023137001A (en) | Specimen analyzer, specimen analysis method and program | |
| JP2023137000A (en) | Specimen analyzer, specimen analysis method and program | |
| US20220291199A1 (en) | Analysis method and analyzer | |
| CN114152557B (en) | Image analysis-based blood cell counting method and system | |
| JP2022140144A (en) | Method for analysis and analyzer | |
| JP2022140145A (en) | Method for analysis and analyzer | |
| JP2022140146A (en) | Method for analysis and analyzer | |
| CN114152557A (en) | Image analysis based blood cell counting method and system |
Legal Events
| Date | Code | Title | Description |
|---|---|---|---|
| 121 | Ep: the epo has been informed by wipo that ep was designated in this application |
Ref document number: 21869154 Country of ref document: EP Kind code of ref document: A1 |
|
| WWE | Wipo information: entry into national phase |
Ref document number: 2023106372 Country of ref document: RU |
|
| NENP | Non-entry into the national phase |
Ref country code: DE |
|
| ENP | Entry into the national phase |
Ref document number: 2021869154 Country of ref document: EP Effective date: 20230418 |